4.1.1. Sample Characteristics
Table 1 presents the demographic and behavioral characteristics of the respondents involved in this study. The sample consists of 400 participants with diverse demographic characteristics within the targeted kombucha consumer group. In terms of gender distribution, the sample is relatively balanced, with 55% male and 45% female respondents. This distribution suggests that both male and female consumers are actively engaged in the consumption of health-oriented beverages. Regarding age, many respondents fall within the 26–33 age group (40%), followed by those aged 18–25 (36%) and 34–40 (24%). This indicates that the sample is predominantly composed of young adults, a segment known for its openness to functional and health-related products such as kombucha.
In terms of geographical distribution, respondents were drawn from three provinces in Northern Thailand, namely Chiang Mai (37%), Chiang Rai (34%), and Lamphun (29%). This distribution reflects the geographical composition of the study sample across the three selected provinces. With respect to income levels, the largest proportion of respondents (36%) reported a monthly income between 15,000 and 25,000 baht, followed by those earning less than 15,000 baht (30%), 25,000–35,000 baht (22%), and above 35,000 baht (12%). This indicates that the sample primarily consists of middle- to lower-middle-income consumers, which is consistent with the target market for accessible functional beverages. In terms of weekly expenditure on healthy beverages, nearly half of the respondents (47%) reported spending between 500 and 1000 baht per week, while 36% spend less than 500 baht. A smaller proportion reported higher spending levels, with 12% spending between 1000 and 1500 baht and only 5% exceeding 1500 baht. These findings suggest that while consumers are willing to allocate a budget for health-related beverages, spending remains moderate. Regarding purchasing frequency, many respondents reported consuming healthy beverages a few times a week (40%) or weekly (34%), while 12% reported daily consumption and 14% reported occasional consumption. This indicates a relatively high level of engagement with health-oriented beverage products.
Finally, respondents’ dietary behavior reflects a strong orientation toward health-conscious consumption. The most common dietary pattern is a low-sugar diet (37%), followed by a low-calorie diet (29%), probiotic-rich diet (23%), and high-fiber diet (11%). This distribution aligns closely with the positioning of kombucha as a functional beverage associated with low sugar content, probiotics, and health benefits. Overall, the sample characteristics indicate that the respondents are largely health-conscious, moderately spending, and regularly engaged in healthy beverage consumption. These attributes make them a suitable and relevant population for examining purchase intention toward kombucha products.
4.1.2. Measurement Model Assessment
To ensure the robustness of the measurement model, reliability and validity were assessed prior to structural model evaluation. Indicator reliability was first examined using outer loadings. As shown in
Table 2, all measurement items exhibit loadings above the recommended threshold of 0.70, indicating that each indicator adequately represents its corresponding latent construct (
Hair et al., 2019). This suggests that the observed variables are strong reflections of the underlying constructs. Internal consistency reliability was evaluated using Cronbach’s alpha, rho_A, and composite reliability (CR). All constructs reported Cronbach’s alpha values ranging from 0.718 to 0.847, exceeding the acceptable threshold of 0.70. Similarly, rho_A values ranged from 0.724 to 0.848, exceeding the recommended threshold of 0.70. Composite reliability values ranged from 0.853 to 0.903, which fall within the recommended range of 0.70 to 0.90 (
Hair et al., 2019), indicating a high level of internal consistency across all constructs. Convergent validity was assessed using the average variance extracted (AVE). As presented in
Table 2, all AVE values exceed the recommended threshold of 0.50 (
Fornell & Larcker, 1981), indicating that each construct explains more than half of the variance of its indicators. This confirms adequate convergent validity.
Potential common method bias was further assessed using the full-collinearity approach proposed by
Kock (
2015). As shown in
Table 2, the full-collinearity VIF values ranged from 2.034 to 2.642, with all values below the conservative threshold of 3.3. These results indicate that pathological collinearity was not evident and suggest that common method bias was unlikely to substantially affect the estimated relationships in the model.
Discriminant validity was examined using both the Fornell–Larcker criterion and the heterotrait–monotrait ratio (HTMT). As shown in
Table 3, the square root of AVE for each construct is greater than its correlations with other constructs, satisfying the Fornell–Larcker criterion (
Fornell & Larcker, 1981).
Furthermore, the HTMT values presented in
Table 4 are all below the recommended threshold of 0.90 (
Henseler et al., 2015), indicating acceptable discriminant validity. These results provide empirical support for the discriminant validity of the constructs, indicating that consumer belief, health consciousness, lifestyle, attitude, and purchase intention capture empirically distinguishable concepts despite some shared health-related content in their measurement items. Overall, the measurement model demonstrates satisfactory levels of reliability, convergent validity, and discriminant validity. Therefore, the model is deemed suitable for subsequent structural model analysis.
Particular attention was given to the discriminant validity of health consciousness because its measurement items were contextualized to kombucha consumption and could therefore exhibit conceptual proximity to consumer belief and attitude. Nevertheless, the discriminant validity assessment indicated that health consciousness remained empirically distinguishable from the other constructs based on the Fornell–Larcker criterion and HTMT results. Thus, although conceptual proximity arising from the context-specific item wording cannot be completely excluded, the measurement model provided empirical evidence of construct distinctiveness within the present dataset.
4.1.3. Hypothesis Testing Results
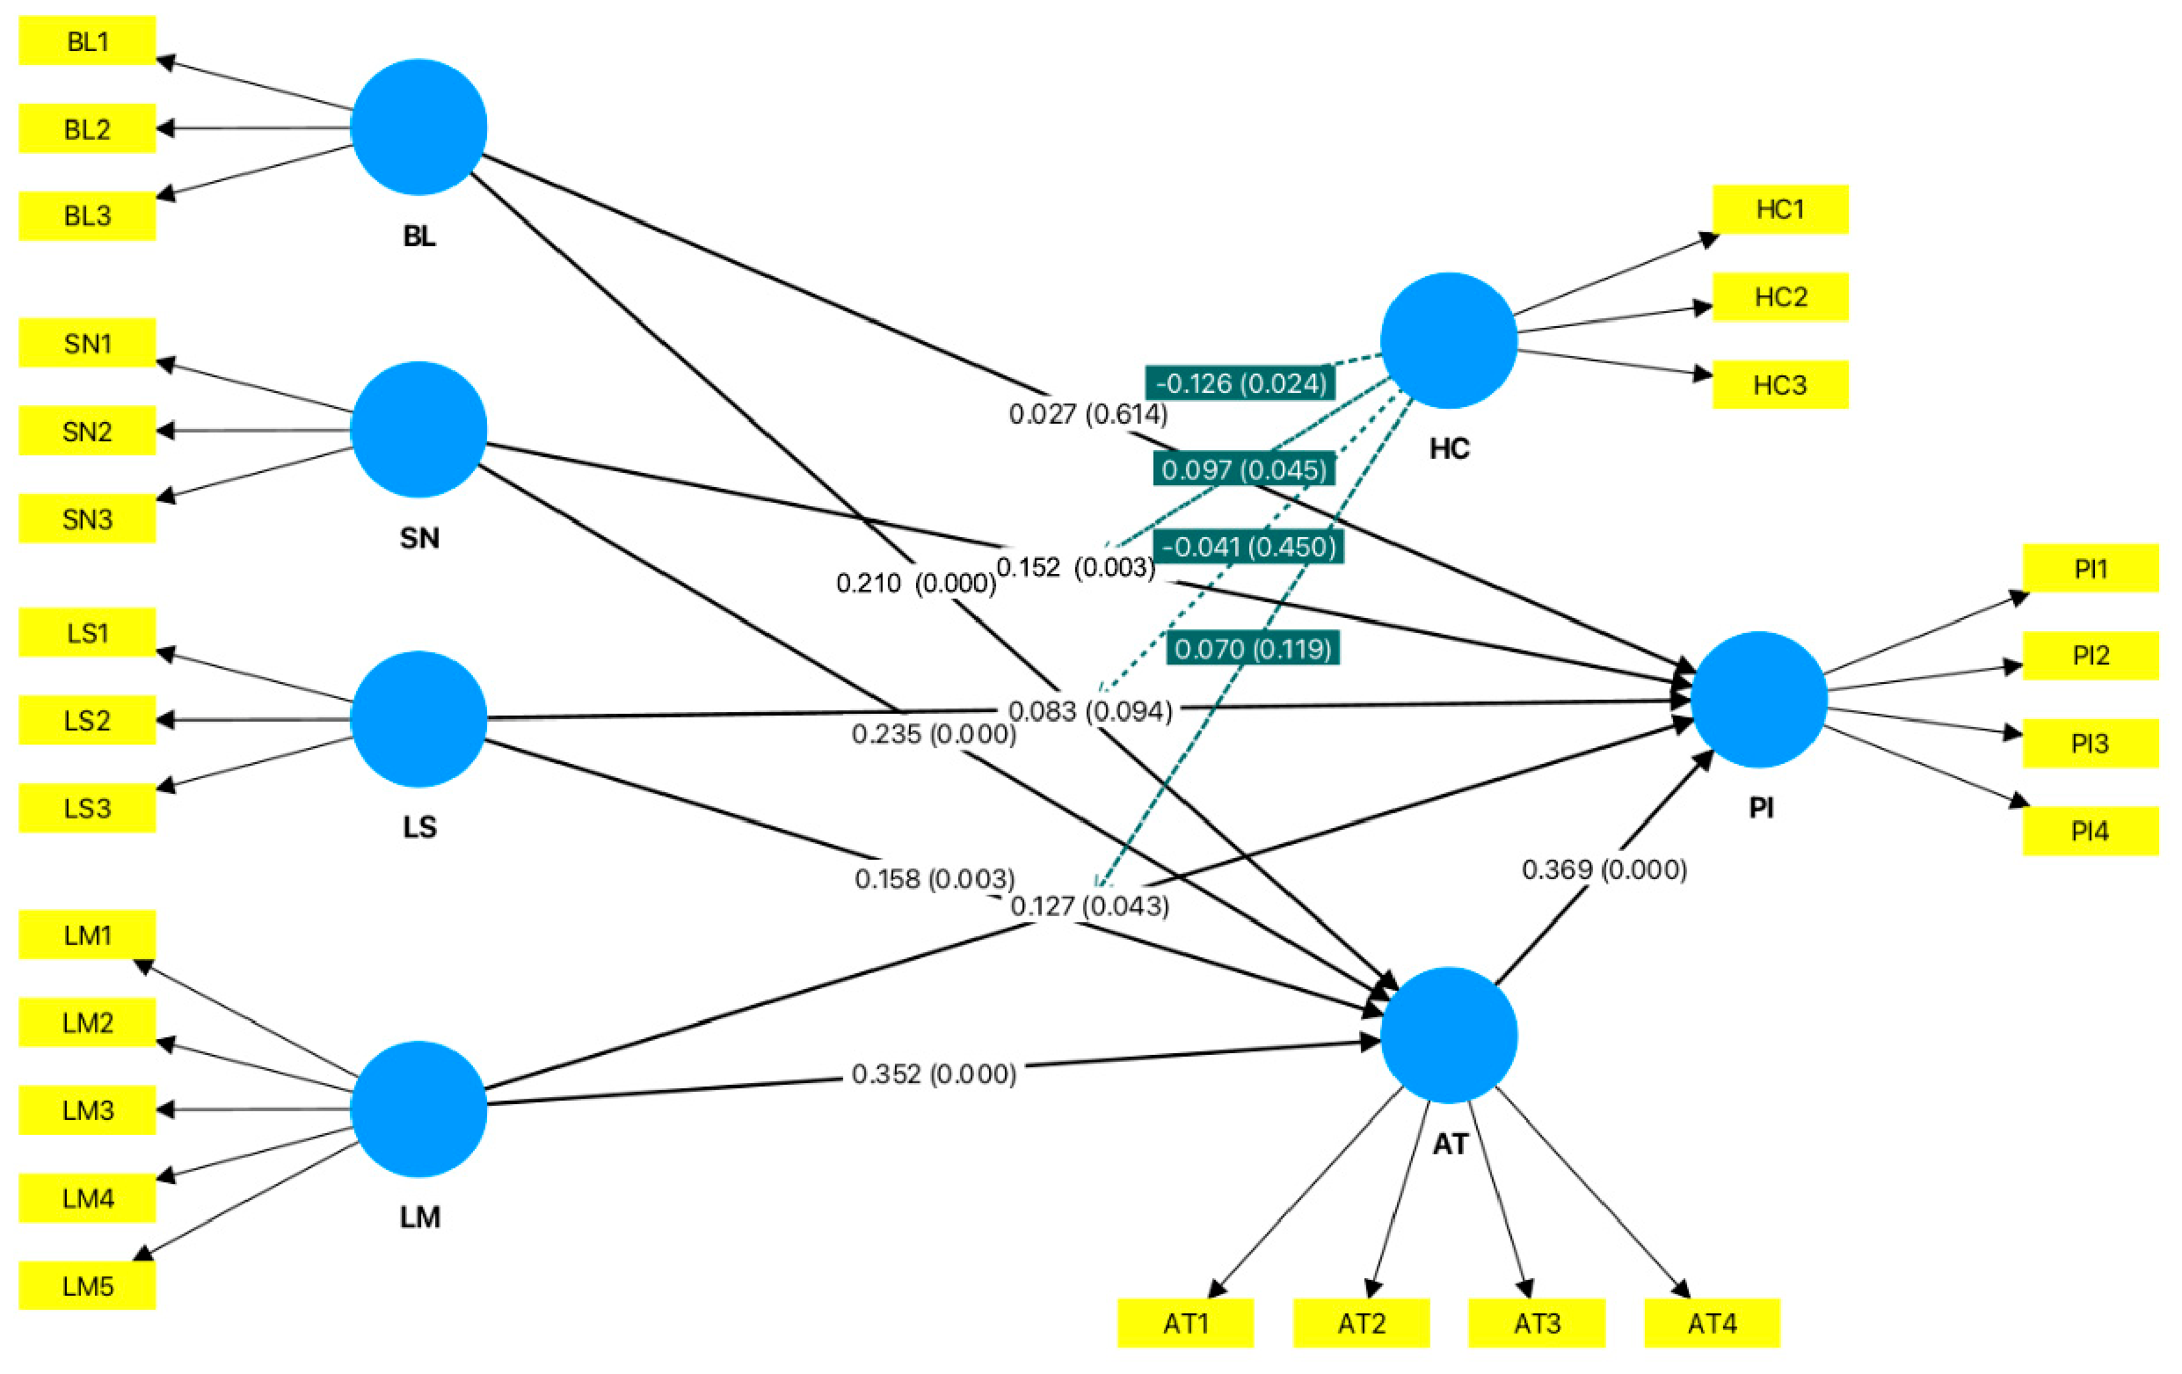
Lastly, we proceeded to assess the proposed hypotheses. The structural model results, as shown in
Figure 2 and
Table 5,
Table 6 and
Table 7, illustrate the relationships between the constructs.
Figure 2 presents the structural model, while
Table 5,
Table 6 and
Table 7 report the detailed results of the mediating, moderating, and direct effects, respectively. In this sense, consumer attitude (AT) showed a strong and significant positive relationship with purchase intention (PI) (H9) (β = 0.369,
p < 0.001). This result indicates that attitude is the strongest predictor of purchase intention in this model, consistent with the Theory of Planned Behavior (
Ajzen, 1991). Among the antecedent variables, subjective norm (SN) (β = 0.152,
p = 0.003), health consciousness (HC) (β = 0.206,
p = 0.004), and last-mile delivery (LM) (β = 0.127,
p = 0.043) showed significant positive relationships with purchase intention. In contrast, belief (BL) (β = 0.027,
p = 0.614) and lifestyle (LS) (β = 0.083,
p = 0.094) do not have significant direct effects on purchase intention.
Consumer attitude (AT) was found to have a strong and significant positive effect on purchase intention (PI) (H9) (β = 0.369, p < 0.001). In addition to the hypothesized indirect effects, the structural model retained direct paths from the stimulus variables to purchase intention to assess whether consumer attitude functions as a partial mediator. Among these direct paths, subjective norm (SN) (β = 0.152, p = 0.003) and last-mile delivery (LM) (β = 0.127, p = 0.043) had significant positive effects on purchase intention, whereas consumer belief (BL) (β = 0.027, p = 0.614) and lifestyle (LS) (β = 0.083, p = 0.094) did not show significant direct effects.
The mediating effects of consumer attitude further support this interpretation. As shown in
Table 5, all mediating hypotheses (H1–H4) are supported, as the 95% bootstrap confidence intervals for all indirect effects do not include zero. Consumer attitude significantly mediates the relationships between belief and purchase intention (H1: β = 0.077, 95% CI [0.031, 0.130],
p = 0.002), subjective norm and purchase intention (H2: β = 0.086, 95% CI [0.037, 0.144],
p = 0.002), lifestyle and purchase intention (H3: β = 0.058, 95% CI [0.016, 0.108],
p = 0.013), and last-mile delivery and purchase intention (H4: β = 0.130, 95% CI [0.068, 0.195],
p < 0.001). Based on the corresponding direct and indirect effects, H1 and H3 demonstrate indirect-only mediation, whereas H2 and H4 demonstrate complementary mediation. These findings indicate that belief and lifestyle influence purchase intention primarily through consumer attitude, while subjective norm and last-mile delivery influence purchase intention through both direct and attitude-mediated pathways.
Regarding the moderating effects, health consciousness (HC) showed limited evidence of moderation across the proposed relationships. As shown in
Table 6, HC negatively moderated the relationship between belief and purchase intention (H5: β = −0.126, 95% CI [−0.241, −0.020],
p = 0.024). Although this interaction was statistically significant, its negative direction was opposite to the theoretically expected strengthening effect; therefore, H5 was not supported. For the relationship between subjective norm and purchase intention, the interaction coefficient was positive (H6: β = 0.097, 95% CI [−0.007, 0.183],
p = 0.045); however, the 95% bootstrap confidence interval included zero. Therefore, H6 was not supported based on the bootstrap confidence interval criterion. The moderating effects of HC on lifestyle (H7: β = −0.041, 95% CI [−0.138, 0.074],
p = 0.450) and last-mile delivery (H8: β = 0.070, 95% CI [−0.019, 0.157],
p = 0.119) were also not supported. Overall, these findings indicate that the hypothesized moderating role of health consciousness was not consistently supported across the proposed relationships.
As shown in
Table 7, consumer attitude has a significant positive direct effect on purchase intention (H9: β = 0.369, 95% CI [0.223, 0.498],
p < 0.001), supporting H9. Subjective norm (β = 0.152, 95% CI [0.051, 0.250],
p = 0.003), health consciousness (β = 0.206, 95% CI [0.065, 0.346],
p = 0.004), and last-mile delivery (β = 0.127, 95% CI [0.010, 0.257],
p = 0.043) also show significant positive direct effects on purchase intention. In contrast, the direct effects of belief (β = 0.027, 95% CI [−0.075, 0.139],
p = 0.614) and lifestyle (β = 0.083, 95% CI [−0.013, 0.183],
p = 0.094) are not statistically significant.
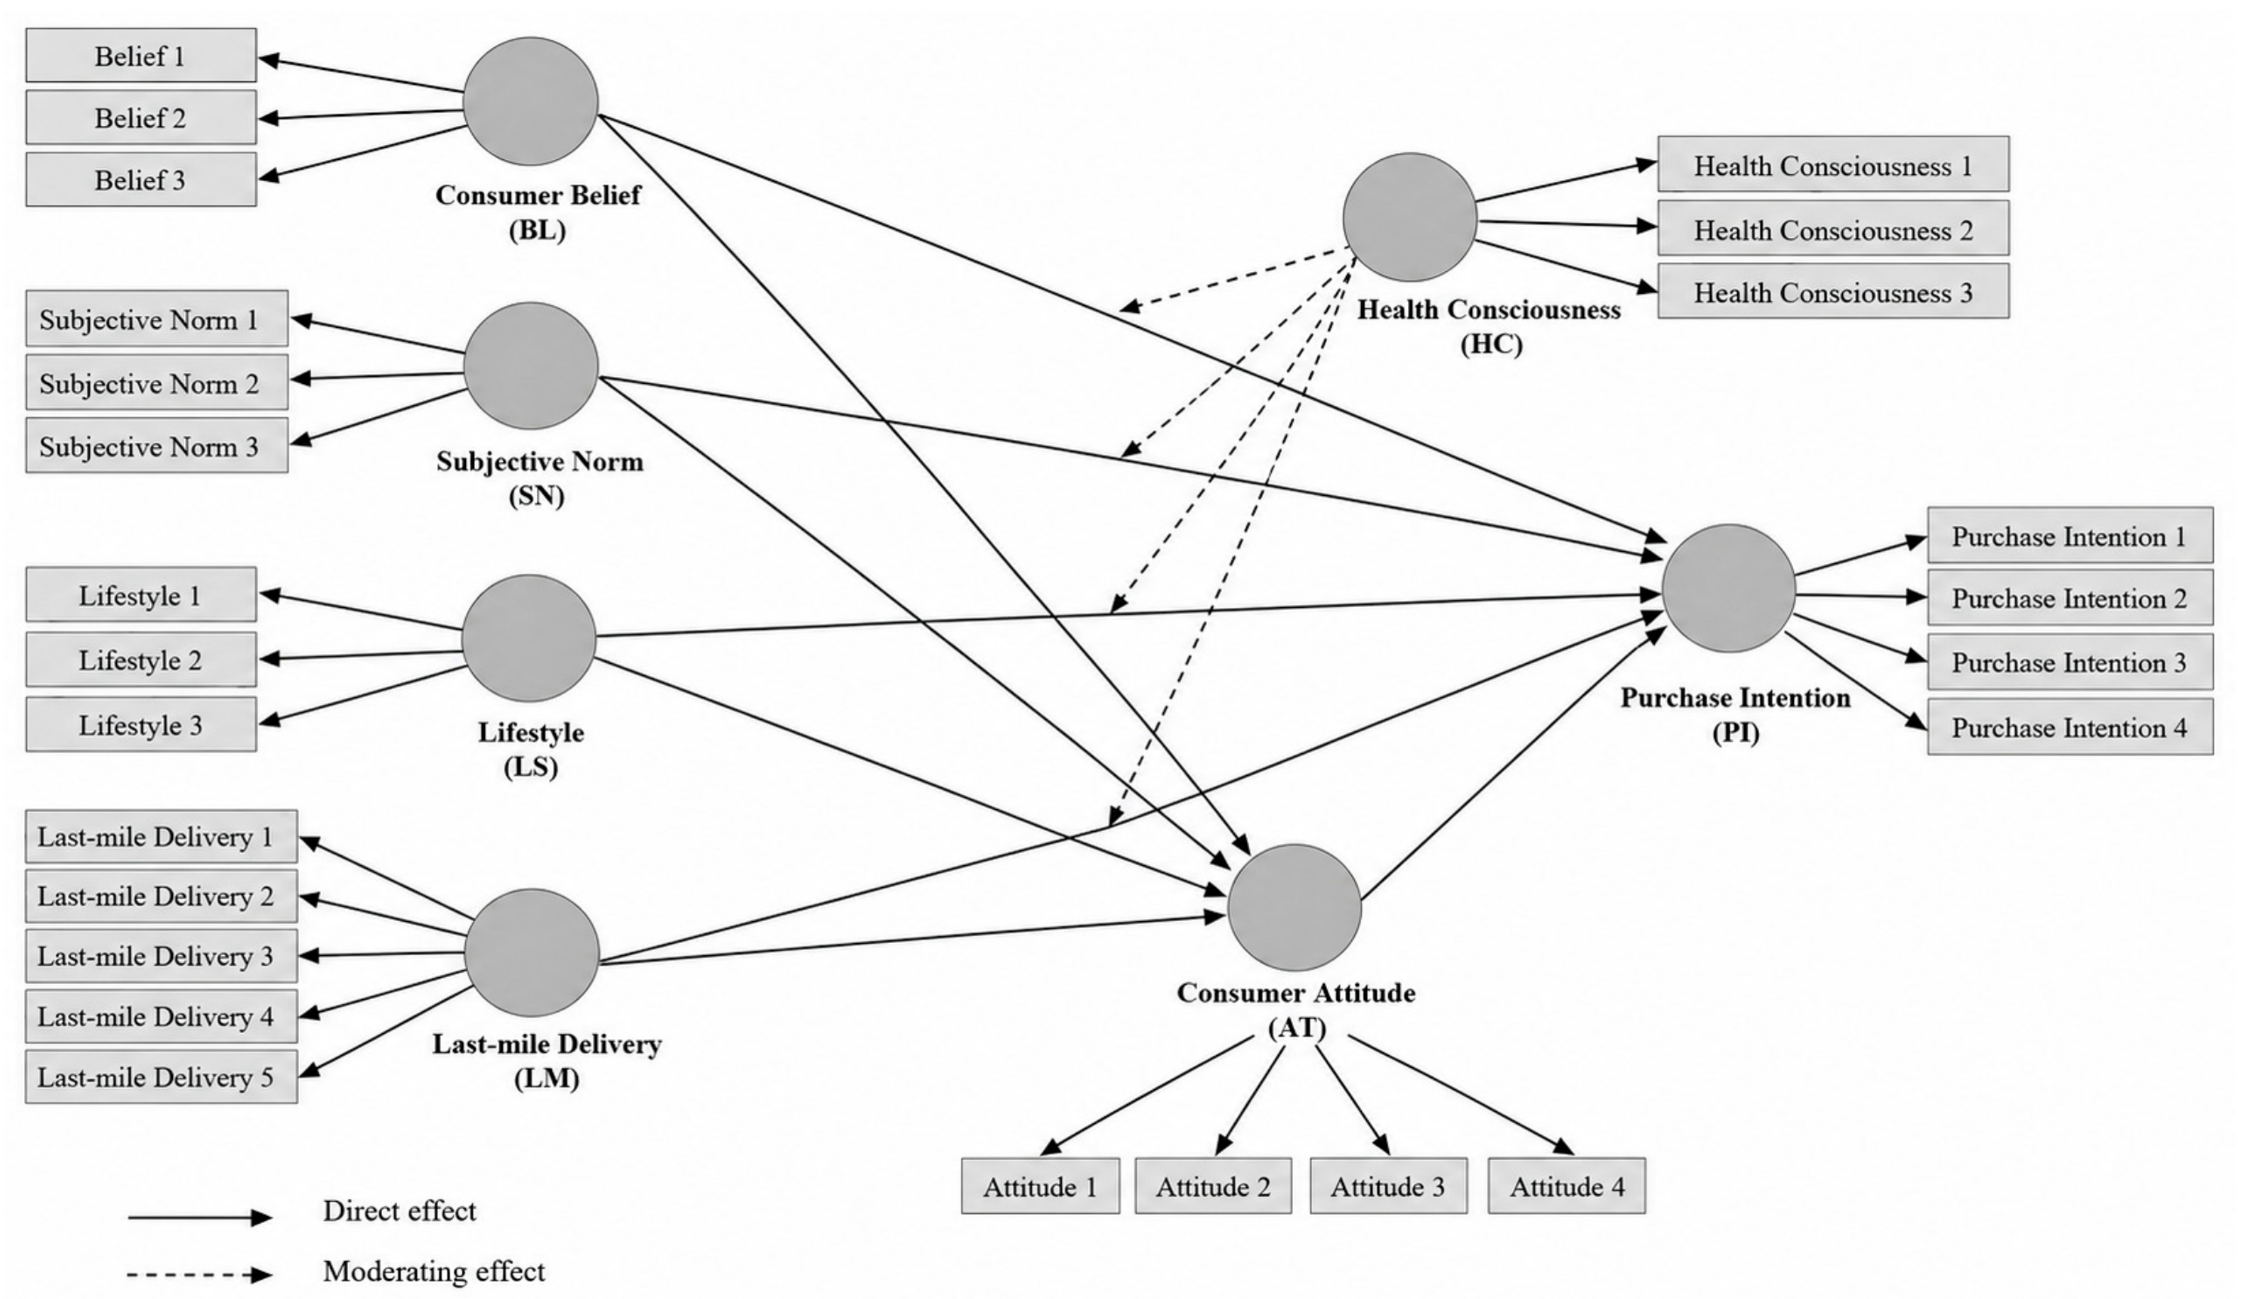
Overall, the results demonstrate that purchase intention toward kombucha products is shaped by a combination of direct effects, mediated relationships, and selective moderating influences. As illustrated in
Figure 2, consumer attitude serves as a central mediating mechanism linking the antecedent variables to purchase intention, while health consciousness acts as a conditional factor that alters the strength of specific relationships within the model.
Table 8 presents the structural model assessment. The SRMR value of 0.076 was below the commonly applied threshold of 0.08, suggesting an acceptable level of approximate model fit. However, the NFI value of 0.738 was relatively low and should therefore be interpreted cautiously rather than as evidence of good global model fit. In PLS-SEM, global fit indices such as NFI should not be interpreted in the same manner as in covariance-based SEM, as PLS-SEM primarily emphasizes the model’s explanatory and predictive performance. Accordingly, the evaluation of the present structural model places greater emphasis on R
2, Q
2, and effect sizes, while SRMR and NFI are reported as supplementary diagnostic information.
The coefficient of determination showed that the model explained 66.7% of the variance in consumer attitude (R
2 = 0.667) and 72.8% of the variance in purchase intention (R
2 = 0.728), indicating substantial explanatory power. Furthermore, the predictive relevance values were greater than zero (Q
2 = 0.421 for attitude and Q
2 = 0.487 for purchase intention), confirming that the structural model possessed satisfactory predictive relevance according to the PLS-SEM guidelines (
Hair et al., 2021).
Table 9 summarizes additional structural model diagnostics, including standard errors, variance inflation factors (VIF), and effect sizes (f
2). The standard errors obtained from the bootstrapping procedure indicate stable parameter estimation across all hypothesized relationships. As expected, variance inflation factor (VIF) and effect size (f
2) values are reported only for the direct and moderating structural paths because these statistics are not applicable to indirect (mediation) effects in PLS-SEM. All reported VIF values ranged from 2.794 to 4.462, remaining below the recommended threshold of 5.0 and indicating that multicollinearity was not a concern. The effect size (f
2) analysis revealed that the moderating effects of health consciousness were generally small, whereas the direct effect of consumer attitude on purchase intention exhibited the largest effect size (f
2 = 0.135), highlighting attitude as the most influential predictor of purchase intention in the proposed model.
Although some structural relationships were statistically significant, their effect sizes should also be considered when evaluating their substantive importance. In particular, the small f
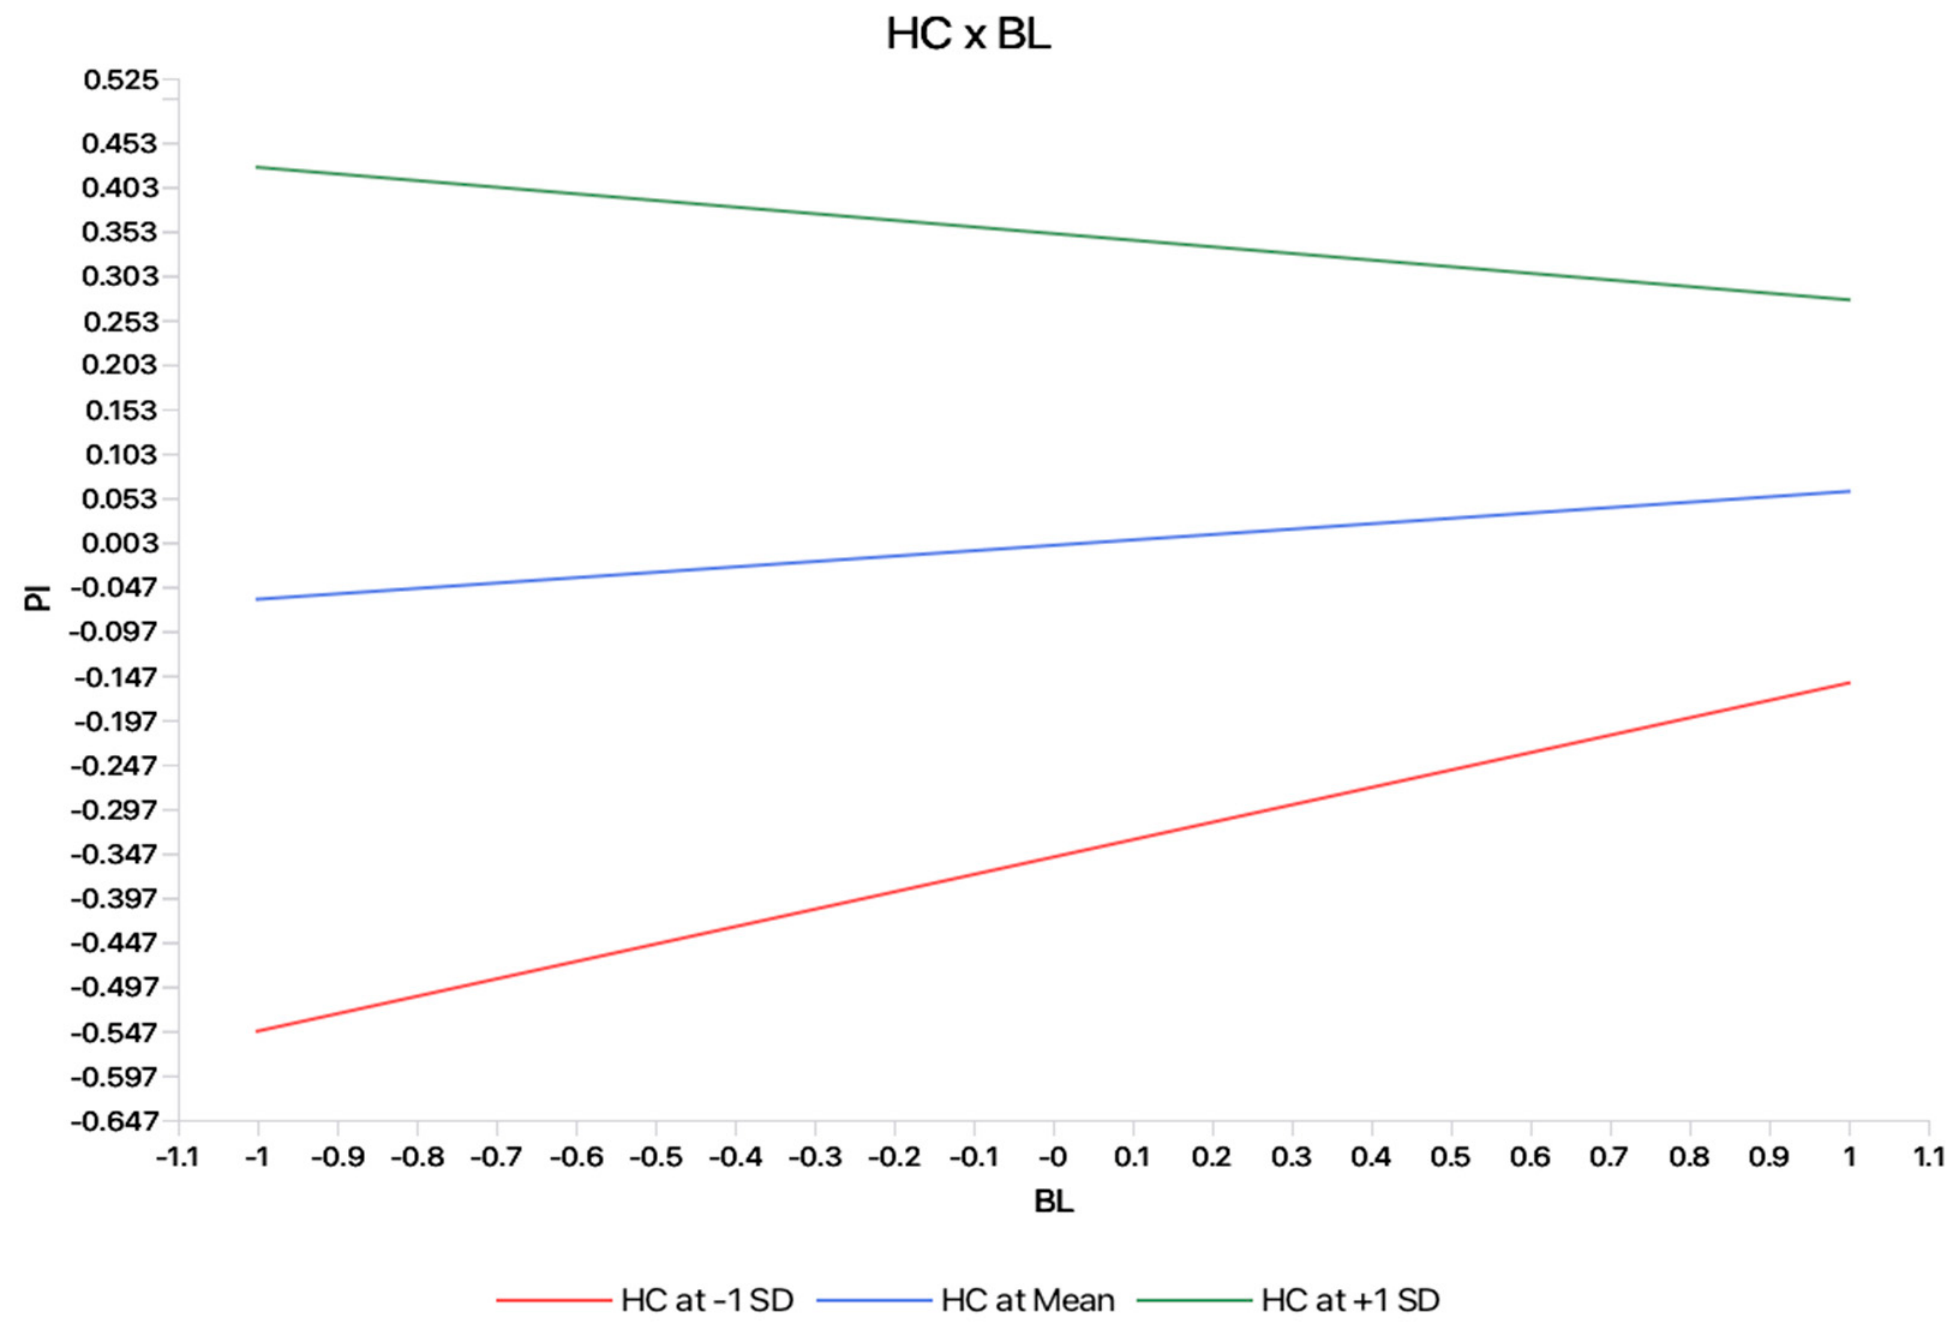
2 values associated with the moderation effects indicate that the interaction effects provide only limited incremental contribution to the explained variance in purchase intention, even when an interaction effect reaches statistical significance. Therefore, statistical significance in this study should not necessarily be interpreted as evidence of substantial practical significance. To further interpret the significant interaction between consumer belief and health consciousness, a simple slope analysis was conducted, as illustrated in
Figure 3. The interaction plot indicates that the relationship between consumer belief and purchase intention becomes progressively weaker as health consciousness increases. At a lower level of health consciousness (−1 SD), consumer belief exhibits a relatively strong positive relationship with purchase intention. This relationship becomes substantially weaker at the mean level of health consciousness and changes to a negative relationship at a higher level of health consciousness (+1 SD). This pattern is consistent with the negative interaction effect observed for H5, suggesting that higher health consciousness weakens the positive association between consumer belief and purchase intention.