1. Introduction
In recent years, the construct of “talent management” (TM) has emerged as a prominent framework within human resource management, driven primarily by a growing interest in hiring, developing, and retaining a competitive workforce that contributes to long-term competitive advantage. A key distinction within this literature is whether organizations adopt exclusive approaches that focus resources on a select group of high-potential employees, or inclusive approaches that provide developmental opportunities more broadly across employees.
Exclusive talent management (ETM) allocates an organization’s resources toward attracting, retaining, and developing only the highest performers or those identified as having the most potential (
Meyers et al., 2020). This approach relies on the belief that top-tier talent is rare and must be heavily invested in to maintain a competitive edge, often focusing on roughly 15% of the workforce (
Savaneničienė & Vilčiauskaitė, 2017). Yet by categorizing employees and actively omitting “average” or weaker performers from developmental opportunities, organizations risk generating feelings of inequity and disconnection among the majority of their staff (
Bhatia & Baruah, 2020). Employees excluded from these programs may perceive the workplace as unfair and discriminatory, potentially leading to retaliatory behaviors or reduced commitment (
O’Connor & Crowley-Henry, 2019).
Conversely, inclusive talent management (ITM) is rooted in the belief that all individuals possess unique talents and potential for growth and thus allocates resources across the entire workforce (
Meyers et al., 2020;
Swailes et al., 2014). This strategy functions as a strong signal of organizational support, encouraging all employees to unearth and develop their skills.
As well, TM systems do not simply allocate resources; they signal how fairly and transparently employees are treated. Drawing on organizational justice theory (OJT), particularly procedural justice, employees evaluate whether decision-making processes are consistent, unbiased, and applied equitably. Inclusive TM practices may signal fairness by making opportunities widely accessible, whereas exclusive practices may introduce perceptions of inequity if criteria are unclear or inconsistently applied.
Our first study examined how employees’ perceptions of TM inclusivity relate to perceived fairness and procedural justice, finding support for nearly all predicted relationships.
Our second study extended the first in two primary ways. First, we examined a specific type of TM (succession planning—SP) that has been relatively empirically understudied. Succession planning formalizes how organizations identify, develop, and promote talent. The type of succession planning provides employees with clear or unclear signals about inclusion, transparency, and opportunity. Second, as evaluations of fairness and justice (from Study 1) represent proximal process-focused judgments, we considered a broader organizational attitude, perceived organizational support (POS)—employees’ general belief that the organization values their contributions and cares about their well-being. Prior research (e.g., see
Rhoades and Eisenberger’s (
2002), meta-analysis) suggests that fairness and justice perceptions are important antecedents of POS, such that fair treatment signals organizational respect and support.
Across the two studies, we build a more comprehensive understanding of how TM systems influence employee perceptions and attitudes. Together, these studies contribute to a broader nomological network linking talent management practices to both evaluations of fairness and global organizational attitudes.
We organized the paper as follows. We first discuss background theory and research on talent management, including and excluding distinctions. We then discuss procedural justice as well as the theoretical logic of proposing gender as a moderator. We next present our methods and results, followed by a short discussion of Study 1. We then move to Study 2 and present research and theory regarding succession and SP. Next, we discuss the established construct of perceived organizational support and how/why it may relate to employee perceptions of their organization’s SP processes. We next discuss knowledge of SP, among others, as a potential moderating variable. We then present our methodology and results. We follow with a short discussion of Study 2, followed by a general discussion where we discuss both pragmatic and theoretical implications and limitations.
2. Literature Review—Study 1
The field of talent management has developed rapidly, and a key factor is the decision to include all employees or focus primarily on certain “star” individuals. These decisions organizations enact have great potential to impact employees’ perceptions of justice and fairness. Employees may have perceptions that their employer is unfair if exclusive talent management practices are utilized and hold negative beliefs regarding their workplace. A recent study found that only 18% of employees believe that they work in an environment with a high level of fairness (
Kropp et al., 2022). These attitudes may develop from observations of inequity and an imbalance of opportunity.
The present research examined the relationship between inclusive/exclusive talent management strategies, perceived fairness, and procedural justice, with gender as a moderator.
Activities and processes that involve the systematic identification of key positions which differentially contribute to the organization’s sustainable competitive advantage; the development of a talent pool of high-potential and high-performing incumbents to fill these roles; and the development of a differentiated human resource architecture to facilitate filling these positions with competent incumbents and to ensure their continued commitment to the organization. (p. 304).
Historically speaking, TM has often been characterized in essentially a dichotomous fashion of inclusive as opposed to exclusive strategies (c.f.,
Iles et al., 2010). To illustrate,
Iles et al. (
2010) discussed a 2 × 2 quadrant approach with inclusive and exclusive approaches on opposite ends, and a people versus position dichotomy crossed with the inclusive/exclusive pole. While
Iles et al. (
2010) discussed more nuanced positioning of TM than simply the four quadrants, much research has characterized TM strategies in such an “either/or” fashion (for recent commentary, see
O’Connor et al., 2025 and
Vardi & Collings, 2023). Below, we utilize this dichotomous distinction to present clearly the underlying conceptual development of the two opposing or extreme ends of the poles. We acknowledge, however, that the dichotomous distinction is oversimplified in actual practice (and revisit this more in
Section 5).
3. Talent Management Strategies—Exclusive Talent Management
A focus on high performers or individuals with notable potential may result in an exclusive talent management (ETM) strategy (
Meyers et al., 2020). ETM involves allocating an organization’s resources toward attracting, retaining, and developing the high performers within the company to gain a competitive advantage; employers often maintain the belief that talent is rare and must be secured. Employees are grouped based on performance and/or potential and are treated differently: workers identified as high performers (HIPOs) are often given greater attention from management and more opportunities (
Bhatia & Baruah, 2020).
Comparatively, ETM is often more controversial or problematic, and the organization must consider the potential for negative reactions to these initiatives (
Savaneničienė & Vilčiauskaitė, 2017). The overall focus of ETM is on the employees that the company perceives as the most important and talented, which omits many employees as ETM focuses on roughly 15% of workers (
Savaneničienė & Vilčiauskaitė, 2017). Individuals who are not included may be released from their position. In other instances, they may experience limited interaction with management compared to their coworkers, which can result in feelings of disconnection from their work and employer (
Bhatia & Baruah, 2020). Also, employees who are not included in the ETM program may feel the workplace is unfair and feel distrustful towards it (
O’Connor & Crowley-Henry, 2019). Also, HIPOs may have negative perceptions of ETM as their workload may be heavier, which can lead to feelings of being overburdened (
Bhatia & Baruah, 2020). Finally, transparency when implementing ETM is pivotal because a lack of understanding regarding the procedures involved in ETM can lead to backlash from employees when they are not included in the strategy without an explanation (
O’Connor & Crowley-Henry, 2019;
Savaneničienė & Vilčiauskaitė, 2017).
4. Talent Management Strategies—Inclusive Talent Management
Inclusive talent management (ITM) focuses on the inclusion of all members of a team regardless of differences in skill or potential (
Meyers et al., 2020;
Swailes et al., 2014). Managers engaging in ITM often perceive talent as being widespread, such that either all employees can become high performers, or every person has their own unique talents that can be beneficial. As a result, the company will allocate its resources across all employees. ITM differs from ETM because it offers individuals the opportunity to participate in talent management and developmental programs rather than needing to reach a performance threshold for those benefits (
Swailes et al., 2014). An organization may consider ITM instead of ETM when shifting its company’s focus to developing internal talent and building up its current workforce instead of attempting to attract external high performers (
Savaneničienė & Vilčiauskaitė, 2017).
5. Beyond a Dichotomy
The historic dichotomous characterization in the talent management literature (e.g.,
Iles et al., 2010) has provided a useful organizing framework. However, recent work posits that the dichotomy is too simplistic as organizations adopt context-dependent approaches that blend elements of both perspectives (
Vardi & Collings, 2023). Building on this shift, emerging frameworks advocate for integrated talent management rather than an “either/or” mindset to better reflect the complexity of organizational practices and employee experiences (
O’Connor et al., 2025). However, less is known about how employees interpret and respond to these systems, which the present study seeks to understand, utilizing the lens of procedural justice.
Talent Management Strategy and Procedural Justice
The relationship between talent management and organizational justice theory (OJT) has been lightly explored as the former has evolved in the I/O psychology literature; research provided reasonings for using ETM or ITM based on the organization’s culture and outcomes for using a specific strategy, and has used aspects of OJT as mediating and moderating variables to organizational outcomes and employee attitudes (
Bhatia & Baruah, 2020;
De Boeck et al., 2018;
Fasih et al., 2021;
Gelens et al., 2013;
Meyers & van Woerkom, 2014;
O’Connor & Crowley-Henry, 2019). Despite the increasing prevalence of talent management in research and the identification of ETM and ITM as hot topics in the field, the relationship between an exclusive and inclusive strategy and perceptions of fairness is limited; a better understanding of how these views interact could benefit companies looking for guidance on future directions of their business (
Dries, 2013;
O’Connor & Crowley-Henry, 2019). A growing interest in both the inclusion of employees in talent management practices and the overall fairness of organizations indicates a need for research (
Bhatia & Baruah, 2020;
O’Connor & Crowley-Henry, 2019;
Swailes, 2020). In determining the fairness of ETM practices according to the rules for evaluating procedural fairness proposed by
Leventhal (
1976), certain activities could produce perceived inequity because they break the consistency rule, which states that similar procedures should be allocated equally to all individuals and across time. Thus, in many instances, ETM practices would be perceived as inherently low in procedural justice because only a select group of individuals is given the resources shared in a company using ETM rather than all individuals, and the process for the selection of these employees may not remain concrete throughout time (
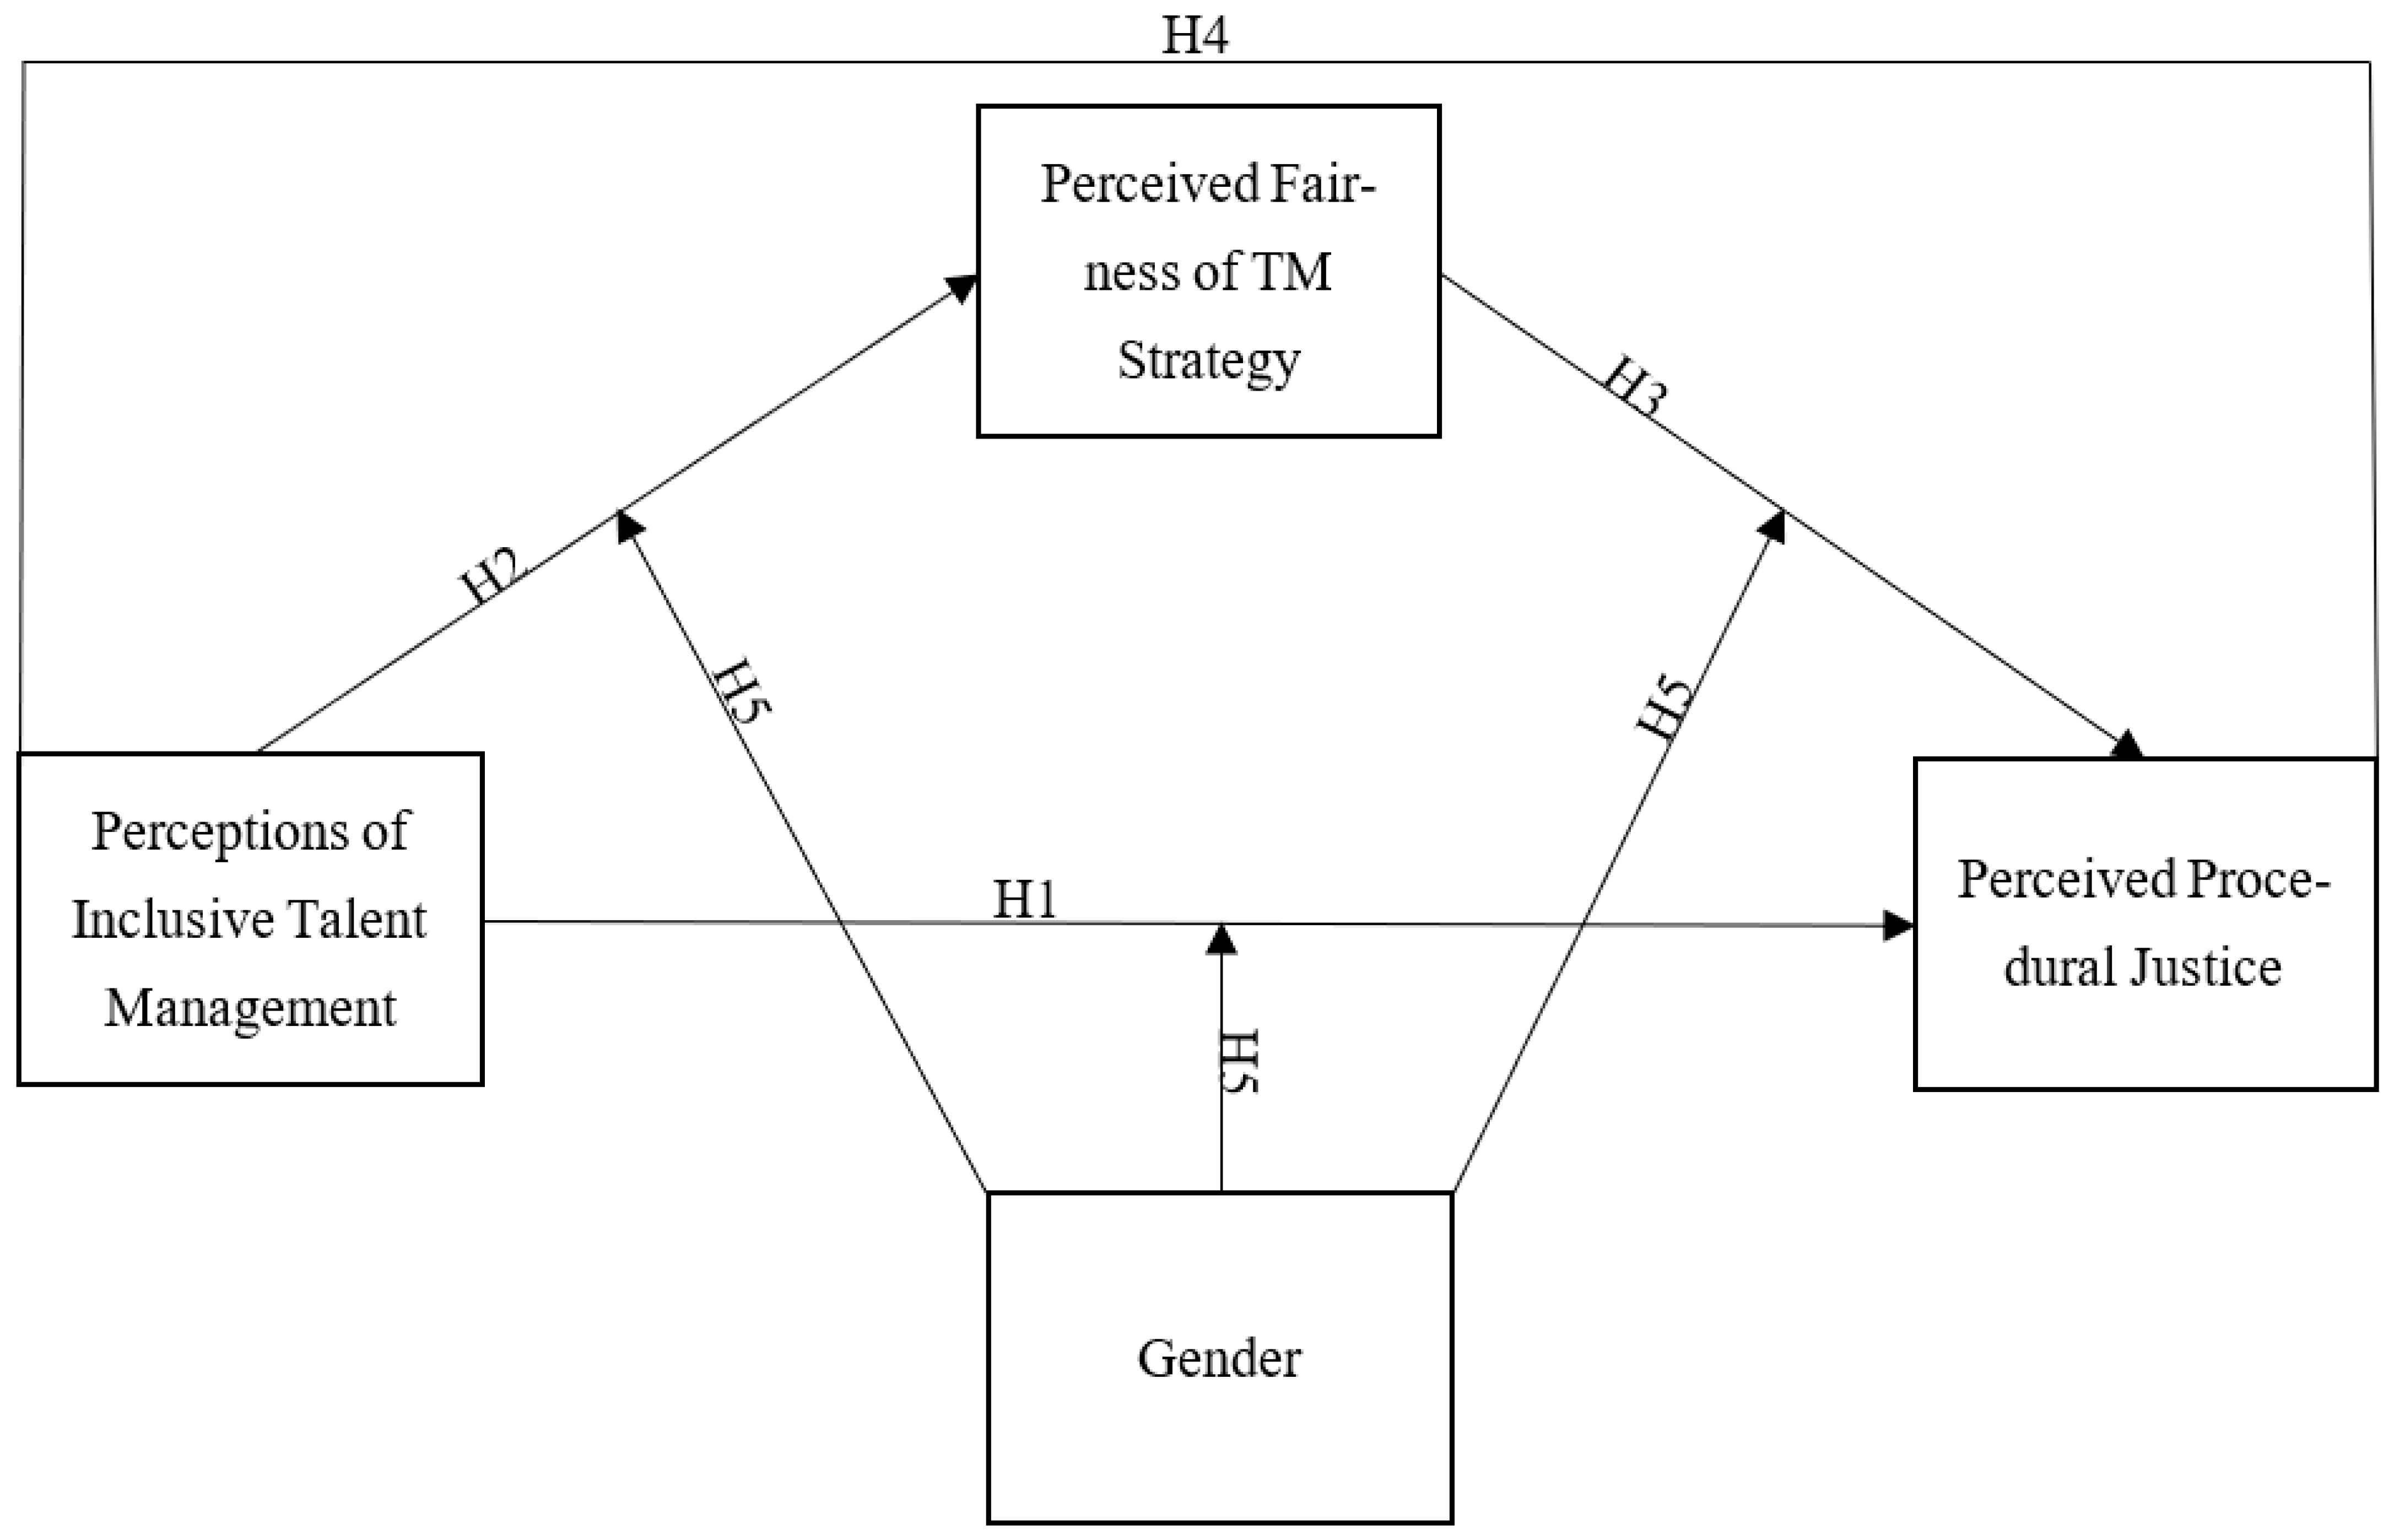
Kwon & Jang, 2022). This leads to our first hypothesis (please see
Figure 1 for a visual model of all hypotheses).
Hypothesis 1. Individuals within organizations where more Inclusive talent management strategies are utilized will perceive higher levels of procedural justice compared to those who work in companies utilizing fewer ITM strategies (e.g., more ETM strategies).
6. Perceived Fairness as a Mediator
As mentioned, a concern when implementing practices aligned with ETM is the risk of backlash or negative reactions from employees; the attitudes and behaviors may develop from feelings of inequity or a lack of fairness (
Adams, 1963;
Bhatia & Baruah, 2020;
Malik & Singh, 2022;
Skarlicki & Folger, 1997). The belief that one’s workplace is unfair after noticing inequity could encourage the individual to focus on how decisions are made rather than the decisions themselves; a belief that a person’s employer is unfair could create strong feelings, and that person could become more disgruntled with how their organization makes decisions (
Greenberg, 1987). As well, the employee may not be aware of what procedures are used to identify the top workers; the assumptions made or lack of transparency regarding the processes utilized by the company could create a sense of injustice from the procedures used in their place of work (
Hartman et al., 1999). Perceptions of fairness within one’s organization and its practices likely connect to the level of procedural justice perceived:
Hypothesis 2. Perceptions of inclusive talent management strategies will be positively related to perceived fairness of the TM strategy.
Hypothesis 3. The perceived fairness of the TM strategy will be positively related to procedural justice.
Hypothesis 4. Perceived fairness of the TM strategy will mediate the relationship between the inclusive talent management strategy and procedural justice.
7. Gender as a Moderator
Research suggests that the talent management construct enacted holds a “masculine edge” such that it better promotes the inclusion of men in practices and growth opportunities because of the historical lack of gender diversity among leaders within organizations and selection decisions made by male-dominated executive committees (
Festing et al., 2015;
Makarem et al., 2019;
Sheehan & Anderson, 2015). The literature posits that certain organizational factors, such as the company’s definition of talent in talent management, may create gender bias. A workplace with a more masculine talent identity, which may be exemplified by associating high potential and leadership with more masculine traits such as assertiveness, may exhibit gender bias and differences in treatment between men and women when implementing talent management strategies (
Festing et al., 2015). The employer’s bias can create gaps in how men and women are compensated as well as the methods used to determine rewards and resource allocation, which highlights the need for additional research on gender perceptions of talent management and organizational justice.
Researchers have explored the value that men and women place on the various aspects of OJT and find that women appear to place a greater emphasis on procedural justice compared to men, who are more concerned with distributions (
Sweeney & McFarlin, 1997). Their findings indicate a possibility that well-known gender differences in organizations, such as the wage gap and glass ceilings, may be somewhat expected, which could lead to women shifting their focus toward
how decisions are made and drawing conclusions related to organizational justice on the processes, while men are content with the fairness of
what they receive, regardless of procedure.
Hypothesis 5. Gender will moderate the relationship (direct and indirect) between talent management strategy and procedural justice, such that the relationship between inclusive talent management and procedural justice will be stronger for women than for men.
8. Methods—Study 1
Participants and Procedure
Participants were recruited through the Prolific Academic platform, received
$2.50 for participation, and were required to be fluent English speakers, 18 years of age or older, and employed full-time in the US. Two attention checks were placed throughout the survey for potential removal (
n = 3). Of the 100 participants, 49% were male, and 49% were female. The sample age ranged from 18 to 70 (
M = 37.98,
SD = 11.92). A majority of participants stated that they either held a 4-year degree from college (44%,
n = 44) or a professional degree (24%,
n = 24). The most common organizational level of participants was manager (39%,
n = 39), followed by individual contributor (32%,
n = 32). Lastly, tenure ranged from 1 to 36 years (
M = 7.17,
SD = 6.78). See
Table 1.
Participants who met the requirements for participation based on their user profile were filtered by Prolific and received an email link, which directed them to the survey housed on the Qualtrics survey platform. Participants responded to three measures in the following order: perceived fairness, talent management practices and strategy, and perceived procedural and distributive justice. Lastly, participants were presented with demographic questions. Furthermore, participants were informed that their responses would remain anonymous and confidential, and no identifying information was collected, reducing evaluation apprehension and encouraging honest responses.
9. Measures
9.1. Perceived Fairness of Talent Management Strategy
Our 4-item measure consisted of three seven-point Likert-scale items, such as “Overall, since joining my organization, I feel that I have been treated fairly by talent management within my organization,” and one open-ended item, which was adapted and created for this study. The Cronbach’s alpha for the three Likert items of the perceived fairness measure demonstrated acceptable internal consistency, α = .82.
9.2. Employer Talent Management (TM) Practices and Strategy
We utilized a measure developed by
Sonnenberg et al. (
2014). The scale began with the following descriptive item, similar to one developed by
Sonnenberg et al. (
2014): “If every employee within an organization has access to talent management practices, this approach is called inclusive. If only a select group of employees within an organization has access to those practices, this approach is called exclusive. How exclusive or inclusive would you describe your organization?” The participants responded by moving a slider bar to indicate where their organization lies on a spectrum between exclusive and inclusive. The responses were coded based on where the participants placed the bar, ranging from 0 (exclusive) to 10 (inclusive). After responding to this item, participants were presented with 18 popular TM practices, such as internal and external coaching, job rotation, and advanced education opportunities and indicated if their employer does offer the opportunity, does not offer the opportunity, or “not sure.” If the participant indicated that the practice was offered, they were asked if the practice was inclusive, exclusive, or in between. Thus, four separate scores were collected for this section of the survey regarding TM practices; three scores were observed for descriptive and correlation purposes: the slider bar response, the number of activities a participant marked as exclusive, and the number of activities a participant marked as inclusive. Also, the total frequency of each talent management activity was computed.
We did not report Cronbach’s alpha for the talent management practices measure because it captures a formative index of distinct practices rather than a reflective scale of interchangeable items. As such, internal consistency metrics are not conceptually appropriate (
Spector & Jex, 1998).
9.3. Perceived Distributive and Procedural Justice
We used the brief version of the Organizational Justice Scale developed by
Niehoff and Moorman (
1993), which had 11 items: five distributive and six procedural justice items. A sample distributive justice (for exploration) was “I think that my level of pay is fair,” and a procedural justice item (for hypothesis testing) was “My general manager makes sure that all employee concerns are heard before job decisions are made.” Scales used a 7-point Likert anchor ranging from 1 (strongly disagree) to 7 (strongly agree). The procedural justice (α = .91) and distributive justice (α = .90) scales both produced a strong level of internal consistency.
9.4. Demographics Questionnaire
Demographic information included age, race, gender, education, tenure with their current employer, and organizational level.
10. Results
Total frequency for each talent management activity was calculated (See
Table 2). The most common practices, internal coaching (
n = 82) and mentoring/buddying (
n = 68), depicted actions that involve managers or other internal coaches providing support to the employee to assist in their development. Adversely, initiatives involving the use of outside sources, such as external coaching (
n = 19) and external secondments (
n = 12), the temporary movement of an employee to a different organization, were the least popular.
Gender (male = 1, female = 2) was found to be significantly positively related to both perceived fairness, r(97) = .22, p = .02, and perceptions of talent management, r(97) = .22, p = .02, suggesting that females perceived their company’s talent management as both more fair and more inclusive.
Thematic analysis of the open-ended item (see
Table 3), which asked participants to provide two things that they believe their organization’s talent management department could do to improve were conducted. The most prominent topics pertained to revising talent management practices and procedures, and career growth and development. For instance, one participant suggested that their workplace “increase opportunities for career advancement to motivate employees to stay and grow within the organization.” Also, fairness, transparency, and diversity were frequently addressed; participants noted “bias” and “nepotism” when suggesting that their workplace be fairer and more inclusive in its practices.
Correlational analyses (see
Table 4) support Hypotheses 1–3: individuals who perceive their organization as more inclusive had higher procedural justice:
r(97) = .55,
p < .001. Further support for H1 was found as procedural justice was significantly positively correlated with inclusive practice count,
r(97) = .52,
p < .001; perceptions of inclusive talent management strategies were positively related to perceived fairness,
r(97) = .51,
p < .001 as was number of inclusive practices
r(97) = .46,
p < .001; and perceived fairness had a positive relationship with procedural justice,
r(97) = .59,
p < .001.
Hayes (
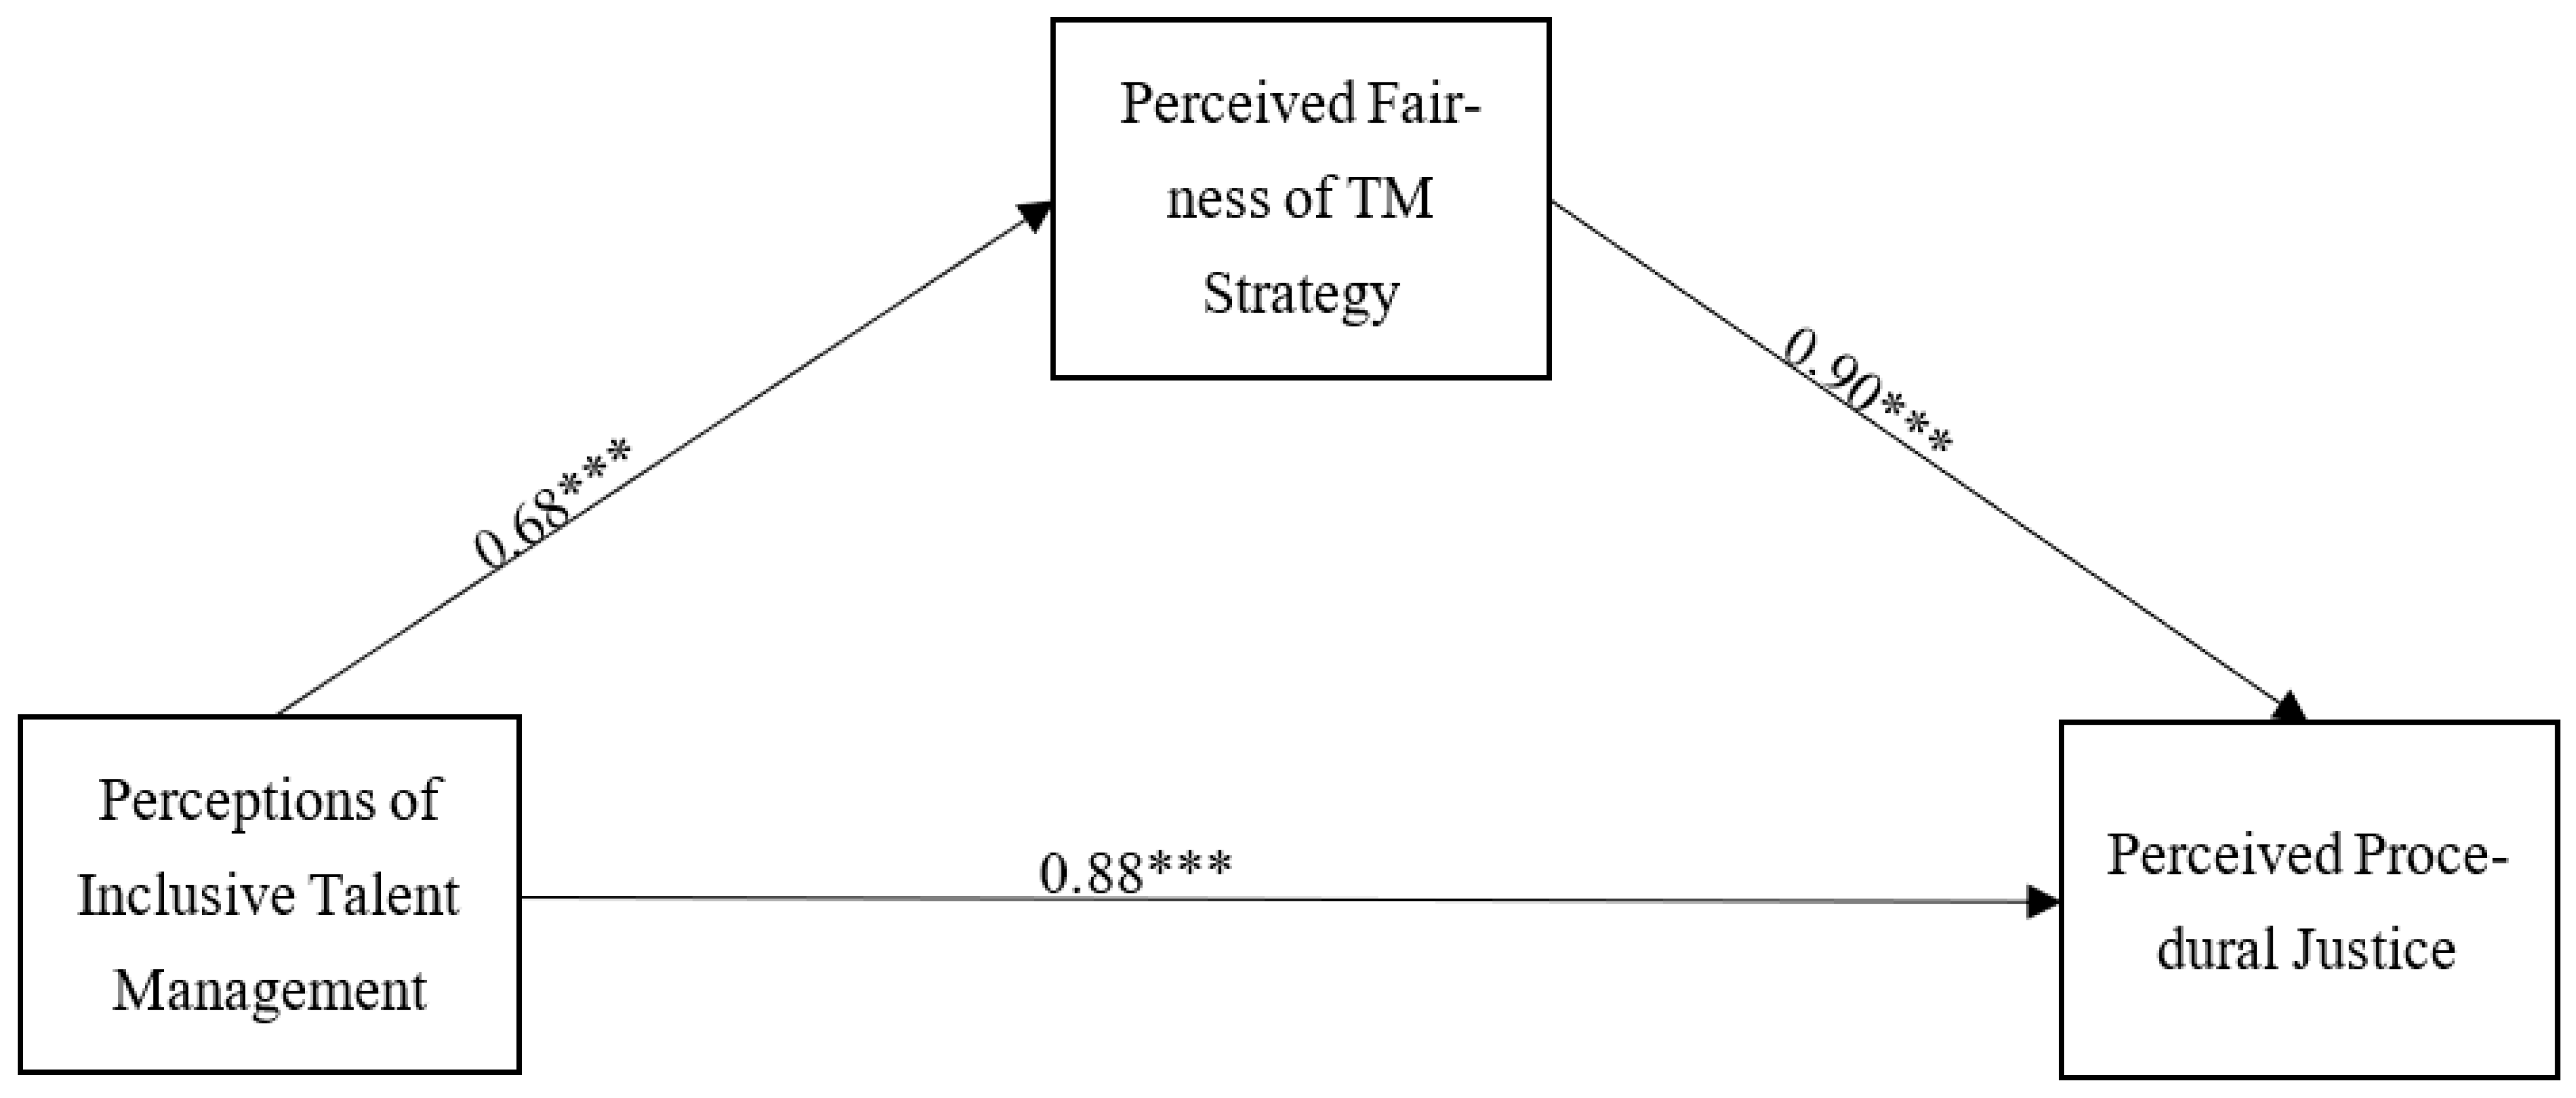
2017) PROCESS macro for simple mediation (Model 4) was run, with perceived ITM as the IV, perceived procedural justice as the DV, and perceived fairness as the mediator. Also, Hypothesis 5 was tested following Hayes PROCESS macro steps for moderated mediation (Model 59): we tested the direct relationship between perceived ITM and perceived procedural justice, the mediating effect of perceived fairness, and the moderating effect of gender on the direct and indirect relationship between perceived ITM and perceived procedural justice.
Figure 2 and
Table 5 illustrate the results and present the unstandardized regression coefficients. We used information from the bootstrap sampling distributions (
N = 5000) to estimate unstandardized coefficients with 95% bias-corrected confidence intervals (CIs) for the indirect effects.
For the mediation model, the overall model was significant, F(2, 97) = 37.89, p < .001, R2 = .44. The direct effect of TM perceptions on procedural justice was also significant, B = .88, SE = .24, p < .001, as was the indirect effect of TM perceptions on procedural justice through perceived fairness, 0.61, SE = 0.18, 95% CI [0.30, 0.98], suggesting that perceived fairness partially mediates the relationship between TM perceptions and procedural justice, supporting Hypothesis 4. The total effect (B = 1.49, SE = 0.23) breaks down into the effect of perceptions of talent management on procedural justice (B = 0.88, SE = 0.24) plus the indirect effect (B = 0.61, SE = 0.18).
Hypothesis 5 examined gender as a moderator. While the overall model was significant,
F(5, 92) = 14.47,
p < .0001; gender as the main effect was not significant on both perceived fairness,
B = 1.92,
p > .05, and procedural justice,
B = −5.34,
p > .05; nor was the interaction of gender and TM perceptions on fairness,
B = −.17,
t = −.74,
p > .05, or procedural justice,
B = .00,
p > .05; as well, the overall index of moderated mediation was non-significant,
B = .00,
SE = .35; CI [−.68, .67] failing to support H5.
Table 5 presents these results.
11. Discussion—Study 1
We explored and supported the relationships between TM strategy, procedural justice, and perceived fairness, which has relevance for organizational teams and researchers alike in decision-making and future exploration of the constructs, descriptively.
Our findings demonstrated that individuals in organizations utilizing more inclusive TM strategies perceived higher levels of procedural justice. Results also revealed that this relationship is mediated by the overall perceived fairness of the TM strategy itself. When all employees are included in TM practices, the lack of visible inequity leads to higher perceived fairness, which subsequently fosters stronger perceptions of procedural justice. Further, results with distributive justice as the dependent variable paralleled the findings of the primary model with procedural justice. These findings clearly support the logic of our hypotheses and show the importance of inclusive TM practices and both fairness and justice perceptions.
Descriptively, we found a surprisingly limited availability or visibility of the practices, as only five activities were prevalent in at least 50% of the participants’ workplaces. Also, the most common practices reported were internal practices such as coaching, in-house development programs, and job shadowing, perhaps more prominent due to convenience and lower cost.
The most common broad theme from the open-ended item, which prompted participants to provide two suggestions for improving their employer’s TM, called for a review of TM practices and procedures, such as increasing hiring and adjusting talent selection or identification procedures. Participants also yearned for career growth and developmental opportunities, which overlap with the broader theme of revising TM practices. Developmental opportunities are strongly desired by employees and are associated with several positive outcomes, including improved performance, increased organizational citizenship behaviors, and reduced turnover intentions (
Dysvik & Kuvaas, 2008).
Results from Study 1 highlight that employees’ perceptions of TM practices are not only driven by the availability of developmental opportunities, but also by how the opportunities are distributed and experienced. The findings suggest that employees are interpreting TM systems as signals of organizational intent to treat and develop its workforce, using these practices to assess whether the organization operates in a fair, transparent, and equitable manner.
The noted desire for developmental opportunities arising from open-ended analyses/themes leads us to our second study, which was a deep dive into a specific type of TM, succession planning (SP), a relatively understudied TM practice. As well, in
Table 2, we note that succession planning was the sixth most frequently mentioned TM practice, suggesting it might be prevalent enough to study in more depth, as well as potentially providing enough variance across companies for statistical analyses.
As stated earlier, procedural justice is a relatively proximal, process-focused judgment. A critical next step is to examine how these fairness-based evaluations translate into broader, organization-level attitudes. Study 2 thus focused on SP as a specific and highly visible part of TM systems as it relates to a broad organizational attitude: perceived organizational support. SP provides context for employees to observe how organizations allocate developmental opportunities and resources, identify potential, and communicate the pathways to promotion. As such, SP is a key way TM strategies are put into practice and understood by employees.
12. Literature Review—Study 2
12.1. Succession and Succession Planning
Succession has been defined as “the planned or unplanned change in the formal leader of a group or organization” (
Gordon & Rosen, 1981, as cited in
Ballinger & Schoorman, 2007, p. 119). Succession planning is “an ongoing process of systematically identifying, assessing and developing organizational leadership to enhance performance” (
Kim, 2003, as cited in the
National Academy of Public Administration, 1997, p. 533). These two definitions describe two different processes that occur across all organizations—the actual change in formal leadership, and the ongoing process of finding and developing leaders. We focus on the latter as it is one type of TM strategy or process.
12.2. Succession Planning
Effective succession planning (SP) plays a crucial role in employee and firm performance (
Gothard & Austin, 2013). Human capital theory suggests that organizations develop a sustainable competitive advantage through human resource (HR) practices (
Buta, 2015). As such, recruitment, retention, career progression, and knowledge transfer directly influence the HR component of a sustainable competitive advantage (
Buta, 2015). However, research highlights that many firms have ineffective succession plans (
Bernthal & Wellins, 2006;
Carman et al., 2010). Furthermore, research shows that inadequate SP can lead to direct and indirect costs (
Gothard & Austin, 2013;
Keall, 2021;
Shen & Cannella, 2002) associated with recruiting, loss of organizational knowledge, and even declines in stock prices.
Further research elucidates the need for more exploration.
Barnett and Davis (
2008) cite
Bernthal and Wellins’s (
2006) study, which surveyed more than 900 organizations, and found that 34% of them rated their SP systems as ineffective. Additionally,
Carman et al.’s (
2010) study discusses the lack of existing or effective SP within nonprofits. They found that, in general, senior management planning on retiring did so privately and did not discuss potential new leaders or the steps to be taken before leaving. Additionally, they found that young professionals within the non-profit sector were eager to grow and develop within the organization, but did not feel that opportunities existed.
A secondary goal of Study 2 was to develop a conceptually grounded and practically useful measure of employees’ perceptions of their organization’s SP processes. We draw on
Rhodes and Walker (
1984) to guide our thinking and inform the development of our measure.
Rhodes and Walker (
1984) discussed four approaches to the SP process, each describing different stages of involvement: informal, decentralized, centralized, and integrated. They differentiated these approaches by examining their levels of senior management involvement, information requirements, assessment, management review, development techniques, and educational training. For example, the informal process generally has low CEO involvement, no formal record-keeping, subjective assessments, no formal review process, no planned development processes, and limited educational programming. On the other end of the spectrum, the integrated process includes high senior management involvement, large amounts of documentation, intensive assessment processes, a formal review process on all levels of the organization, planned developmental processes, and extensive training programs (
Rhodes & Walker, 1984). For the purposes of instrument development to clearly differentiate effective from less effective processes, we utilized only the informal and integrated categories. Below, we discuss other research that guided our construct definition and resultant scale development.
Karaveli and Hall (
2003) recommend simplifying the SP process to include less paperwork, less preparation for development meetings, and more training for executives on delivering feedback so it can be direct and straightforward. They also suggest that organizations decentralize the process so that all organizational levels can partake without too much complex bureaucracy.
Karaveli and Hall (
2003) suggest utilizing technology services to streamline the process as well, as long as in-person meetings supplement it.
Barnett and Davis (
2008) additionally emphasize aligning business strategy with talent strategy while gaining support from top management. They also suggest creating a transferable and simple system that can be used for any level and, in the future, maintaining coordination with HR. Barrett and Davis focus on talent that will benefit the organization, ensuring that the plan spans multiple levels so that all levels are supported, and establishing formal criteria for evaluation. It also includes providing a clear outline of requirements for growth at each level to employees, continuous communication and feedback, development and educational opportunities, and methods of measuring the plan’s effectiveness and its processes (
Barnett & Davis, 2008).
Further, it is well-established that HR practices perceived as supportive positively impact employees’ POS (
Allen et al., 2003;
Eisenberger et al., 1986;
Huselid, 1995;
Wayne et al., 1997). We chose POS for primary reasons: (1) it has solid theoretical and empirical foundations; (2) it is conceptually similar to employee perceptions of their organization’s SP processes and could be considered as a broader umbrella under which employee perceptions of SP processes would fall; and (3) it has a well-established set of positive outcomes. Further, Study 2 extends our nomological network by examining POS, a broader work attitude that has been theoretically and empirically linked to procedural justice and perceived fairness, thereby allowing us to connect talent management practices to downstream employee attitudes.
12.3. Perceived Organizational Support
POS is the “employees’ general belief that their work organization values their contribution and cares about their well-being” (
Rhoades & Eisenberger, 2002, p. 698). The theory also suggests that employees value resources received if they perceive they were given based on the giver’s choice rather than circumstances beyond the giver’s control (
Rhoades & Eisenberger, 2002).
12.4. Antecedents of POS
Rhoades and Eisenberger’s (
2002) meta-analysis highlighted that perceived fairness, supervisor support, organizational rewards, and favorable job conditions increase POS. The best practices of SP outlined above heavily implicate perceived fairness (established partly through clarity and transparency of HR practices generally, and SP processes specifically), supervisor support, and the importance of clear communication. Increased communication between management and employees also positively impacts POS (
Neves & Eisenberger, 2012).
Alternatively, change-related uncertainty can negatively affect POS (
Cullen et al., 2014). Cullen and colleagues examined how workplace uncertainty and individual differences in adaptability related to job satisfaction and performance as mediated by the POS. They found that employees’ POS partly explains satisfaction and performance, or how employees feel the organization is there for them and will help them in times of uncertainty. Therefore, organizations with SP processes closer to the integrated end of the spectrum of planning (per
Barnett & Davis, 2008) should have employees who perceive less uncertainty, implicitly raising their POS, in turn, leading to our first hypothesis.
Hypothesis 1. Employees’ perception of the level of integration of their organization’s succession plan will be positively related to POS, and perception of the level of informal succession plan will be inversely related to POS.
12.5. Moderators
We also examined three potential moderators of the SP to POS relationship: knowledge of SP, organization type and size.
12.5.1. Knowledge of Succession Plan
For employees to benefit from organizational programs, plans, and strategies, they need to be aware of them. Just as effective communication is necessary for gaining knowledge and utilizing benefits, it is also essential for creating a successful system (
Sinclair et al., 2005). It is important to distinguish between knowledge of succession planning and perceptions of succession planning. Knowledge reflects employees’ awareness and understanding of organizational policies and processes, whereas perceptions reflect evaluative judgments about the quality, fairness, or effectiveness of those processes. This distinction is important because employees cannot form strong evaluative judgments about systems they do not understand, suggesting that knowledge may shape both the strength and direction of perception–outcome relationships.
Hypothesis 2a. More knowledge of their organization’s SP is related to greater POS of employees.
Hypothesis 2b. Employees’ knowledge of their organization’s SP will moderate the relationship between employees’ perception of the SP (regardless of the type of plan) and POS, such that greater knowledge of the SP will strengthen the relationship between perceptions of SP and POS.
12.5.2. Organization Type
Rhodes and Walker (
1984) note that organizations reap the most benefit from their SP if the amount of structure and integration aligns with their organizational type. For-profit versus non-profit is a common way to categorize organization types since they often have different structures, purposes, cultures, and resultant employee attitudes (
Borzaga & Tortia, 2006). Employees of nonprofits will often feel intrinsically motivated to work even though they may receive less payment (
Leete, 2000), due to personal values or a connection with the work.
Leete (
2000) quotes
Mirvis and Hackett (
1983), who found that non-profit employees are more likely to report that “their work is more important to them than the money they earn” (p. 7). It follows that nonprofit employees likely also desire growth and development opportunities and a clear route to increase their ranking within the organization.
Hypothesis 3. Organizational type (non-profit or for-profit) will moderate the relationship between perceptions of the level of integration of SP and POS, such that the positive relationship between SP perceptions and POS will be stronger in non-profit organizations compared to for-profit organizations.
12.5.3. Organizational Size
Organizational size may play a similar moderating role. In general, smaller organizations tend to have both less complex (
Ng & Maki, 1993) and less formal (
Hornsby & Kuratko, 1990;
Marlow et al., 2010) HR practices, such as informal meetings to provide feedback, rather than a more complex system for review. Also, structured and formal HR practices in smaller organizations negatively affect employee job satisfaction and self-reported job quality (
Storey et al., 2010). Thus, a more integrated SP may be less useful to employees’ POS in smaller organizations than in larger ones.
Hypothesis 4. Organizational size (larger or smaller) will moderate the relationship between perceptions of the level of integration of SP and POS, such that the positive relationship between SP perceptions and POS will be stronger for larger versus smaller organizations.
13. Methods—Study 2
13.1. Participants
We recruited 139 participants from Amazon’s MTurk and word-of-mouth combined. Of the 139, 43 datasets were removed for not passing qualifications (
n = 22), failing attention checks (
n = 9), or failing manipulation checks (
n = 12), resulting in 96 participants.
1 The average age of the 96 final participants was 39.38 (
SD = 12.84), and 29.9% were male and 69.1% were female. Participants were 87.6% White, 2.1% African American, 2.1% Hispanic/Latino, 4.1% Asian, and 3.1% answered Other.
As in Study 1, participants were informed that their responses would remain anonymous and confidential, and no identifying information was collected, reducing evaluation apprehension and encouraging honest responses.
Participants had an average of 6.75 years of work experience in their current job (
SD = 6.18) and 17.27 years of full-time work experience (
SD = 12.53). Fifty-seven percent of participants reported working in a for-profit organization, while 41.2% reported working in a non-profit organization. Demographic information by data type can be found in
Table 6.
13.2. Measures and Procedure
13.2.1. Type of Succession Plan (See Appendix A)
We used
Rhodes and Walker’s (
1984) descriptions of informal and integrated succession plans (only, not the middle two descriptions) to develop the measure (see
Appendix A and
Table 7). We chose only the two extreme ends of the continuum because informal and integrated provided the greatest distinctions (and thus should capture the widest variance) between types of succession plans. The hope was that the dichotomous nature of the descriptions would make it easier for participants to differentiate between the two types of succession plans. For example, as stated earlier, the informal approach generally has low CEO involvement, no formal record-keeping, subjective assessments, no formal review process, no planned development processes, and limited educational programming. In contrast, the integrated approach includes high senior management involvement, large amounts of documentation, intensive assessment processes, a formal review process on all levels of the organization, planned developmental processes, and extensive training programs (
Rhodes & Walker, 1984). We wanted clearly distinguishable descriptors so that participants could easily distinguish between the two succession plans without having to deconstruct vague words such as “some,” “may,” and “generally,” which are more prevalent in the descriptions of the decentralized and centralized processes.
To create the measure, we identified the six components of SP for both processes as outlined by
Rhodes and Walker (
1984): senior management involvement, information requirements, assessment, management review, development techniques, and educational training. We then created two checklists of items to correspond to the two succession plans. Participants checked all items from both lists that they thought resembled the SP at their place of work. The informal and integrated succession plans’ lists contained 8 and 7 items, respectively, and the items were opposite, mirror versions of each other.
2 We then captured a number of items from each type of plan checked, and used these in further analyses (see lines 7 and 8 in the correlation table). An example item of the informal plan and the integrated plan that measures “management review” is: “No formal review of succession is conducted at the corporate level” (informal); and “Extensive review and development of employees are conducted involving all departments and divisions with an eye toward developing corporate talent for a succession” (integrated). Participants next rated (using a 1–5 Likert scale) how closely the SP at their place of work resembled either the informal or integrated SP checklist description, where the descriptor for one was “The succession plan in my organization completely resembles the informal succession plan description,” and the descriptor for five was “The succession plan in my organization completely resembles the integrated succession plan description.”
Four subject matter experts reviewed the two SP checklists and overall SP rating scale, as well as the definition developed for the knowledge measure (described below) and provided feedback and editorial suggestions before its final use.
13.2.2. Knowledge of Succession Plan
We measured participants’ knowledge of SP based on a 5-point Likert scale (1 = “No knowledge” to 5 = “Full understanding), and participants rated the amount of perceived knowledge they had regarding their organization’s SP.
13.2.3. Perceived Organizational Support
POS was measured using
Eisenberger et al.’s (
1986) short (8-item) version of the Survey of Perceived Organizational Support (SPOS). Participants used a seven-point Likert scale (1 = strongly disagree; 7 = strongly agree). Four of the eight items were reverse-scored. Two example items are “the organization values my contribution to its well-being” and “the organization fails to appreciate any extra effort from me” (reverse-scored). Thus, participants could have a total score of anywhere from 8 to 56. A Cronbach’s alpha of 0.93 was attained, and
M POS was 45.79, ranging between 18 and 56 (
SD = 9.74).
13.2.4. Organizational Size
One item, which asked participants to estimate the number of worldwide employees currently employed by their employer, was used to measure organizational size.
13.2.5. Organization Type
One item asked participants to select the type of company they worked for from a list of seven organization types. This included items such as non-profit organizations, for-profit organizations, and government. Employees who worked at non-profit or for-profit organizations were utilized in this study, as this was the chosen moderator variable.
Demographics. Background characteristics were gathered, including age, gender, race, employment status, years of experience, and job title.
14. Results—Study 2
We first present evidence addressing the research goal of measure/scale development, then present results from hypothesis testing. Additionally, three potential moderating relationships of the variables, type of organization, organizational size
3 (
M = 33,279.14,
SD = 80,921.63; Median = 600.00), and knowledge of SP (
M = 3.60,
SD = 1.07) on the relationships between SP perceptions and POS, were examined.
Table 8 includes the correlations, means, and standard deviations for all variables, including continuous and two-level categorical demographics, as well as the coefficient alpha for POS. It is not appropriate to use Cronbach’s alpha as a measure of internal consistency for checklist-type scales (cf.,
Spector & Jex, 1998), as items are not conceptually nor relatively interchangeable. We, therefore, provide psychometric evidence from other forms of analysis to support the psychometric soundness of our measure.
On average, participants checked two items (
M = 2.18) on the informal SP description checklist (
SD = 1.69) and three items (
M = 3.23) on the integrated SP description checklist (
SD = 2.24; see
Table 8). The average rating on the overall rating of SP was 3.16 (
SD = 1.25). As well, a review of the percentages of items checked “yes” versus “no” (see
Appendix A), shows clearly that many more integrated items than informal items were checked, generally: overall, four out of seven of the integrated items had greater than 50% of respondents checking “yes,” while only one informal item (out of eight) received over 50% yes. More than half of the participants responded that the following existed in their organizations (see
Appendix A): assessments of employees based on personal knowledge—informal; senior management is actively involved—integrated; assessments based on formal review—integrated; extensive training and education opportunities—integrated; and employee development specifically planned out—integrated.
The overall rating of the SP had a significant positive relationship with the number of items checked on the integrated SP checklist, r(96) = 0.76, p < 0.01, and had a significant negative relationship with the number of informal SP checklist items checked, r(96) = −0.65, p < 0.01. Therefore, the more integrated items that were checked on the checklists, the more the SP was rated as integrated on the Likert scale, offering some convergent validity evidence. Additionally, there was a significant negative relationship between the number of items checked on the integrated SP checklist and the number of items checked on the informal SP checklist, r(96) = −0.48, p < 0.01, indicating that the two checklists measured different constructs, as intended. We also conducted chi-square analyses, and there were non-significant chi-square results, which revealed that no one item on the informal or integrated succession list had a relationship with a median split POS, suggesting that the measure’s value is holistic.
Hypotheses were tested by utilizing simple linear regression analysis and multiple regression analysis (with the exception of Hypothesis 2a, which was tested with a Pearson correlation) using Hayes PROCESS macro (
Hayes, 2017). Method type (MTurk and word-of-mouth) and organizational size were controlled for in the analyses, where they were not main variables (except for the simple linear regressions since a multiple regression was run with all variables where the covariate was included). This was done because of the significant relationship between the method type on POS and between organization size and POS.
Hypothesis 1 predicted that employees’ perceptions of a higher level of integrated SP will be positively related to POS, and higher levels of perceptions of informal SP will be inversely related to POS. Both the number of items on the integrated SP checklist description, R2 = 0.06, B = 1.02, b = 0.23, t(94) = 2.33, p < 0.05, and the overall SP rating, R2 = 0.04, B = 1.59, b = 0.20, t(94) = 2.02, p < 0.05, were significantly positively related to higher levels of POS. Overall, there was significant statistical support for Hypothesis 1, even when controlling for sample/method, with both operationalizations of SP type.
Hypothesis 2a predicted that greater employee knowledge of their organization’s SP would be associated with greater POS. This was supported through the significant positive correlation between the two: r(93) = 0.35, p < 0.01.
Hypotheses 2b, 3, and 4 predicted three moderation effects utilizing organization type, organization size, and knowledge of SP as moderators. However, hierarchical regression did not reveal significant moderation for any of these hypotheses. Yet, both the number of items checked on the integrated SP checklist, r(96) = −0.40, p < 0.01, and the overall rating of SP, r(96) = −0.33, p < 0.01, had significant negative relationships with organization type, indicating that non-profit organizations tended to have fewer aspects of an integrated SP. The number of items checked on the integrated SP checklist, r(95) = 0.49, p < 0.001, and the overall rating of the SP, r(95) = 0.35, p < 0.001, had significant positive relationships with organization size. In alignment with this finding, the number of items checked on the informal SP checklist had a significant negative relationship with organization size, r(95) = −0.25, p < 0.05. These results indicate that larger organizations tended to have more aspects of integrated SPs rather than informal SPs. The number of items checked on the integrated SP checklist, r(96) = 0.30, p < 0.01, and the overall rating of the SP, r(96) = 0.24, p < 0.05, had significant positive relationships with the amount of knowledge regarding SP. Additionally, the number of items checked on the informal SP checklist had a significant negative relationship with the amount of knowledge regarding SP, r(96) = −0.19, p < 0.05. These results indicate that participants with more knowledge of their company’s SP tended to work at organizations they perceived as having more aspects of integrated SPs rather than informal ones.
Lastly, the variables were analyzed to determine significant relationships with the dependent variable, POS. There was a significant positive relationship between ratings of organization type and POS, r(96) = 0.19, p < 0.05, indicating that there were greater ratings of POS in non-profit organizations than in for-profit organizations. There was a significant positive relationship between ratings of POS and the amount of knowledge regarding SP, r(96) = 0.35, p < 0.01, indicating that the more knowledge the participants had regarding SP, the higher their POS. Both the number of items checked on the integrated SP checklist, r(96) = 0.23, p < 0.05, and the overall SP rating, r(96) = 0.20, p < 0.05, had significant positive relationships with ratings of POS. In alignment with this finding, there was a significant negative relationship between the number of items checked on the informal SP checklist, r(96) = −0.23, p < 0.05 and ratings of POS.
15. Discussion—Study 2
Importantly, these findings complement and extend Study 1 findings by extending the role of TM systems from fairness-based evaluations to broader organizational attitudes. Study 1 showed that inclusive TM practices enhance perceived fairness and procedural justice, while Study 2 demonstrates that when these practices are operationalized through structured systems such as SP, they also shape employees’ overall perceptions of organizational support.
Specifically, our Study 2 results demonstrated that more integrated SP systems are associated with higher levels of POS, as well as showed that employees can reliably distinguish between fully planned (integrated) and loosely planned (informal) SP processes. These findings suggest that employees not only distinguish between different types of SP systems but also interpret more structured and transparent systems as signals that the organization values and supports them. Further, we developed a practically useful tool that organizations can use to measure employee perceptions regarding their organization’s SP processes. Our moderation hypotheses were largely unsupported, suggesting opportunities for future research (discussed below).
We note that participants generally endorsed more integrated items than informal, selecting, on average, almost half of the potential integrated items offered. Thus, our participants appeared to be employed by organizations moderately “on the road” toward fully integrated SP processes.
Regarding the relationships (of POS), the outcomes from the use of the two measurement methods largely were in parallel with each other, and they tended to be stronger for the overall Likert general SP rating. We argue that each mode of measurement is useful for specific differential practical purposes. A detailed checklist approach, such as we developed, would be helpful for diagnostic purposes, helping organizations home in on what aspects and efforts of their SP processes are perceived accurately and positively by their employees. A single-item Likert-scaled question can be a useful macro-level item, accurately gauging employees’ broad, overall perceptions (much like a single-item measure of job satisfaction;
Wanous et al., 1997).
Notably, there was greater POS among non-profit organizations and more informal SPs. It may be that SP is thus less important to employees in nonprofits than for-profits, as employees’ underlying work motivation and values are focused on intrinsic factors, like personal fulfillment, rather than extrinsic factors, like career advancement. We discuss implications, limitations, and future research avenues more extensively in the general discussion below.
16. General Discussion
Together, these studies underscore a vital narrative in modern human resources: transparency, inclusion, and structured development are paramount. Study 1 illustrates that inclusive talent management practices are essential for maintaining procedural justice and perceived fairness across the workforce. The second study extends this framework by demonstrating that when an organization operationalizes inclusivity through highly integrated and communicative succession planning, employees reward the organization with higher perceived organizational support. Ultimately, organizations that view talent management not as an exclusive mechanism for a select few but as an integrated, transparent developmental pathway for all are best positioned to foster a committed, trusting, and supported workforce.
Employee perceptions are integral to developing and evaluating organizational policies and procedures (
Eriksson & Kovalainen, 2015;
Jiang et al., 2017). The literature has considered perceptions of procedural justice, (and organizational justice theory—OJT—in general), critical as it pertains to equity in the workplace and outcomes associated with strong or poor justice as a result of less inclusive talent management strategies (
Arnold & Spell, 2006;
Bhatia & Baruah, 2020;
Fasih et al., 2021;
Greenberg, 1987;
Leventhal, 1976;
Malik & Singh, 2022;
McFarlin & Sweeney, 1992;
O’Connor & Crowley-Henry, 2019;
Skarlicki & Folger, 1997;
Swailes, 2020). We substantiated and extended the nomological network of these relationships across both studies, showing the importance of inclusivity, fairness, justice, and perceptions that the organization “has the employees’ backs” when investing resources into their TM (broadly) and SP (targeted) processes.
Talent management strategy and OJT remain highly relevant. Practically, it is often impossible to engage in a fully inclusive strategy, which paradoxically may be recommended because of the positive outcomes. Thus, the procedures utilized in selecting the employees included in TM practices must be considered and transparently communicated to reduce the negative outcomes that could accompany feelings of inequity or unfairness.
Communication implications arose across both studies. Recall the significant positive correlation between organizational level and both inclusive practice count and exclusive practice count. Perhaps this was found because managers and leaders are more aware of the practices offered by talent management and, in some cases, who may decide who is involved or allowed to engage in these activities. As well, there could be a lack of communication from the organization to lower-level employees, such that many entry- or associate-level workers are not informed about opportunities or included in the talent management strategy. This possibility aligns with the literature suggesting that knowledge sharing is hindered by hierarchical organizational structures (
Islam et al., 2015), such that executives share a certain amount of information with managers, who then give lower-level employees a limited amount of knowledge.
A related additional implication arises from Study 2 findings that demonstrate employees have more knowledge of the SP when the plan is more integrated, and that when they have more knowledge, they have higher levels of POS. These findings demonstrate the power of knowledge. By providing employees with greater transparency and communication surrounding their HR practices (
Sinclair et al., 2005), they can be sure that most employees are taking in the information and processing it.
Our results suggest that inclusive practices may mitigate negative views of selection procedures, which could assist in reducing attrition as well as other outcomes that could harm the productivity of the workplace and employee experience (
Maese & Emond, 2021). Further, more integrated SP practices are, by default, more inclusive, and thus, we can now add that inclusivity (through integration) is impactful on worker perceptions of how much their organization values them.
Furthermore, efforts to create effective TM and SP processes may fail if employees do not recognize what processes are in place or, worse, if processes are in place. If employees do not recognize an organizational goal or process as intended, they are like a runner showing up to a bike race and wondering where the finish line is. Essentially, employees’ goal-directed efforts may be misguided. The organization thus faces a gap between what is required of its employees and what employees are working towards.
Further extending the role of communication, we elucidated the importance of examining the
actual TM and SP practices offered by an employer, and comparing those to what employees perceive to be in place (see also discussion below regarding study limitations). The ability to provide opportunities to employees that are appealing and go beyond what is promoted by competitors can allow the company to “stand out” to applicants because talent considers developmental value more important than other factors, such as recognition and the organization’s social responsibility and values when job hunting (
Pingle & Sodhi, 2011). Further, the availability of practices has been associated with employees’ attraction to their current employer, such that greater availability of activities corresponded with increased attraction (
Quarton, 2013).
We also note that, practically speaking, organizations need not feel as if they have to hire external agencies (with a concomitant higher cost), as results indicated a number of practices that are somewhat underutilized despite being available with internal resources. For instance, 360-degree feedback was only present in 36% of workplaces represented in the survey, but it is a program that could be performed by a manager in conjunction with the employees’ coworkers, clients (if any), and subordinates (if any).
Thus, knowledge of TM practices births a major opportunity for organizations to assess their current TM strategy and determine how they can tailor their offerings to keep and develop their talent. The desire for developmental opportunities present in the qualitative results further supports the need for companies to invest in their employees in such a way that benefits the workers and the company. And succession plans are just one such investment.
This research study also supports the now foundational evidence regarding POS, and a “new player” to that theoretical landscape: we demonstrated that good SP boosts employee POS. More specifically, it showcases the value of creating and implementing a more integrated SP instead of a more informal one. More integrated SPs can provide employees with stability during times of change. It can also provide structure and transparency to develop and grow within the organization.
We also note the practical usefulness of our measures (developed from the extant literature. In Study 1, we developed a creative and fairly simple way to measure the inclusivity of TM practices, providing both practitioners and researchers alike with concrete operationalizations, easy to implement and utilize.
In Study 2, we developed a diagnostic tool that organizations can utilize for multiple purposes. Examining the frequencies with which employees check items would be extremely valuable in narrowing where the organization is currently strong regarding its SP processes, and where it might capitalize on investing more resources. This tool can be a first step in the diagnostic process for larger organizations or used with structured interviews if the organization is small. Additionally, organizations can use the integrated versus informal checklist descriptors in focus groups or as open-ended qualitative probes. Our measures provide both a practically useful and theoretically sound instrument to aid organizations on their path toward employee thriving.
Primarily, we developed a useful tool for organizations to use diagnostically and argue that organizations can use the tool for multiple purposes. First, we suggest organizations examine whether opposing items were checked to validate results. For example, employees should not check both “assessments of employees are highly subjective,” and “Assessments of employees are based on formal assessment methods.” Examining the frequencies that participants checked items would be extremely valuable in narrowing where the organization is currently strong regarding its SP processes and where they need more work. In our frequency analysis, we showed both disappointing and heartening results: items checked most commonly (>50%) were, broadly speaking, all critical and known good leadership and HR practices: importance of senior management involvement (
Barnett & Davis, 2008;
Rhodes & Walker, 1984); importance of thorough employee evaluation processes; and importance of investing in employee development and training (
Barnett & Davis, 2008;
Karaveli & Hall, 2003;
Rhodes & Walker, 1984). Thus, our results support the importance of evidence-based practices, known good HR practices (
Saks, 2022).
Also, examining employees’ perceptions across different subgroups within a single organization, such as management versus non-management, or “older” versus “younger” workers, would help organizations do an even deeper dive sort of diagnosis, much like a paid consultant would provide.
Second, we argue that in conjunction with key qualitative research methods, the checklists’ utility and diagnostic value would increase and only require minimal adjustments. For example, our tool can be a first step in the diagnostic process for larger organizations or used with structured interviews if the organization is small. Additionally, organizations can use the integrated versus informal checklist descriptors in focus groups or as open-ended qualitative probes. For example, if an employee checked, “assessments of employees are based on formal assessment methods,” probing further by asking employees to briefly list how that process works will provide more in-depth information about employees’ perceptions of a company’s SP processes. Based on these suggestions, we see immediate pragmatic value for our tools.
This research study also supports the idea that good SP boosts employee POS. More specifically, it showcases the value of creating and implementing a more integrated succession plan instead of a more informal one. More integrated succession plans can provide employees with stability during times of change. It can also provide structure and transparency to develop and grow within the organization. Yet, it is important to note that researchers have argued that organizations reap the most benefit from their succession plan if the amount of structure and integration aligns with their culture (
Karaveli & Hall, 2003) and organizational type (
Rhodes & Walker, 1984). The current research demonstrates that more integrated succession plans are related to greater POS. While future research should examine the workings of this relationship, it can be recommended that organizations seek at least to identify which aspects of more integrated succession plans they should incorporate into their SP process. For example, it may be necessary for organizations to at least incorporate providing a career development path for employees to benefit the organization and support its employees (
McDonald & Hite, 2005).
The results of Study 2 also provide general support for the predictive validity of our SP measure, showing the positive relationship between more integrated succession plans and employee POS. After utilizing a stepwise regression analysis, the results provided a unique and informative finding. When the two operationalizations of succession plan type were examined independently through separate simple linear regressions, the overall succession plan Likert rating demonstrated a stronger relationship to ratings of POS. But when the two operationalizations were analyzed together, using stepwise multiple regression, only the integrated succession plan description checklist demonstrated a significant relationship with POS. The stepwise multiple regression follow-up results highlight the value of the checklists as a measure of succession plan type and reinforce the relationship between SP and employee POS. Lastly, the practical implications of this research are particularly salient to the rapidly evolving technological and regulatory environments. As organizations increasingly adopt AI-driven tools for talent identification, performance evaluation, and succession planning, the transparency and perceived fairness of these systems become even more critical. Algorithmic decision-making may unintentionally reinforce exclusive approaches if criteria are opaque or biased, potentially undermining employee perceptions of fairness and support.
At the same time, AI-enabled systems offer opportunities to scale more inclusive talent management practices by identifying broader pools of potential and standardizing evaluation criteria. Our findings suggest that regardless of the tools used, organizations must prioritize clarity, communication, and employee understanding of these systems to ensure positive attitudinal outcomes.
Additionally, shifting regulatory expectations around fairness, equity, and accountability in HR practices may further push organizations toward hybrid models of talent management that balance efficiency with inclusivity. Our results highlight that how these systems are perceived, not simply how they are designed, will be essential to determine their effectiveness.
17. Limitations
Study 1’s limitations include an American-only sample, a non-exhaustive list of talent management practices, imprecision about the “unsure” option choice, and a lack of additional data, which would have provided fodder for a more nuanced discussion of TM practices surrounding exactly
which TM practices were viewed as more or less fair
4. Additional practices, such as internal career fairs and one-on-one meetings, may also shape perceptions of inclusivity and fairness, but were not captured in the current measure. It was impossible to know if individuals selecting “unsure” responded this way because the practice does not exist, it is not promoted by TM, or it does exist, and the person is not included in the activity.
In addition, concerns have been raised regarding the increasing prevalence of AI-generated or AI-assisted responses in online data collection platforms, which may introduce noise or systematic bias in survey data. Importantly, the data for the present studies were collected prior to the widespread adoption of generative AI tools, reducing the likelihood that such influences affected our findings. Nevertheless, as the use of AI continues to expand, future research should adopt emerging best practices for detecting and mitigating these risks and continue to employ multi-source, longitudinal, or experimental designs to further reduce potential method bias and strengthen causal inference.
Study 2’s limitations include a small sample size and the screening tool through MTurk, which resulted in large amounts of lost data (yet which was critical for high-quality and accurate data). Utilizing a screening survey through MTurk provided challenges and a great loss of participants, yet it was critical for high-quality and accurate data. Word-of-mouth for recruiting part of the sample may have caused a skew in the results, as many non-profit participants, such as the Unit Director or President, were in positions of power. Leaders within organizations often exhibit a sense of “over-optimism” about their organizations (
Barnard, 2008), which may lead to them exhibiting more positive perceptions of organizational support than lower-level employees. Yet, we argue that having two distinct samples and examining them collectively and separately (with the data type as a covariate), as well as the careful vetting process, results in diverse, high-quality data, which addresses some concerns with typical cross-sectional data.
As alluded to above, specifically regarding knowledge of SP as a moderator, we did not consider the distinction between
perceived knowledge and
actual knowledge. Participants reported a high amount of knowledge about the SP, but they may have overestimated their actual knowledge. Alternatively, because perceptions often play a greater role in impacting our judgments than reality (
Kahneman, 2011), the participants’ actual knowledge about the SP only played a minor part in forming their POS.
Across both studies, the relatively small sample sizes and resultant restricted variance in context somewhat limit generalizability and resultant practical implications, which we discuss below in future research. We also note that our sample sizes contributed to weakened statistical power, which may have been partly responsible for the moderator hypotheses being unsupported.
Also across both studies, our moderator analyses with chosen demographic variables were unsupported (Study 1, gender; Study 2, organization type, organization size, knowledge of SP practices). Regarding gender as a moderator for the first study, it was predicted that the model would be stronger for females when compared to males. While results did not support this, other aspects of the analysis provide insight. A significant correlation was observed between gender and both perceived fairness and perceptions of talent management strategy, suggesting that females perceive their company’s talent management as more fair and more inclusive compared to males. These findings could hint that males are accustomed to equity and being included in practices and, thus, may not be as aware of the fairness of talent management because of the research suggesting that talent management has held a “masculine edge” (
Festing et al., 2015;
Makarem et al., 2019;
Sheehan & Anderson, 2015). Another possibility is that practices aiming to increase fairness focus more on females than males, which could be perceived as unfair by males, as they may not perceive as much benefit to them. As diversity and equity initiatives have developed throughout time, it could be that female perceptions of inclusion and fairness are improving.
In Study 2, none of the three moderator hypotheses were supported. We already addressed our thoughts regarding knowledge (versus perceptions) above. Here, we provide our thoughts regarding organization type and size. Although organization type did not moderate the relationship between succession plan type and POS, as for gender in Study 1, correlation analyses provide insights. The correlation analyses demonstrated that there was a significant positive relationship between organization type and POS, such that there were greater reported levels of POS in non-profit organizations. Additionally, the analyses demonstrated that there was a significant negative relationship between organization type and integrated succession plans, such that there were fewer integrated, or more informal, succession plans in non-profit organizations. These two findings are in opposition to the first hypothesis, which proposed that more integrated succession plans lead to greater POS. These results demonstrate that among non-profit organizations, while there is greater POS, there are more informal succession plans. This can also explain why there was no significant interaction and moderation of organization type, as the findings were significant in the opposite direction. While these findings are contradictory to what was proposed, they can possibly be explained by examining the typical composition of non-profit organizations and their employees. As the data from the Bureau of Labor Statistics demonstrated, service workers in non-profit organizations typically receive greater compensation, both through wages and benefits, than service workers in for-profit organizations (
Bishow & Monaco, 2016). In general, greater satisfaction with pay has been demonstrated to be related to positive work outcomes such as job satisfaction, discretionary effort, interpersonal helping, and affective commitment (
Ren et al., 2017). Therefore, it is plausible to expect that employees in nonprofits who are receiving greater wages will have higher levels of various work-related outcomes. Additionally, employees of non-profit organizations often have greater intrinsic motivation and feel more personally connected to their work and the mission (
Leete, 2000). It may be that non-profit organizations and the employees they often attract exhibit such substantially greater benefits and attractiveness that any potential impact succession planning could have is thereby “washed out”.
The potential moderating effect of organizational size was also not supported. It is possible the relationship failed to demonstrate an effect because the main effect of the type of succession plan caused a strong enough impact on POS that it was not affected by organizational size. Such enriched succession plans may lead to greater POS regardless of the size of the organization where the employee works. Whether large or small, if the organization has an integrated succession plan, employees may perceive the benefits to them and feel supported.
18. Future Research
Broadly speaking, although we did find support for nearly all our hypotheses, making sample size limitations (statistically) moot, we note that by default, our results are quite limited in scope regarding how they generalize across cultures and demographic differences. Quite simply, sampling across a wider range of individuals from different cultures and occupations, and perhaps examining those aspects as predictors and/or moderators, would expand our generalizability greatly. Our studies represent the first step in examining the issues we did, utilizing the tools we developed, and should be considered a stepping stone in these lines of inquiry, in much need of replication and expansion.
In our first study, we did not explore differences between participants included in exclusive TM practices and those omitted. Specifically, when an exclusive approach is utilized, it would be important to examine the attitudes of individuals supported by talent management compared to those excluded from the programs. Research has explored the topic lightly and would benefit from deeper analysis to clarify how inclusion status shapes fairness and justice perceptions (
Swailes, 2020).
A second future direction is to explore the role of interactional justice when decisions are being made. Interactional justice refers to the manner in which information pertaining to the decision-making process is shared and the perceived quality of the interactions (
Skarlicki & Folger, 1997). Interactional justice has been found to mediate the relationship between exclusive TM and employee engagement and shares a positive relationship with organizational commitment (
Gelens et al., 2013;
Rød & Wergeland, 2023). Thus, future studies should incorporate interactional justice to clarify its role alongside fairness and procedural justice.
Third, regarding when employees selected “unsure,” future research may benefit from employee–manager dyads to clarify whether uncertainty reflects lack of visibility, lack of access, or the absence of the practice altogether. Building upon that information would clarify whether a simple fix, such as more targeted communication, is appropriate, versus actually building out more inclusive TM practices compared to present offerings.
For Study 2, future research could build upon our checklists for additional development, perhaps including items that conceptually were derived from the middle types, as long as these could be kept in distinct categories. Future research should also seek to ascertain further the actual level of importance each piece of the integrated SP process is, broadly speaking, as well as which portions are selectively predictive, potentially of different attitudinal or motivational outcomes. For example, perhaps the development of employees is most important in predicting POS, while transparent record-keeping is most important for predicting perceptions of procedural justice.
Future research should continue to examine the relationship between the type of SP and POS and other work attitudes through other moderators, such as employee position or tenure, employee age, or even employee disposition. For example, proactive personality, which is positively related to job crafting (
Bakker et al., 2012)—actions employees take to shape their jobs to be more in line with their goals and values (c.f.,
Wrzesniewski & Dutton, 2001), has an intuitive connection with knowledge of TM and SP practices. Indeed, research within the family-owned business context (
Marler et al., 2017) suggests that those high in proactive personality might be more adept at navigating the emotionally fraught and logistically challenging situation of succession in a family-owned business environment. Future research should also seek to reexamine the moderator of organizational size, as the current study was limited in terms of its participants from non-profit organizations, in that they were mainly in leadership positions. Additionally, it would be interesting to examine whether the employee completing the survey is included in the SP process. As SP typically incorporates high-potential employees, they may have a different perspective or take on the organization and the employees’ POS. Future research should seek to determine if and what impact this may have on the findings.
Another interesting area of research could be examining SP’s effects on job performance through POS. As POS impacts job performance (
Barnett & Davis, 2008), and we now know that integrated SPs impact POS, there is potential for research to demonstrate an empirically supported mediated connection between these variables.
As well, collecting nuanced data regarding individual practices and fairness/justice perceptions (for both TM and SP) would have painted a more holistic picture. For example, it would be relatively simple, given our current measurement tools developed/used in both studies, to examine exactly which practices are viewed as more or less fair and/or just, thus contributing to the nomological network of underlying relationships examined across these two studies. Such data would practically help organizations know where the “bigger bang for the buck” lies regarding which practices might have the most impact, thus being worth considering a heftier investment of resources.
Across both studies, examining employees’ perceptions across different subgroups—as main effects or moderators—within a single organization, such as management versus non-management, or “older” versus “younger” workers, was a primary focus. As well, gender differences continue to be intriguing, as females perceived their company’s talent management as fairer and more inclusive compared to males. Research has found a disparity between males and females regarding appreciation and respect for inclusive policies, such that females have a greater appreciation and more respect for these practices compared to males (
Mousa, 2021). As diversity and equity initiatives have developed, female perceptions of inclusion and fairness may be improving, reflecting increased appreciation for inclusive initiatives. Our call also includes expanding beyond the binary classification of gender, allowing for more nuanced examinations paralleling individuals’ lived experiences.
Another potential area of demographic interest, as well as a possible statistical moderator, includes the broad category of neurodiverse individuals. While this “classification” is at present overly broad (i.e., including those on the spectrum, those with learning disabilities, and those with ADHD or ADD), it offers a minefield of scientifically rich context to examine, as well as incredibly practically relevant implications. Potential future research examples evolving from this line of inquiry involve the following: Do those with ADHD generally prefer and/or fare better with more “hands-on/structured” developmental processes? Should a consideration for those on the spectrum be made for employee development feedback and discussions to occur differently (e.g., more or less frequently; not require a self-evaluation; offer alternative feedback channels such as AI-generated developmental advice)? Would captioning on training manuals improve comprehension and application? All of these demographic deeper dives (translating into theoretical and statistical moderators) would help organizations add additional value according to the organization’s context, current diversity climate and goals.