4.3. Mechanism Analysis
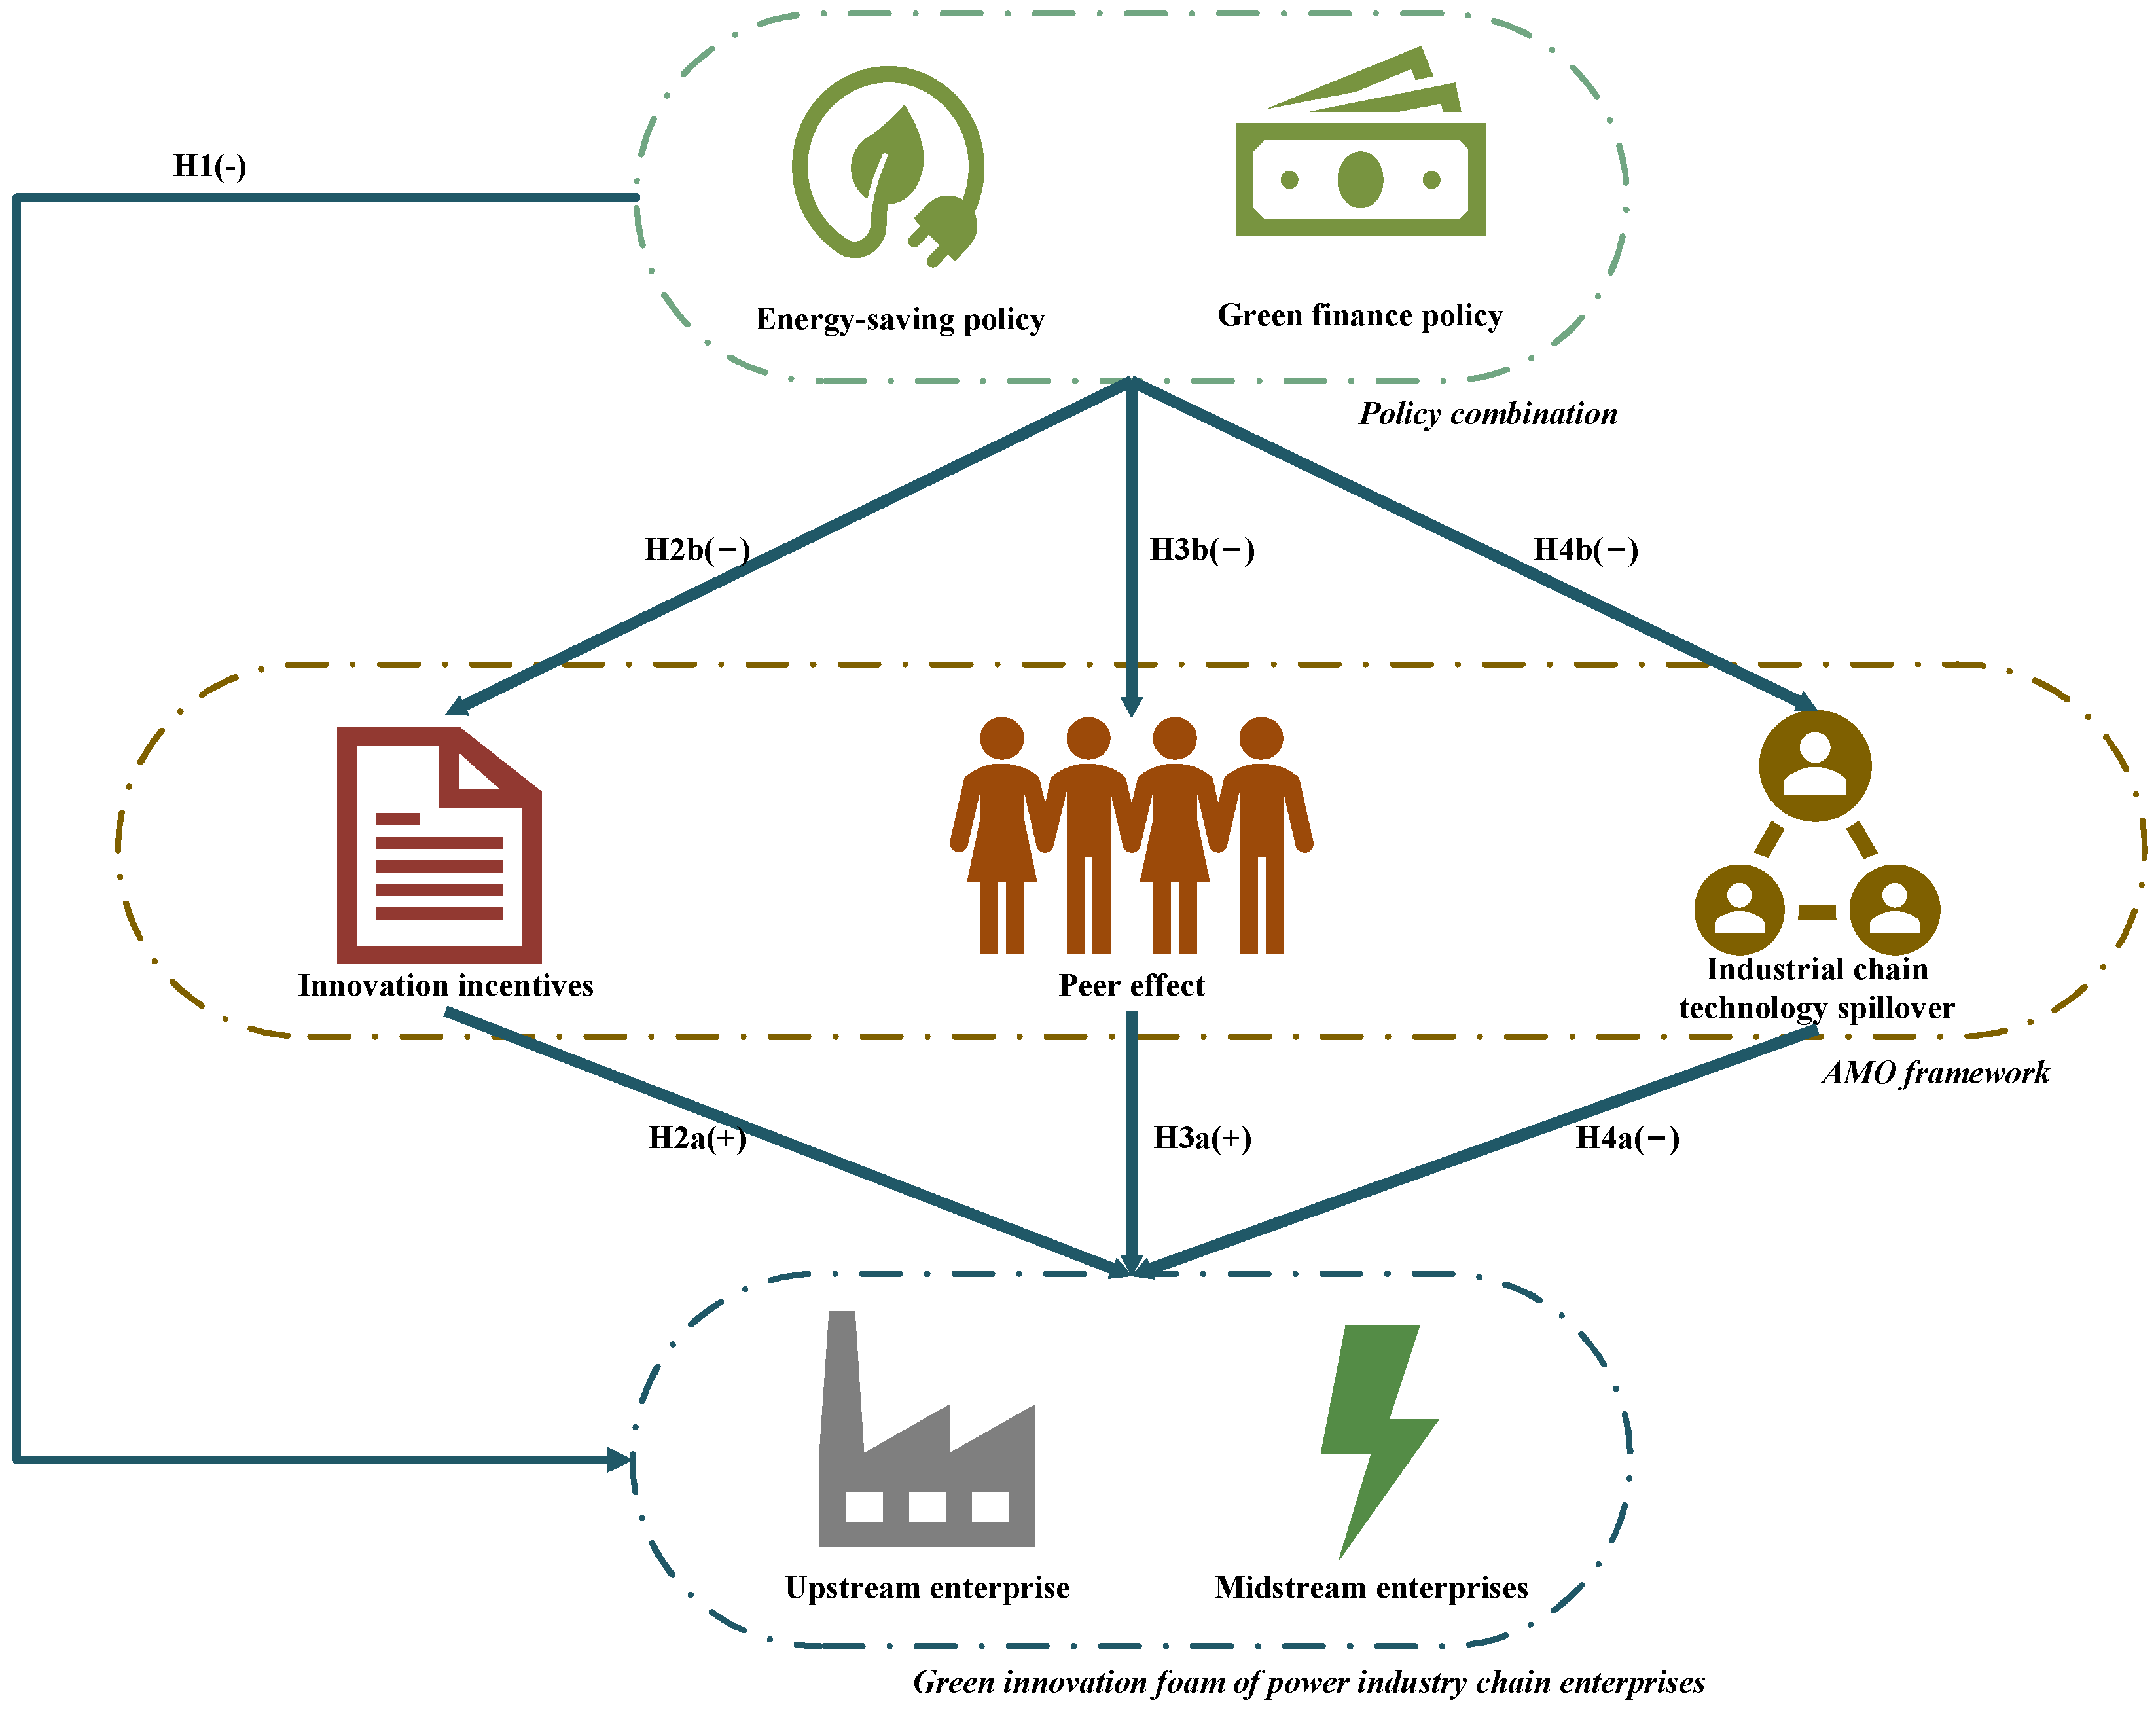
This paper constructs a mediation effect model to examine the relationship between policy combinations and the green innovation bubbles of power industry chain enterprises, viewed from the three dimensions of ability (A), motivation (M), and opportunity (O). The model also tests the mediating roles of innovation incentives, peer effects, and technology spillovers along the industrial chain.
The explained variable is the enterprise green innovation bubble (CGI_bub). Policy is the explanatory variable, including the energy-saving policy dummy variable (ESP) and the green finance policy dummy variable (GFP). M is a mediating variable, including government innovation subsidies (Subsidides), green finance level (Finance), carbon emissions of peer enterprises (Peer_Carbon), ESG scores of peer enterprises (Peer_ESG), forward spillover effects (F_Spill), and backward spillover effects (B_Spill). is a random interference term.
Following
Yuan et al. (
2025), this paper first employs multiple linear regression (LR) to estimate the mediation effect model. The regression results for the full sample are presented in
Table 4,
Table 5 and
Table 6. The first and second columns in
Table 4 examine the mediating effect of government innovation subsidies. The results show that
ESP and
GFP have a significant negative effect on
Subsidies and
CGI_bub at the 1% level, while
Subsidies has a significant positive effect on
CGI_bub at the 1% level. Columns 3 and 4 test the mediating effect of the urban green finance level. The results show that
ESP and
GFP have a significant negative effect on
Finance and
CGI_bub at the 1% level, while
Finance has a significant positive effect on
CGI_bub at the 1% level. This result validates assumptions 2a and 2b. From the perspective of capability (A), improvements in government innovation subsidies and the green finance level are often accompanied by a “fat cat effect”, which may lead to a green innovation bubble in the power industry chain. Policy combinations strengthen government supervision and management of innovation subsidies and green financial resources, thereby achieving the policy effect of bursting the green innovation bubble.
The first and second columns in
Table 5 test the mediating effect of carbon emissions from the peer enterprises. The results show that
ESP and
GFP have a significant negative effect on
Peer_Carbon and
CGI_bub at the 1% level, while
Peer_Carbon has a significant positive effect on
CGI_bub at the 1% level. The third and fourth columns examine the mediating effect of ESG ratings on peer enterprises. The results show that
ESP and
GFP have no significant effect on
Peer_ESG, but they have a significant negative effect on
CGI_bub at the 1% level.
Peer_ESG has a significant positive effect on
CGI_bub at the 1% level. This result verifies assumptions 3a and 3b. From the perspective of motivation (M), high carbon emissions from peer enterprises lead to free-riding behavior, which may breed a green innovation bubble. After the introduction of policy combinations, industry management becomes more stringent: peer carbon emissions decline, strategic innovation decreases, and the green innovation bubble shrinks accordingly. In addition, although peer ESG scores are positively associated with the innovation bubble, policy combinations do not generate a clear transmission effect through this channel.
The first and second columns in
Table 6 examine the mediating effects of forward spillovers. The results show that
ESP and
GFP have no significant effect on
F_Spill, but they have a significant negative effect on
CGI_bub at the 1% level, while
F_Spill itself has a significant negative effect on
CGI_bub at the 5% level. The third and fourth columns examine the mediating effect of backward spillovers. The results show that
ESP and
GFP have a significant negative effect on both
B_Spill and
CGI_bub at the 1% level, and
B_Spill also has a significant negative effect on
CGI_bub at the 1% level. The research results validate assumptions 4a and 4b. From the perspective of opportunity (O), backward spillover serves as an effective mediating channel through which policies restrain the bubble. This suggests that policy combinations are associated with the resolution of the innovation bubble by strengthening quality control of green innovation and providing upstream feedback. Although forward spillovers are also related to the resolution of the innovation bubble, they do not play a mediating role in the policy transmission process.
4.4. Interpretability Analysis
Referring to the research of
P. Zhang et al. (
2025), this paper uses Gradient Boosted Trees (GBT) and Shapley Additive Explanations (SHAP) for local interpretability analysis. The specific models are shown in the
Appendix A. To assess model accuracy, this paper compares the GBT model with Random Forest (RF), Decision Tree (DT), and Multiple Linear Regression (LR). The panel data of upstream and midstream enterprises in Chinese power industry chains from 2016 to 2023 are divided into training and testing sets at a 4:1 ratio. The learning rate is set to 0.1 to control the iteration update step size, and both the subsample sampling rate and the feature column sampling rate are set to 0.8 to enhance model generalization and robustness. The model’s prediction performance is shown in
Table 7. Among the four models, GBT achieves the highest R
2 and lower MAE, MSE, RMSE, and MAPE than the other models. Thus, the GBT model outperforms other models in prediction accuracy and error control, and its predictions better capture the underlying dynamics of the green innovation bubble under the influence of energy-saving policies and green finance policies.
Compared with linear regression analysis, SHAP analysis offers distinct advantages and is more necessary for explaining model results. SHAP is based on game theory and provides consistent and additive explanations for any complex model, including nonlinear and black box models. It can quantify the marginal contribution of each feature to the prediction results and reveal individual differences and overall importance rankings. This paper presents the SHAP-based interpretability analysis results using raincloud plots and scatter plots. A high absolute SHAP value for a given feature indicates that the feature is highly important for model prediction.
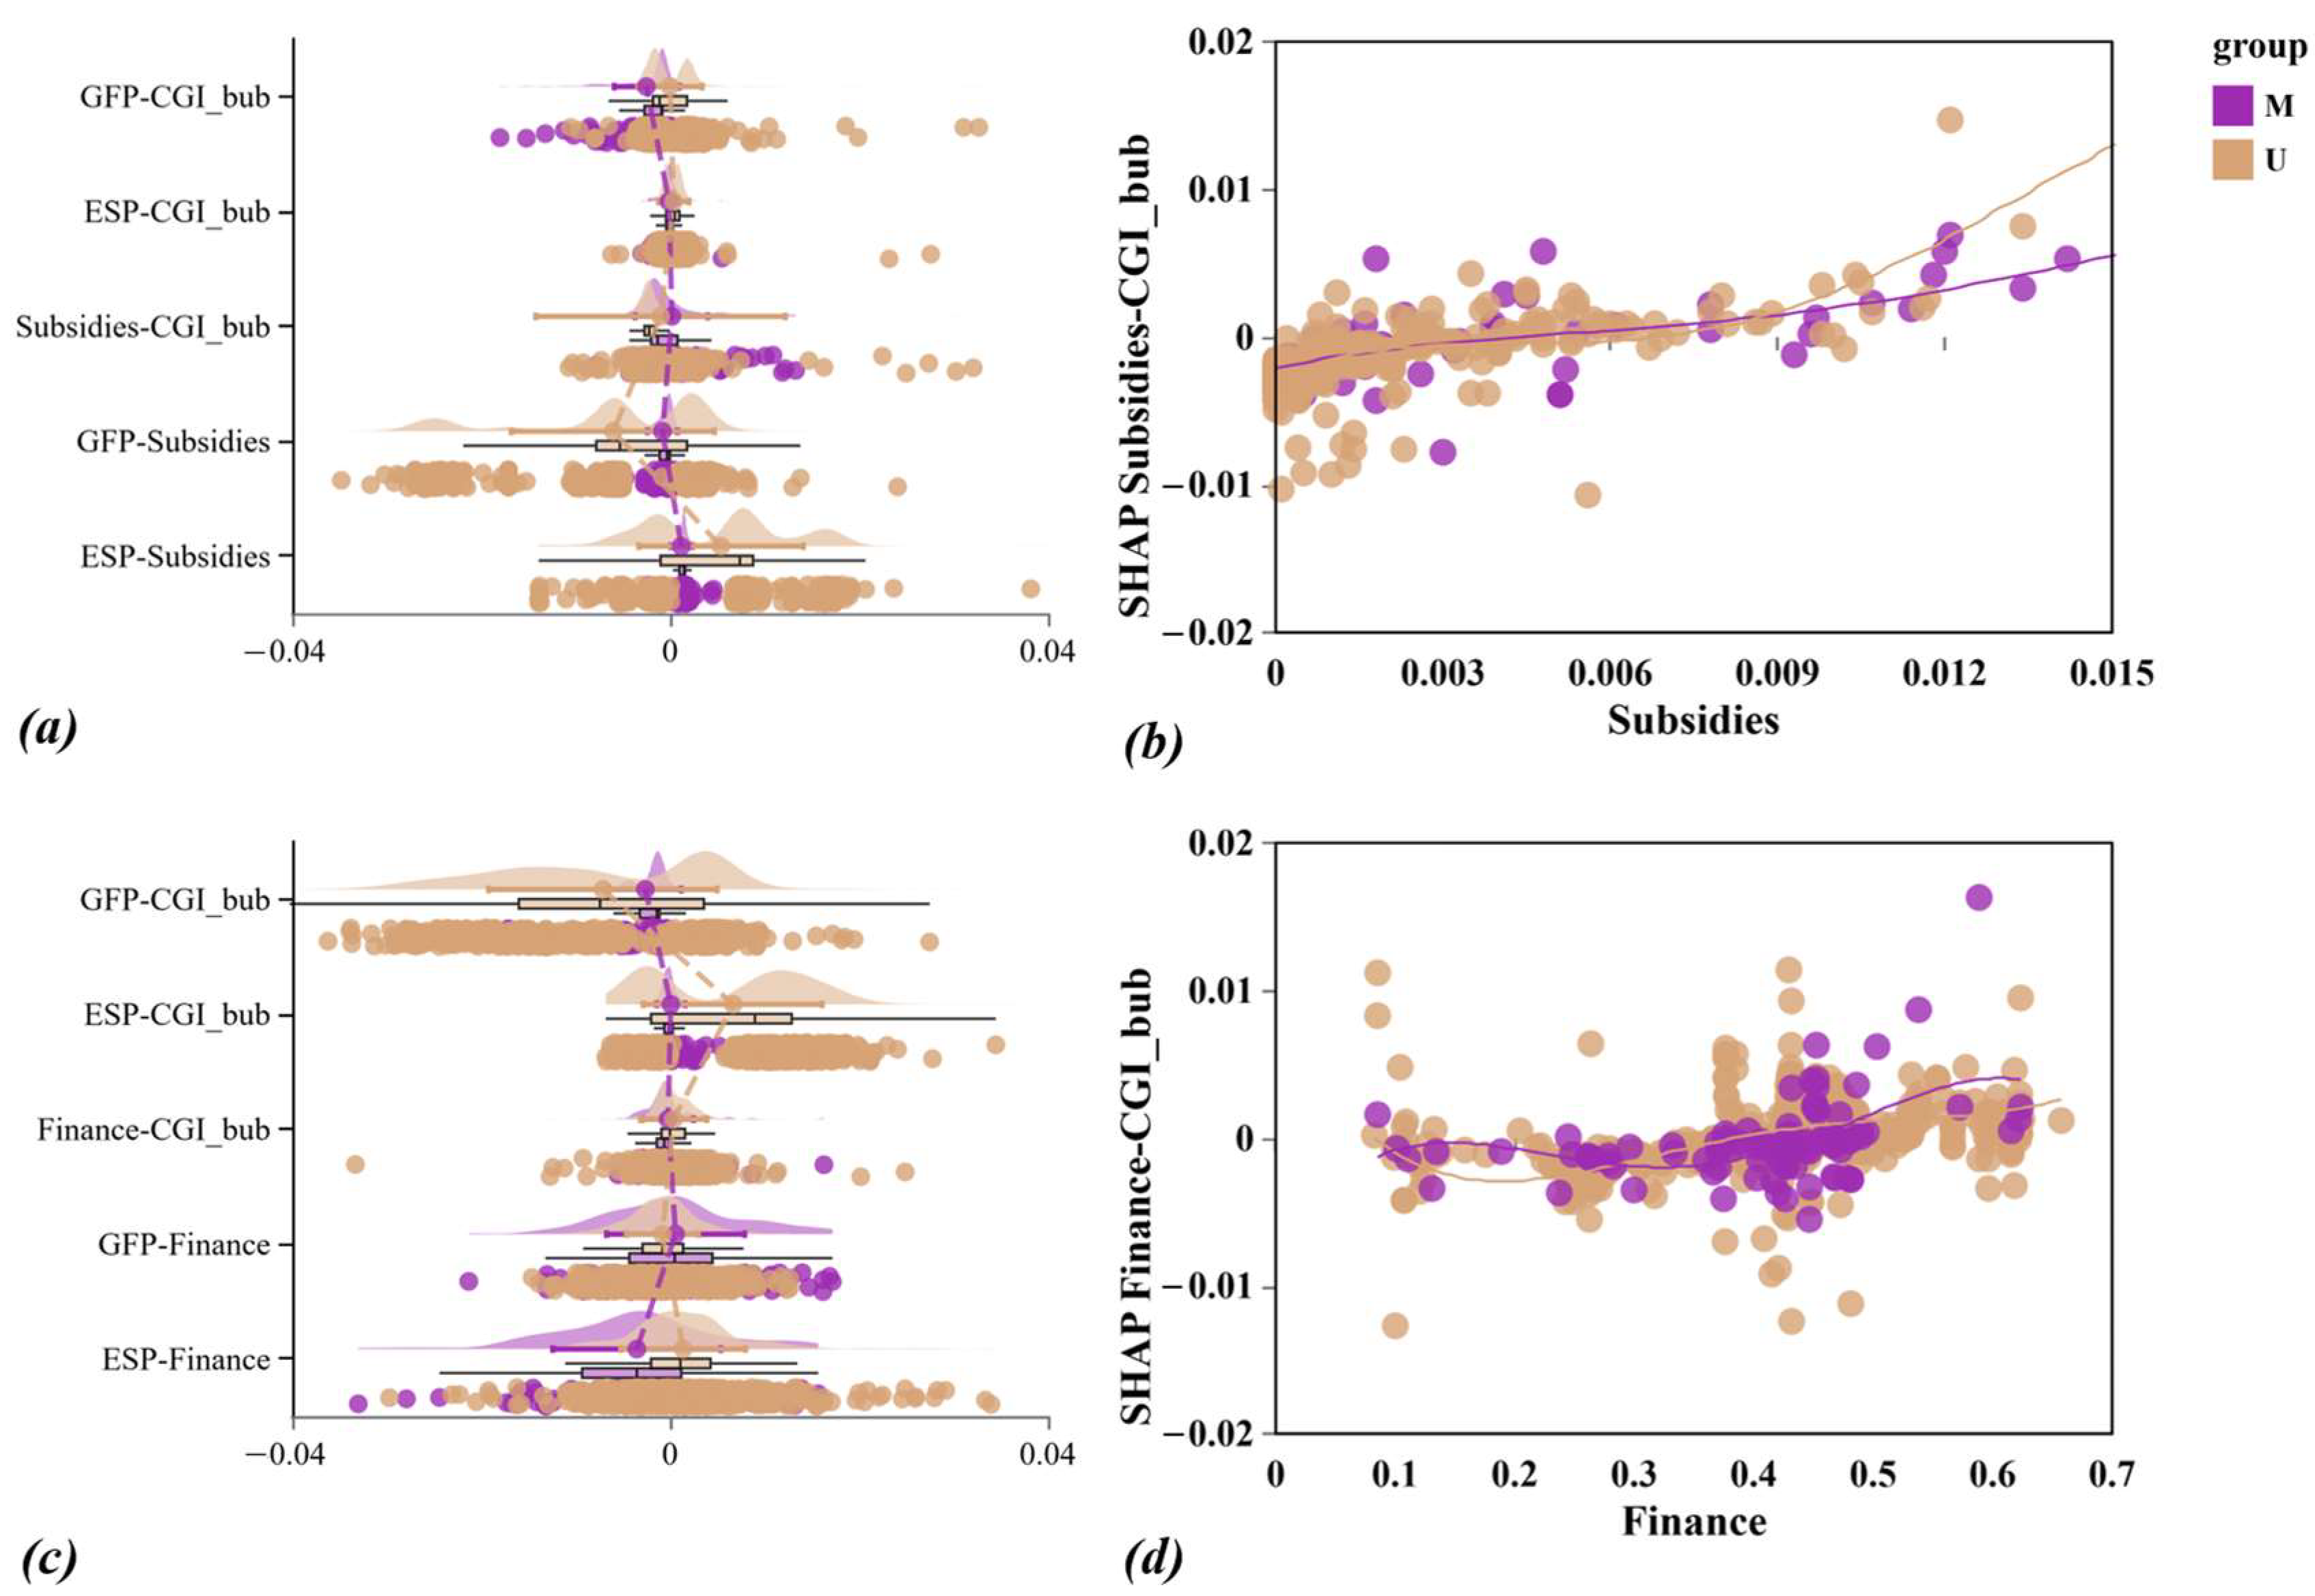
Figure 3 presents the interpretability analysis results for the mediating effects of government innovation subsidies and urban green finance level within the ability (A) dimension. In
Figure 3a, compared with midstream enterprises (M), upstream enterprises (U) have a larger mean absolute SHAP value of
Subsidies for
ESP and
GFP, indicating that government innovation subsidies have a more significant impact on upstream enterprises. In
Figure 3b, the SHAP values of
CGI_bub for
Subsidies are mainly distributed above zero and increase with
Subsidies. The SHAP values of upstream enterprises fluctuate more significantly. In
Figure 3c, compared with upstream enterprises (U), midstream enterprises (M) have larger mean absolute SHAP values of
Finance for
ESP and
GFP, indicating that urban green finance level has a more significant impact on midstream enterprises. In
Figure 3d, the SHAP values of
CGI_bub for
Finance are mainly distributed above zero and increase with
Finance. The SHAP values of midstream enterprises fluctuate more significantly. This result not only verifies the robustness of the findings in
Table 4, but also reveals that the policy transmission effect varies significantly across different links of the power industry chain. Upstream enterprises are more sensitive to changes in government subsidies, and subsidy growth significantly expands their green innovation bubbles. Midstream enterprises respond more strongly to the regional green finance level, and improvements in the financial environment significantly stimulate the formation of their bubbles.
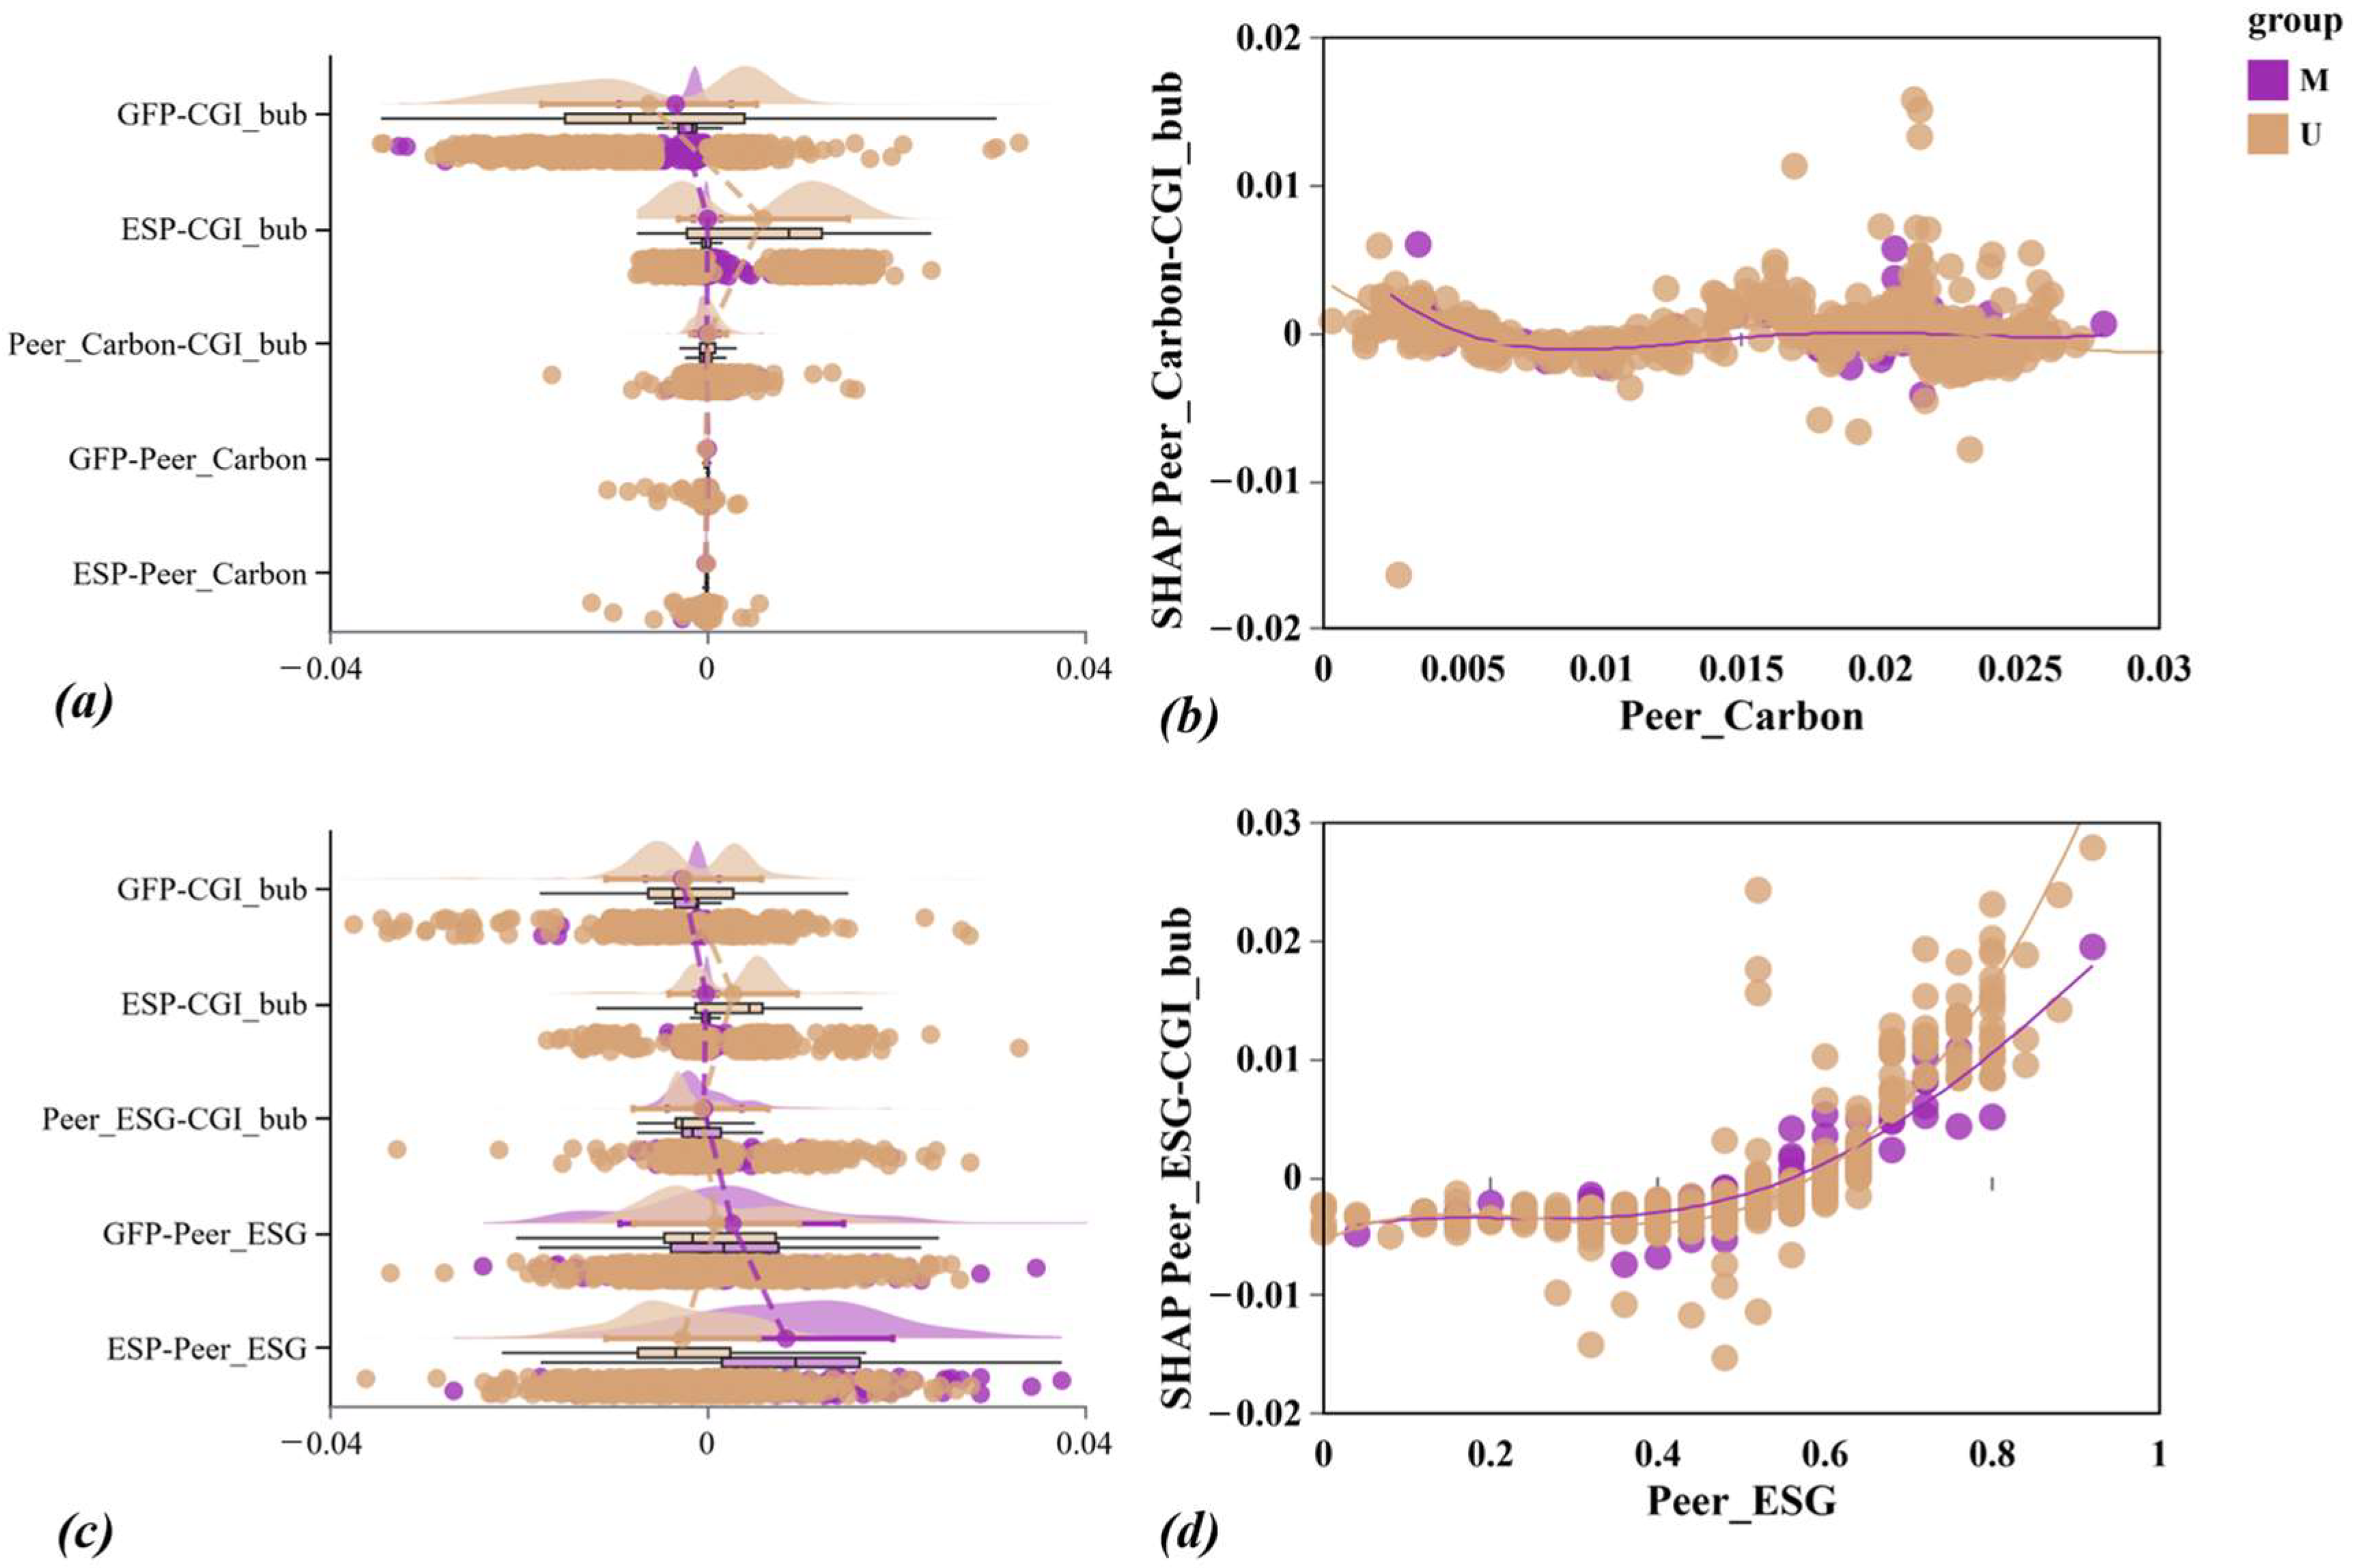
Figure 4 presents the interpretability analysis results for the mediating effects within the motivation (M) dimension, specifically for peer carbon emissions and peer ESG ratings. In
Figure 4a, the mean absolute SHAP values of
Peer_Carbon for
ESP and
GFP, as well as those of
CGI_bub for
Peer_Carbon, are near zero for both upstream (U) and midstream (M) enterprises. By contrast, the mean absolute SHAP values of
CGI_bub for
ESP and
GFP are relatively large for upstream enterprises. However, the mean absolute SHAP values of
CGI_bub for
ESP and
GFP are relatively large for upstream enterprises. In
Figure 4b, the SHAP values of
CGI_bub for
Peer_Carbon are mainly distributed above zero but slowly decrease as
Peer_Carbon increases. There is no significant difference in the fluctuation trend between upstream enterprises (U) and midstream enterprises (M). In
Figure 4c, compared with upstream enterprises (U), midstream enterprises (M) have a larger mean absolute SHAP value of
Peer_ESG for
ESP and
GFP, indicating that ESG scores have a more significant impact on midstream enterprises. In
Figure 4d, the SHAP values of
CGI_bub for
Peer_ESG are mainly distributed above zero and increase with
Peer_ESG. There is no significant difference in the fluctuation trend between upstream enterprises (U) and midstream enterprises (M). This result not only validates the robustness of the results in
Table 5, but also further demonstrates the heterogeneity of the mediating effect. The direct impact of policy combinations on the green innovation bubble of upstream enterprises is significant but not transmitted through the peer effect path, whereas their impact on midstream enterprises requires mediation through the peer effect channel.
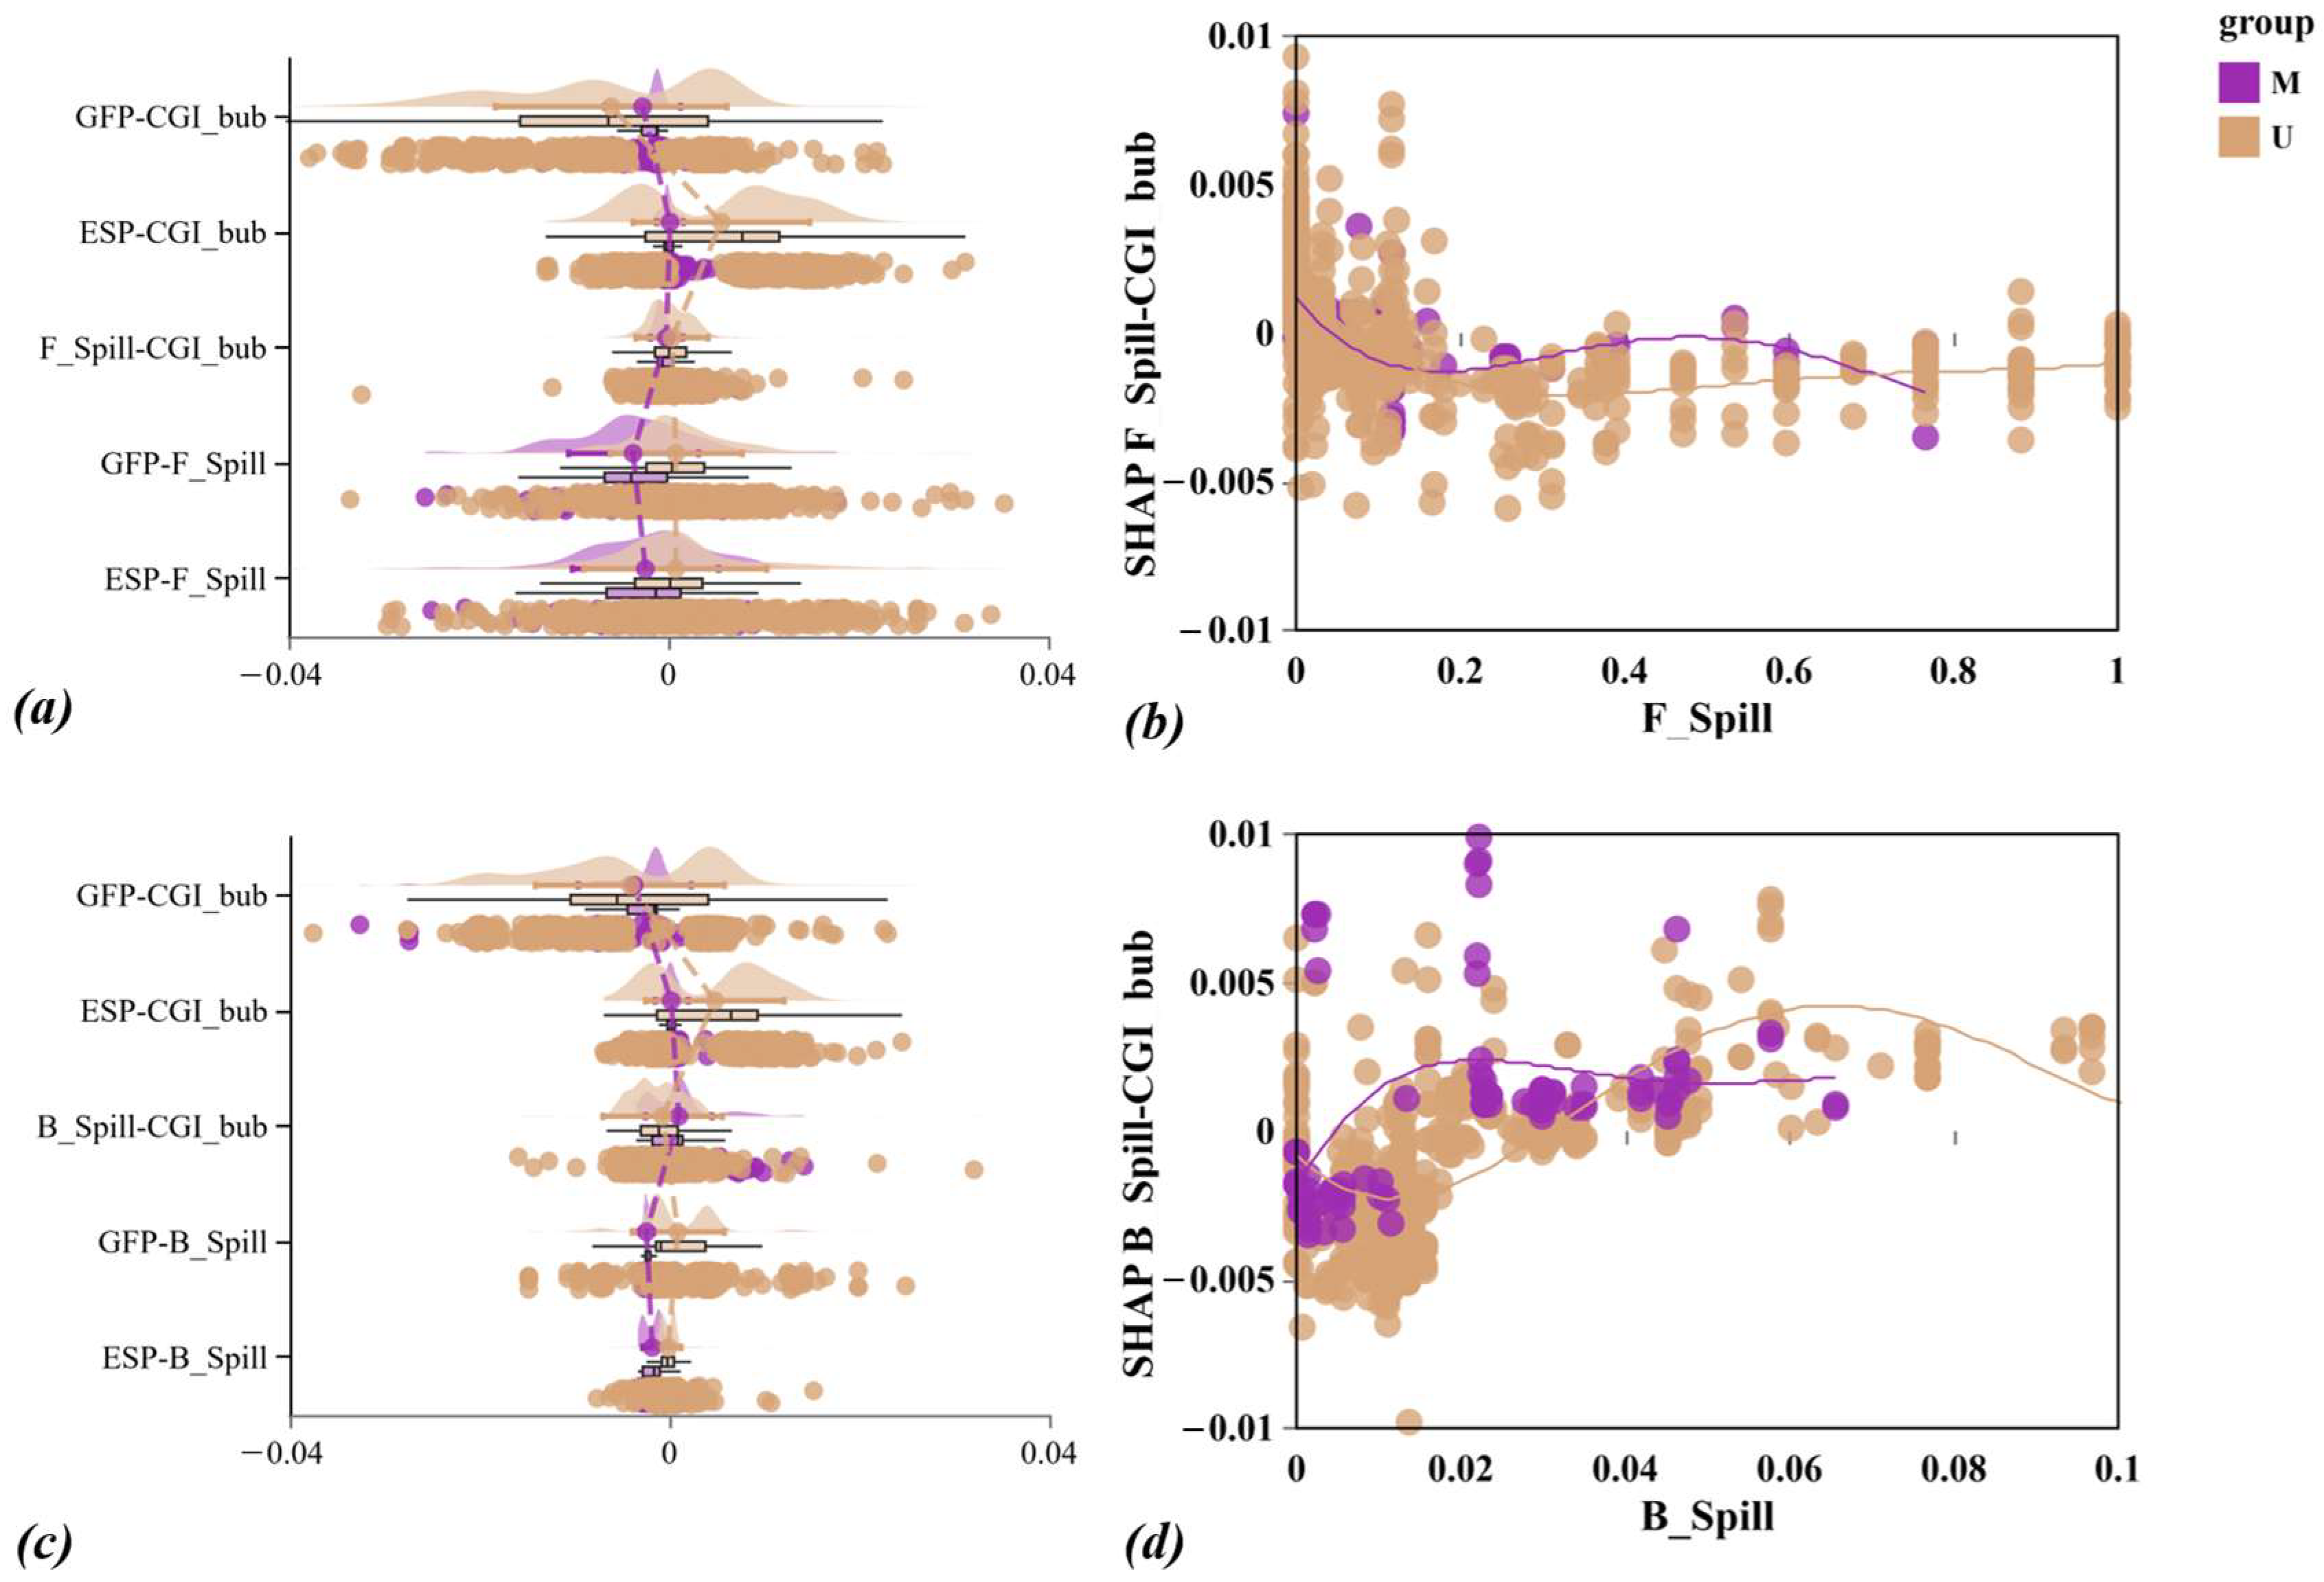
Figure 5 presents the interpretability analysis results for the mediating effects of forward and backward spillovers in the opportunity (O) dimension. In
Figure 5a,c, for upstream firms (U), the mean SHAP values of
F_Spill for
ESP and
GFP is positive. For midstream firms (M), the mean SHAP values of
F_Spill for
ESP and
GFP are negative. The
ESP and
GFP of upstream enterprise (U) have a relatively large absolute mean SHAP for CGI-bub. In
Figure 5b, the SHAP values of
CGI_bub for
F_Spill are mainly distributed below zero and decrease as
F_Spill increases. The fluctuation trend is more pronounced for upstream enterprises. In
Figure 5d, the SHAP values of
CGI_bub for
B_Spill are mainly distributed below zero, and there is an inverted U-shaped relationship between
B_Spill and
CGI_bub, with more pronounced fluctuations for upstream enterprises. This result not only verifies the robustness of
Table 6 but also demonstrates the asymmetric impact of policy combinations on technology spillover mechanisms at different positions in the industrial chain. Policy combinations promote technology spillovers for upstream enterprises in both forward and backward directions, making upstream enterprises more sensitive to policy shocks, while suppressing the spillover effects experienced by midstream enterprises.
The interpretability analysis of ability (A), motivation (M), and opportunity (O) reveals that energy-saving policies and green finance policies exert heterogeneous impact mechanisms on the green innovation bubble of upstream and midstream enterprises in the power industry chain. Upstream enterprises are highly sensitive to government subsidies. Increased subsidies directly lower their strategic innovation costs and significantly expand the bubble, with the effect operating mainly through direct transmission. The mediating effect of peer carbon emissions and ESG scores is not significant. At the same time, energy-saving policies and green finance policies impose an inverted U-shaped constraint on the upstream bubble by promoting forward and backward technology spillovers: moderate spillovers inhibit the bubble, while excessive pressure may still trigger strategic innovation. Midstream enterprises have a stronger response to the level of urban green finance. Improvements in the green financial environment stimulate the formation of the green innovation bubble by reducing financing costs. This effect partly depends on the mediating amplification of peer ESG scores, whereas the mediating effect of peer carbon emissions is not significant. In contrast, the technology spillover effects of energy-saving policies and green finance policies on midstream enterprises are mainly inhibitory. Midstream enterprises find it difficult to effectively absorb external technology spillovers under policy shocks, and instead strengthen their dependence on financial resources for strategic innovation. Upstream enterprises are mostly technology-intensive and asset-heavy industries. They have large R&D investment, long cycles, strong dependence on government subsidies, and are located at the source of industrial chain technology, which can easily generate two-way technology spillovers. Therefore, increased subsidies directly stimulate strategic innovation, whereas moderate technology spillovers inhibit the innovation bubble through technology learning and imitation. Midstream enterprises belong to the asset operation sector of natural monopoly. Their innovation activities rely more on external financing and the regional green finance environment, and they are highly sensitive to financing costs. Peer ESG ratings, as a source of social legitimacy pressure, amplify enterprises’ motivation to imitate strategic innovation. In addition, because the technological absorption capacity of midstream enterprises is constrained by their monopoly position, they cannot effectively utilize external technology spillovers. This instead strengthens their dependence on financial resources for “green packaging” innovation.