2. Theoretical Assessment Aspects of Communication Campaigns on Social Media Platforms
The landscape of marketing communication has undergone a revolution thanks to social media advertising (
Dwivedi et al., 2021;
Kaplan & Haenlein, 2010). The passive, unidirectional nature of traditional mass-media channels is being replaced with a dynamic, interactive, and data-driven environment. This contrasts with television, radio, or print advertising, which primarily aim to broadcast messages to broad audiences (
Chotisarn & Phuthong, 2025). Social media advertising has shifted marketing from one-way broadcasting to interactive, data-rich engagement (
Shaheen, 2025). This transformation enables real-time consumer interaction and more precise performance measurement. Unlike traditional channels such as TV or print, social platforms support dynamic feedback loops that inform both immediate tactics and long-term strategy. Social media platforms facilitate mutual interaction, enabling brands to engage with consumers in real time (
Kaplan & Haenlein, 2010;
Bhandari & Bimo, 2022;
Hofacker & Belanche, 2016;
Kim & Kim, 2022). Supermarkets illustrate this communication shift. They rely on frequent promotions, personalized engagement, and localized messaging to drive purchasing decisions. In terms of theory, the effectiveness of social media advertising is not limited to metrics that measure exposure, such as reach or impressions. In fact, it is the most effective way to understand it because it encompasses multiple stages of consumer attention, interest, action, and loyalty (
Dwivedi et al., 2021;
Farivar & Wang, 2022;
J. Paul et al., 2024;
Tafesse & Wien, 2018).
Visibility indicators, such as reach, impressions, and view count, can reflect the potential audience that has been exposed to the content. The most accurate way to measure consumer interest and interaction is through engagement metrics, such as likes, shares, comments, and average time spent on page (
Barklamb et al., 2020). Leads generated, click-through rates (CTR), return on investment (ROI), and sales lift are key conversion metrics that provide insight into a campaign’s effectiveness in achieving commercial results (
Kaur & Kathuria, 2023;
Shemshaki et al., 2025). Ongoing brand perception and consumer loyalty can be shaped by post-purchase interactions, including feedback, sentiment analysis, and eWOM (
Pathak & Pathak-Shelat, 2017). As Facebook, Instagram, YouTube, LinkedIn, TikTok, and other platforms provide platform-specific analytics tools, the availability of these diverse metrics has increased. The use of these platforms by marketers enables marketers to track user behavior at a granular level. However, information overload is a challenge that comes with the abundance of data.
Thus, choosing the most relevant indicators from a vast array of variables can be difficult for marketing managers (
Krishen et al., 2021). A clear analytical framework is necessary to prevent teams from focusing on vanity metrics, which are easily measured but lack strategic insight (
Rimadewi et al., 2025). Measuring the effectiveness of social media marketing remains challenging due to the gap between readily available platform metrics and strategically meaningful performance indicators (
Ascani & Ancillai, 2025). Organizations often struggle to move beyond surface-level “vanity metrics”. A primary reason for this is the misaligned departmental priorities, data fragmentation, and a lack of cross-functional collaboration. This is especially prominent between marketing and management accounting functions. This problem is also particularly acute in sectors with limited resources, such as supermarket retail, where marketing departments must effectively allocate limited budgets and make measurable changes in consumer behavior.
Previous studies have found that retail decision-makers tend to prioritize metrics that demonstrate immediate financial performance, including ROI, revenue contribution, and cost-per-lead (
Ntousi et al., 2025;
Pauwels & Fagbola, 2025). Engagement metrics are increasingly valued for their ability to indicate relationship-building and brand affinity, particularly in highly competitive markets (
Drivas et al., 2022;
Misirlis & Vlachopoulou, 2018;
Vlachopoulou et al., 2021). Increasingly, metrics like impressions or follower count are seen as inadequate to justify campaign investment unless they are accompanied by interaction or conversion data. Specific characteristics are evident in supermarket social media advertising. Campaigns are often associated with discounts and limited-time offers, which is why they are highly promotional. Conversion and cost metrics are elevated as a result.
Furthermore, high responsiveness and engagement are essential due to the frequent hyperlocalization and time-sensitive nature of communication. Furthermore, the sustainability agenda is gaining increasing significance (
Bağcı & Franz, 2025). Supermarkets are increasingly striving to reduce communication waste, prioritize targeted messaging, and align campaigns with broader corporate responsibility strategies (
Homburg & Wielgos, 2022;
Leonidou et al., 2013). During the COVID-19 lockdown, many SMEs began using digital channels to communicate not only promotional content but also expressions of resilience and corporate social responsibility (
Block et al., 2025). Their strategic messaging often emphasizes support for the sector, employee welfare, and community solidarity. It reflects a broader commitment to sustainability beyond mere commercial objectives. This shift shows how crisis-driven communication can align marketing efforts with societal values. This can reinforce long-term stakeholder trust.
The effectiveness of social media advertising can be evaluated using Multi-Criteria Decision Analysis (MCDA) methods informed by these sectoral dynamics (
Jami Pour et al., 2021;
Hafez et al., 2021;
Karczmarczyk et al., 2018). Decision-makers can evaluate alternatives using MCDA methods such as PROMETHEE II. This is because advertising platform evaluation involves a diverse and sometimes contradictory set of criteria (
Özder, 2025;
Brans et al., 1986;
Tarnanidis et al., 2023,
2025). They are especially suited to complex problems that require combining quantitative data and qualitative judgments. We constructed a composite evaluation model that combines the empirical performance of different platforms with supermarket managers’ strategic priorities, using PROMETHEE II.
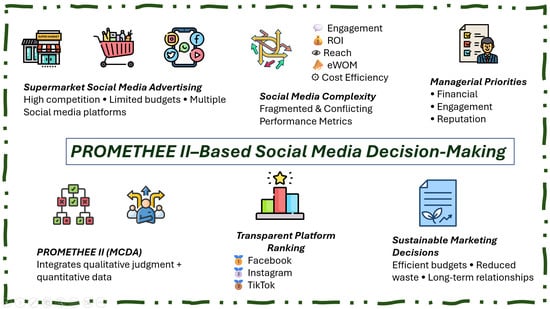
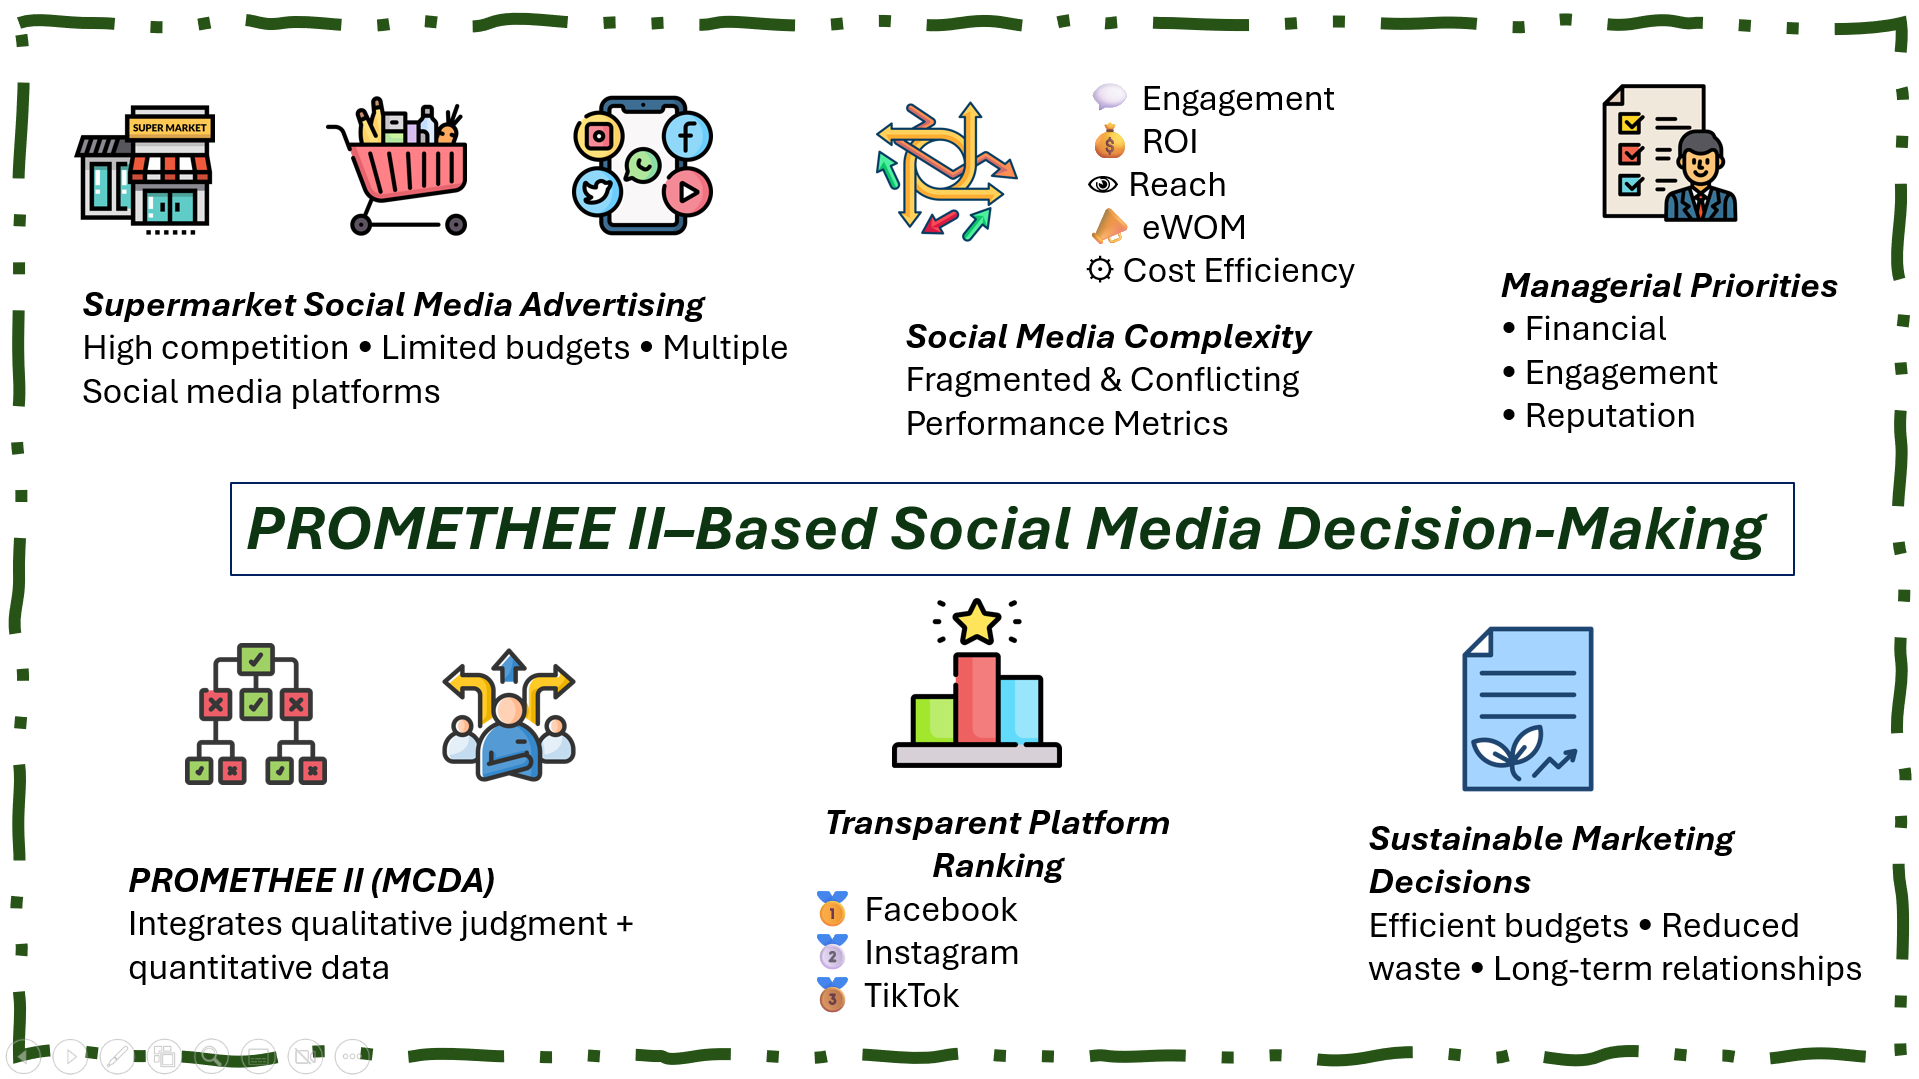
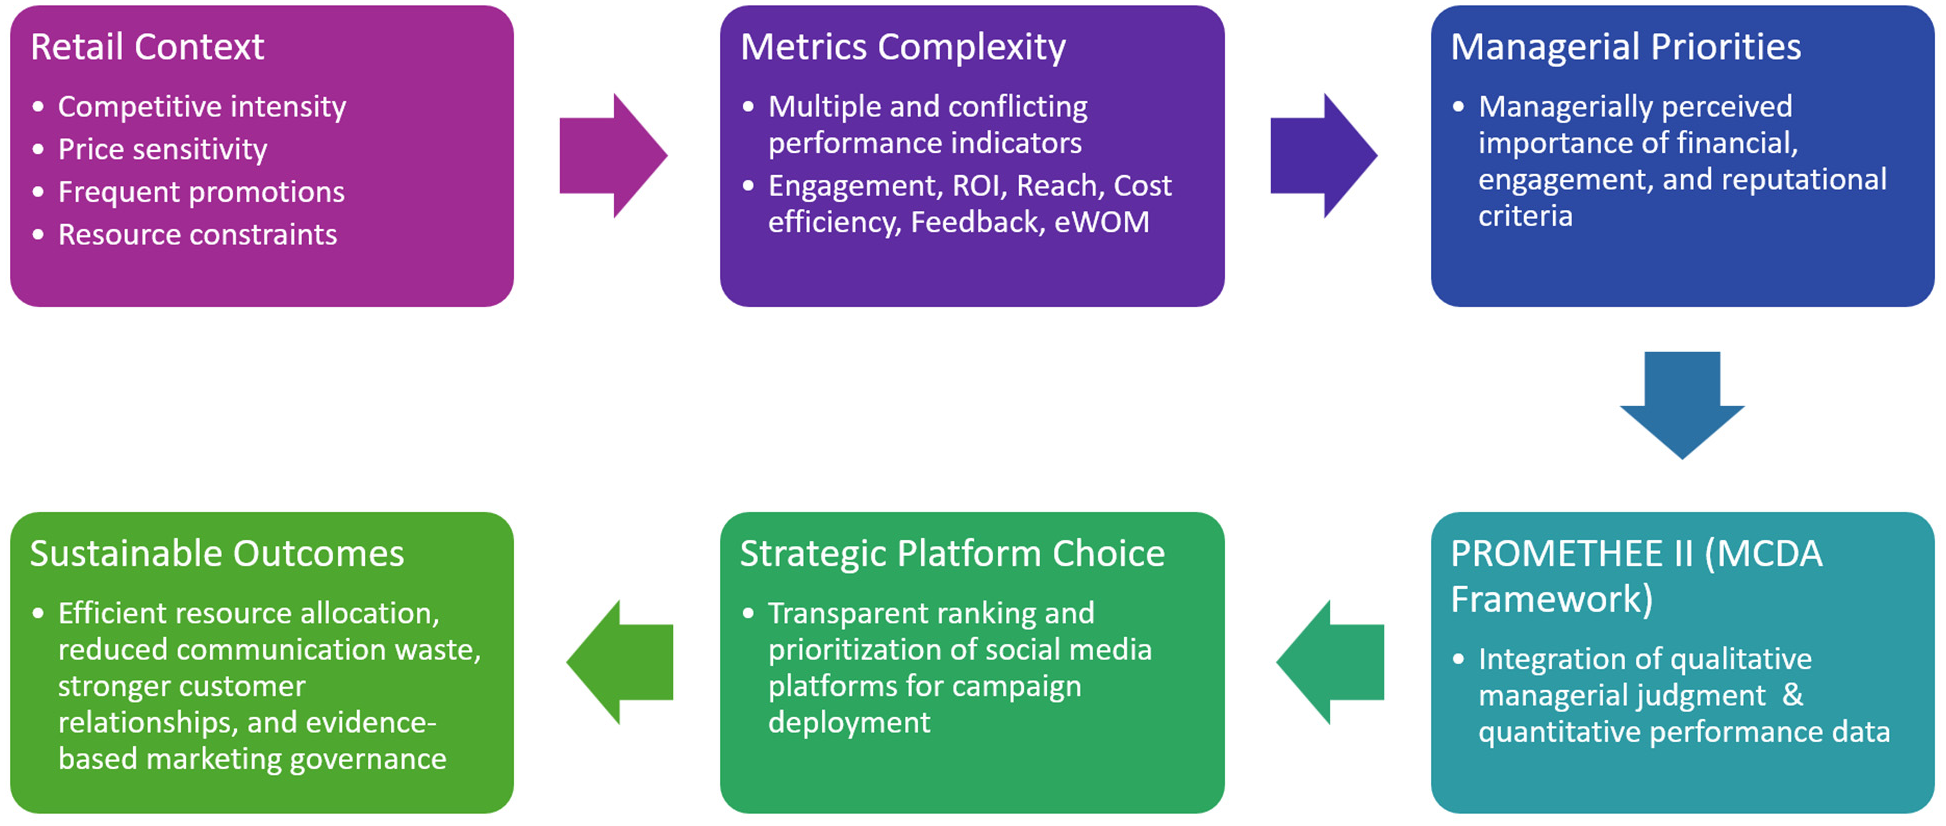
Figure 1 presents the conceptual framework of the study. It illustrates how retail context and metric complexity are translated into strategic social media platform choices through managerially informed multi-criteria decision analysis.
The framework clarifies the role of PROMETHEE II as a decision-aid mechanism that integrates managerial priorities with performance data to support sustainable marketing outcomes. Interviewing 27 retail managers across Northern Greece provided insight into the most important criteria for evaluating campaigns. The performance data from platform analytics was normalized by translating their preferences into decision weights. By employing this hybrid approach, we can bridge the gap between abstract metrics and actionable strategies and rank social media alternatives based on their contribution to strategic marketing goals.
4. Results
Greek supermarkets’ social network advertising campaigns were in line with international trends in terms of duration. A significant percentage (52%) of the participants stated that their typical campaigns lasted more than 30 days. In comparison, 28% reported campaigns lasting 15–30 days, and only 18% reported shorter campaigns lasting less than 2 weeks. Managers stressed the importance of maintaining consistent visibility over time to reinforce promotional messages and align with weekly or monthly sales cycles.
A combination of regional chains, family-owned enterprises, and a few national players characterizes the supermarket sector in Northern Greece. Social media advertising practices reflect both economic constraints and a strong focus on the local market. Respondents operating in Central Macedonia, Eastern Macedonia, Thrace, and Western Macedonia reported relatively conservative digital advertising budgets. Around 49% reported spending more than €900 per month on social media advertising, which is typically centered on promotional cycles and seasonal demand. Among Northern Greek retailers, 18% reported spending less than €500 per month, while 33% reported spending between €500 and €900 per month.
The regional structure of consumption in Northern Greece is closely linked to the growing reliance on social media advertising, with prices pronounced and purchasing decisions heavily influenced by local familiarity and proximity. The popularity of platforms such as Facebook and Instagram among households in urban centers like Thessaloniki, as well as in smaller cities and semi-urban areas, has made them dominant communication channels. According to the survey, 57% of respondents had more than 6000 engaged followers, with the majority coming from supermarkets with multiple locations in metropolitan areas. Around 21% had between 4000 and 6000 followers, with 14% reporting fewer than 2500 followers. This is consistent with the limited geographic catchment areas of neighborhood supermarkets. Most respondents reported minimal or inactive followers, often due to irregular posting practices or reliance on outsourced digital management.
Locally tailored content, such as region-specific promotions, holiday-related offers, and messaging that emphasizes support for local producers, strongly correlated with engagement outcomes in Northern Greece. Retailers that combine social media advertising with digital loyalty initiatives, discount alerts, and in-store promotions have reported higher interactivity and a more lasting effect on eWoM. Trust and repeated interaction play a significant role in determining consumer loyalty in regional retail markets, as reflected by this pattern. About 61% of managers were able to evaluate campaign performance within 2 to 4 working days, while 23% reported needing a whole week. The remaining 16% showed that evaluation processes were either faster or longer. Regional firms had limited internal analytics capacity and relied on external marketing agencies in Thessaloniki or Athens. They needed to manually combine data from multiple digital platforms, which required significant time.
In addition, most respondents in the assessment of communication campaigns stated that they prefer to use Google Analytics, along with other tools. This is often done to gather more detailed data on website traffic and conversions. A significant issue has been raised regarding the lack of a unified evaluation framework that captures performance metrics and strategic effectiveness across multiple platforms. Respondents expressed a preference for structured evaluation models, particularly multi-criteria decision-making tools such as PROMETHEE. They indicated that such tools could better align operational data with strategic objectives.
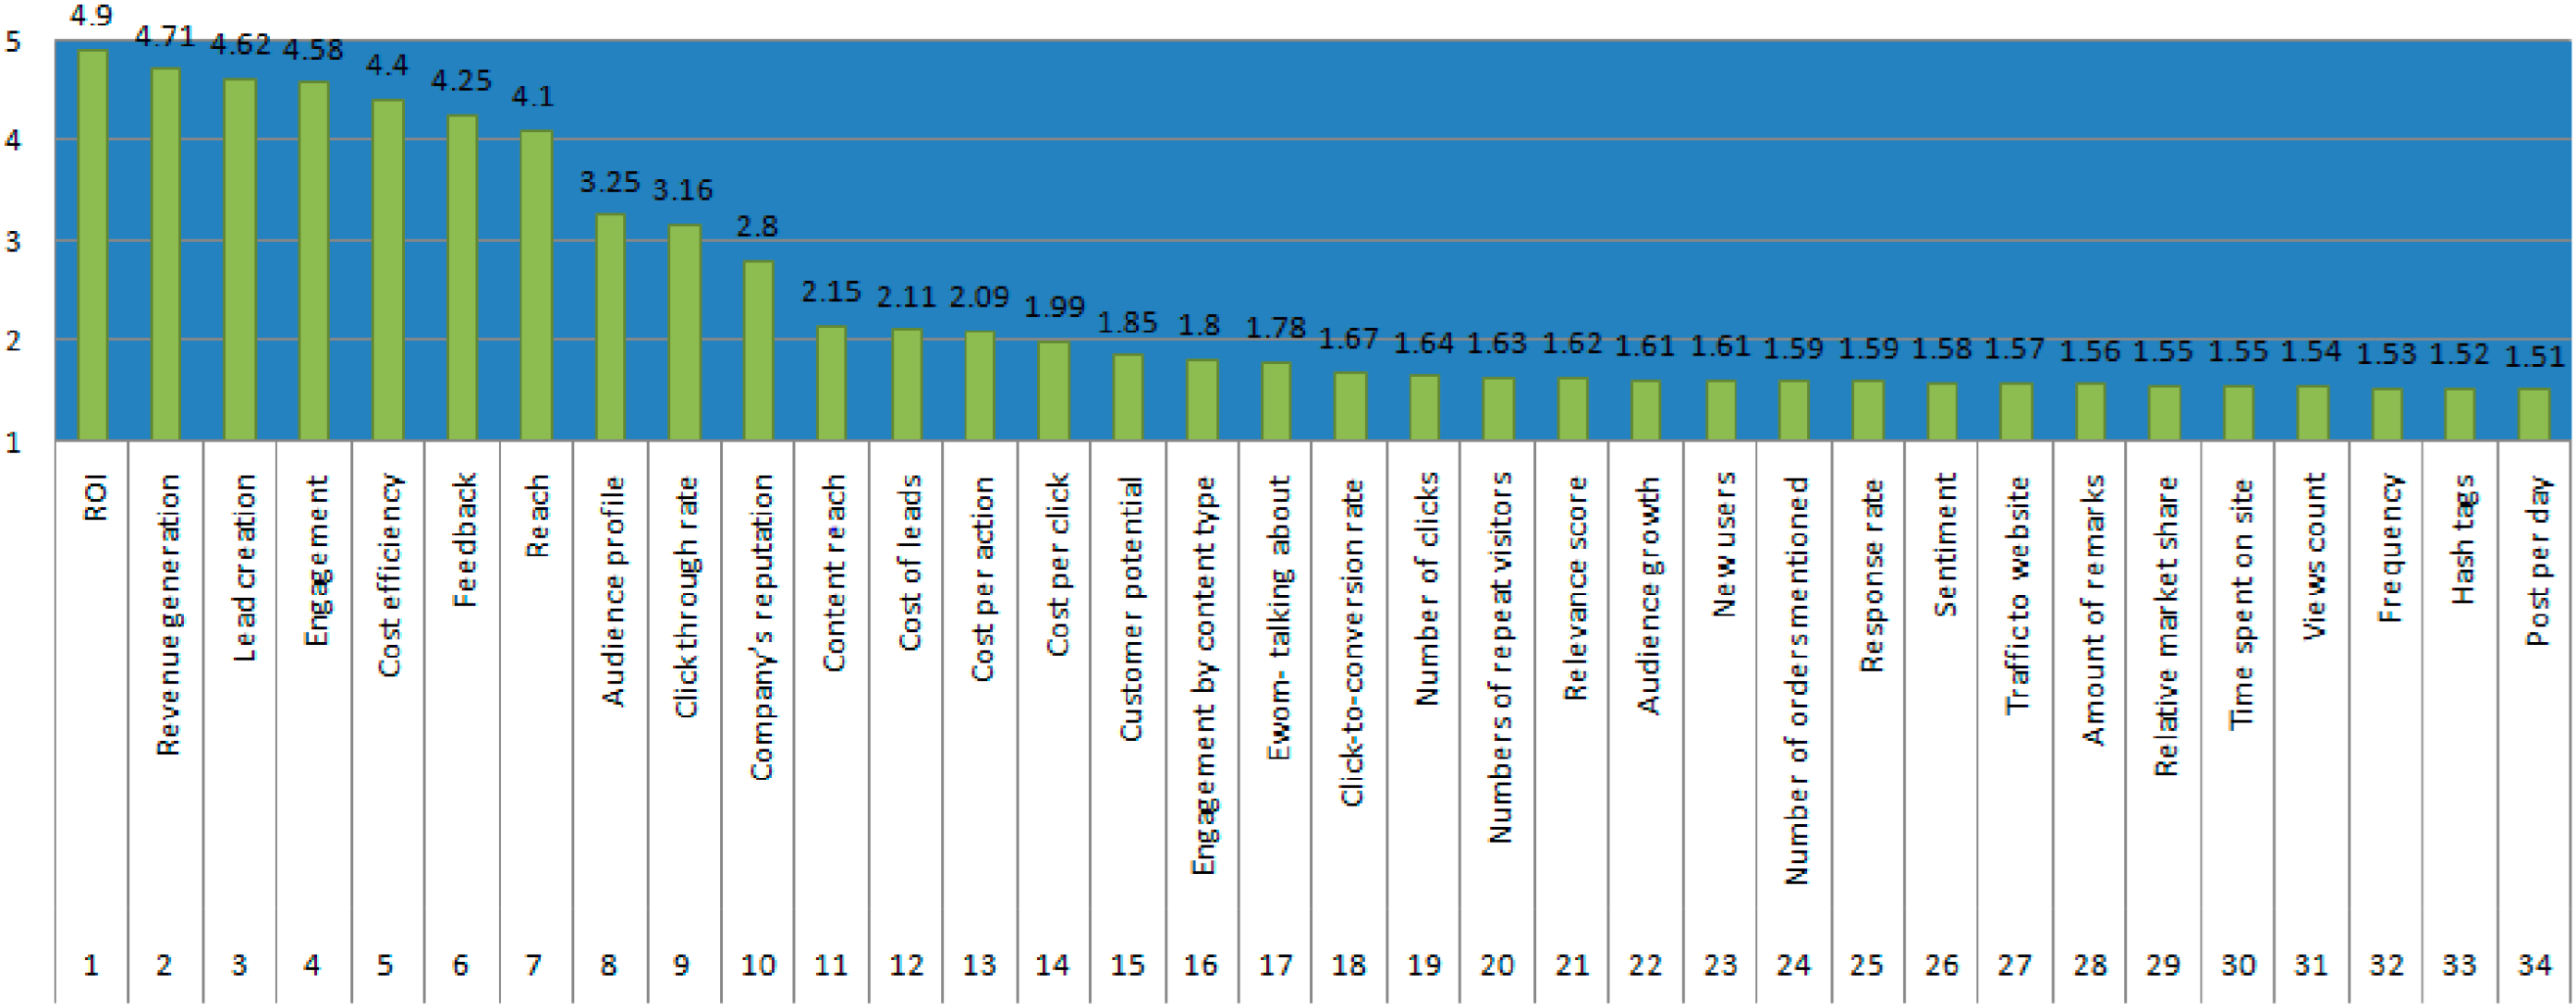
During the interview process, managers were asked to assess the significance of thirty-four (34) social media campaign aspects. This set of factors involves many performance dimensions, including financial outcomes, engagement, reach, cost-effectiveness, reputation, and customer behavior. A five-point importance scale was utilized for the assessment, with 1 representing “extremely unimportant,” 3 representing a neutral middle point, and 5 representing “extremely important. Managers were able to express their evaluations more intuitively with this simplified scale, which facilitated aggregating perceived importance across criteria. By evaluating 34 individual factors associated with social media campaign performance, participants were able to prioritize key criteria for the PROMETHEE II analysis.
Other evaluated factors include: content reach, traffic to website, impressions, frequency, relevance score, leads, audience growth, feedback, Cost of leads, relative market share, Sentiment, time spent on site, new users, revenue growth rate, audience profile, views count, number of clicks, company reputation, hashtags, target audience engagement, engagement by content type, posts per day, Cost per action, cost per click, click-through rate, number of orders mentioned, Cost per thousand impressions, response rate, eWoM, number of repeat visitors, gross impressions, return on investment, customer potential, and amount of remarks.
The transcription and analysis of interview recordings were conducted using reflexive thematic analysis. The process of identifying higher-order themes related to communication strategy, performance evaluation, and consumer influence started with descriptive coding and ended with pattern coding. Consistency and reflexivity were ensured using analytic memos during the iterative coding process. To enhance trustworthiness, the findings were evaluated for internal consistency and alignment with existing literature on digital marketing and consumer behavior.
A clear pattern of prioritization among managers emerged from the analysis of the criteria ratings. Return on investment, revenue growth, Cost per action, Cost per click, and number of leads were considered financially and conversion-oriented criteria that earned the highest average importance scores. Managers place great emphasis on interaction quality and relationship building. This is why they prioritize engagement-related factors, such as target audience engagement, engagement by content type, feedback, response rate, and eWOM indicators. In contrast, metrics based solely on exposure, such as impressions, frequency, hashtags, and posts per day, were generally given lower importance. It suggests that visibility alone is insufficient to evaluate campaign effectiveness. Managers view social media as exerting its most significant influence at the beginning of the consumer decision-making process. It is particularly vital during recognition and information search, as indicated by qualitative responses (
Numan et al., 2026). It was found that feedback management practices are overwhelmingly reactive and lack systematic analysis of customer comments and sentiment trends, underscoring the need for more sustainable, learning-focused communication strategies.
The criteria were grouped and synthesized into seven higher-level evaluation criteria because it was impractical to incorporate all thirty-four factors directly into a PROMETHEE II model. Using both conceptual similarity and aggregate importance ratings, the reduction process was guided to ensure content validity while maintaining model parsimony. Aggregation was conducted using a structured thematic clustering approach. The process relied on thematic clustering (qualitative), and no formal statistical consensus method (e.g., Delphi, factor analysis) was used. First, the 34 performance factors were independently reviewed and coded according to their primary managerial meaning. Factors that express similar outcomes or decision implications were grouped into thematic clusters. Second, each cluster was examined for internal consistency and conceptual overlap. Redundant or closely related factors were merged to form higher-order constructs. Third, the resulting clusters were validated by experts to ensure clarity, interpretability, and non-duplication. Expert consensus was achieved qualitatively through thematic clustering and expert validation. Finally, only clusters representing distinct and actionable performance dimensions were retained. This process resulted in seven aggregated criteria suitable for PROMETHEE-based evaluation.
Table 3 shows how conceptually related factors were grouped into higher-order constructs during the thematic aggregation process. While aggregation can reduce analytical granularity, the trade-off is intentionally and methodologically consistent with decision-aid modeling. PROMETHEE II, among many others, is a multi-criteria decision analysis framework designed to operate with a small number of conceptually distinct criteria to maintain interpretability and prevent indicators that are closely related from being overweighted by avoiding redundancy. In this context, aggregation is a method of compressing constructs that group highly correlated or conceptually overlapping factors into higher-order dimensions while maintaining their underlying managerial meaning. The goal is not to eliminate information, but to make detailed operational metrics into constructs that are important for decision-making and enable transparent comparisons across alternatives. Thus, the aggregation process balances maintaining the accuracy of the initial data with the practical need for a simple, comprehensible decision model.
The initial set of thirty-four performance factors was identified through a systematic review of prior literature on social media performance and digital marketing effectiveness. These factors were examined for conceptual overlap and thematic similarity. Closely related factors were grouped into preliminary clusters that represented the underlying standard dimensions. The groupings were then reviewed through expert evaluation involving managers with direct responsibility for social media decisions. Factors conveying similar managerial meaning were aggregated to reduce redundancy. Each aggregated criterion was assessed for conceptual clarity, managerial interpretability, and decision relevance. This structured process yielded seven core criteria that retain the multi-dimensional nature of social media performance while ensuring analytical parsimony within the PROMETHEE framework. The final criteria included: (1) Return on Investment, (2) Revenue Contribution, (3) Lead Generation, (4) Engagement, (5) Reach, (6) Cost Efficiency, and (7) Feedback and eWOM Quality. Quantitative campaign data was normalized to a 0–100 scale when objective performance indicators were available. Managers’ assessments were operationalized into composite indices using predefined scoring rules when direct measurement was not possible, particularly for feedback and e-commerce quality. The indices were then gathered from 27 supermarkets to create a decision matrix that evaluates 7 social media platforms against 7 criteria. We present a summary of the evaluation factors used in social media networks in
Figure 2.
Figure 2 presents the core criteria (seven of which are important for the study) for evaluating the effectiveness of social media platforms in supermarket advertising campaigns. Return on investment measures the financial returns from advertising expenditure across platforms relative to the expenditure. Revenue contribution captures direct sales impact and transaction value generated through social media activities. Lead generation evaluates the quality of prospect acquisition and the volume of inquiries from platform interactions. Engagement quantifies audience interaction through likes, comments, shares, and participation intensity. Reach assesses total audience size and content visibility metrics across demographics. Cost efficiency measures resource utilization per conversion action and spending effectiveness. Feedback and eWoM evaluate sentiment responsiveness, comment quality, and organic advocacy strength. Together, these criteria form the foundation of the PROMETHEE II platform ranking analysis. Their integration enables transparent comparison of platforms across financial, relational, and efficiency dimensions.
Following the qualitative criteria elicitation process, the PROMETHEE II multi-criteria decision method was implemented using the Visual PROMETHEE software. PROMETHEE II was selected over PROMETHEE I because it provides a complete ranking of alternatives, eliminating incomparabilities and enabling clear managerial prioritization of social media platforms. Fuzzy and neutrosophic extensions address high-uncertainty contexts like medical diagnosis or facility location planning (
Bajpai & Chaturvedi, 2026;
Jeon et al., 2023). Supermarket platform evaluation involves moderate uncertainty and predominantly quantitative metrics requiring managerial transparency rather than complex uncertainty modeling. Managers assessed seven criteria that emerged as most important for evaluating decisions across seven social media platforms (Facebook, Instagram, YouTube, TikTok, X (Twitter), LinkedIn, and Pinterest). The criteria are return on investment, revenue contribution, lead generation, engagement, cost efficiency, feedback, eWOM, and reach. The managers’ importance ratings on a five-point scale were used to calculate the criterion weights. The weighting scheme was subsequently normalized to 1, ensuring that managers’ priorities were reflected in a transparent, empirically grounded manner. For each criterion, individual managerial ratings were averaged across respondents, and the resulting mean scores were normalized to derive the final PROMETHEE weights. All criteria were defined as maximization criteria, except for cost efficiency, which was expressed in monetary terms. (e.g., Cost per click or Cost per action was treated as a minimization criterion). Quantitative performance criteria were chosen with V-shape preference functions. At the same time, feedback and eWOM indicators were selected with either a level or V-shape preference function, as they are partly qualitative in nature. The standard deviation of each criterion was used to determine the thresholds for differentiation and preference, enabling consistent pairwise comparisons between platforms. The PROMETHEE II procedure generated positive, negative, and net preference flows for each alternative, which were then used to determine a comprehensive ranking of social media platforms. By implementing this approach, we were able to evaluate the effectiveness of social media communication in a structured and transparent manner. It enables robust, sustainable marketing decision-making in the supermarket sector.
By utilizing
Table 4 as the primary input for the PROMETHEE II analysis, social media platforms can be systematically compared across multiple managerially relevant performance dimensions. Using input data from the PROMETHEE II decision matrix, social media platforms can be evaluated and compared using the multi-criteria decision analysis framework. The seven evaluation criteria derived from managerial assessments are represented in each column, with each row corresponding to a social media platform (alternative). These include: return on investment (ROI), revenue contribution, lead generation, engagement, reach, cost efficiency, and feedback/eWoM.
The matrix shows the performance profile of each platform across multiple dimensions. Facebook and Instagram consistently demonstrate high levels of financial, engagement, and reach metrics, indicating strong overall performance. The effectiveness of TikTok for interaction-driven communication is highlighted by its high scores in engagement and reach, while YouTube demonstrates more moderate, balanced values across the criteria. Twitter (X), LinkedIn, and Pinterest have scores comparable to or lower than those of leading platforms, indicating weaker overall performance in the supermarket advertising context. It is essential to note that the decision matrix is not a ranking; rather, it serves as the quantitative foundation for the PROMETHEE II method to function effectively. These descriptive patterns are not interpreted as rankings but serve as preparatory inputs for the PROMETHEE II preference flow analysis presented in the following section.
The PROMETHEE II algorithm converts the matrix into preference flows and a final platform ranking by comparing alternatives across each criterion, taking criterion weights, preference functions, and thresholds into account. Therefore, the empirical performance data is linked to the subsequent multi-criteria evaluation and decision-making process through the decision matrix, making it a crucial step.
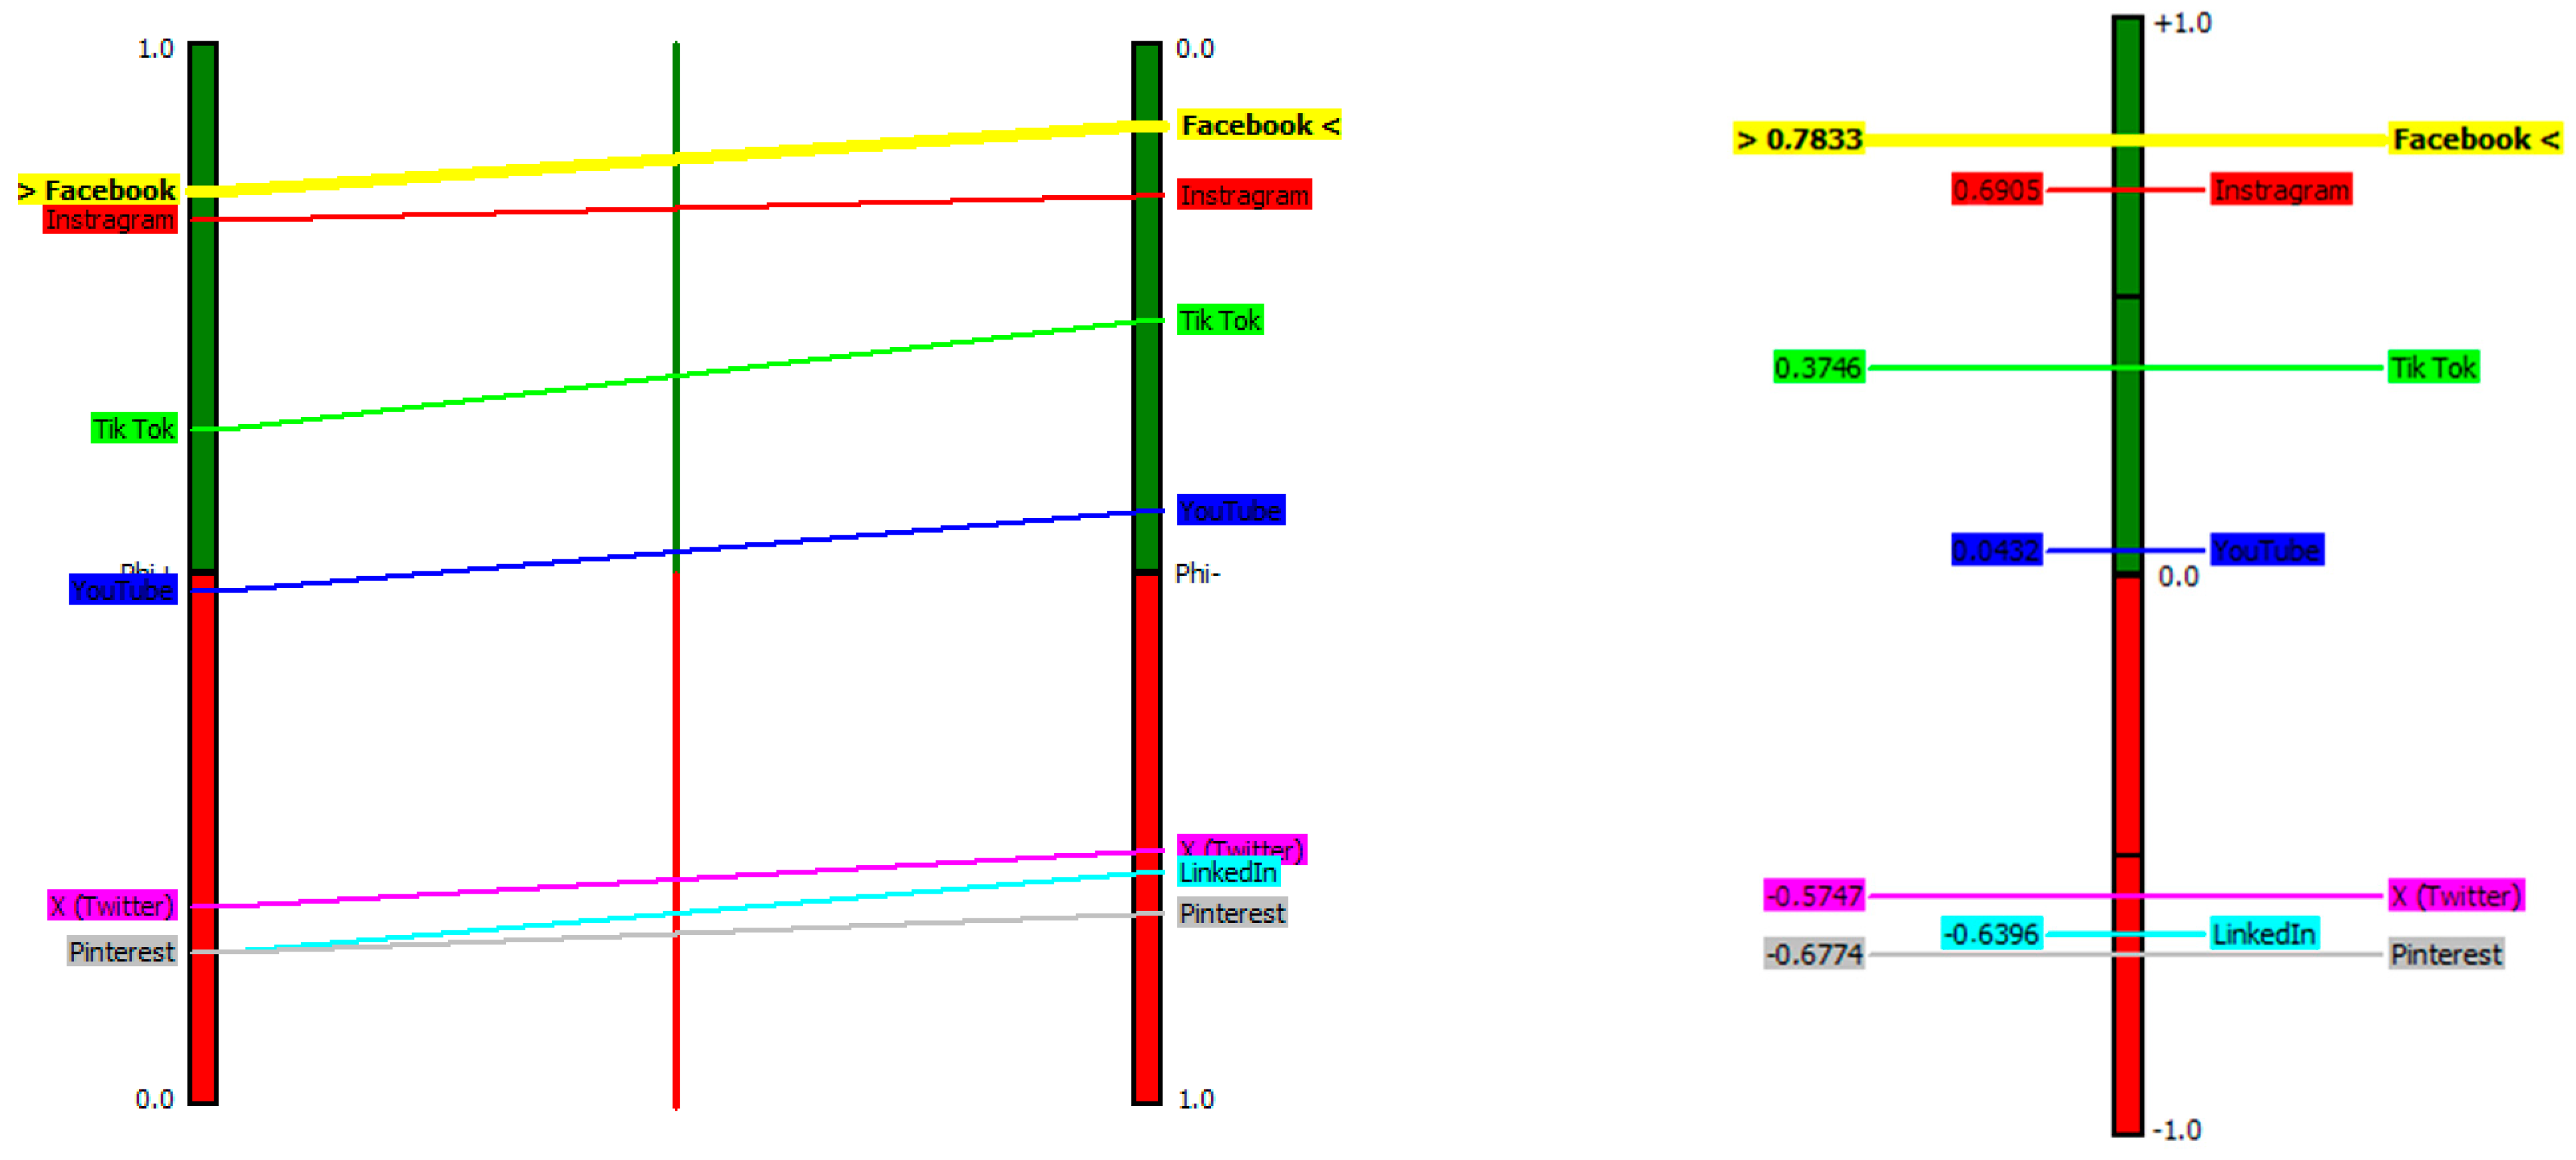
Figure 3 shows both the partial (PROMETHEE I) and complete (PROMETHEE II) rankings of the evaluated social media platforms. The results of PROMETHEE I are depicted in the left-hand panel, comparing alternatives based on their positive and negative preference flows. This partial ranking highlights instances where platforms are not comparable and when one platform performs better on specific criteria, while another dominates in other areas. These incompatibilities highlight the multifaceted nature of social media advertising performance and underscore the need for a comprehensive ranking system that considers these complexities. The PROMETHEE II results are displayed in the right panel, with their net preference flow (Φ) ranking each alternative. All platforms can be ranked from best to worst in overall performance by aggregating positive and negative preference flows into a single measure using the net flow. Superior overall performance is indicated by higher net preference flow (Φ) values, whereas lower (more negative) Φ values reflect weaker overall performance relative to other alternatives.
The results show that Facebook has the highest net preference flow, ranking first among all evaluated platforms. This outcome confirms Facebook’s dominant role in supermarket social media communication strategies, as it has performed strongly across multiple dimensions, including return on investment, revenue contribution, reach, and engagement. Instagram is in second place due to its high engagement levels and solid financial performance. TikTok comes in third place, thanks to its exceptional engagement and reach; however, it has less favorable conversion rates. YouTube’s middle ranking indicates balanced but less competitive performance across all criteria. Conversely, LinkedIn, X (Twitter), and Pinterest experienced negative net preference flows and rank among the lowest. Compared to other platforms, these platforms are less successful, especially in terms of engagement and revenue metrics, suggesting a less significant strategic role in the supermarket sector. According to the rankings, platforms that combine economic effectiveness and customer interaction generally perform better than those that offer visibility or niche engagement alone. A comparison of PROMETHEE I and PROMETHEE II shows that the complete ranking resolves initial incomparability, enabling decision-makers to prioritize social media platforms in a clear, actionable manner. This encourages marketing decisions in the supermarket sector to be more transparent, evidence-based, and sustainable (
Agrawal, 2021;
Tarnanidis et al., 2025).
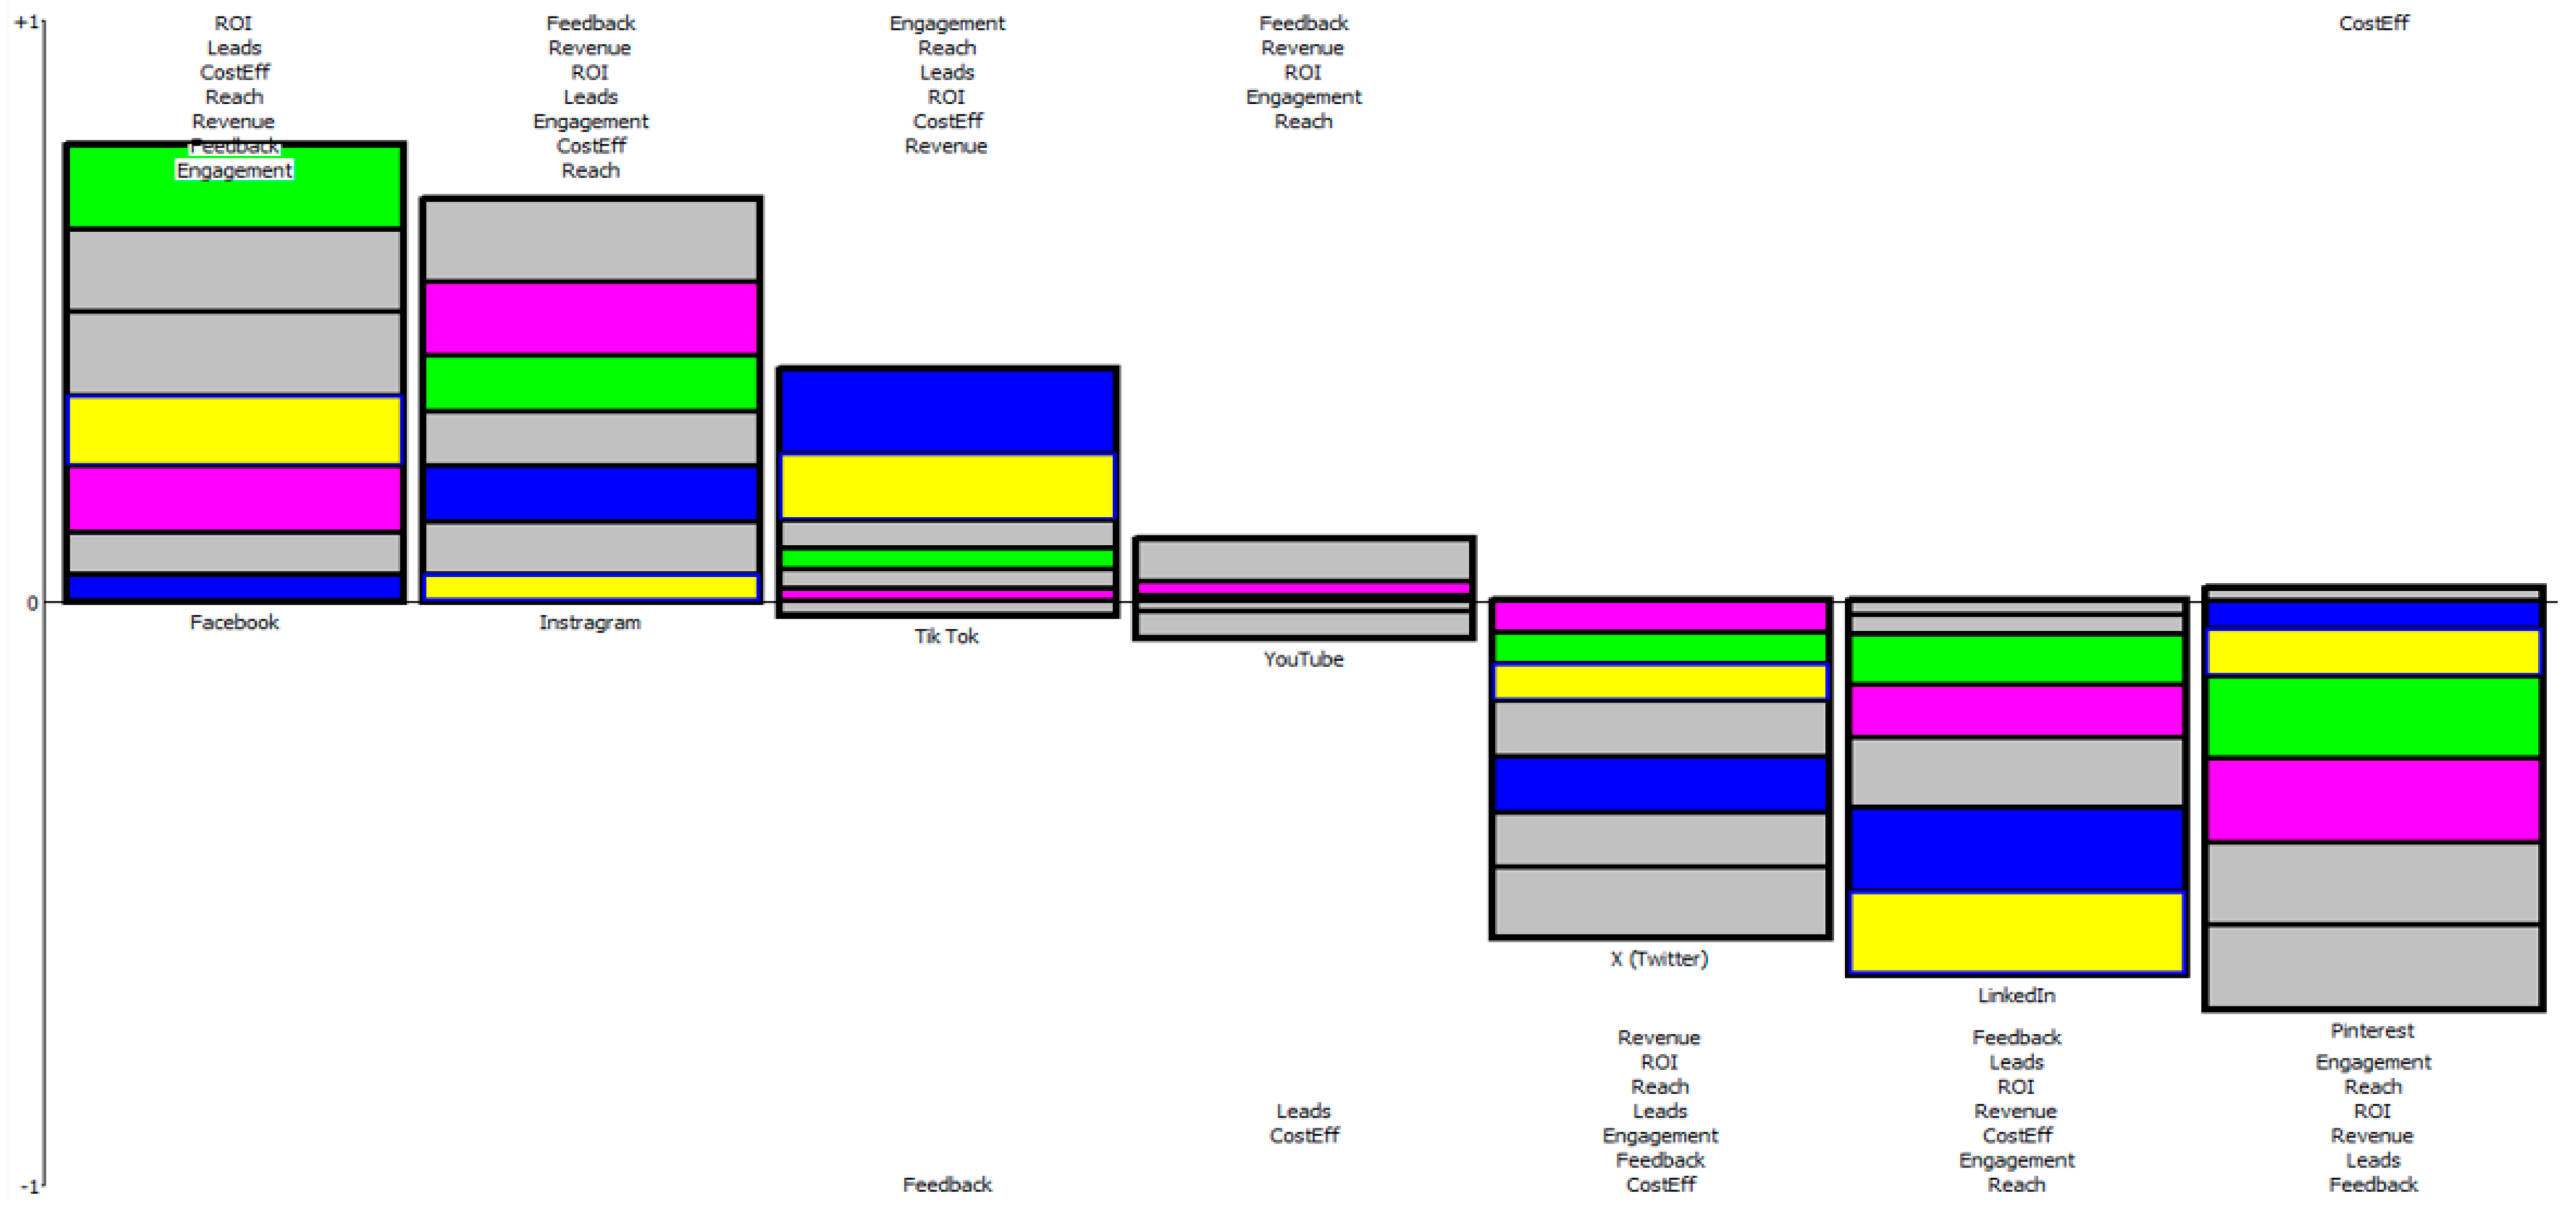
Figure 4 presents the PROMETHEE Rainbow diagram, which breaks down the overall preference flows of each social media platform into contributions specific to each criterion. The Rainbow graph visually shows how each evaluation criterion affects an alternative’s overall performance, thereby enhancing the interpretability of PROMETHEE II results. The diagram shows vertical bars representing social media platforms, with colored segments (slices) representing the individual criteria. The horizontal zero line separates positive and negative contributions. Criteria segments above the zero line indicate areas where the platform is performing relatively well compared to competing alternatives and show positive contributions to its net preference flow. Negative contributions are highlighted by segments below the zero line, which indicate where the platform underperforms. The drivers of platform dominance are clearly depicted in the Rainbow visualization. For example, Facebook demonstrates a significant positive influence on ROI, leads, reach, cost efficiency, and revenue. This affirms its balanced and robust performance in financial, efficiency, and exposure-related areas. Despite some efficiency-related criteria contributing less strongly, Instagram looks good. It still shows strong positive contributions in revenue, engagement, feedback, and reach, indicating its strength in interaction quality and consumer response. TikTok’s profile varies considerably, with engagement and reach being its main positive contributors, whereas feedback and cost efficiency are less favorable. This validates TikTok’s role as a platform that prioritizes engagement over Cost or conversion. YouTube exhibits a balanced distribution of positive and negative segments across various criteria, suggesting a neutral or complementary role with little dominance in any specific aspect.
In contrast, rainbow bars on X (Twitter), LinkedIn, and Pinterest show segments below the zero line, with particular emphasis on leads, engagement, reach, and cost efficiency. Their low net preference flows and inferior rankings in the PROMETHEE II analysis can be explained by these negative contributions. Although some isolated criteria (e.g., the negative performance cannot be offset by the limited positive effects of cost efficiency on Pinterest or feedback on LinkedIn). In general, the PROMETHEE Rainbow diagram offers valuable diagnostic information by revealing the criteria that determine the success or failure of every platform. Managers can identify platform-specific strengths and weaknesses by using the Rainbow analysis to connect criterion-level contributions to overall preference flows. So, the analysis helps them in transparent interpretation of the PROMETHEE II ranking through linkage. This decomposition is particularly useful for informing sustainable marketing decisions.
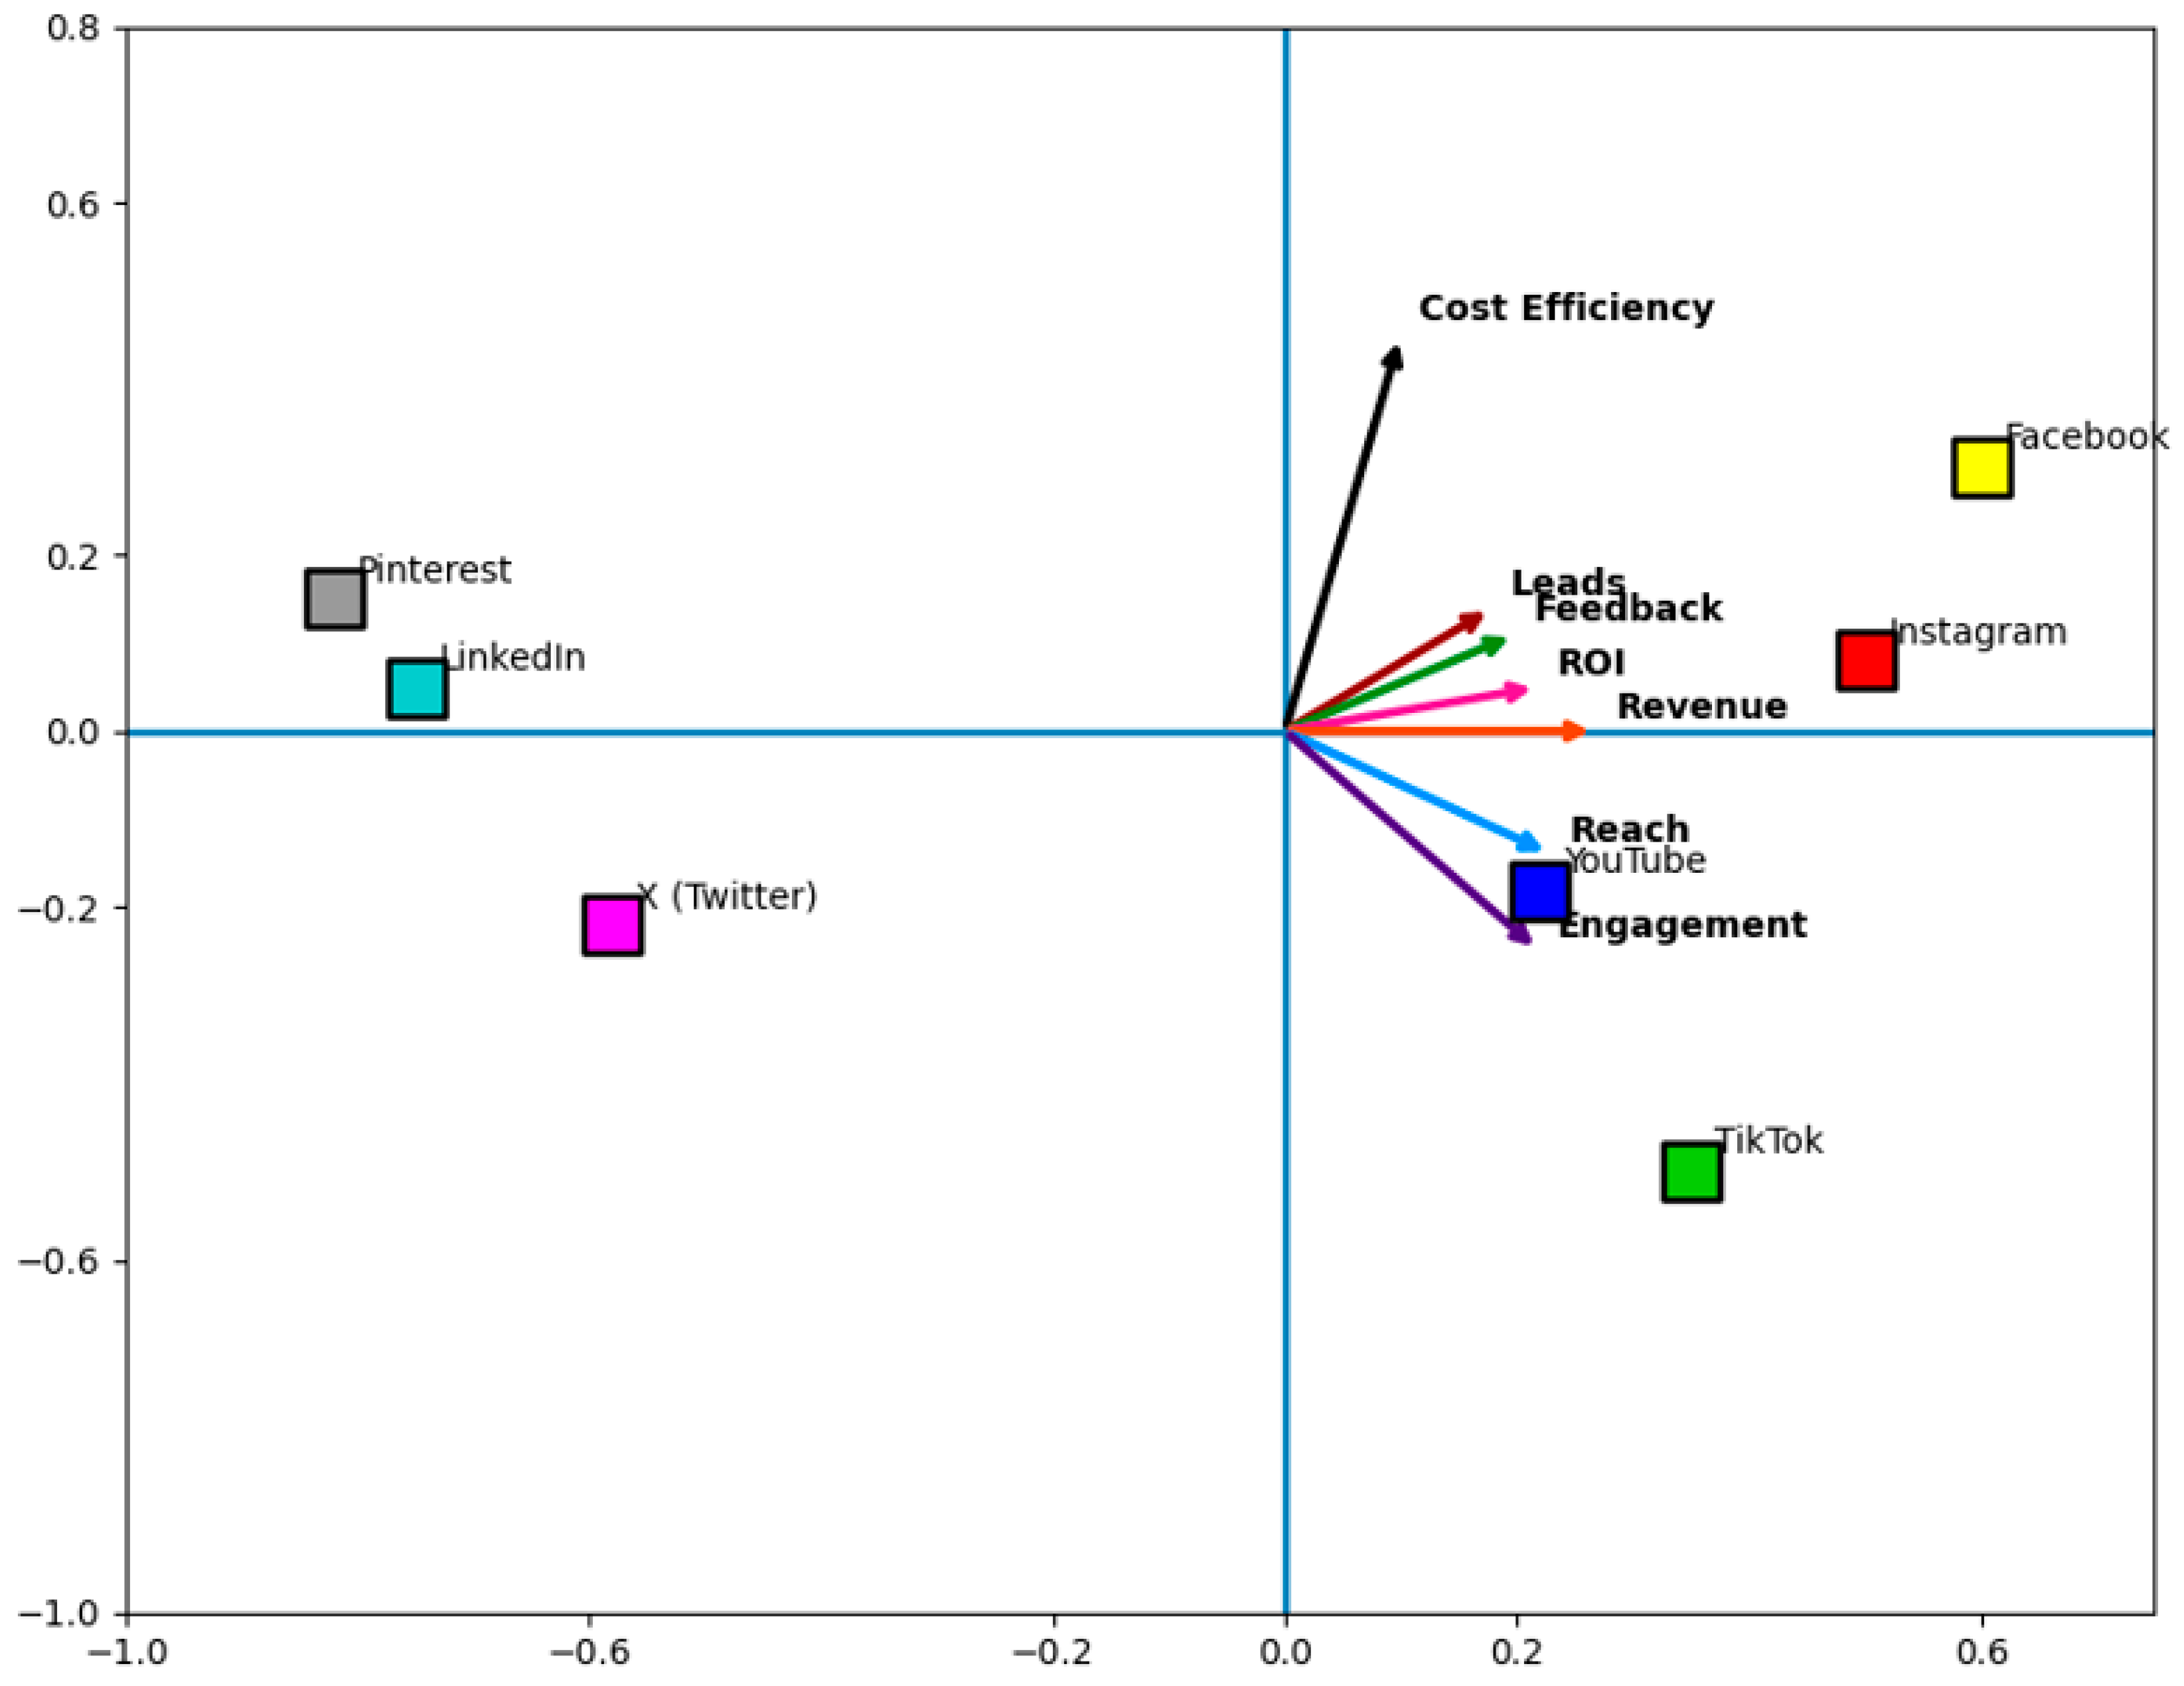
The PROMETHEE Geometrical Analysis for Interactive Aid (GAIA) plane in
Figure 5 provides a visual representation of the connections between the evaluated social media platforms and the decision criteria, offering a synthetic view. By projecting alternative and criterion vectors onto a two-dimensional space, the GAIA plane facilitates the identification of similarities, conflicts, and trade-offs among platforms. In the GAIA plane, the point is the representation of each social media platform, and the vector is the representation of each criterion from the center. Platforms situated close to each other have similar performance profiles across all criteria, but platforms positioned in opposite directions exhibit different performance patterns. Using the direction and length of each criterion vector, it can be determined how it affects the decision problem and its contribution to overall discrimination among alternatives.
According to the visualization, Facebook aligns closely with most key criteria, particularly ROI, revenue, leads, engagement, and reach, demonstrating consistent, balanced performance across financial and interaction-related metrics. Facebook dominates the PROMETHEE II ranking due to this alignment. Instagram’s complementary strategic role is confirmed by its location near Facebook and similar criteria vectors, specifically those related to engagement and revenue. The engagement and reach vectors are closely related to TikTok’s appearance in a different quadrant of the GAIA plane. This spatial positioning confirms TikTok’s strength as an engagement-driven platform, but it also highlights its weaker association with cost efficiency and feedback-related criteria. The plane’s location near YouTube suggests a performance profile that is more balanced and less discriminatory, with no single criterion dominating. The central cluster of positive criterion vectors is located near X (Twitter), LinkedIn, and Pinterest. Their location suggests that the problem’s dominant performance dimensions, particularly those related to engagement, reach, and financial outcomes, are not aligned effectively. This spatial separation is associated with their lower net preference flows and lower rankings in the PROMETHEE II analysis.
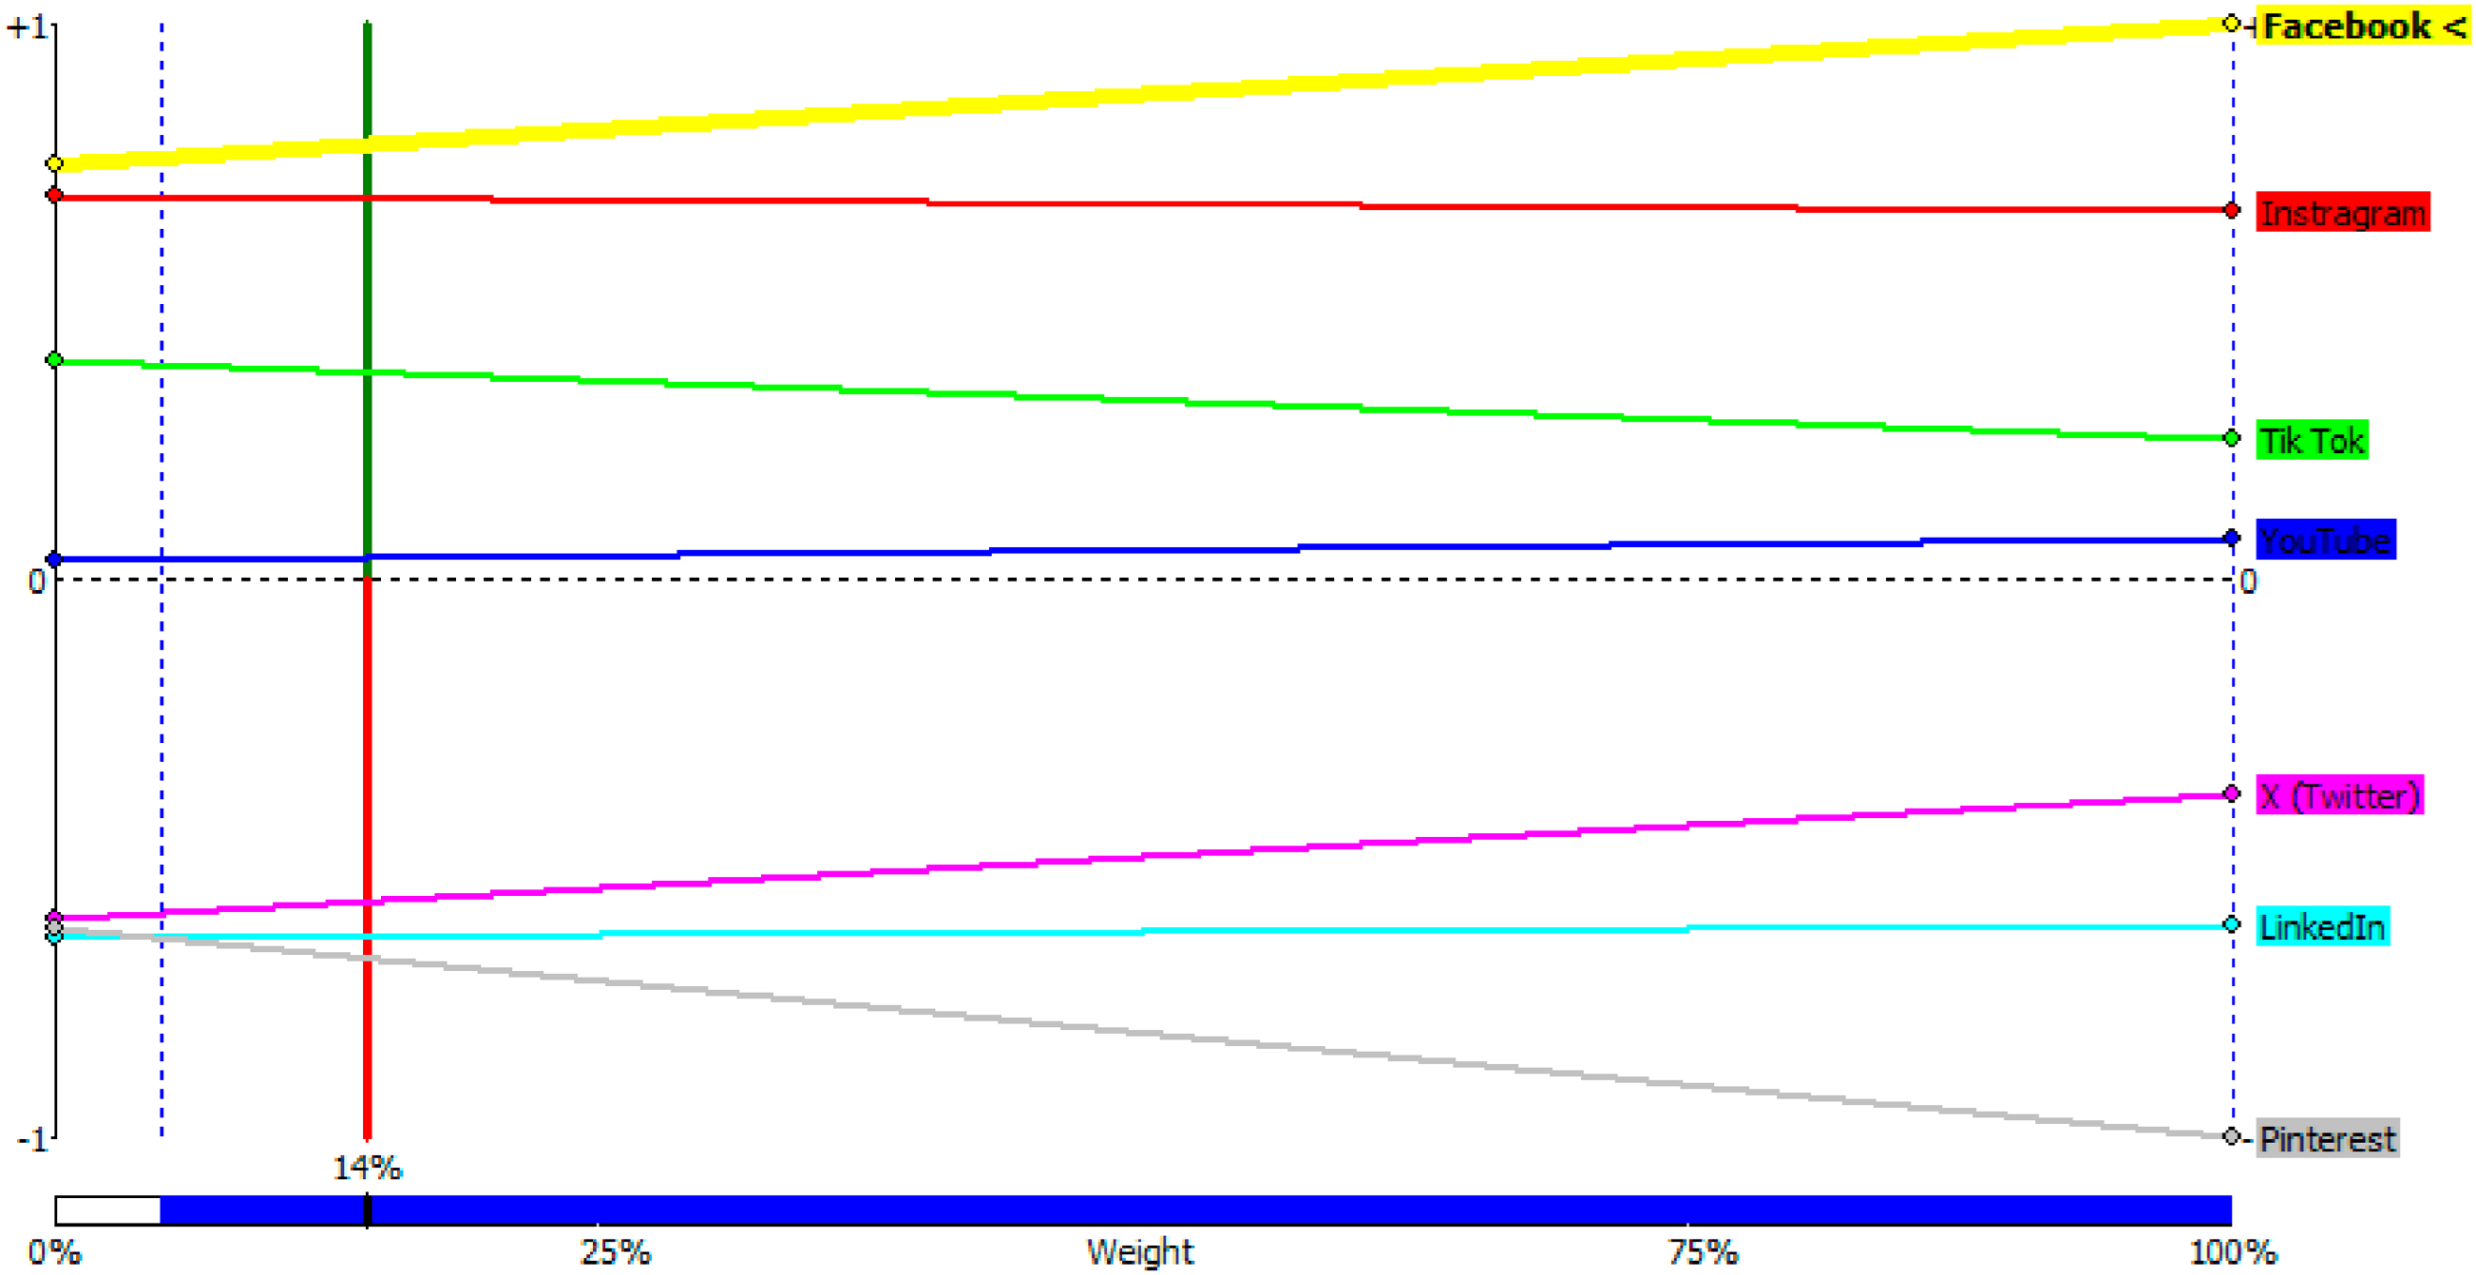
Figure 6 presents an analysis of the sensitivity of PROMETHEE II results to changes in the weight of a chosen criterion. The criterion’s weight is represented by the horizontal axis, which ranges from 0% to 100%, and the vertical axis represents the net preference flow (Φ) of each alternative. Each social media platform has a line that shows how its net flow fluctuates as the weight of the selected criteria changes. The selected criterion is the sole factor considered at the right edge of the graph (100%), while the criterion at the left edge (0%) has no impact on the ranking. In the baseline PROMETHEE II model, the weight assigned to the criterion is indicated by the vertical green and red bars. The final PROMETHEE II ranking reported in the results is determined by intersecting each platform’s line with this vertical reference line.
The rankings lines do not intersect within the relevant weight range, indicating that changes in ROI weight do not affect the relative ordering of the alternatives. The high-ranking stability indicates that the top-ranked platforms, specifically Facebook and Instagram, have not relied on a particular weighting assumption to maintain their dominance. In general, the sensitivity analysis confirms the reliability of the PROMETHEE II results, indicating that slight modifications to the criterion weights do not significantly affect the final ranking. The importance of this robustness is especially significant in managerial decision-making contexts, where the precise weight specification may be uncertain. The analysis strengthens confidence in the validity of the proposed evaluation framework by demonstrating the ranking’s stability across different weight values.
The preference flows (Φ) for each social media platform are presented in
Table 5, organized according to the seven evaluation criteria. The relative dominance or weakness of each platform, compared to a specific criterion, is represented by these values when compared pairwise. Positive (Φ) values indicate that a platform performs better than its competitors on a given metric, while negative values indicate that it performs worse. Comparable performance or weak discrimination can be inferred from values that are close to zero. Across platforms and criteria, the results show clear performance patterns. Facebook’s preference flow consistently shows strong positive trends across almost all criteria, with a focus on ROI, leads, cost efficiency, and reach, where it achieves the highest values. Facebook’s consistent superior performance in financial and efficiency-related dimensions strengthens its position as the most effective social media channel for supermarket advertising. Instagram has a high or near-high value in terms of revenue contribution, engagement, and feedback/eWOM, indicating strong positive preference flows. These findings emphasize Instagram’s ability to promote engagement and positive consumer feedback. It also complements Facebook’s superiority in conversion and efficiency metrics. These findings explain Instagram’s second-place ranking in the PROMETHEE II analysis. TikTok’s performance profile is distinctive. The platform’s effectiveness as an awareness- and interaction-driven platform is confirmed by its high engagement and extreme reach. Although TikTok has strong engagement capabilities, it is still behind Facebook and Instagram due to its weaker feedback performance and moderate scores in ROI and cost efficiency. YouTube falls somewhere in between, with preference flow values close to zero for most criteria. This implies balanced performance, but not dominance. The lack of clear outperformance and the strong dominance of other platforms suggest that YouTube plays a complementary rather than a leading role in supermarket social media strategies.
On the other hand, Twitter (X), LinkedIn, and Pinterest have largely negative preference flows across almost all criteria. Leads, engagement, and cost efficiency are particularly weak for X (Twitter), while LinkedIn has low engagement and reach, indicating its limited suitability for consumer-oriented supermarket communication. Pinterest consistently performs poorly compared to other platforms, displaying the most negative preference flows overall, particularly in terms of ROI, revenue, leads, and feedback. The drivers of the PROMETHEE II ranking are provided with significant insight in
Figure 6.
Platforms that combine positive preference flows across economic (ROI, revenue), interactional (engagement), and efficiency (Cost) criteria are rated higher overall. The lowest-ranked platforms are those with uniformly negative flows across these dimensions. A pattern consistent with an engagement-ROI trade-off is observed across Facebook, Instagram, and TikTok. This pattern may be interpreted through platform logic theory, which links interface design, algorithmic curation, and cultivated user behavior. Facebook supports both high engagement and strong conversion outcomes. A possible interpretation is that there is a well-developed advertising infrastructure with integrated shopping features. Its mature advertising ecosystem and integrated commerce may contribute to a transaction-oriented environment that appears to convert user attention into measurable sales. Thus, it supports strong conversion outcomes alongside engagement. However, TikTok (and, to some extent, Instagram) prioritizes viral reach and high-intensity interaction. They appear to be lagging in direct revenue attribution, which may be associated with their entertainment-first approach. They excel at brand visibility and community building, but present inherent friction for direct revenue attribution within the app. This divergence suggests that platform-specific architectures and user interaction logics may influence advertising effectiveness. This observation resonates with recent work on platform governance, algorithmic mediation, and socio-technical affordances, which argues that digital platform infrastructures shape economic and relational value creation in distinct ways.
The results demonstrate that PROMETHEE II is a valuable tool for decomposing overall performance into criterion-specific contributions. It offers practical guidance for evidence-based decision-making in the supermarket industry, aligned with economic and relational considerations for sustainability. The decision model operationalized sustainability-relevant dimensions by selecting and interpreting evaluation criteria instead of directly measuring sustainability outcomes or using a separate sustainability index. This distinction aligns with emerging scholarship that distinguishes between sustainability operationalization and sustainability outcome measurement within decision-support systems, particularly in marketing and strategic resource allocation contexts. Within the model, cost efficiency is a dimension related to economic sustainability, with the potential to reduce communication waste and allocate finite marketing resources more efficiently. In low-margin grocery retail, inefficient ad spending directly undermines long-term viability. By prioritizing platforms that deliver maximum reach and conversion per euro spent (e.g., lower cost-per-click, cost-per-lead), supermarkets reduce resource depletion. At the same time, they can maintain campaign effectiveness. This aligns with the economic pillar of the triple bottom line through financially accountable, waste-minimizing practices.
Feedback and eWOM consider aspects of relational (social) sustainability by examining stakeholder interactions, dialogue quality, and the potential for long-term relationship building. Unlike vanity metrics, these criteria capture authentic consumer dialogue, sentiment responsiveness, and organic advocacy—indicators of trust and community co-creation. When supermarkets systematically monitor and act upon feedback while nurturing positive eWOM, they build resilient brand-consumer relationships that withstand market volatility and foster long-term loyalty. This embodies social sustainability’s core principle: creating value through mutually beneficial, ongoing stakeholder engagement rather than extractive, short-term transactions.
Table 6 illustrates how the conceptual mapping of PROMETHEE II evaluation criteria to sustainability-related dimensions can be carried out. This mapping aids understanding of sustainability from a sustainability perspective, but does not provide direct measurement of sustainability outcomes. The interpretation of ROI and cost efficiency is based on economic sustainability. They ensure marketing resources are allocated efficiently and generate measurable financial returns—key for long-term viability in low-margin retail. Meanwhile, engagement, feedback, and eWOM bring relational (or social) sustainability. They capture trust, customer dialogue, and community co-creation, promoting resilient brand-consumer relationships beyond transactional exchanges. Revenue contribution and lead generation span both economic and relational domains, while reach primarily serves as an enabler rather than a sustainability outcome. The mapping illustrates how performance metrics can be reinterpreted through a sustainability lens, aligning tactical digital decisions with broader corporate responsibility objectives.
5. Conclusions
The paper proposed a method for evaluating social media advertising effectiveness that uses PROMETHEE II and qualitative insights from supermarket managers, employing a multi-criteria decision-aid approach. By reducing a diverse set of 34 performance factors to 7 essential criteria, such as ROI, revenue, leads, engagement, cost efficiency, feedback, and reach, PROMETHEE II was utilized in the study to generate a transparent ranking of major social media platforms. The results show significant differences in performance between platforms. Facebook was the top choice because of its balanced strength across financial and engagement metrics. Instagram closely followed, with a high score for interaction-related factors. TikTok performed well in terms of engagement but was less efficient in terms of Cost. YouTube was in the middle, while X (Twitter), LinkedIn, and Pinterest performed poorly across most dimensions. By combining managerial judgment with formal MCDA tools, these insights prove the worth of making evidence-based, sustainable, and strategically aligned marketing decisions in the supermarket industry. It is important to note that the framework does not provide a direct measure of sustainability outcomes, but rather facilitates decision-making aligned with sustainability-relevant economic and relational dimensions. The proposed framework is both practical and theoretically beneficial. It illuminates the multi-dimensional nature of communication performance and demonstrates how structured evaluation tools can support digital marketing strategies in competitive, sustainable retail environments.
5.1. Theoretical & Managerial Implications
The study advances the theory on retail social media effectiveness as a multi-dimensional construct. While most prior studies conceptualize social media effectiveness using isolated metrics, this study reframes effectiveness as a multi-dimensional decision problem grounded in managerial judgment and multi-criteria analysis. The study advances retail communication theory beyond linear and exposure-based models by theorizing effectiveness as a composite decision problem rather than a single-metric outcome. By conceptualizing platform evaluation as a structured multi-criteria decision-making problem, the study contributes to the growing body of research advocating decision-theoretic foundations for digital marketing strategy. It bridges the gap between qualitative managerial judgment and quantitative MCDA methods in the context of social media evaluation. By incorporating insights from 27 supermarket managers into the PROMETHEE II framework, it demonstrates how experiential knowledge can be systematically integrated into structured decision-making models, enhancing both relevance and rigor. While PROMETHEE II has been applied across various fields, its application to compare social media platforms in retail is novel. The study demonstrates how MCDA can effectively handle multiple conflicting criteria (e.g., engagement vs. cost efficiency) to produce a transparent ranking of platforms, providing a replicable model for similar retail or service sectors. The use of PROMETHEE Rainbow and GAIA plane visualizations helps translate complex MCDA results into actionable insights. This contribution to the theory highlights the importance of visual analytics in decision-making support systems, particularly for non-expert users, such as marketing managers. The sequential mixed-methods design (qualitative interviews → PROMETHEE II analysis) offers a methodological template for integrating expert judgment with multi-criteria modeling. It applies beyond social media to other areas of marketing and retail decision-making.
This study presents supermarket decision-makers with a systematic, data-driven methodology for assessing the effectiveness of social media advertising. By combining PROMETHEE II with managerial insights, a structured comparison can be made across multiple criteria, including ROI, leads, engagement, and cost efficiency, that correspond to the sector’s operational and strategic priorities. Managers can use the rankings to prioritize platforms that align most closely with their communication objectives, maximize their media budgets, and enhance the sustainability of their campaigns. In terms of financial and engagement-related dimensions, Facebook and Instagram demonstrated strong performance, as evidenced by the results. Meanwhile, TikTok’s interaction capabilities are impressive, but it may need to utilize other platforms to address cost or conversion metrics. While validated in grocery retail, this evaluation structure may inform platform selection in other high-frequency consumer goods sectors facing similar engagement-cost trade-offs.
Furthermore, the PROMETHEE Rainbow and GAIA visualizations provide diagnostic information on platform strengths and weaknesses, aiding more precise channel strategies. Supermarkets with limited marketing budgets can benefit from this, as evidence-based resource allocation is crucial for effective marketing. The model supports continuous performance monitoring and learning, as it can be regularly updated with campaign data and evolving strategic goals. This decision-aid framework strengthens the sustainability agenda in marketing. The framework aims to promote communication strategies that are efficient, targeted, and performance-aligned, thereby reducing wasteful advertising and increasing customer relevance.
5.2. Limitations
This study has strengths but also many limitations. The sample was restricted to 27 supermarkets in Northern Greece, which may impact the applicability of the findings to other regions or retail settings. Furthermore, the study’s reliance on self-reported performance data and managerial judgments may introduce common method bias and perceptual inaccuracies. The effectiveness scores used in the PROMETHEE analysis could reflect managerial perceptions rather than independently verified campaign outcomes. Furthermore, given that both the criteria weights and (partially perception-based) performance evaluations originate from the same managerial ecosystem, endogeneity or alignment bias cannot be fully excluded. The Greek retail context provides a transferable template for regions with similar supermarket density and platform ecosystems. Transferability requires alignment with local platform availability, consumer engagement norms, and promotional culture. Core criteria like ROI, engagement, and cost efficiency maintain universal relevance across retail contexts.
To strengthen external validity, the proposed framework can be readily adapted for use in supermarket sectors across other national contexts. The core criteria (ROI, engagement, cost efficiency, and eWOM) are universally relevant to retail digital marketing globally. However, contextual adjustments would be necessary. For instance, platform preferences vary by country (e.g., WeChat in China or VK in Russia). Local data privacy regulations influence. Some platforms are fully or partially banned or restricted in a few countries (Facebook in China and North Korea, TikTok in India). Cultural attitudes toward social commerce vary by country. Crisis-specific communication norms (such as those observed during pandemics or economic instability) also influence. All these factors impact both criterion weighting and performance data collection. By recalibrating the PROMETHEE II model with region-specific managerial input and platform metrics, the approach remains robust across diverse national contexts.
5.3. Future Research Directions
In the future, it is recommended that the analysis be expanded to include a more diverse and larger sample of retail organizations, potentially across countries or sectors. While PROMETHEE II can support decision-making, it requires subjective input for criterion weighting and preference function selection. Despite the relevance enhancement from manager-derived weights, bias persists. Future research could experiment with alternative MCDA methods, such as ELECTRE, AHP, or TOPSIS, to derive weights from campaign performance data using hybrid machine-learning models. The study consists of a static assessment that focuses on aggregate platform performance. Future work should investigate whether criterion weight stability holds across seasonal campaigns—a limitation of static MCDM approaches in dynamic retail environments. Social media dynamics are constantly evolving, and platform algorithms or consumer behavior can change over time. By applying the model longitudinally, we could track performance across campaign cycles and incorporate real-time data to enhance responsiveness and adaptiveness. Finally, expanding the model to include social and environmental indicators—such as ethical advertising and digital well-being—would better align it with broader sustainability goals. This integration could help link social media strategies more closely with corporate social responsibility (CSR) commitments.
Future research could integrate PROMETHEE with machine learning models. The convergence of MCDA and machine-learning-based predictive analytics represents a promising frontier in marketing science, enabling adaptive weighting schemes and real-time performance optimization. Such integration can autonomously derive criterion weights and detect performance patterns from large-scale campaign data. Thus, MCDA can be extended from a static evaluation tool to a dynamic decision-support system. The model can be extended to dynamic PROMETHEE frameworks that update rankings in real time. It is practically feasible because superior analytical tools are becoming available to measure platform algorithms, consumer behavior, or market conditions. This evolving nature would enhance its adaptive decision-support capacity.
Future research could conduct controlled comparisons between PROMETHEE II and alternative MCDM methods (e.g., TOPSIS, fuzzy AHP) using identical datasets to establish context-specific performance benchmarks. Such work would help develop decision trees for selecting MCDM methods in digital marketing contexts.



 ,
,