Abstract
The COVID-19 pandemic forced European Union member states to accelerate the digitalization of public services, turning a gradual policy priority into an urgent necessity. This study examines the pandemic’s impact on the digital transformation of public administrations, assessing the effectiveness of digital-oriented interventions implemented during this period. Using a Difference-in-Differences (DiDs) methodology, the analysis compares treatment and control groups based on 2019 Digital Economy and Society Index (DESI) scores, with digital public services as the dependent variable. Independent variables include pre-filled forms, service transparency, design and data protection, e-government usage, internet penetration, total population, and governance quality, covering all 27 EU member states from 2016 to 2023. Data sources include DESI, Eurostat, and the World Bank. The analysis shows that countries with lower digitalization achieved the largest post-pandemic gains, with transparency, service design, and data protection significantly enhancing digital service quality. Pre-existing governance and infrastructure shaped the magnitude of these improvements, highlighting the combined role of preparedness and reactive policy measures. The findings underscore the critical role of citizens as end-users and accountability drivers in digital governance. By providing empirical evidence on pandemic-driven digitalization trends, this study contributes to policy discussions on resilience, strategic planning, and the future of inclusive, transparent e-government services in the EU.
1. Introduction
Facing unprecedented challenges caused by the COVID-19 pandemic, countries all around the European Union found themselves in a position where the digitalization of public services was not only a necessity, but a priority (European Commission, 2024b).
This research aims to analyze the impact of the pandemic over the digitalization of public administrations, evaluating the effects of digital-oriented interventions and providing a clear overview of what has been performed. By applying a Difference-in-Differences (DiDs) methodology with data from DESI, Eurostat, and the World Bank, this study compares digitalization dynamics before and after the pandemic across the 27 EU member states.
Over the past two decades, scholarly attention to the digitalization of public administration has grown substantially, reflecting the broader global shift toward e-governance as a mechanism for enhancing efficiency, transparency, and citizen engagement (Mergel et al., 2019; Rozhkova et al., 2021). Early research emphasized the potential of digital services to streamline bureaucratic processes and reduce costs (Fang, 2002), while more recent studies have documented the expansion of e-government beyond traditional administrative functions into areas such as health, education, and transportation (Latupeirissa et al., 2024). The integration of advanced technologies—including big data analytics and artificial intelligence—has been linked to improvements in service personalization and decision-making (Androniceanu, 2023; Peña-López, 2010; Alvarenga et al., 2020), though adoption rates and outcomes vary widely among countries. Within the European Union, comparative analyses, such as those using the Digital Economy and Society Index (DESI), reveal persistent disparities in both infrastructure readiness and citizen uptake (European Commission, 2022b). This uneven progress underscores the need for adaptive strategies that address structural, cultural, and socio-economic barriers to digital transformation.
Despite widespread agreement on the benefits of digitalization, the literature presents diverging perspectives on the pathways to achieving effective e-governance. One line of argument posits that sustained, pre-crisis investment in digital infrastructure and human capital is the most reliable predictor of resilience, as evidenced by the strong performance of early adopters like Estonia and Denmark during the COVID-19 pandemic (Nielsen, 2017; Meyerhoff Nielsen & Ben Dhaou, 2023; Himma-Kadakas & Kõuts-Klemm, 2023). Conversely, other scholars contend that even countries with lower initial readiness can achieve rapid gains through agile, demand-driven policy interventions in times of crisis (Pulkkinen & Suhonen, 2023). A further point of contention concerns the role of advanced technologies such as AI: while proponents highlight their potential to optimize service delivery and enhance citizen satisfaction (Androniceanu, 2023), critics warn of unresolved risks related to bias, accountability, and data privacy (Henman, 2020; Teixeira et al., 2021). These debates indicate that there is no universally applicable model for digital transformation and contextual factors—ranging from governance quality to public trust—play a decisive role in shaping outcomes.
This study firstly analyses the most recent findings in the scientific literature for the EU countries, which generally stress the need for adaptive strategies capable of responding to unpredictable events. Secondly, the methodology section describes the data as well as the main benefits of employing a DiD model in such a context. Thirdly, this study reinforces the crucial role that citizens have in the digitalization process, as they are the end beneficiaries of public services and therefore should hold governments accountable for a lack of transparency and accessibility.
The objective of the current research can be defined under the following question: To what extent did EU member states’ pre-pandemic digital readiness versus their reactive measures during the COVID-19 crisis determine the pace and quality of progress in public service digitalization? A secondary question guiding this study is the following: How did specific governance factors—such as transparency, accountability, and citizen trust—shape the effectiveness of digital public service delivery during and after the pandemic, and what policy implications emerge from these dynamics?
While investigating the digitalization trends in the EU over a 7-year period, the paper will be able to contribute to the scientific literature by explaining whether prompt government reactions to the pandemic were sufficient or whether pre-pandemic digitalization planning and strategizing were required in order to provide qualitative services for their citizens in uncertain times.
The original contribution of the current paper consists of the fact that, unlike previous studies that have examined digitalization trends in Europe in a descriptive or country-specific manner, this paper applies a systematic EU-wide Difference-in-Differences (DiDs) approach to assess the impact of COVID-19 on public service digitalization. By linking pre-pandemic preparedness with reactive measures taken during the crisis, this study provides new empirical evidence on whether resilience depended more on long-term investments or short-term policy responses. This perspective offers a clearer understanding of the factors that shape divergent outcomes across the 27 EU member states. This paper is structured as follows: the next section is dedicated to the scientific literature analysis, the third part presents the data and methodology, the fourth part summarizes the results and proposes a discussion, and the last section holds the conclusions, the political implications and the limitations of the current study.
2. Theoretical Framework
2.1. Globally Observed Digitalization Trends in Public Institutions
In the period leading up to the COVID-19 crisis, researchers were arguing that many governments all around the world did not manage, at the time, to provide complete digitalized public services (Enang et al., 2020; Gil-Garcia et al., 2018; Hinings et al., 2018; Goloshchapova et al., 2023), even though some researchers argued for this necessity as early as 2002 (Fang, 2002). Even before the occurrence of such a crisis, the digitalization process was considered essential for strengthening the government-citizen relationship as it allowed for a more transparent and efficient delivery of public services (Mergel et al., 2019). Digitalization requires designing online solutions for real problems, managed by civil servants for citizens. Kautonen and Nieminen (2016) emphasize that both parties should actively seek to involve each other in the implementation of digital solutions, as they cannot function otherwise.
More recently, Castro and Lopes (2022) explain that administrative processes, which, due to their procedural complexity, would hinder citizens’ interest in adhering to them before digitalization, are now reduced to a couple of clicks on a screen, thus eliminating confusion, uncertainty and delays. Moreover, Latupeirissa et al. (2024) point out that digitalization is now not only a part of typical government services such as the issuance of documents, but is extended to matters such as public transportation, health and education, which ultimately leads to an improvement in the standard of living.
Two facets of the digitalization process are generally seen in big data analysis and artificial intelligence (AI). On one hand, a growing integration of AI in public services is observed by Androniceanu (2023), which leads to optimized data processing and personalized solutions that enhance users’ satisfaction. However, the involvement of AI in public administrations, and not only, is a rather new challenge that raises several questions concerning data privacy, prejudices and even accountability (Henman, 2020; Teixeira et al., 2021). On the other hand, big data analysis facilitates policy making through predictive analysis, real-time operation management, whilst simultaneously improving efficiency in resource allocation and reducing fraud opportunities (Peña-López, 2010; Wang & Ma, 2022; Yukhno, 2024). Improved resource allocation can be seen especially in the management of natural and financial resources, which, in turn, helps governments to develop sustainable economies, aligned to global objectives such as the Sustainable Development Goals of the United Nations (Mondejar et al., 2021; Balogun et al., 2020; Bahn et al., 2021; Torero, 2021).
Numerous developing countries face persistent poverty, and significant progress in improving citizens’ living conditions has been rare (Han et al., 2022). A key factor contributing to this stagnation is corruption, manifested through traditional forms of governance, paper-based systems, and unethical behavior of public officials, as well as deficiencies in government procurement systems and excessive bureaucracy. In this context, the digitalization of government activities becomes a vital necessity to promote more transparent and efficient governance (Phuyal, 2024). The implementation of digital technologies in administrative processes can reduce opportunities for corruption and improve the accessibility and quality of public services, while facilitating the accountability of public officials (Castro & Lopes, 2022). Therefore, a strategic commitment to digitalization is imperative to foster socio-economic development and respond to the needs of citizens (Glyptis et al., 2020; Shkarlet et al., 2020).
Social media platforms and digital tools have also simplified citizens’ interaction with the democratic process. According to the research conducted by Asimakopoulos et al. (2025), these tools enable individuals not only to express their opinions on policy proposals, but also to engage in public discussions or mobilize their communities in support of specific initiatives. This form of civic engagement strengthens the connection between citizens and authorities.
With the increasing use of digital technologies, governments are becoming increasingly aware of the need to protect cyber systems by ensuring the security of critical infrastructure and citizens’ personal data, as well as maintaining the integrity of democratic processes in the face of cyber threats (Zhao et al., 2015). Concerns related to data security have influenced users’ choices regarding public services, highlighting the need to assess security, privacy, cost, and efficiency—particularly in services such as tax declarations—in order to restore user trust and encourage the adoption of e-government services (Pleger et al., 2020).
E-governance, defined as the use of information and communication technologies, mainly the Internet, by the governmental sector, aims to improve the quality and accessibility of public information and services for citizens and governmental agencies, while promoting efficiency, transparency, and participation (Rozhkova et al., 2021; Apleni & Smuts, 2020). The concept encompasses various dimensions, including the execution of electronic transactions, transparency of governmental information, electronic interaction, knowledge management, and public participation in policy making, thereby contributing to a more open and efficient government (Tsybulnyk et al., 2020).
The primary goal of e-governance is to transform and significantly enhance the quality of services provided by the public sector through the adoption of a user-centered model that ensures accessibility and convenience for citizens (Dias, 2020). This transformation entails a profound digitalization of internal administrative processes, aimed at optimizing workflows and eliminating redundancies, thereby maximizing operational efficiency. The implementation of e-government encompasses a wide range of solutions, from innovative web platforms for accessing public services to the development of advanced systems for big data management and analytics. This highlights that the success of such an initiative relies not only on technology but also on the adaptive restructuring of governmental bodies and changes in the attitudes of public officials (Shkarlet et al., 2020).
Furthermore, e-government aims not only to facilitate interaction between government and society, but also to strengthen transparency in decision-making processes, reduce bureaucracy, and radically improve the quality of public services. In the long term, the implementation of e-government projects is expected not only to transform the operational model of public administration but also to create a more open and responsive framework aligned with citizens’ needs and expectations (Tsybulnyk et al., 2020).
E-government makes public administration more open, flexible, and easily accessible to citizens without requiring face-to-face interactions with officials. However, in order for e-government to be interactive and user-friendly, citizens must have access to ICT facilities and possess basic computer literacy skills. In other words, ICT infrastructure and digital literacy are essential for the success of e-government (Jamil & Dhakal, 2012). The digital transformation of governmental services represents a global movement aimed at improving efficiency and meeting the evolving needs of citizens in a rapidly changing world (Mergel et al., 2019).
E-governance further facilitates transparency and accountability by providing 24/7 access to information, standardizing data presentation, promoting open data initiatives, integrating services, and adopting blockchain technology, thereby reducing bureaucracy and reinforcing trust (Carlo Bertot et al., 2012). Digital governance strategies modernize the public sector by optimizing organizational structures, improving interactions with citizens and businesses, reducing costs and complexity, facilitating technological innovation, and enhancing service delivery, accessibility, and transparency (Arfeen & Saranti, 2021). Open and proactive communication strengthens trust and supports informed decision-making in both online and offline citizen participation (Mahmood et al., 2019). Collectively, these measures highlight the pivotal role of digital technologies and governance strategies in fostering accountable, transparent, and efficient public institutions.
Internet access is merely a first step in the adoption of e-governance; it remains insufficient without adequate digital literacy and citizen trust in governmental institutions. The quality and availability of digital services, in conjunction with users’ education levels, are essential for increasing engagement and satisfaction, as emphasized by Horobet et al. (2023).
2.2. Best Practices from EU Countries
The European Commission evaluates Estonia and Malta as the most advanced in e-government, highlighting these countries’ commitment to digitalization and administrative efficiency. Estonia, considered a global leader, offers innovative solutions such as digital identity and comprehensive online services that facilitate citizen interaction with public administration. Disparities in e-government adoption across other European states suggest the need for appropriate policies targeting the improvement of technological infrastructure and digital education to promote more responsible and inclusive governance (European Commission, 2022d; OECD, 2022).
Estonia stands out in best practices in e-government, having implemented an integrated digital system that enables citizens to access a diverse range of online services, such as electronic voting, business registration, and access to healthcare services (Himma-Kadakas & Kõuts-Klemm, 2023). Estonia has developed a robust digital identity that facilitates simple and secure access to various governmental platforms (Espinosa & Pino, 2024; e-Governance Academy Foundation, 2019; Morten Meyerhoff, 2016; Roots, 2017). These initiatives have contributed to strengthening citizens’ trust in governmental institutions and increasing civic participation (Mammadov, 2023).
Denmark is distinguished by its unified platform “Borger.dk,” a key example of e-government that facilitates citizens’ access to a variety of public services, including healthcare, taxation, and social assistance (Meyerhoff Nielsen & Ben Dhaou, 2023). The Danish government aims to fully digitalize public services, and this commitment has been internationally recognized as a model to follow (European Commission, 2024a; Morten Meyerhoff, 2016). This not only simplifies administrative processes but also enhances the user experience.
These best practice examples in e-government from Estonia and Denmark highlight the importance of an integrated and coordinated approach to digitalizing public services. Each of these countries demonstrates that successful e-government implementation relies on strong governmental commitment, investments in digital infrastructure, as well as adequate education and training for citizens. Investments in technology and the development of administrative capacities help streamline and optimize government processes, thereby providing citizens with quick and easy access to the services they need.
These initiatives not only improve citizen satisfaction but also contribute to increased trust in public institutions—an essential factor for strengthening democracy and civic participation. Therefore, the lessons learned from these countries can serve as a guide for other states aiming to improve e-government and ensure a more digitalized and integrated future for public services. (Himma-Kadakas & Kõuts-Klemm, 2023; Morten Meyerhoff, 2016).
We also observe a notable trend of growing accessibility and use of digital government services, a phenomenon that has expanded in recent years, as highlighted by the European Commission’s Digital Economy and Society Index (DESI, 2022). However, this expansion is uneven, with significant differences regarding the variety of available services and the population’s access to the necessary infrastructure. For example, a study by the European Court of Auditors (2022) pointed out that some EU countries have made drastic progress in e-government, while others face difficulties in adopting and effectively utilizing digital technologies.
According to the aforementioned research, developing efficient governments requires not only investments in infrastructure and education but also a strategic vision that integrates technological innovation with citizen-oriented policies. This will foster an environment conducive to sustainable economic and social growth, as suggested by a recent report from the McKinsey Global Institute (2023), which discusses the positive impact of digitalization in the public sector.
Moreover, integrating interactive platforms and digitalizing services facilitates community engagement, promoting a more transparent, inclusive, and well-governed society capable of efficiently responding to citizens’ needs amid technological advancement.
Although numerous studies examine the relationship between governments and citizens, it remains unclear which factors most strongly determine the adoption of e-government services and how costs correlate with benefits (Thomas & Streib, 2003; Chun et al., 2010; Nam, 2012). Nevertheless, the e-government paradigm, by reducing cash usage and streamlining tax collection, can significantly stimulate economic growth (Mouna et al., 2020).
The COVID-19 pandemic accelerated the digital transformation of governments; however, various countries are at different stages of this transition. Thus, the majority of European countries were among the early adopters of e-governance, compelling the European Union to commit to providing all essential public services online by 2030 (European Commission, 2022c).
The quality of public goods and services is fundamental for citizens’ trust in state institutions and societal welfare. Transparency enables access to accurate information on government activities and decisions, which is essential for accountability and oversight (Ibrahimy et al., 2023). Advanced digital technologies, including open data portals and interactive platforms, enhance transparency, foster citizen participation, monitor public resources, and help prevent corruption (Hochstetter et al., 2023). In European Union member states, the implementation of e-governance not only strengthens transparency but also contributes to socio-economic development, including GDP per capita, unemployment, and education, underscoring the importance of digital tools for effective governance (Cifuentes-Faura, 2022). While increased use of ICT and e-governance solutions promotes citizen engagement, excessive openness can undermine administrative efficiency (Halachmi & Greiling, 2013; Bannister & Connolly, 2012) or, in highly corrupt contexts, provoke resignation rather than outrage (Bauhr & Grimes, 2014). Accountability ensures decisions serve the public interest, preventing abuse of power and corruption, and encompasses administrative, political, legal, and financial responsibilities, as well as adherence to norms, allowing open management of public resources subject to societal critique (Doran et al., 2023; Ibrahimy et al., 2023; Zou et al., 2023; Shenkoya, 2023). Effective transparency policies empower citizens to access clear information, request explanations, and demand appropriate action.
According to Horobet et al. (2023), government efficiency is closely linked to resource allocation and digitalization, which, in turn, enhance transparency, accountability, and the quality of public services. The digitalization of the public sector is a vital process and is recognized as a strategic priority within the European Union. It promotes interoperability and accessibility of online services, contributing to the modernization of public administration and the development of a more collaborative environment.
2.3. Romania Overview
Romania is highlighted throughout the manuscript not only because it consistently ranks at the lower end of DESI indicators, but also because it provides a particularly illustrative case of the tensions between policy ambition and structural challenges. Despite persistently low scores in digital public services and human capital, the country has repeatedly launched large-scale initiatives—often supported by European funds—to modernize administrative processes, expand e-government platforms, and improve citizen access. The pandemic accelerated these efforts, with programs such as Ghiseul.ro serving as clear examples of reactive digitalization under crisis conditions. Romania, therefore, represents both the vulnerabilities of lagging digital preparedness and the opportunities created by targeted policies and rapid adaptation, making it an instructive case for understanding how pandemic-driven pressures shaped digital public service trajectories in the EU.
Globally, governmental organizations have integrated digital applications to optimize their operations, achieve better outcomes, and bring services closer to citizens. In recent years, Romania has taken steps toward the digitalization of its public administration through various national programs and initiatives supported by European funds. These projects, which gained momentum in the context of the SARS-CoV-2 pandemic, primarily aimed to improve IT infrastructure, develop online platforms for administrative services, and enhance the interoperability of governmental systems (Damaschin & Mihăilă, 2020). Specific areas of focus have included the digitalization of public registries and civil status services, the implementation of electronic signatures, and the development of online platforms for the payment of taxes and fees. Research in this field often centers on assessing the progress of public service digitalization, its impact on administrative efficiency, and citizen satisfaction.
An analysis of the DESI (Digital Economy and Society Index) reports from 2017 to 2022 reveals a mixed trend in the digitalization of public services in Romania, with notable progress alongside persistent challenges. It is important to note that DESI methodology has undergone updates in recent years, which may affect the strict comparability of scores across editions; nonetheless, the index remains the most authoritative benchmark for monitoring EU-wide digitalization trends. In 2017, Romania scored 32.0 points, indicating moderate digital development, supported by initiatives such as e-consultation for public policies and mobile applications for governmental services (European Commission, 2017). In 2018, Romania retained the last position among the 28 EU member states, although its score increased to 35.1 points due to improvements in four out of five dimensions; however, the digitalization of the economy and the population’s digital skills remained low (European Commission, 2018). In 2019, Romania ranked 27th out of 28 states, with a score of 36.5 points, showing its best performance in the “Connectivity” dimension, yet still lagging behind in the digitalization of the economy and public services (European Commission, 2019). The year 2020 brought a score of 40.0 points and a ranking of 26th out of 28 countries, with good results in connectivity, though one-fifth of Romanian citizens had never used the internet (European Commission, 2020).
In 2021, Romania dropped to 27th place out of 27 EU member states, with a score of 32.9 points, recording below-average results in human capital and digital public services, despite progress in connectivity (European Commission, 2021). In 2022, Romania remained in the last position among the 27 EU member states, with a score of 30.6 points, highlighting slow growth and a low level of basic digital skills, although connectivity performance remained satisfactory (European Commission, 2022a).
Trust in e-government is essential, as a lack of trust can hinder citizens’ adoption of digital services (France Belanger, 2008). The efficiency of digital services—characterized by reliability, response time, and ease of use—significantly enhances service quality. Effective governments are those that succeed in providing citizens with advanced digital public services and offer effective support through modern communication tools and channels. This efficiency can be influenced by various factors, including the population’s education level, degree of urbanization, infrastructure quality, and economic growth measured by GDP per capita (OECD, 2021). However, current research has not provided a conclusive explanation for the efficiency discrepancies among different governments. A study conducted by the World Bank (2021) indicates that it is not enough for a government to have resources; it is essential that these resources are managed efficiently to improve the quality of public services. Thus, an efficient government is not merely a service provider but also a facilitator of innovation and technological progress, with the capacity to respond quickly and effectively to its citizens’ needs (United Nations, 2020).
2.4. COVID-19—A Catalyst for Change
The COVID-19 pandemic served as an unpredictable catalyst for the digitalization of the public sector, compelling governments across Europe to rapidly implement digital solutions to meet citizens’ needs and ensure continuity of services. Social distancing measures highlighted the urgent need for digital tools to address the deficiencies of traditional systems. A notable acceleration of digitalization was observed across various sectors: telemedicine facilitated patient access to healthcare, schools and universities adapted through online learning platforms, and administrative services were rapidly digitalized. These developments demonstrated improved efficiency and accessibility of services during the health crisis.
Given that the COVID-19 pandemic represents a common external shock affecting all EU member states, and that digitalization trends can be observed both before and after the crisis, a Difference-in-Differences approach is well-suited to isolate the role of preparedness versus reactive measures. This design allows the study to connect theoretical debates on resilience and adaptability with empirical variation in digitalization outcomes, thereby providing a rigorous framework for testing the impact of government strategies in times of crisis.
Building on this discussion, the empirical analysis operationalizes the theoretical dimensions of e-governance through DESI-based indicators. Transparency and accountability are reflected in measures of public service transparency and availability of pre-filled forms, while citizen engagement is captured through e-government users and internet usage. Service quality and accessibility are represented by digital public services and businesses, complemented by structural controls such as population size and governance quality. This mapping ensures that the Difference-in-Differences design directly tests how both pre-crisis readiness and reactive interventions translated into measurable progress in digital public administration.
3. Materials and Methods
The current methodology aims to measure the impact of the COVID-19 pandemic on the digitalization of the public sector in the EU. The center point of the analysis relies on those respective countries that registered accelerated improvements in the implementation of digital services as a response to the sanitary crisis provoked by the COVID-19 virus.
The Difference-in-Differences (DiD) method is an economic evaluation technique used to estimate the effects of an intervention by comparing changes in outcomes between two groups: a treatment group affected by the intervention and a control group that was not. This approach relies on the assumption that, prior to the intervention, both groups followed similar trends, thereby allowing for the isolation of the intervention’s effect by analyzing the differences between them.
The relevance of the DiD method for analyzing the impact of the pandemic on the digitalization of public administration in the European Union is substantial. It enables a comparison of digitalization progress between countries that implemented specific measures and those that did not, providing a more accurate assessment of the net effect of the pandemic. The fixed-effects DiD model, as outlined by Tamuly and Mukhopadhyay (2022), offers advantages in addressing unobservable endogeneity and time-invariant specifications, making it a valuable tool for analyzing the impact of interventions on the public sector. While the use of DiD has increased over the past decade, many studies still lack sufficient evidence to support robust causal claims (Clair & Cook, 2015). Evaluations are based on criteria that classify the 27 EU member states into distinct groups: a treatment group composed of countries that accelerated digitalization after the pandemic and a control group of countries that were already digitalized beforehand. States with advanced digital infrastructures were able to maintain efficient operations during the crisis, as noted in the UN e-Government Survey. The research aims to assess the impact of the pandemic on digitalization and to establish a robust database capable of distinguishing between pre-existing trends and pandemic-induced effects. This facilitates a detailed analysis of post-pandemic digital measures and contributes to the formulation of more effective public policies. The Difference-in-Differences (DiD) method emerges as an effective methodological choice for analyzing the pandemic’s impact on the efficiency of public policies (Goodman-Bacon & Marcus, 2020), offering the advantage of comparing developments between treatment and control groups and isolating the effect of the intervention from external factors that may influence the outcomes.
The DiD method proves to be more adaptable and suitable for evaluating the impact of digitalization in public services. It not only enables a detailed analysis of pre-existing trends but also allows for a longitudinal assessment of the effects of digital measures implemented post-pandemic. This approach is essential in light of the significant transformations the health crisis has triggered in the relationship between citizens and public institutions. It offers a solid foundation for the development of informed and effective public policy in the future.
The treatment year is set to 2019, when the 27 EU countries are split between treatment and control groups using the “Digital Public Services” variable originating from the Digital, Economy and Society Index (DESI) database. The chosen variable is essential for measuring accessibility and efficiency because it reflects how public institutions integrate technology in their interactions with citizens.
In this context, according to Graph 1, the treatment group consists of those 14 countries with a score for Digital public services (0–100) less than the EU average in 2019, respectively: Belgium, Cyprus, Germany, the Czech Republic, Italy, Spain, Lithuania, Slovakia, Poland, Greece, Croatia, Hungary, Bulgaria, and Romania. The control group consists of the remaining 13 EU countries, which registered scores higher than the EU average. This differentiation will allow for a comparative evaluation between these more digitalized states’ responses and those with a lower degree of digitalization, therefore offering a better understanding of digital interventions after the pandemic.
The EU average in 2019 was selected as the benchmark because it provides a neutral and policy-relevant threshold, commonly used in European Commission reports to distinguish between countries with above- and below-average levels of digital development. This choice ensures comparability with existing policy assessments and avoids imposing arbitrary cut-offs that may not reflect institutional practice (see Figure 1).
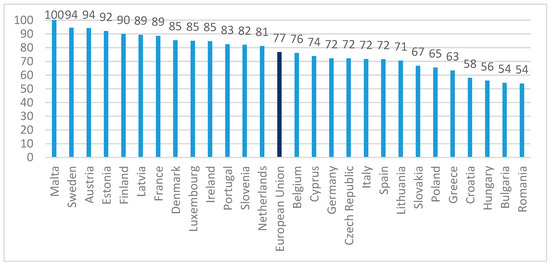
Figure 1.
Digital public services (score 0–100) in 2019 for EU member states.
The period between 2016 and 2023 is considered for research, as it is essential for evaluating the impact of the COVID-19 pandemic on the digitalization of the public sector within the European Union. This timeframe includes a pre-treatment phase (2016–2019) as shown in Figure 1, which is crucial for identifying historical trends in digitalization, allowing for an assessment of each country’s preparedness in facing the challenges posed by the pandemic. The post-treatment period (2020–2023) is likewise significant for collecting data related to the effects of rapid digitalization interventions, including the implementation of e-government initiatives and investments in information technology, given the accelerated pace of digital transformation following the pandemic.
This temporal structure was selected to ensure that the analyses conducted accurately reflect the pandemic’s influence on the digitalization of public administration, without being affected by other major events that could distort the results.
“Digital public services” will be used as the dependent variable, assessing the availability and online accessibility of such services, with a focus on key life events such as moving or studying. It aggregates five indicators—e-government usage, pre-filled forms, digital services for citizens, digital services for businesses, and open data—each scored from 0 to 100, to provide an overall assessment of public service digitalization. This indicator is scored on a scale from 0 to 100 to express the level of digitalization and is essential for comparing efficiency across countries and identifying areas in need of improvement.
In evaluating the digitalization of public services for citizens, several relevant indicators have been used to provide a comprehensive overview of the phenomenon. The first independent variable employed is “Pre-filled forms,” which measures the integration of data from official sources into online forms. Also scored on a scale from 0 to 100, this variable assesses both accessibility and efficiency. It enhances the user experience by automating information input, thereby reducing the time and effort required to complete forms and optimizing administrative processes. Additionally, the indicator “Service delivery transparency, design, and personal data” also uses a 0–100 scale to highlight the openness of public service delivery processes, user involvement in service design, and the management of personal data. Both independent variables contribute to strengthening trust and improving the relationship between citizens and public administration.
The “e-Government users” indicator measures the percentage of citizens utilizing electronic government services, expressed on a scale from 0 to 100, where higher scores reflect more effective usage. This indicator is essential for assessing the impact of governance quality on digitalization. To estimate the 2016 value, an extrapolation method was applied based on data from 2017 to 2023, using the calculated average annual growth rate. In parallel, the “Quality of governance” indicator assesses perceptions of the quality of public services, the independence of civil servants from political pressure, and the credibility of government commitments. This indicator is normalized on a scale from −2.5 to 2.5, with higher values indicating more effective governance. These two independent variables are closely related in that effective governance fosters the use of e-government services, thereby contributing to the advancement of digitalization in state-provided services.
On the other hand, the independent variable “Internet usage” has been included, measuring the percentage of individuals aged 16 to 74 who access the internet at least once a week. This reflects both the frequency of internet use and the population’s degree of connectivity. In parallel, the variable “Total population,” which represents the estimated total population of a country as of January 1st, provides essential demographic context for understanding access to and use of digital services. A larger population with high internet access may lead to increased usage of digital services, and the combined analysis of these indicators enables the development of effective digitalization policies tailored to citizens’ needs.
All these variables, also used in previous studies referenced in the research (Alvarenga et al., 2020; Apleni & Smuts, 2020; Aminah & Saksono, 2021), not only offer a detailed assessment of the current state of digital public services but also facilitate the identification of improvement opportunities and the adjustment of policies to better meet citizens’ needs in the digital era. In the context of challenges posed by the COVID-19 pandemic and the war in Ukraine, these analyses become even more relevant, as recent crises have highlighted the need for rapid and efficient digitalization of public services, emphasizing the importance of accessibility and transparency in interactions between citizens and the administration. Thus, a better understanding of these variables contributes to the development of tailored and effective policy responses capable of addressing both immediate needs and future challenges.
To ensure the validity of the analysis, it is fundamental to test the parallel trends hypothesis. This hypothesis posits that, in the absence of the intervention (i.e., the COVID-19 pandemic), the treatment and control groups should exhibit similar trends in the dependent variable, namely digital public services. The evaluation of this hypothesis was conducted through a graphical analysis of the indicator’s evolution within the EU sample, presented in Figure 2 which compares trends between the two groups.
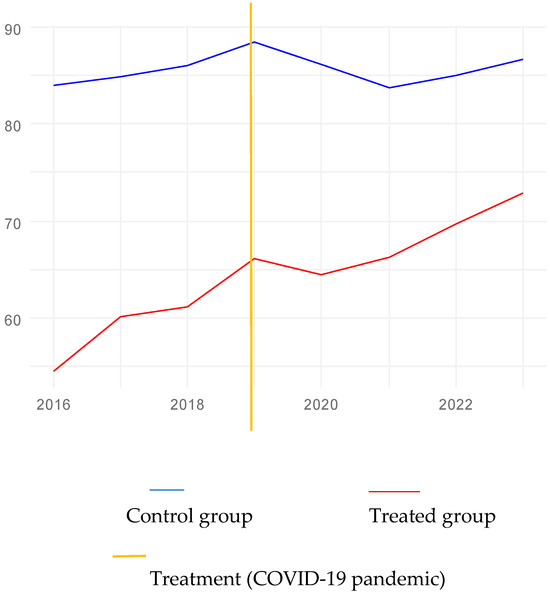
Figure 2.
Visualization of parallel trends assumption for Digital Public Services, 2016–2023.
The graph illustrates the evolution of the average scores for Digital public services between the control group and the treatment group from 2016 to 2023, highlighting a stable trend within the control group, while the treatment group experienced a significant increase in scores in the post-pandemic period. This suggests the positive effects of digital interventions in the context of the challenges posed by the health crisis. Digital interventions, particularly during pandemics, can significantly enhance access to and use of public services, and the observed increase in the treatment group indicates their effectiveness, thereby validating the methodology through the parallel trends test and graphical analysis.
In addition to the visual analysis, the validation of the parallel trends hypothesis will be addressed in the results section through the application of rigorous statistical tests, which will assess the statistical significance of the differences observed between the two groups. This approach will provide a robust foundation for the conclusions and the methodology applied in the study. Thus, by measuring the availability and accessibility of digital public services and evaluating the parallel trends hypothesis, the research will contribute to a deeper understanding of the pandemic’s impact on the digitalization of the public sector within the European Union, reinforcing the relevance of the findings obtained.
Furthermore, the variables analyzed in this study are summarized in Table 1, which provides detailed information on each included variable, as well as the Difference-in-Differences regression equation used in the study. This structure facilitates the understanding of the interactions between variables and provides a clear framework for interpreting the results. Through the systematic organization of this information, the study aims to highlight the contribution of each variable to the assessment of the impact of digital interventions, thereby emphasizing the relevance of the applied methodology within the research. The model includes country and year fixed effects to control for unobserved time-invariant heterogeneity and common shocks. The interaction term (Time × Treatment) captures the differential effect of the COVID-19 crisis on countries below the EU average in digital public services in 2019, relative to those above the threshold. All standard errors are adjusted for clustering at the country level (N = 27) using robust variance estimators, and confidence intervals are calculated based on Student’s t-distribution with N − 1 = 26 degrees of freedom. As a sensitivity check, we also computed wild cluster bootstrap p-values (B = 4999) for the main interaction coefficient.

Table 1.
Variable description.
Equation (1): The DiD regression.
Yit = β0 + β1 × Time i + β2 × Treatment (did) i + β3 × Time i × Treatment (did) i + β4 × form_pre it + β5 × transp it + β6 × util_eguv it + β7 × util_int it + β8 × pop it + β9 × ca_guv it + εit.
The Difference-in-Differences (DiD) model employed in this research is based on panel data characteristics to evaluate the impact of the COVID-19 pandemic on the digitalization of services provided by public institutions within the treatment group of the European Union. This approach enables a direct comparison between countries that implemented digital interventions in response to the health crisis and those that did not experience the same conditions, thereby facilitating a rigorously grounded assessment of the pandemic’s effects on the level of digitalization.
The fixed-effects DiD model offers considerable advantages over the classical DiD model, as it allows for the control of unobserved country-specific characteristics that remain constant over time. This ensures a more accurate estimation of the intervention’s impact by eliminating potential influences caused by country-specific factors such as economic context, culture, or administrative systems (Tamuly & Mukhopadhyay, 2022).
Additionally, the control of unobserved endogeneity is another major benefit of the fixed-effects model, allowing for better identification of causal relationships between digital interventions and observed outcomes in public service digitalization. This ability to isolate the effects of the intervention is essential for drawing robust and relevant conclusions regarding the digital transformation of public administration in the context of the pandemic.
Appendix A Table A1 presents, from a statistical perspective, the key descriptors of the annual variables considered for the EU27 sample, covering the period from 2016 to 2023, separately for the treated and control groups. For each variable, we report the number of observations (N), means and standard deviations, p-values derived from two-sample t-tests assessing the statistical significance of differences in means, and standardized mean differences (SMD) to facilitate an assessment of the magnitude of baseline imbalance.
These descriptive statistics serve as a critical diagnostic tool for evaluating the initial comparability between the treatment and control groups, thereby informing subsequent empirical strategies that aim to address any detected imbalances and ensure the robustness of causal inferences.
An analysis of baseline characteristics indicates significant disparities between the treated and control groups across multiple dimensions. Notably, digitalization indicators such as digital public services and pre-filled forms demonstrate pronounced differences; treated countries like Romania and Bulgaria exhibit substantially lower scores compared to control countries like Malta, the Netherlands, and Sweden, with mean values of approximately 64.4 and 50.0 versus over 85.0 and 73.9, respectively. The differences are statistically significant (p < 0.001) and are characterized by large standardized mean differences (SMD ≈ −2.2, SMD ≈ −1.2), indicating a profound initial gap in digital infrastructure and service provision.
Similarly, the transparency scores and e-Government usage metrics further illustrate this pattern of disparities. Countries such as Croatia and Romania within the treated group report substantially lower mean scores—approximately 55.4 for transparency and around 7.65 for e-Government usage—indicating a lower level of digital maturity and administrative openness. These figures are significantly lower compared to higher-performing control countries like Estonia and Malta, which often score above 74 in transparency and exhibit e-Government usage rates exceeding 11.1. The differences between the two groups are highly statistically significant (p < 0.001), with approximate standardized mean differences of −1.5 for transparency and −1.7 for e-Government usage. These differences mainly stem from variations in digital development and institutional capacity, which influence the adoption of e-Government services, while factors like administrative culture and digital infrastructure further shape transparency and citizen engagement in digital governance.
The comparison of population sizes between the control and treatment groups highlights significant heterogeneity in country sizes. The overall mean population in the control group is approximately 10,541,419, with Malta (around 449,635 in 2016) as the country with the smallest population and France (over 68 million in 2023) as the largest. In the treatment group, the mean population is approximately 22,056,374, with Cyprus (about 848,319 in 2016) being the smallest and Germany (approximately 83,237,124 in 2022) being the largest. While the difference in population size exhibits a moderate, positive SMD of 0.548, all other variables show large, statistically significant negative SMDs (less than −1), indicating that the differences in these variables are of greater magnitude and are in the opposite direction. Larger countries may face more complex infrastructural and coordination challenges in implementing digital policies, whereas smaller countries might benefit from simpler governance structures that facilitate more efficient policy execution.
The governance quality variable shows that the control group has a mean score of 1.395 (SD 0.369), ranging from 0.397 in the Netherlands (2017) to 2.01 in Finland (2018). The treatment group has a lower mean of 0.639 (SD 0.445), with scores from 0.445 in Romania (2020) to 1.66 in Germany (2016). The difference is highly significant (p = 0), with an SMD of −1.8, indicating that organizations in the treatment group perceive governance quality as substantially weaker.
Thus, the interpretation of these descriptive statistics provides not only a clear picture of data variability and distribution but also valuable insights into the challenges and successes of countries in the areas of governance and digitalization—crucial aspects for the formulation of effective future policies.
4. Results
Table 2 summarizes the main results of the panel DID model, obtained through a fixed effects regression which uses country-clustered standard errors.
Table 2.
DiD results (impact estimated at 13.6% increase from pre-period mean of 60.51 in the treated group).
Initially, an analysis was conducted by specifying the regression model using the formula serv_pubd ~ did * time. This model includes serv_pubd as the dependent variable and, as independent variables, both did (indicating membership in either the treatment or control group) and time (dividing the period into two phases: 2016–2019, representing the pre-pandemic period, and 2020–2023, the post-pandemic period).
This model structure allows us to examine the time-invariant effects of the intervention by comparing the evolution of digital services between countries that implemented measures to enhance digitalization in response to the pandemic and those that did not adopt such initiatives. By applying a fixed-effects model, the impact of the did variable on the level of digital public services was identified, controlling for country-specific variations. The difference-in-differences estimate for the interaction between treatment and post-period is β = 8.23 (cluster-robust SE = 2.37; 95% CI = [3.51, 12.95], df = 26). This effect corresponds to a 13.6% increase relative to the baseline mean score of 60.51 in treated countries, indicating a significant relative improvement in digital public services after the pandemic.
With an R-squared value of 0.23429, the model indicates that approximately 23% of the variation in serv_pubd is explained by these variables, despite the many other factors that influence the digitalization of public services. The statistically significant p-value for the coefficient confirms the substantial impact of the crisis on digitalization, highlighting the necessity of formulating effective public policies for the ongoing improvement of digital services. These findings not only illustrate the rapid adaptation of public administrations to the challenges of the crisis but also the opportunity to better meet citizens’ needs in the future.
Next, (see Table 3), it was verified whether the parallel trends between the treatment and control groups are satisfactory.
Table 3.
Test parallel trends and the Granger test.
Previously, a graph was produced to visualize the serv_pubd trends for the treatment and control groups over time, demonstrating that the trends were parallel before the COVID-19 pandemic. To rigorously verify this, both the Parallel Trends statistical test and the Granger Causality test (supplemental only) were applied.
The results of the preliminary analysis confirm the validity of the parallel trends hypothesis, a fundamental condition for the application of the Difference-in-Differences methodology. There is a significant initial difference between the treatment and control groups (the did coefficient is significantly negative), suggesting that, on average, the treatment group had a serv_pubd score 29.37 units lower than the control group before the intervention. The linear regression model applied to the pre-intervention period (2016–2019) did not indicate significant differences between the trends of the treatment and control groups (interaction coefficients: did/year2017 = 4.67, p-value = 0.336; did/year2018 = 4.63, p-value = 0.340; did/year2019 = 7.1152, p-value = 0.144). None of the interaction terms are statistically significant (p > 0.05), which supports the parallel trends hypothesis, indicating no evidence of differing trends between the groups before the intervention.
The joint F-test for the leads in 2017, 2018, and 2019 yielded a p-value of 0.1272 (see Appendix B, Table A2), indicating there is insufficient evidence to reject the null hypothesis that pre-treatment trends are parallel across groups. This supports the validity of the parallel trend assumption in our difference-in-differences analysis.
Moreover, the regression model will be extended to include additional independent variables, such as form_pre, transp, util_eguv, util_int, pop, and ca_guv, to analyze more deeply their impact on digital public services (serv_pubd). The results of this extended model can be found in Table 4.
Table 4.
Results of the extended FE DiD (serv_pubd ~ did × an + form_pre + transp + util_eguv + util_int + pop + ca_guv).
The examined model demonstrates the overall significance of the included variables, indicating that they substantially account for the variation in digital public services (serv_pubd). The F-statistic value of 11.8758 with a p-value below 2.22 × 10⁻¹⁶ confirms that the model is statistically well-grounded, while an R-Squared of 58.4% shows that over half of the variation in serv_pubd is explained by the analyzed variables. This is a considerable proportion, suggesting that the model captures a significant portion of the influences on serv_pubd.
5. Discussion
The DiD interaction terms (did/year), which reflect the impact of post-pandemic digitalization on public services, show positive effects during 2020–2023 (coefficients ranging from 11.64 to 20.47, all with p-values < 0.001). This suggests that digitalization is not a one-time intervention but a process whose impact amplifies over time, indicating continuing adaptation and improvement of services delivered to citizens. Ongoing investments in technology and infrastructure may further encourage citizens’ uptake and use of digital services.
These results can also be interpreted through the theoretical lenses outlined earlier. The dynamic DiD interaction terms highlight that digitalization unfolds as a cumulative process, consistent with the idea of crisis-as-catalyst, where shocks accelerate long-term adaptation. The strong effect of transparency, design, and data protection indicators resonates with accountability and trust theory, showing that openness is a critical driver of citizens’ confidence in digital public services. Finally, the mix of positive and negative signals across variables underscores that digital service quality is inherently multi-dimensional, combining accessibility, trust, efficiency, and user experience in complex ways.
The variable representing service delivery transparency, design, and personal data shows a significant positive coefficient (0.399, p-value < 0.001), indicating that greater transparency in public service delivery correlates with higher quality of digital public services. This underscores the importance of clear communication and information access for increasing citizens’ trust in digital services. Policies promoting open data and informational accessibility are essential to enhance trust. Mechanisms for reporting and evaluation also need to be embedded in the ongoing development of these services.
The negative and statistically significant association between e-Government usage and our composite service-quality measure (coefficient = –1.007, p = 0.028) is initially counter-intuitive. We propose three non-mutually exclusive interpretations. First, higher observed usage may reveal latent usability and integration problems as more users exercise the platform (exposure effect). Second, reverse causality may be present if countries with poorer pre-existing service quality actively pushed citizens to online channels during the pandemic, producing higher usage that follows rather than causes poor outcomes. Third, mandatory or necessity-driven use and acute capacity constraints can increase transaction volumes to the point that backend performance, user support, and satisfaction deteriorate.
A small but positive correlation with population size (coefficient 2.835 × 10⁻⁶, p = 0.049) implies that countries with larger populations generally possess more resources to develop and implement public digital services effectively. This finding invites reflection on how population scale influences administrative–technical capacities, potentially informing national digitalization strategies and encouraging inter-agency collaboration to optimize resource usage.
These variables—pre-filled forms, internet usage, and governance quality—did not show a statistically significant association with serv_pubd in this specification (p > 0.05). Although formal sensitivity analyses such as Variance Inflation Factors (VIF) and alternative scaling have not yet been conducted, such checks could be valuable in future research to further assess the robustness of these findings.
Particular attention should be given to treatment-group countries that achieved significant acceleration in digital service implementation in response to the COVID-19 crisis.
Treatment-group examples further include Italy, where lockdowns triggered the rapid expansion of digital services in public healthcare and education, with telemedicine and online learning platforms deployed to ensure continuity. Spain accelerated the digital transformation of public services with improved citizen access via digital platforms, including identity solutions like Cl@ve (Rocha, 2021) and SPID in Italy (Borriello, 2023). Poland advanced digital public services with enhanced citizen access to administrative and social services, focusing on user experience and support (Piątkowski & Misztal, 2022; Kolisnichenko, 2025). According to Kirilova and Naydenov (2021), Bulgaria implemented online tax and administrative payments, despite slower pre-pandemic digitalization. Hungary accelerated fiscal services digitalization between 2020 and 2022 (Szilágyiné & Bereczk, 2023). Slovakia adopted teleworking and online services for government document access, and the Czech Republic introduced new digital services for citizens and businesses during this period, enhancing e-government adoption, reducing transaction costs, and improving public service delivery; this transformation has underscored the need to continue e-government to modernize public and private sectors (Pisár et al., 2022).
In Romania, the pandemic spurred accelerated digital transformation of public services, revealing the urgent need to adapt governmental infrastructure to emerging challenges. Authorities launched initiatives such as the “COVID-19 Ro” platform, which provided essential citizen information and vaccination scheduling. This acceleration was enabled by closer inter-agency collaboration that improved digital service integration (Radu & Popescul, 2023). Romania made notable progress by launching key online services for tax, education, and health, and by significantly expanding Ghiseul.ro. However, research also highlights persistent challenges in e-government infrastructure, pointing to areas requiring attention (Oancea Negescu et al., 2021; Panait & Rădoi, 2021; Frățilă et al., 2023). An e-government analysis in Romania by Burlacu et al. (2024) emphasized the need for continued investment in digital infrastructure and staff training to maximize efficiency and citizen satisfaction.
These treatment-group examples illustrate that rapid digitalization measures adopted in response to the COVID-19 crisis significantly enhanced states’ capacity to deliver effective public services. The transition not only increased accessibility and efficiency but also demonstrated the practical application of technology in crisis management, bolstering institutional resilience. According to Banerjee et al. (2020), such transformative changes can reduce corruption and improve democratic processes. Yet, Schou and Pors (2019) highlight potential negative effects, including increased governmental surveillance, intensified digital divides and inequalities in Internet access, and digital skill deficits among the population.
It is essential to note that despite progress, challenges persist. Ongoing analysis of the effects of digital services on citizens remains critical, and user feedback will be vital to refining processes and ensuring services adequately address diverse population needs. Saxena et al. (2022) underscore that citizen involvement is necessary to overcome obstacles associated with public sector digitalization and to secure effective implementation of digital solutions. A balanced approach is required, weighing both benefits and risks—including ethical and privacy concerns, as well as risks of bias or exclusion in the application of artificial intelligence. Aminah and Saksono (2021) highlight the practical challenges governments face in fully leveraging technology to enhance public administration, including technical capacity constraints, staff resistance to change, and difficulties integrating legacy systems. Wang and Ma (2022) find that digital interfaces, particularly mobile applications, boost user satisfaction and evaluation of public services, making them more attractive to citizens; governments should prioritize their development to achieve administrative cost savings and improve user satisfaction.
The findings of this study carry several important implications for policymakers across EU member states and beyond. First, the consistently positive effects of post-pandemic digitalization underscore the value of treating digital transformation as a long-term strategic investment rather than an ad hoc response to crises. Governments should therefore prioritize sustained funding for digital infrastructure, interoperability, and secure platforms that can evolve with citizens’ needs.
Second, the strong role of transparency and data protection points to the need for policies that embed accountability and trust into every stage of digital service delivery. Policymakers should strengthen open data frameworks, ensure compliance with data protection standards, and develop clear communication strategies to reinforce citizens’ confidence in public platforms.
Third, the negative association with e-government usage indicates that rapid adoption without sufficient attention to efficiency and user experience can generate dissatisfaction. This highlights the importance of user-centric policy design, including systematic integration of citizen feedback, usability testing, and continuous improvement loops. Policymakers should institutionalize participatory governance practices to align digital services with citizens’ expectations.
Fourth, the modest positive association with population size suggests that larger states may benefit from economies of scale in digitalization. Smaller or less resource-endowed countries could therefore benefit from EU-level coordination, shared platforms, and cross-border cooperation to reduce costs and accelerate adoption. Policymakers should also explore regional partnerships that pool technical expertise and resources.
Finally, while digitalization enhances efficiency, it also carries risks of exclusion, surveillance, and inequality. To mitigate these, governments must adopt inclusive digital policies that address disparities in internet access, digital skills, and accessibility for vulnerable groups. Investment in digital literacy programs, targeted support for marginalized communities, and ethical guidelines for emerging technologies such as artificial intelligence should be central components of national strategies.
This study on the digitalization of public services during COVID-19 faces several limitations. Its EU-only scope restricts global generalizability, while uneven data quality hinders cross-country comparability. The regression model may exclude key factors such as culture or infrastructure, and the 2016–2023 timeframe prevents evaluation of long-term effects. Although statistical results appear significant, they rely on assumptions requiring careful validation. Moreover, limited attention to qualitative user experiences overlooks critical insights into service shortcomings and citizen expectations. Finally, given rapid technological change, observed progress may quickly become outdated. These constraints contextualize the findings and underscore the need for future research.
6. Conclusions
The COVID-19 pandemic has had a significant and positive effect on the digitalization of public services across EU member states, as shown by the DiD estimates for 2016–2023. The analysis demonstrates that countries such as Denmark or Estonia, with greater potential for acceleration, experienced sharper improvements, confirming the crisis’s role as a catalyst for digital transformation.
Theoretically, the findings highlight that transparency and accountability remain central to building citizen trust, while the multi-dimensional results across variables show that digital service quality cannot be reduced to a single indicator. The positive interaction terms also underline that digitalization is a cumulative, ongoing process rather than a one-time shock response.
From a policy perspective, the results suggest three priorities: continued investment in infrastructure, systematic training of public sector staff, and user-centered service design that incorporates citizen feedback. These steps are essential to consolidate trust, avoid inefficiencies, and ensure equitable access to digital services in the post-pandemic era.
This study is subject to limitations regarding data scope, time frame, and the exclusion of qualitative user perspectives. Future research should address these aspects and extend the analysis to different regional contexts to capture longer-term and global dynamics of digital public service delivery.
Author Contributions
Conceptualization, G.D. and M.B.; methodology, M.B and D.D.; software, M.B.; validation, G.D., D.D. and M.B.; formal analysis, M.B.; investigation, D.D.; resources, M.B.; data curation, M.B.; writing—original draft preparation, M.B. and D.D.; writing—review and editing, G.D.; visualization, D.D.; supervision, G.D.; project administration, G.D. All authors have read and agreed to the published version of the manuscript.
Funding
This research received no external funding.
Institutional Review Board Statement
Not applicable.
Informed Consent Statement
Not applicable.
Data Availability Statement
No new data were created or analyzed in this study. Data sharing is not applicable to this article.
Conflicts of Interest
The authors declare no conflicts of interest.
Abbreviations
The following abbreviations are used in this manuscript:
| DiD | Difference in Differences |
| DESI | Digital Economy and Society Index |
| EU | European Union |
| GDP | Gross Domestic Product |
Appendix A. Descriptive Statistics
Table A1.
Descriptive statistics by treatment from 2016 to 2023 for EU27 sample.
Table A1.
Descriptive statistics by treatment from 2016 to 2023 for EU27 sample.
| Variables | N_Control | Mean_Control | SD_Control | Min_Control | Max_Control | N_Treated | Mean_Treated | SD_Treated | Min_Treated | Max_Treated | p_Value | SMD |
|---|---|---|---|---|---|---|---|---|---|---|---|---|
| serv_pubd | 104 | 85.559 | 7.624 | 68.507 | 100 | 112 | 64.408 | 11.316 | 36.614 | 87.069 | 0 | −2.192 |
| form_pre | 104 | 73.892 | 16.64 | 26.875 | 100 | 112 | 49.991 | 21.375 | 4.625 | 93.413 | 0 | −1.248 |
| transp | 104 | 74.16 | 11.367 | 41.38 | 98.265 | 112 | 55.369 | 13.11 | 30.569 | 93.104 | 0 | −1.532 |
| util_eguv | 104 | 11.167 | 1.765 | 7.684 | 13.98 | 112 | 7.652 | 2.409 | 1.727 | 12.26 | 0 | −1.665 |
| util_int | 104 | 88.59 | 7 | 67.97 | 98.92 | 112 | 80.793 | 8.542 | 56.33 | 94.48 | 0 | −0.998 |
| Pop | 104 | 10,541,419 | 17,164,168 | 449,635 | 68,277,210 | 112 | 22,056,374 | 24,268,077 | 848,319 | 83,237,124 | 1.00 × 10⁻⁴ | 0.548 |
| ca_guv | 104 | 1.395 | 0.369 | 0.397 | 2.016 | 112 | 0.639 | 0.445 | −0.287 | 1.66 | 0 | −1.849 |
Source: authors’ processing.
Appendix B. Test Parallel Trends
Table A2.
Joint F-test.
Table A2.
Joint F-test.
| Linear hypothesis test: | ||||||
| did:an2017 = 0 | ||||||
| did:an2018 = 0 | ||||||
| did:an2019 = 0 | ||||||
| Model 1: restricted model | ||||||
| Model 2: serv_pubd ~ did + did:an2017 + did:an2018 + did:an2019 | ||||||
| Res. | Df | RSS | Df | Sum of Sq | F | Pr(>F) |
| 1 | 214 | 20,200 | ||||
| 2 | 211 | 19,663 | 3 | 537.03 | 1.9209 | 0.1272 |
Source: authors’ processing.
References
- Alvarenga, A., Matos, F., Godina, R., & Matias, J. C. O. (2020). Digital transformation and knowledge management in the public sector. Sustainability, 12(14), 5824. [Google Scholar] [CrossRef]
- Aminah, S., & Saksono, H. (2021). Digital transformation of the government: A case study in Indonesia. Jurnal Komunikasi: Malaysian Journal of Communication, 37(2), 272–288. [Google Scholar]
- Androniceanu, A. (2023). The new trends of digital transformation and artificial intelligence in public administration. Revista» Administratie si Management Public «(RAMP), 40, 147–155. [Google Scholar] [CrossRef]
- Apleni, A., & Smuts, H. (2020). An e-government implementation framework: A developing country case study. In Responsible design, implementation and use of information and communication technology: 19th IFIP WG 6.11 conference on ebusiness, e-services, and e-society, I3E 2020, Skukuza, South Africa, April 6–8, 2020, proceedings, part II 19 (pp. 15–27). Springer International Publishing. [Google Scholar] [CrossRef]
- Arfeen, M. I., & Saranti, D. (2021). Digital government strategies for sustainable development: A case study of Pakistan. Preprints. [Google Scholar] [CrossRef]
- Asimakopoulos, G., Antonopoulou, H., Giotopoulos, K., & Halkiopoulos, C. (2025). Impact of information and communication technologies on democratic processes and citizen participation. Societies, 15(2), 40. [Google Scholar] [CrossRef]
- Bahn, R. A., Yehya, A. A. K., & Zurayk, R. (2021). Digitalization for sustainable agri-food systems: Potential, status, and risks for the MEN Aregion. Sustainability, 13(6), 3223. [Google Scholar] [CrossRef]
- Balogun, A.-L., Marks, D., Sharma, R., Shekhar, H., Balmes, C., Maheng, D., Arshad, A., & Salehi, P. (2020). Assessing the potentials of digitalization as a tool for climate change adaptation and sustainable development in urban centres. Sustainable Cities and Society, 53, 101888. [Google Scholar] [CrossRef]
- Banerjee, A., Duflo, E., Imbert, C., Mathew, S., & Pande, R. (2020). E-Governance, accountability, and Leakage in public programs: Experimental evidence from a financial management reform in India. American Economic Journal-Applied Economics, 12(4), 39–72. [Google Scholar] [CrossRef]
- Bannister, F., & Connolly, R. (2012). The trouble with transparency: A critical review of openness in e-government. Policy & Internet, 3(1), 1–30. [Google Scholar] [CrossRef]
- Bauhr, M., & Grimes, M. (2014). Indignation or resignation: The implications of transparency for societal accountability. Governance, 27(2), 291–320. [Google Scholar] [CrossRef]
- Borriello, G. (2023). Il Mulino -Rivisteweb Spid vote: Fast democracy and digital identity for citizens in Italy «Spid vote»: Fast democracy and digital identity for citizens in Italy «SPID VOTE»: FAST DEMOCRACY AND DIGITAL IDENTITY FOR CITIZENS IN ITALY. Available online: https://www.researchgate.net/publication/372109467_Il_Mulino_-Rivisteweb_Spid_vote_fast_democracy_and_digital_identity_for_citizens_in_Italy_Spid_vote_fast_democracy_and_digital_identity_for_citizens_in_Italy_SPID_VOTE_FAST_DEMOCRACY_AND_DIGITAL_IDENT/citation/download (accessed on 6 October 2025).
- Burlacu, S., Crețu, R. C., Bâgu (Potcovaru), A. M., & Călin, A. M. (2024). Integrative digital governance: The role of public administration in promoting sustainable development amid post-pandemic technological innovations. In Proceedings of the international conference on business, economics and management. Sciendo. [Google Scholar] [CrossRef]
- Carlo Bertot, J., Jaeger, P. T., & Grimes, J. M. (2012). Promoting transparency and accountability through ICTs, social media, and collaborative e-government. Transforming Government: People, Process and Policy, 6(1), 78–91. [Google Scholar] [CrossRef]
- Castro, C., & Lopes, C. (2022). Digital government and sustainable development. Journal of the Knowledge Economy, 13, 880–903. [Google Scholar] [CrossRef]
- Chun, S. A., Shulman, S., Sandoval, R., & Hovy, E. (2010). Government 2.0: Making connections between citizens, data and government. Information Polity, 15(1–2), 1–9. [Google Scholar] [CrossRef]
- Cifuentes-Faura, J. (2022). The impact of e-government on transparency in the European Union: A multivariate analysis. Electronic Government, an International Journal, 18(1), 105–118. [Google Scholar] [CrossRef]
- Clair, T. S., & Cook, T. D. (2015). Difference-in-differences methods in public finance. National Tax Journal, 68(2), 319–338. [Google Scholar] [CrossRef]
- Damaschin, R., & Mihăilă, M. G. (2020). ‘Digitalizarea administrației publice din România în raport cu tendințele europene’, smart cities, facultatea de drept, universitatea Alexandru Ioan Cuza, Iași și facultatea de administrație publică, școala națională de studii politice și administrative, București. Available online: https://www.scrd.eu/index.php/scic/article/view/326/291 (accessed on 2 April 2025).
- DESI. (2022). Compare countries progress. Available online: https://digital-decade-desi.digital-strategy.ec.europa.eu/datasets/desi-2022/charts/desi-compare-countries-progress?indicator=desi_total&breakdownGroup=desi&period=2022&unit=pc_desi&breakdown=desi_total&country=EU,RO (accessed on 11 April 2025).
- Dias, G. P. (2020). Determinants of e-government implementation at the local level: An empirical model. Online Information Review, 44(7), 1307–1326. [Google Scholar] [CrossRef]
- Doran, N. M., Puiu, S., Bădîrcea, R. M., Pirtea, M. G., Doran, M. D., Ciobanu, G., & Mihit, L. D. (2023). E-government development—A key factor in government administration effectiveness in the European Union. Electronics, 12(3), 641. [Google Scholar] [CrossRef]
- e-Governance Academy Foundation. (2019). e-estonia: E-governance in practice. Available online: https://ega.ee/wp-content/uploads/2016/06/e-Estonia-e-Governance-in-Practice.pdf#page=80.10 (accessed on 11 April 2025).
- Enang, I., Asenova, D., & Bailey, S. J. (2020). Identifying Influencing Factors of Sustainable Public Service Transformation: A Systematic Literature Review. International Review of Administrative Sciences, 88(1), 1–23. [Google Scholar] [CrossRef]
- Espinosa, V. I., & Pino, A. (2024). E-government as a development strategy: The case of Estonia. International Journal of Public Administration, 48, 86–99. [Google Scholar] [CrossRef]
- European Commission. (2017). Digital economy and society index 2017-Romania. Available online: https://digital-strategy.ec.europa.eu/en/library/digital-economy-and-society-index-desi-2017 (accessed on 24 March 2025).
- European Commission. (2018). Digital economy and society index 2018-Romania. Available online: https://digital-strategy.ec.europa.eu/en/library/digital-economy-and-society-index-2018-report (accessed on 24 March 2025).
- European Commission. (2019). Digital economy and society index 2019-Romania. Available online: https://digital-strategy.ec.europa.eu/en/library/digital-economy-and-society-index-desi-2019 (accessed on 24 March 2025).
- European Commission. (2020). Digital economy and society index 2020-Romania. Available online: https://digital-strategy.ec.europa.eu/en/library/digital-economy-and-society-index-2020-report (accessed on 24 March 2025).
- European Commission. (2021). Digital economy and society index 2021-Romania. Available online: https://digital-strategy.ec.europa.eu/en/library/digital-economy-and-society-index-2021-report (accessed on 24 March 2025).
- European Commission. (2022a). Digital economy and society index 2022-Romania. Available online: https://digital-strategy.ec.europa.eu/en/library/digital-economy-and-society-index-2022-report (accessed on 24 March 2025).
- European Commission. (2022b). Digital economy and society index (DESI) 2022. Available online: https://digital-strategy.ec.europa.eu/en/policies/desi (accessed on 4 April 2025).
- European Commission. (2022c). eGovernment and digital public services. Available online: https://digital-strategy.ec.europa.eu/en/policies/egovernment (accessed on 4 April 2025).
- European Commission. (2022d). eGovernment benchmark 2022. Available online: https://digital-strategy.ec.europa.eu/en/library/egovernment-benchmark-2022 (accessed on 4 April 2025).
- European Commission. (2024a). High-value datasets best practices report. Available online: https://op.europa.eu/en/publication-detail/-/publication/3170ef76-55f8-11ef-acbc-01aa75ed71a1/language-en (accessed on 19 April 2025). [CrossRef]
- European Commission. (2024b). State of the digital decade. European Commission. Available online: https://eur-lex.europa.eu/legal-content/EN/TXT/HTML/?uri=CELEX:52024DC0260 (accessed on 19 April 2025).
- European Court of Auditors. (2022). E-government in the EU: E-government actions targeting businesses: Commission’s actions implemented, but availability of e-services still varies across the EU. Special report 24. Available online: https://books.google.ro/books/about/E_government_Actions_Targeting_Businesse.html?id=QTLKzwEACAAJ&redir_esc=y (accessed on 20 April 2025).
- Fang, Z. (2002). E-government in digital era: Concept, practice, and development. International Journal of the Computer, the Internet and Management, 10(2), 1–22. [Google Scholar]
- France Belanger, L. C. (2008). Trust and risk in e-government adoption. The Journal of Strategic Information Systems, 165–176. [Google Scholar] [CrossRef]
- Frățilă, A., Păunescu, M., Nichita, E.-M., & Lazăr, P. (2023). Digitalization of Romanian public administration: A panel data analysis at regional level. Journal of Business Economics and Management, 24(1), 74–92. [Google Scholar] [CrossRef]
- Gil-Garcia, J. R., Dawes, S. S., & Pardo, T. A. (2018). Digital government and public management research: Finding the crossroads. Public Management Review, 20(5), 633–646. [Google Scholar] [CrossRef]
- Glyptis, L., Christofi, M., Vrontis, D., Del Giudice, M., Dimitriou, S., & Michael, P. (2020). E-Government implementation challenges in small countries: The project manager’s perspective. Technological Forecasting and Social Change, 152, 119880. [Google Scholar] [CrossRef]
- Goloshchapova, T., Yamashev, V., Skornichenko, N., & Strielkowski, W. (2023). E-government as a key to the economic prosperity and sustainable development in the post-COVID era. Economies, 11, 112. [Google Scholar] [CrossRef]
- Goodman-Bacon, A., & Marcus, J. (2020). Using difference-in-differences to identify causal effects of COVID-19 policies. Survey Research Methods, 14(2), 153–158. [Google Scholar] [CrossRef]
- Halachmi, A., & Greiling, D. (2013). Transparency, e-government, and accountability: Some issues and considerations. Public Performance & Management Review, 36(4), 562–584. [Google Scholar] [CrossRef]
- Han, L., Li, X., & Xu, G. (2022). Anti-corruption and poverty alleviation: Evidence from China. Journal of Economic Behavior & Organization, 203, 150–172. [Google Scholar] [CrossRef]
- Henman, P. (2020). Improving public services using artificial intelligence: Possibilities, pitfalls, governance. Asia Pacific Journal of Public Administration, 42(4), 209–221. [Google Scholar] [CrossRef]
- Himma-Kadakas, M., & Kõuts-Klemm, R. (2023). Developing an advanced digital society: An Estonian case study. In S. Davydov (Ed.), Internet in the post-soviet area. Societies and political orders in transition. Springer. [Google Scholar] [CrossRef]
- Hinings, B., Gegenhuber, T., & Greenwood, R. (2018). Digital innovation and transformation: An institutional perspective. Information and Organization, 28(1), 52–61. [Google Scholar] [CrossRef]
- Hochstetter, J., Vásquez, F., Diéguez, M., Bustamante, A., & Arango-López, J. (2023). Transparency and e-government in electronic public procurement as sustainable development. Sustainability, 15, 4672. [Google Scholar] [CrossRef]
- Horobet, A. L., Mnohoghitnei, I., Zlatea, E. M. L., & Smedoiu-Popoviciu, A. (2023). Determinants of e-government Use in the European Union: An empirical analysis. Societies, 13, 150. [Google Scholar] [CrossRef]
- Ibrahimy, M. M., Virkus, S., & Norta, A. (2023). The role of e-government in reducing corruption and enhancing transparency in the Afghan public sector: A case study. Transforming Government: People, Process and Policy, 17(3), 459–472. [Google Scholar]
- Jamil, I., & Dhakal, T. N. (2012). Benefits and challenges of e-governance for service delivery in Nepal. Springer. [Google Scholar] [CrossRef]
- Kautonen, H., & Nieminen, M. P. (2016). Critical look at the user-centered design competencies. In Proceedings of the 9th nordic conference on human-computer interaction (NordiCHI ‘16) (Article 20, pp. 1–10). Association for Computing Machinery. [Google Scholar] [CrossRef]
- Kirilova, K., & Naydenov, A. (2021). The state of e-government and digital administrative services in the republic of Bulgaria. Стoпанска академия »Д. А. Ценoв«, 2, 5–20. Available online: https://www.ceeol.com/search/article-detail?id=981030 (accessed on 11 April 2025).
- Kolisnichenko, P. (2025). Poland’s society 4.0: How digital tools are changing everyday life. Economics, Finance and Management Review, 1(21), 4–16. [Google Scholar] [CrossRef]
- Latupeirissa, J. J. P., Dewi, N. L. Y., Prayana, I. K. R., Srikandi, M. B., Ramadiansyah, S. A., & Pramana, I. B. G. A. Y. (2024). Transforming public service delivery: A comprehensive review of digitization initiatives. Sustainability, 16, 2818. [Google Scholar] [CrossRef]
- Mahmood, M., Weerakkody, V., & Chen, W. F. (2019). The influence of transformed government on citizen trust: Insights from Bahrain. Information Technology for Development, 25(2), 275–303. [Google Scholar] [CrossRef]
- Mammadov, A. (2023). Overcoming the challenges of digitalization: The Estonian experience. Eco, 1(8), 33. [Google Scholar]
- McKinsey Global Institute. (2023). McKinsey technology trends outlook 2023. Available online: https://www.mckinsey.com/capabilities/mckinsey-digital/our-insights/the-top-trends-in-tech-2023#new-and-notable (accessed on 30 April 2025).
- Mergel, I., Edelmann, N., & Haug, N. (2019). Defining digital transformation: Results from expert interviews. Government Information Quarterly, 36(4), 101385. [Google Scholar] [CrossRef]
- Meyerhoff Nielsen, M., & Ben Dhaou, S. (2023). Case studies on digital transformation of social security administration and services: Case study Denmark. Available online: http://collections.unu.edu/eserv/UNU:9179/case-study-digital-transformation-SSAS-DENMARK.pdf (accessed on 25 March 2025).
- Mondejar, M. E., Avtar, R., Diaz, H. L. B., Dubey, R. K., Esteban, J., GomezMorales, A., Hallam, B., Mbungu, N. T., Okolo, C. C., Prasad, K. A., She, Q., & Garcia-Segura, S. (2021). Digitalization to achieve sustainable development goals: Steps towards a smart green planet. Science of the Total Environment, 794, 148539. [Google Scholar] [CrossRef]
- Morten Meyerhoff, N. (2016). Governance and online service delivery: The Danish case. In Electronic government and electronic participation. 15th IFIP electronic government (EGOV) and 8th electronic participation (ePart) conference 2016 (pp. 180–190). Innovation and the Public Sector. IOS Press. [Google Scholar] [CrossRef]
- Mouna, A., Nedra, B., & Khaireddine, M. (2020). International comparative evidence of e-government success and economic growth: Technology adoption as an anti-corruption tool. Transforming Government: People, Process and Policy, 14, 713–736. [Google Scholar] [CrossRef]
- Nam, T. (2012). Citizens’ attitudes toward open government and government 2.0. International Review of Administrative Sciences, 78(2), 346–368. [Google Scholar] [CrossRef]
- Nielsen, M. M. (2017). EGovernance and online service delivery in Estonia. In Proceedings of the 18th annual international conference on digital government research (dg.o ‘17) (pp. 300–309). Association for Computing Machinery. [Google Scholar] [CrossRef]
- Oancea Negescu, M. D., Burlacu, S., Biner, M., Platagea Gombos, S., Kant, A., & Troacă, A. V. (2021). Paradigms of public administration digitalization in the context of the COVID-19 pandemic. In Proceedings of administration and public management international conference (Vol. 17, pp. 109–115). Research Centre in Public Administration and Public Services. [Google Scholar]
- OECD. (2021). Government at a glance 2021. OECD Publishing. [Google Scholar] [CrossRef]
- OECD. (2022). Education at a glance 2022: OECD indicators. OECD ilibrary. Available online: https://www.oecd.org/en/publications/2022/10/education-at-a-glance-2022_4aad242c.html (accessed on 30 April 2025).
- Panait, N., & Rădoi, M. (2021). The degree of digitalization of public services in Romania (pp. 875–881). Challenges of the Knowledge Society. [Google Scholar]
- Peña-López, I. (2010). Policy-making for digital development: The role of the government. ACM International Conference Proceeding Series. Association for Computing Machinery. [Google Scholar] [CrossRef]
- Phuyal, P. (2024). Digitalization of government services and citizen satisfaction: A case study in Dhankuta district. Nepal, Prashasan, 56(1), 135–152. [Google Scholar] [CrossRef]
- Piątkowski, M., & Misztal, J. (2022). The impact of digitalization on society in the context of public services in Poland. Wydawnictwo Uniwersytetu Komisji Edukacji Narodowej w Krakowie. Available online: https://www.ceeol.com/search/article-detail?id=1100924 (accessed on 11 April 2025).
- Pisár, P., Priščáková, S., Špaček, D., & Nemec, J. (2022). Digitization as a tool of e-government in selected public services of the state: International comparison of Slovakia and the Czech Republic. Revista »Administratie si Management Public« (RAMP), 39, 111–132. Available online: https://www.ceeol.com/search/article-detail?id=1231193 (accessed on 11 April 2025). [CrossRef]
- Pleger, L. E., Mertes, A., Rey, A., & Brüesch, C. (2020). Allowing users to pick and choose: A conjoint analysis of end-user preferences of public e-services. Government Information Quarterly, 37, 101473. [Google Scholar] [CrossRef]
- Pulkkinen, J., & Suhonen, M. (2023). Digitalisaatiovalmiuteen liittyvät olosuhteet kuntien teknisellä toimialalla. Focus Localis, 51(4), 23–40. Available online: https://journal.fi/focuslocalis/article/view/130585 (accessed on 30 April 2025).
- Radu, L.-D., & Popescul, D. (2023). The role of data platforms in COVID-19 crisis: A smart city perspective. Aslib Journal of Information Management, 75(6), 1033–1055. [Google Scholar] [CrossRef]
- Rocha, J. (2021). Spanish and portuguese eIDAS node evolution for electronic identification of European citizens. In Proceedings of the 10th Euro-American conference on telematics and information systems (EATIS ‘20) (Article 60, pp. 1–5). Association for Computing Machinery. [Google Scholar] [CrossRef]
- Roots, L. (2017). E-governance in providing public services in Estonia: A case study. Zeszyty Naukowe Politechniki Poznańskiej Organizacja i Zarządzanie, 74, 77–93. [Google Scholar] [CrossRef]
- Rozhkova, D., Rozhkova, N., & Blinova, U. (2021). Development of the egovernment in the context of the 2020 pandemics. In International conference on advances in digital science (pp. 465–476). Springer International Publishing. [Google Scholar] [CrossRef]
- Saxena, D., Muzellec, L., & McDonagh, J. (2022). From bureaucracy to citizen-centricity: How the citizen-journey should inform the digital transformation of public services. International Journal of Electronic Government Research (IJEGR), 18(1), 1–17. [Google Scholar] [CrossRef]
- Schou, J., & Pors, A. S. (2019). Digital by default? A qualitative study of exclusion in digitalised welfare. Social Policy & Administration, 53(3), 464–477. [Google Scholar] [CrossRef]
- Shenkoya, T. (2023). Can digital transformation improve transparency and accountability of public governance in Nigeria? Transforming Government: People, Process and Policy, 17(1), 54–71. [Google Scholar]
- Shkarlet, S., Oliychenko, I., Dubyna, M., Ditkovska, M., & Zhovtok, V. (2020). Comparative analysis of best practices in e-government implementation and use of this experience by developing countries. Administratie si Management Public, 34, 118–136. [Google Scholar] [CrossRef]
- Szilágyiné, E., & Bereczk, A. (2023). The impact of digitalization in the public sector. In ТЪРГОВИЯ 5.0—ДИГИТАЛИЗАЦИЯ И/ИЛИ ХУМАНИЗАЦИЯ. Сборник с доклади от международна научна конференция—13 октомври 2023 г (pp. 205–212). Икoнoмически университет. Available online: https://www.ceeol.com/search/chapter-detail?id=1180125 (accessed on 30 April 2025).
- Tamuly, R., & Mukhopadhyay, P. (2022). Natural disasters and well-being in India: A household-level panel data analysis. International Journal of Disaster Risk Reduction, 79, 103158. [Google Scholar] [CrossRef]
- Teixeira, A. F., Gonçalves, M. J. A., & Taylor, M. d. L. M. (2021). How higher education institutions are driving to digital transformation: A case study. Education Sciences, 11(10), 636. [Google Scholar] [CrossRef]
- Thomas, J. C., & Streib, G. (2003). The new face of government: Citizen—Initiated contacts in the era of E—Government. Journal of Public Administration Research and Theory, 13(1), 83–102. [Google Scholar] [CrossRef]
- Torero, M. (2021). Robotics and AI in food security and innovation: Why they matter and how to harness their power (pp. 99–107). Springer. [Google Scholar] [CrossRef]
- Tsybulnyk, N., Zadoia, I., Kurbatova, I., & Povydysh, V. (2020). E-government within public administration. Jurnal Cita Hukum, 8. [Google Scholar] [CrossRef]
- United Nations. (2020). E-government surveys. United Nations department of economic and social affairs. Digital government in the decade of action for sustainable development. Available online: https://publicadministration.un.org/egovkb/Portals/egovkb/Documents/un/2020-Survey/2020%20UN%20E-Government%20Survey%20(Full%20Report).pdf#page=31.55 (accessed on 11 April 2025).
- Wang, C., & Ma, L. (2022). Digital transformation of citizens’ evaluations of public service delivery: Evidence from China. GPPG, 2, 477–497. [Google Scholar] [CrossRef]
- World Bank. (2021). World development report 2021: Data for better lives. World Bank Publications. Available online: https://www.worldbank.org/en/publication/wdr2021 (accessed on 11 April 2025).
- Yukhno, A. (2024). Digital transformation: Exploring big data governance in public administration. Public Organization Review, 24, 335–349. [Google Scholar] [CrossRef]
- Zhao, F., Wallis, J., & Singh, M. (2015). E-government development and the digital economy: A reciprocal relationship. Internet Research, 25(5), 734–766. [Google Scholar] [CrossRef]
- Zou, Q., Mao, Z., Yan, R., Liu, S., & Duan, Z. (2023). Vision and reality of e-government for governance improvement: Evidence from global cross-country panel data. Technological Forecasting and Social Change, 194, 122667. [Google Scholar] [CrossRef]
Disclaimer/Publisher’s Note: The statements, opinions and data contained in all publications are solely those of the individual author(s) and contributor(s) and not of MDPI and/or the editor(s). MDPI and/or the editor(s) disclaim responsibility for any injury to people or property resulting from any ideas, methods, instructions or products referred to in the content. |
© 2025 by the authors. Licensee MDPI, Basel, Switzerland. This article is an open access article distributed under the terms and conditions of the Creative Commons Attribution (CC BY) license (https://creativecommons.org/licenses/by/4.0/).