Abstract
Modern hotel business models tend to split ownership of the property and its business operations. It can be assumed that a good-quality hotel facility per se can easily achieve high customer satisfaction. The purpose of this research was to investigate the effect of customer perception of hotel facilities on customer satisfaction by integrating the mediating effect of customer perception of the personnel and business organization and the moderating effect of the customers’ family income. Three-hundred and seventy-six surveys were completed in two four-star Spanish hotels in June 2022. The PROCESS macro for SPSS was used to test the hypothesis in a moderated mediation model, using a bootstrapping method. The results showed that customer perceptions of facilities had a positive effect on their overall satisfaction, which was partially mediated by both personnel and business organization. Family income moderated the relationship between the perception of facilities and satisfaction in such a way that it was more intense in high-income customers. Medium-income customers had a more intense relationship with the perception of the personnel and business organization, together with the hotel facilities being to their satisfaction. Therefore, not only facilities, but also personnel and business organizations are important key players for achieving customer satisfaction in hotels, and family income should also be considered.
1. Introduction
Globalization, economic progress, and technological advancement have compelled the hospitality industry to search out new market opportunities and new business models, and to offer customers new solutions. Similarly, marketplace changes have resulted in a profound reappraisal of formerly established paradigms in the hospitality industry. Previously, the hospitality industry was linked to accommodation services; conversely, the modern era has witnessed the introduction of other services, including catering and leisure activities, such as meetings, travel, and attractions, necessitating additional facilities and additional trained personnel (Langvinienė and Daunoravičiūtė 2015). In addition, new paradigms in the hospitality industry have focused on changing the management and ownership of the business, developing back-of-the-house reservation systems, and searching for alternatives to accommodation; these new paradigms have altered the industry’s landscape by introducing new complexities (Oshins 2017).
Profound changes in the hospitality industry have been forced by the market, technological, and economic challenges in contemporary society (Kandampully 2006). The conventional paradigm of hospitality management has been proven to be unable to provide a feasible conceptual framework within this new, fast-moving business environment. Conceivably, the traditional business models of marketing and management that guaranteed success in the past have now been rendered irrelevant, since they are incapable of addressing new challenges in an increasingly competitive market. In the late 1990s, a Marriott hotel was normally owned and managed by Marriott International (formerly Marriott Corporation). Currently, a Marriott hotel is normally owned by one company and managed by Marriott International, or it is franchised with its name but managed by a third company. In addition, changes featuring mergers and acquisitions have been noted within the industry. Marriott’s acquisition of Starwood, leading to the world’s largest hotel company, was a significant restructuring of the traditional conceptual framework (Oshins 2017).
Competition in the hospitality industry has contributed to the introduction of new business models that utilize technology, such as Airbnb’s use of a platform business model. Conversely, Marriott International has preferred a pipeline business model to brave the disruptive business model used by Airbnb. The 2018 revenue report placed Marriott ahead of Airbnb, with USD 21 billion against USD 3.6 billion (Eisape 2020). However, Airbnb’s business model attracts 150 million users, in contrast to the 120 million users of Marriott’s loyalty membership program. Both businesses have considered partnership as an approach to growth and expansion. Consequently, Marriott focuses on buying other hotel brands; the hotel has 30 affiliate brands, which have increased their accommodation capacity. Similarly, in 2019, Airbnb reported 160 partnerships that connected hosts to the platform (Eisape 2020). Conceivably, both business models can meet customer needs through new business models that foster marketplace awareness while creating positive perceptions.
Presenza et al.’s (2019) findings reveal how the changing marketplace has made it relevant for the industry to adopt innovative business models to ensure sustainability, particularly in providing travel and accommodation services. The authors have noted the hospitality and tourism industry’s economic, environmental, and social unsustainability. Subsequently, they offered a business model innovation (BMI) framework for integrating sustainability into businesses. Indeed, previous studies have pointed out how BMI can assist in the development of competitive and integrative solutions by creating a favorable and radical reduction in adverse external effects on the natural environment (Presenza et al. 2019). Empirically, Cheah et al.’s (2018) study established that BMI influences the application and acquisition of external innovations, and the production of internal innovations. BMI plays a critical role in facilitating a company’s ability to identify current opportunities and to prepare for the future in any business industry.
Globalization has led to the internationalization of the hospitality industry through the intensification and deepening of international economic cooperation (Zaitseva et al. 2016). Though globalization and technological advancement have compelled the hospitality industry to consider new business models through increased competition, they have disrupted the marketplace.
Apart from globalization, hospitality, tourism, and other service firms heavily depend on a stable workforce to offer services to customers and tourists (Goh and Okumus 2020). In delivering service quality to customers, the workforce is the primary object that ensures customer loyalty and satisfaction through the provision of services in responsive and reliable ways that assure the customer of their value (Kloutsiniotis and Mihail 2018). Training the workforce is vital in creating a competitive advantage within the competitive service industry, because it equips them with new capabilities and skills that enhance their commitment and productivity (Haile 2021).
Services are essential in the development of economies in the service industry such as tourism, because they generate revenues and facilitate a positive trade balance between sectors and countries (Wu et al. 2018; Xiao et al. 2022). Implicitly, services generate revenues while leading, at the same time, to customer satisfaction. Furthermore, Kandampully and Solnet (2019) suggested that services are essential in providing a firm with a competitive advantage through their ability to incorporate the human element into the customer experience. Conceivably, services will offer opportunities for emotional connection and technological reliance, increasing an organization’s reliability and assurance.
Furthermore, alongside service quality, using a professional workforce also contributes to high organizational performance. As a result of globalization, the workforce, and technology and services, performance is an aspect of ensuring survival in the industry. Kloutsiniotis and Mihail’s (2020) study revealed that organizational performance utilizing high-performance work systems (HPWSs) contributes to employee wellbeing and customer satisfaction, and creates a social identity that places the organization on a global stage. Moreover, performance in service industry firms acts as a metric for evaluating job satisfaction and the necessity of implementing various policies and high-performance work practices (Murphy et al. 2018). Parasuraman et al. (1985) successfully developed the SERVQUAL model for assessing service quality, and this has been the basis for other more specific models such as SERVPERF and the lesser known HOTELQUAL. A study on performance in the transport sector revealed that performance is a core aspect of the SERVQUAL model because it is tied to the appearance of an airport and its physical facilities (Rasyida et al. 2016). The authors contended that measuring performance by using the service performance (i.e., SERVPERF) scale proposed by Cronin and Taylor provides a more comprehensive understanding of service quality than the SERVQUAL scale, based on disconfirmation as a guide to assessing customer satisfaction (Rasyida et al. 2016). Ganić et al.’s (2018) study on SERVPERF’s dimensions of student loyalty revealed a positive association between satisfaction and every quality dimension. Consequently, performance fosters perceived organizational support and service quality and shapes customers’ positive perception of a firm’s image, leading to customer satisfaction (Karatepe and Vatankhah 2014). HOTELQUAL was developed by Falces et al. (1999) based on the SERVQUAL model. A 20-item questionnaire was the outcome of their research in Spanish hotels, gathering three factors: hotel facilities, personnel, and business organization. Hotel facilities relate to the tangible issues of a hotel, such as the physical condition of the entrance, communal areas, corridors, and bedrooms, together with customer perception of the comfort, welcome, safety, and ease of reaching the different areas and services of the hotel. Personnel relates to hotel staff behavior, cleanliness, trust, and happiness shown to customers. The business organization relates to how the hotel shows customers that there is an organization implemented behind all of its operations; thus, customers can obtain information regarding the hotel services upon request, the hotel solves any problems that arise, the booking reservation details given prior to arrival are correct and there is the sense that the hotel staff cares.
Prior research into the satisfaction of hotel customers and facilities has been limited. There is a gap in the academic research regarding new business models for running hotel operations—specifically those splitting ownership of hotel facilities and the management of the actual business—in relation to personnel and business organization. This gap also extends to new BMIs and their relationship with customer satisfaction. This research aimed to fill the aforementioned gaps and to provide hotel managers and hotel owners with insights to reflect on and enhance their overall performance.
The main conclusions drawn from this research show that customers’ perception of facilities had a positive effect on their overall satisfaction, which was partially mediated by both the personnel and business organization. The level of family income moderated the relationship between the perception of facilities and satisfaction in such a way that it was more intense with higher purchasing power. Income moderated both the relationship between the perception of facilities and the perception of an organization as well as the relationship between the perception of facilities and the perception of personnel, and both were more intense with intermediate purchasing power. Income moderated the mediating effect of both the business organization and the personnel so that it was more intense among middle-income customers.
2. Literature Review and Hypotheses
2.1. Perceived Quality of Hotel Facilities and Customer Satisfaction
Market-based tangibilization (MBT) and operation-based tangibilization (OBT) are important drivers of customer satisfaction (Panda and Das 2014). External customer satisfaction depends highly on tangibles, reliability, empathy, assurance, and responsiveness. Consequently, better facilities characterized by high quality increase customer perceptions of a firm, leading to satisfaction. Furthermore, research suggests that hospitality/hotel/service firms use the quality of facilities and services to achieve customer satisfaction, since facilities directly influence satisfaction (Nurcahyo et al. 2017). The authors demonstrated that poor facilities contribute to poor consumer satisfaction, and better facilities translate into increased customer satisfaction. Nurcahyo et al.’s (2017) study pointed out that the more destitute the hospitality industry’s facilities are, the lower the customer loyalty will be. Admittedly, Akpan and Etuk’s (2019) study on tangibilization reinforced Panda and Das’s (2014) findings on OBT, MBT, and customer satisfaction by insisting that customer satisfaction in hospitals is dependent upon the quality of the service or facility. As a result, the study determined that tangibilization is necessary for enabling better facilities that eventuate customer satisfaction (Akpan and Etuk 2019). Tangibility provided through visually attractive physical facilities is associated with client perceptions of service quality, and inevitably enhances the satisfaction of consumers. Research on customer satisfaction found that a one-unit increase in the perceived quality concerning the hotel services’ tangibles led to a 15.5% increase in customer satisfaction (Marković and Raspor Janković 2013). These findings are consistent with those of Ali et al.’s (2021) study, which suggested that tangibles involving physical facilities, personnel, and communication materials directly and positively influence customer satisfaction. Research on the travel sector revealed that visually appealing physical facilities and the removal of distractions that interfere with customer attention towards physical facilities boost customer satisfaction (Rasyida et al. 2016).
Furthermore, a study by Radojevic et al. (2015) on customer satisfaction that controlled for hotel classification determined that certain features of the hospitality facility influenced customer satisfaction. Conceivably, access to free Wi-Fi internet, a bar in the hotel, and membership in a branded hotel chain have a positive relationship with customer satisfaction. However, the classification of hotels based on the quality of hotel facilities affects customer satisfaction either negatively or positively. In addition, a business organization can address customer behavior relating to fulfillment through close attention to the facilities and the quality of services offered to the clients (Barusman et al. 2019). Hospitality firms that provide better facilities can meet their customers’ needs, resulting in satisfaction (Nobar and Rostamzadeh 2018). Subsequently, five-star hotels that are characterized by well-appointed facilities offer outstanding services and stays for their clients, translating to loyalty. Moreover, research suggests that the technical quality of a hospitality firm, referring to physical elements, such as the general cleanliness and condition of the facilities, is a driver of customer satisfaction (Mendez-Diaz and Martin-Duque 2021).
Ostensibly, hotel/hospitality industry facilities lead to customer satisfaction. Findings by Lai and Nguyen (2017) indicated that customers are more concerned with responsiveness, reliability, and assurance than they are with tangible factors. Kandampully and Suhartanto (2000) collected data from chain hotels in New Zealand to determine the facets of customer satisfaction and image correlated with customer loyalty within the hotel industry. Conceivably, the study found that customer satisfaction and a hotel’s image, through the performance of its reception, price, housekeeping, food, and beverages, were positively correlated with customer loyalty (Kandampully and Suhartanto 2000). Conversely, hotel facilities, such as restaurants, health clubs, rooms, or nightclubs, were no longer perceived as luxurious, since consumers regarded them as an integral component of culture.
Hypothesis 1.
The perceived quality of hotel facilities will be positively associated with customer satisfaction.
2.2. The Mediating Effect of the Business Organization and Personnel
Business organizations rely heavily on the service climate to improve or attain customer satisfaction. Parasuraman et al. (1985) developed a model of service quality, SERVQUAL, to assess the quality of service that translates into customer satisfaction. Subsequently, service industries have utilized the SERVQUAL model to effectively achieve and attain quality business organizations that ultimately contribute to customer satisfaction (Ali et al. 2021). He et al. (2011) used various dimensions of service climate. These included workshop facilitation, managerial support, customer orientation, and employee commitment to determine the association between service climate and customer satisfaction. Subsequently, the authors found that customer orientation had a positive and direct relationship with customer satisfaction; however, workshop facilitation and managerial support indirectly positively impacted customer satisfaction (He et al. 2011). These findings are consistent with Lai and Nguyen’s (2017) findings on service quality, emphasizing service as an individual rather than an organizational attribute. Conceivably, service quality in service industries positively predicts customer satisfaction and overall perception of facilities. Furthermore, Lai and Nguyen (2017) referred to five dimensions of service quality, namely, tangibility, reliability, assurance, responsiveness, and empathy, as significant indicators of a business organization that contribute to satisfaction.
Priyo et al.’s (2019) findings on service quality satisfaction demonstrate the importance of SERVQUAL in influencing customer loyalty. Indeed, the authors revealed that the facilities and service quality of an organization play a significant role in building customers’ perceptions, eventually turning into customer loyalty and satisfaction (Priyo et al. 2019). Furthermore, Ogiemwonyi et al.’s (2020) study demonstrated that the level of service delivered to clients is directly related to customer satisfaction in any service industry. As a result, most business organizations focus on reliability, competence, responsiveness, access, communication, courtesy, credibility, tangibles, and understanding/knowledge to organize their services towards meeting customer needs. However, the model was transformed to include tangibles, reliability, responsiveness, assurance, and empathy as the leading indicators of service quality (Ali et al. 2021; Lai and Nguyen 2017). The model was directly supportive and related to the facilities through the tangibles’ elements, which involved the physical appearance of personnel, equipment, and buildings and renovations (Ali et al. 2021). Turner and Hesford’s (2019) study on the impact of renovation capital expenditure on hotel performance revealed that renovations provide significant short-term, valuable impact in terms of increased customer satisfaction and decreased maintenance and repair revenue. In addition, Mendez-Diaz and Martin-Duque (2021) described tangibility as the physical facility and the general cleanliness of the restaurant, rooms, and other areas of the facility. Ali et al. (2021) suggested that tangibles were the most preferred by customers among the five dimensions of service quality. Although Lai and Nguyen’s (2017) findings pointed out that tangibles have no direct impact on customer satisfaction in a business organization, the authors were keen to mention that the business ought to pay close attention to them. Furthermore, Albattat et al. (2018) suggested that tangibles, such as complimentary newspapers, quality towels, fax machines, standards of service, appealing images, and physical attractiveness, relax the customer while providing them with value for their money, prompting customer satisfaction.
Moreover, the model highlights reliability as another component of a business organization that is necessary for customer satisfaction (Ali et al. 2021). Reliability lies in a business organization’s ability to fulfill customer demands. Conceivably, reliability is related to first-hand impressions, since every client wants to know whether a business organization is reliable in delivering services (Ogiemwonyi et al. 2020). Ogiemwonyi et al. (2020) reported that reliability was the most impactful on customer satisfaction out of the four service quality dimensions. Furthermore, the study established that reliability was critical in building the image of retail service providers, such as hypermarkets and supermarkets.
On the other hand, the micromodels of customer satisfaction developed by Hom (2000) define satisfaction as a consumer’s fulfillment feedback, where a service or product feature is judged; this involves over- or under-fulfillment. The author suggested that satisfaction focuses on the consumer instead of the customer, who is conventionally charged with the payment for a product. Subsequently, Hom (2000) posited that satisfaction is an experience of a service by the individual using the service as opposed to the one making payment for the service. The quality of a business organization is translated by its performance in delivering service quality to customers. Subsequently, the authors highlighted the importance of ensuring that the organization is visually appealing, with attractive physical facilities and equipment that enhance performance and facilitate customer satisfaction (Rasyida et al. 2016).
The current literature on customer satisfaction emphasizes Hom’s definition by describing it as an assessment of the emotion acquired when it disconfirms the consumer’s feelings before experiencing the service (Kandampully and Suhartanto 2000; Ogiemwonyi et al. 2020). Conceivably, numerous studies have positively associated customer satisfaction with service quality dimensions including responsiveness, reliability, assurance, and tangibility (Ali et al. 2021; Lai and Nguyen 2017; Mathong et al. 2020; Ogiemwonyi et al. 2020; Sugiarto and Octaviana 2021). Furthermore, Nguyen and Nagase (2019) reported that total quality management within a business organization significantly influences the perceived service quality. The authors found that the perceived service quality positively influenced customer satisfaction.
The competitiveness of the hospitality and service industry has inevitably led to demand for a skilled workforce, thereby necessitating that business organizations seek quality staff (Martin-Rios and Ciobanu 2019). Conversely, competition has led to the elimination of the demand for a quality workforce through the introduction of the sharing economy business model, wherein customers choose accommodation services without regard for professional services (Guttentag and Smith 2017). However, the quality of staff is a significant factor in the service industry; findings by Reilly (2018) suggest that a skilled workforce possessing interpersonal skills is required in changing customer requirements to provide an outstanding customer experience. Subsequently, business organizations are adjusting their retention, development strategies and attractions towards providing a renewed understanding of talent management by building capacity instead of buying it. Awasthi et al.’s (2020) study on the role of employee behavior found that the quality of staff influenced guest perceptions, thus contributing to brand-building in the hotel industry. The authors suggested that employee behavior should be appropriately managed through talent and skill development by using talent development policies, hotel policies, and strategies that emphasize quality staff (Awasthi et al. 2020).
Hypothesis 2a.
The perceived quality of a business organization mediates the relationship between hotel facilities and customer satisfaction.
The service quality model demands tangibles in the service industry—such as physical equipment, surroundings, personnel, and communication approaches—that create positive first impressions on customers and that are visually appealing (Parasuraman et al. 1985). Subsequently, a design quality that demonstrates the capacity of a business organization’s presentational style of services/products in a manner that facilitates customer satisfaction is essential. Priyo et al. (2019) contended that the SERVQUAL structural model is fundamental for enhancing an organization’s staff towards service quality, which promotes customer loyalty and satisfaction. Conceivably, quality staffing builds positive customer perceptions, which are key for facilitating customer satisfaction. Moreover, the use of service quality equips the staff to improve tangibility in the service firm, primarily through the creation of physically attractive facilities and general cleanliness, which satisfies customers and enhances loyalty (Priyo et al. 2019). Albattat et al. (2018) highlighted the critical aspect of the quality of conformity as the necessary component for achieving or fitting the design quality. Conceivably, conformity is a product of quality staffing that seeks to satisfy customer needs by ensuring that clients receive the optimal benefits or value from the facilities and design quality (Escortell et al. 2020). Furthermore, Bello and Bello (2017) highlighted the importance of employee empowerment through strategies that create work motivation, improve personnel quality, and, ultimately, contribute to customer satisfaction. The study reported a positive correlation between service quality and employee satisfaction and a statistically significant relationship between customer satisfaction and service quality. Service quality dimensions, such as responsiveness in the hospitality industry, are directed and operationalized through quality staff that can demonstrate the capability and adaptability of reperforming a service to meet a client’s needs and expectations (Ali et al. 2021). Furthermore, Rasyida et al. 2016 reported that service performance was based on the personnel’s ability to deliver service quality that leads to customer satisfaction.
As the search for professional staff for handling specialized facilities requiring high intellectual capacity and attention to detail becomes more rigid, many service industries are considering robotization and automation of services to achieve unparalleled customer satisfaction (Huang and Rust 2021). However, Ali et al.’s (2021) study revealed the human factor’s significance in addressing the fundamental service quality dimensions to attain customer satisfaction. In addition, the ability of humans to provide empathy and responsiveness in delivering services continues to demonstrate a positive and significant relationship with customer satisfaction.
Hypothesis 2b.
The perceived quality of the personnel mediates the relationship between hotel facilities and customer satisfaction.
2.3. The Moderating Effect of Family Income
Research has indicated a statistically significant relationship between demographics and the choice of hotel facilities (Tran et al. 2019). Subsequently, Tran et al.’s (2019) study reported that the choice of a hotel type is a direct outcome of a customer’s income level; there was a low chance of clients choosing a motel if they possess a high income; domestic clients were found to prefer hotel resorts, and foreign customers preferred city hotels. High-income customers preferred high-end hotel facilities with high ratings, as they were deemed fit to provide optimal satisfaction (Abbasi et al. 2010). In addition, high-income customers sought facilities that can meet personal preferences related to their beliefs and piety, including those featuring exclusive food and beverage services, which contributed to customer satisfaction (Pamukcu and Sariisik 2020).
Conversely, studies have revealed that both high- and low-income customers evaluate hotel choice and satisfaction based on cleanliness and the beds (Kim et al. 2019a). Consequently, both economy and luxury hotel chains should stress guestroom features to meet the needs of their customers. Alauddin et al. (2019) suggested that service providers should consider service quality regardless of income level to satisfy their customers. The authors reported that customer satisfaction is a product of service quality instead of the customer’s income level. Therefore, providing customers with services through new facilities and convenient approaches will increase service quality and enhance customer satisfaction (Keshavarz and Jamshidi 2018).
When a hotel obtains a five-star rating, foreign guests have high expectations for its services, amenities, personalized service, and tranquil atmosphere (Lee et al. 2016). Customers with a larger family income will be able to afford 5 star hotels or 4 star hotels with more amenities, which will have an effect on the hotel’s facilities, perceived level of business organization, and employees.
The relation between hotel employee burnout and psychological distress is moderated by financial well-being, which makes this relationship higher for employees with good income prospects (Baquero 2023). It is expected that financial well-being, or family income, will have a similar moderating influence on the relationships between hotel facilities, customer satisfaction, the perceived quality of a business organization and personnel.
These considerations lead to the next hypothesis:
Hypothesis 3a.
The level of family income moderates the relationship between hotel facilities and customer satisfaction.
Hypothesis 3b.
The level of family income moderates the relationship between hotel facilities and the perceived quality of a business organization.
Hypothesis 3c.
The level of family income moderates the relationship between hotel facilities and the perceived quality of the personnel.
Previous and existing studies have revealed a significant relationship between the level of a customer’s income and the quality of an organization; conceivably, Kim et al.’s (2019b) study found that customers visiting luxury hotels were inclined to expect experiences of proactive services and quality furnishing and space. In addition, high-end customers seek to experience high-quality services, while low-end customers are often price-sensitive and consider economy hotels. While affluent customers consider service, lower-income customers consider pricing (Kim et al. 2019b). As a result, the authors recommended that luxury hotels insist on marketing strategies focusing on hardware aspects, such as decor, room facilities, and services. Conversely, economy hotels or service providers are encouraged to emphasize price competitiveness, because low-income customers are sensitive to rates (Kim et al. 2019b).
However, a higher income does not necessarily translate to a preference for accommodation with high service quality (Chen et al. 2017). Research has indicated that low-income customers emphasize sensory brand experience more than high-income customers do (Ahn and Back 2018). Consequently, low-income customers demonstrate a greater predisposition toward brand-related information and visual impressions of the facility to enhance their interest in the business organization than high-income customers do.
High-income customers prefer hotel facilities with professional staff, whereas low-income customers seek facilities based on price (Kim et al. 2019b). A hospitality firm’s quality of staff and facilities is directly related to customers’ income level (Dimitropoulos 2018). The previous literature on staffing illustrated the demand for automation and robotization of services in the service industry as an approach to service quality delivery among high-income customers (Ivanov et al. 2019). Subsequently, Chuah et al.’s (2022) study revealed that the income level of customers influenced their willingness to pay for premium staffing in robotic restaurants. Whereas high-income-level customers were willing to pay for staffing quality in modernized hotel facilities featuring advanced technology and equipment, low-income-level customers preferred pricing over the quality of staff (Chuah et al. 2022; Kim et al. 2019b). Lu and Tabari’s (2019) study on the sharing economy model used by Airbnb revealed that the income level of customers influences consumers’ behavior regarding accommodation choices. The authors reported that low-income customers are inclined towards the sharing economy model, wherein resources and accommodation facilities are shared and the quality of staff is non-significant. On the other hand, high-income customers prefer luxurious hotels with visually appealing facilities and high-end services provided by trained staff (Lu and Tabari 2019).
These considerations lead to the next hypothesis:
Hypothesis 4a.
The level of family income moderates the mediating effect of the business organization on the relationship between hotel facilities and customer satisfaction.
Hypothesis 4b.
The level of family income moderates the mediating effect of the personnel on the relationship between hotel facilities and customer satisfaction.
3. Materials and Methods
3.1. Participants and Procedure
The study’s data were collected between 1 June and 31 June 2022, in two four-star hotels located in the Greater Benidorm area (Spain). This is a very well-consolidated touristic area. A Spanish hotel chain based in this area, which also had hotels in other areas of Spain, was contacted.
A total of 450 questionnaires were distributed in two hotels, resulting in 376 completed and valid samples, meaning a response rate of 83.55%. This research was conducted using convenience sampling (McDaniel and Gates 2019).
A designated person visited the premises of the hotels and handed over questionnaires to customers in the evening before or after dinner, making sure the customers were in a relaxed mood.
The survey consisted of 21 Likert items on a 1–5 scale and 5 sociodemographic profile questions. The items allowed for assessment of the quality perceived by customers in factors such as hotel facilities, personnel, organization, and overall satisfaction.
Table 1 shows the demographic profile of the sample.

Table 1.
Demographic profile (N = 376).
3.2. Survey Instruments and Data Analysis
The surveys were available in English, Spanish, and French. The survey was initially prepared in Spanish and then translated into English and French; in both cases, a back-translation process was used until there were no discrepancies between the original sample and the translated ones.
The perceived quality of the hotel facilities, personnel, and business organization were measured using the HOTELQUAL scale (Falces et al. 1999) after validating the appropriate concepts. Examples of items include “The different rooms and facilities in the hotel are pleasant” for hotel facilities; “The staff at this hotel are happy to help the guests” for personnel; “As a guest, it is easy to obtain information regarding the different services I request” for business organization. These were measured on a 5-point Likert scale, from 1 (strongly disagree) to 5 (strongly agree).
Overall customer satisfaction was measured by following Hill et al.’s (2017) guidelines, e.g., “How satisfied are you in general with this hotel?”. This was measured using a 5-point Likert scale, from 1 (very dissatisfied) to 5 (very satisfied).
The HOTELQUAL scale (Falces et al. 1999) was developed based on the SERVQUAL scale (Parasuraman et al. 1985). HOTELQUAL, a priori, measures the concepts of facilities, personnel, and business organizations, but it has neither been widely used internationally, nor does it have updated validation of the previously mentioned concepts.
Using PROCESS v4.1, the hypotheses were evaluated using a bootstrapping method and a moderated mediation model. With 10,000 bootstrapped samples and a confidence level of 95%, the bias-corrected bootstrap confidence intervals were determined.
To exactly determine the dimensions involved in the theoretical model, the underlying natural structure of the data was explored using exploratory factor analysis (EFA) with the maximum likelihood extraction method and Promax rotation, which allowed for correlations between factors, given that it was expected that the concepts measured with the questionnaire were not independent of each other. The multicollinearity of the dimensions with each other was tested using the variance inflation factor (VIF) and tolerance parameters by applying the established acceptance thresholds (Kutner et al. 2004). A VIF greater than 10 or tolerance less than 0.1 was indicative of significant multicollinearity that must be corrected. A VIF > 4 and a tolerance < 0.25 indicated the possibility of multicollinearity and, therefore, caution with the results.
4. Results
4.1. Descriptive Analysis
The mean values and standard deviations of the questionnaire items are shown in Table 2.
Table 2.
Means and standard deviations for the questionnaire items.
4.2. Measurement Validation
The EFA with the maximum likelihood extraction method and Promax rotation yielded an optimal model with a structure of four factors with an eigenvalue > 1 that explained 59.53% of the total variance. However, the sum of the squared charges of the extraction left the fourth factor with an eigenvalue < 1 (0.865); therefore, this was discarded. The optimal model was supported by the Bartlett test; Chi2: 5149.282, p-value: 0.000, and KMO: 0.883 (Pizarro Romero and Mora 2020).
These results are shown in Table 3.
Table 3.
Measurement validations.
Cronbach’s internal consistency alpha model was used to verify the reliability of each construct of the scale, since it allowed for checking whether the reflective indicators of the scale were homogeneous, and therefore whether they were measuring the same latent variable. The optimal value was greater than or equal to 0.7 (Nunnally 1978). The three factors obtained met this criterion.
The average variance extracted (AVE), the degree to which a latent variable was explained by its observed variables, was greater than 0.5, and the composite ratability (CR) was greater than 0.7 (Hair et al. 2010); thus, the convergent validity of the dimensions was proven.
Table 4 shows the correlations between the dimensions. The facilities were positively related to the organization (r = 0.496, p < 0.01) and to personnel (r = 0.523, p < 0.01). These results provide initial support for the mediation hypothesis.
Table 4.
Correlations between the dimensions.
To verify that there were no multicollinearity problems between the dimensions, the VIF and tolerance parameters resulting from the three dimensions with the dependent variable satisfaction were used, as can be seen in Table 5.
Table 5.
Collinearity statistics for the model.
All VIFs were <4, and the tolerances were >0.25; thus, there were no multicollinearity problems.
Therefore, the validity of the three dimensions was demonstrated, and the theoretical model of the relationships could be tested.
4.3. Hypothesis Testing
The hypotheses were assessed in a moderated mediation model with a bootstrapping method using PROCESS v4.1. This was developed by Hayes (2012) to be used in SPSS. Specifically, the PROCESS “model 4” was used to test the direct effect of hotel facilities on global satisfaction and the mediating effect of organization and personnel perceptions. PROCESS “model 8” was used to test the moderating effects of family income level. A 95% confidence level was chosen for the bias-corrected bootstrap confidence intervals, with 10,000 bootstrapped samples.
Figure 1 shows the definitive model, where a1 × b1 = indirect effect 1; a2 × b2 = indirect effect 2; and a1 × b1 + a2 × b2 = c − c’.
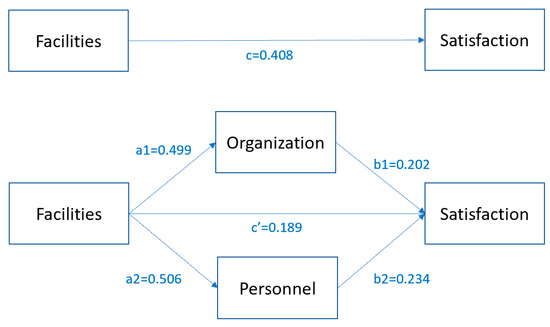
Figure 1.
Definitive model.
As presented in Table 6, the results of Model 1 show that the perception of the quality of facilities is positively and significantly associated with satisfaction (β = 0.408, p < 0.001). Therefore, Hypothesis 1 is supported. Meanwhile, the results of Model 4 show that the perception of the quality of the facilities is positively and significantly associated with the perception of the quality of the organization (β1 = 0.499, p < 0.001), and the results of Model 6 show that the perception of the quality of the facilities was positively and significantly associated with the perception of the quality of the personnel (β2 = 0.506, p < 0.001). Furthermore, the results of Model 2 show that both organization and personnel were also positively associated with satisfaction (β1 = 0.203, p < 0.001; β2 = 0.234, p < 0.001). These results point to a potential mediating effect, which is verified below.
Table 6.
Results of the regression analysis.
As presented in Table 7, the index of the mediating effect of both the organization and personnel on the relationship between facilities and satisfaction was significant, since the 95% confidence interval did not include 0 (a1 × b1 = 0.101 [0.047, 0.157]; a2 × b2 = 0.118 [0.073, 0.173], with no significant differences in the magnitudes of both effects (a1 × b1 − a2 × b2 = −0.017 [−0.113, 0.068], since the interval included 0)). Thus, both the mediating effect of the organization and that of the personnel were significantly positive, yielding a significant and positive joint mediating effect of 0.219 [0.173, 0.276]. Therefore, Hypotheses 2a and 2b were also validated. Considering that the direct effect of facilities and satisfaction was still significantly positive (index = 0.189, [0.129, 0.248], which did not include 0), it can be concluded that the organization and personnel partially mediated the effects of facilities and satisfaction.
Table 7.
The mediating effects of organization and personnel.
In addition, the results of Model 3 show that the interaction of facilities and income level was significantly and positively associated with satisfaction only for the highest income bracket (β = 0.185, p < 0.05), such that the intensity in the facility–satisfaction ratio increased when the client had a high level of income; that is, the weight of facilities on satisfaction was greater among clients with high purchasing power, as can be seen in Figure 2. Therefore, Hypothesis 3a was supported.
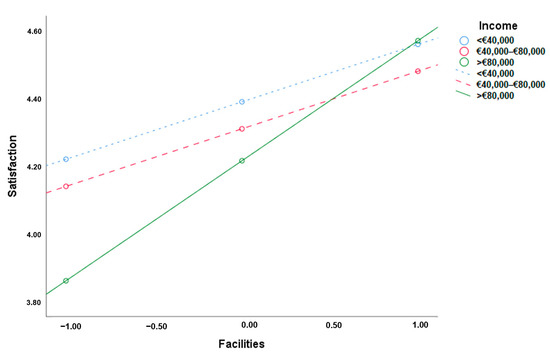
Figure 2.
The moderating effect of income on the relationship between facilities and satisfaction.
The results of Model 5 and Model 7 show that the interaction of facilities and organization and the interaction of facilities and personnel were significantly and positively associated with satisfaction only for the lower-income customers (β1 = 0.290, p < 0.01 and β2 = 0.269, p < 0.01, respectively), such that the intensity in both the facility–organization relationship and the facility–personnel relationship increased when the client had an intermediate level of income; that is, the weight of the installations on both the organization and the personnel was greater among clients with an intermediate purchasing power, as can be seen in Figure 3 and Figure 4. Therefore, Hypotheses 3b and 3c were also supported. Thus, income positively moderated the three established relationships: facilities -> satisfaction; facilities -> organization; facilities -> personnel.
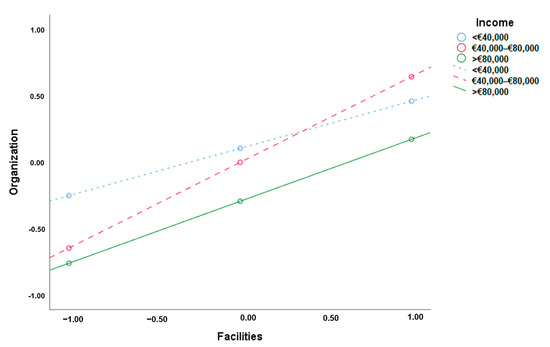
Figure 3.
The moderating effect of income on the relationship between facilities and organization.
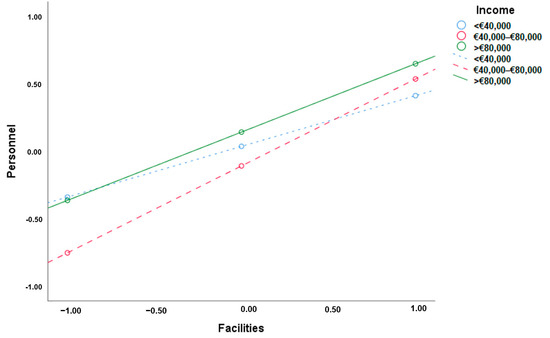
Figure 4.
The moderating effect of income on the relationship between facilities and personnel.
To test the moderate mediation effect, the indirect conditional effects of facilities on satisfaction across organization and personnel at different income levels were calculated and are presented in Table 8. The unstandardized regression coefficient of the mediating effect of the organization was 0.065 (p < 0.05) in the lower income range, and it increased significantly to 0.118 (p < 0.05) in the intermediate income range and remained there in the upper income range. With T1, T2, and T3 representing low-, medium-, and high-income-level families, the difference index between T1 and T2 was 0.053 [0.017, 0.093], which did not include 0, and that between T1 and T3 was 0.020 [−0.018, 0.071], which included 0. Therefore, the positive mediating effect of organization was significantly stronger at the intermediate level of income. The same occurred for personnel. The index of the difference between T1 and T2 was 0.067 [0.028, 0.121], which did not include 0, and that between T1 and T3 was 0.032 [−0.036, 0.099], which included 0. Again, the positive mediating effect of personnel was significantly stronger at the middle-income level. Therefore, Hypotheses 4a and 4b were supported.
Table 8.
Moderate mediating effect of family income level.
Finally, Table 9 presents the results of the current research’s hypothesis.
Table 9.
Hypothesis summary.
5. Discussion, Limitations and Future Research
The purpose of this study was to investigate the effect of customers’ perceptions of hotel facilities on customer satisfaction by integrating the mediating effect of customers’ perceptions of personnel and business organization and the moderating effect of customers’ family income. Specifically, it sought to determine if there was a mediating effect of personnel and business organization and to explore the moderating effect of customers’ income. To obtain data for the empirical analysis, 450 questionnaires were distributed in two Spanish four-star hotels in June 2022, resulting in 376 valid samples, meaning a response rate of 83.55%.
This research used the PROCESS macro for SPSS to test the hypotheses in a moderated mediation model with a bootstrapping method. The findings regarding the testing of the hypotheses are summarized in the following.
First, customer perceptions of facilities had a positive effect on their overall satisfaction, and a better assessment of the facilities led to greater satisfaction. Second, this relationship was partially mediated by customer perception of both personnel and business organization; thus, part of the total effect that the perception of the facilities had on satisfaction was in the perceptions of both the personnel and the business organization. Third, the level of family income moderated the relationship between the perception of facilities and satisfaction in such a way that it was more intense for those with high purchasing power, and the weight of the perception of the quality of the facilities was greater among wealthier clients. Income moderated both the relationship between the perception of the facilities and the perception of the business organization, as well as the relationship between the perception of the facilities and the perception of the personnel, and both were more intense with intermediate purchasing power. Fourth, income moderated the mediating effect of both the organization and the personnel such that it was more intense in the middle range of income. In summary, the positive effect of facilities on customer satisfaction, which was partially mediated by personnel and business organization, was found and confirmed; customers with a high income were more affected by the quality perception that the facilities were to their satisfaction, while medium-income customers had a more intense relationship with the perception of personnel and business organization, together with the hotel facilities being to their satisfaction. Therefore, not only facilities, but also personnel and business organizations are important key players for achieving customer satisfaction in hotels, and family income should also be considered in order to run a successful business with high customer satisfaction.
5.1. Theoretical and Practical Implications
The existing literature on business models within the hospitality industry shows that globalization has transformed and led to innovative approaches to service delivery through the promotion and permission of sustainable business model innovations in technology, companies, and industrial networks (Florido et al. 2019). The research by Srivastava (2021) pointed out that budget hotel chains, hybrid models, and sharing platforms, as some of the business models developed out of the globalization process, have facilitated competitiveness within the service industry. All of these models pay attention to hotel facilities, personnel, and business organization, with a focus on customer satisfaction; thus, this current research aligns with them and offers empirical results.
A quality business organization hinges upon a customer-centric approach that emphasizes service quality that will lead to a positive customer experience (Baquero 2022). Consequently, a business organization requires quality staff to deliver service quality to its customers. Reilly’s (2018) study on building a customer-centric business points to talent management as a leading factor in achieving customer satisfaction.
The two hotels that took part in this study rent rooms with the option of bed and breakfast, half board, full board, and all-inclusive stays. Higher-income families tend to reserve a bed and breakfast and spend the day outside the hotel visiting different parts of the Greater Benidorm area, ending their vacations with a higher expenditure. Middle-income families tend to book half-board, full-board, or all-inclusive stays, and limit their excursions outside these hotels so that they can adjust to their vacation’s original budget. This explains findings regarding family income moderating the relationship between facilities and satisfaction, which is more intense with a high purchasing power, as such individuals spend less time in resorts; on the contrary, intermediate purchasing power was more intense for relationships that included personnel and business organization as mediators, since such individuals spent more time at the resorts, so they paid more attention to staff and valued their multiple interactions with staff and well-organized business operations more. The quality of staff is directly linked to the facilities in the service industry due to the tangible nature of the service quality, insisting on the physical appearance of facilities through proper maintenance and general cleanliness (Lai and Nguyen 2017).
Research in service industry staffing consistently reports the strategic actions taken by business organizations to ensure sustained quality of staff, including outsourcing or delegation of functions, out-tasking or delegation of a separate duty to a partner, and staff leasing or out-staffing (Zhavoronkova and Nikiforov 2020). The authors also pointed out the importance of service industry firms partnering with educational institutions to facilitate the impartation of the appropriate skills and knowledge to the potential workforce to solve seasonal staffing issues. As personnel is a key player in the equation for obtaining high customer satisfaction, this must be considered when evaluating the performance of a hotel.
Ideally, high-end facilities require constant maintenance, and specialized care demands professional staff to handle and operationalize (Hermus et al. 2017). In addition, these facilities must provide customers with an outstanding experience through service quality dimensions such as responsiveness on the part of skilled or professional personnel (Sugiarto and Octaviana 2021). It was proved in this research that good-quality hotel facilities lead to higher customer satisfaction. This, however, should not lead hotel property owners to demand great results from hotel operators in terms of customer satisfaction and therefore economic results based only on good-quality hotel facilities; it should also not lead hotel operators to blame lower-quality hotel facilities for not obtaining high customer satisfaction. This research has also proved that personnel and business organization are involved in the equation for obtaining high customer satisfaction.
Finally, one of the main theoretical and practical implications of this research was that it was able to validate three constructs within the HOTELQUAL scale (Falces et al. 1999)—facilities, personnel, and business organization—and it validated 15 of its original 20 items. The original questionnaire was created in the year 1999, using only Madrid-area hotel customers. The current research took place in Greater Benidorm, a very touristic destination on the Spanish coast, using not only Spanish customers, but also British and French customers. These 15 items, using the three constructs of customer perception of hotel facilities, personnel, and business organization, can be used together to measure customers’ perception of hotel quality—as per Falces et al.’s (1999) initial proposal—or customer experience, and any of the three constructs can be used individually. This provides insight into future research in this area.
5.2. Limitations and Directions for Future Research
This research presents some limitations that future research can address. Both hotels in the research sample were based in a touristic area of Spain. It might be interesting to analyze hotels in different countries/locations and combine resorts and city business hotels. Both hotels in the sample were rated four stars, and it would be interesting to broaden future research to include more hotel star ratings. It can be difficult to obtain access to hotel companies to conduct research with their current customers. This study obtained access to one hotel company that managed these two hotels. It would be interesting to research different hotel companies. Future researchers could examine the impact of other variables such as organizational legitimacy or gender (Díez-Martín et al. 2022) on hotel customer satisfaction. They could also focus the analysis on consumer dissatisfaction (Pascual Nebreda et al. 2021) in an effort to determine what factors influence hotel guests’ dissatisfaction (Berezina et al. 2016; Kim et al. 2019a).
The results offer insights for hotel property owners, business operators, hotel managers, and academics into new approaches and new lines of research on this subject.
Funding
This research received no external funding.
Informed Consent Statement
Informed consent was obtained from all subjects involved in the study.
Data Availability Statement
The data presented in this study are available upon request from the corresponding author.
Conflicts of Interest
The author declares no conflict of interest.
References
- Abbasi, Aamna, Wajiha Khalid, Madeeha Azam, and Adnan Riaz. 2010. Determinants of customer satisfaction in hotel industry of Pakistan. European Journal of Scientific Research 48: 97–105. [Google Scholar]
- Ahn, Jiseon, and Ki-Joon Back. 2018. Antecedents and consequences of customer brand engagement in integrated resorts. International Journal of Hospitality Management 75: 144–52. [Google Scholar] [CrossRef]
- Akpan, Anietie, and Samuel Etuk. 2019. Tangibilisation of service and customer satisfaction in hospitals: Implication for management. European Journal of Economics and Management Sciences 1: 3–8. [Google Scholar]
- Alauddin, Md, Syed Hasib Ahsan, Mohammad Masrurul Mowla, and Mahmudul Islam. 2019. Investigating the relationship between service quality, customer satisfaction and customer loyalty in hotel industry: Bangladesh perspective. Global Journal of Management and Business Research 19: 1–8. [Google Scholar]
- Albattat, Ahmad, Ahmad Pitra, Nishalini Mahendran, and Azila Azmi. 2018. The impact of service quality on Muslim customers in Shariah compliant hotel. Journal of Tourism, Hospitality and Environment Management 3: 1–14. [Google Scholar]
- Ali, Bayad, Bayar Gardi, Baban Jabbar Othman, Shahla Ali Ahmed, Nechirwan Burhan Ismael, Pshdar Abdalla Hamza, Hassan Mahmood Aziz, Bawan Yassin Sabir, Sarhang Sorgulli, and G. Gofand Anwar. 2021. Hotel service quality: The impact of service quality on customer satisfaction in hospitality. International Journal of Engineering, Business and Management 5: 14–28. [Google Scholar] [CrossRef]
- Awasthi, Abhimanyu, Deepika Dhawan, and Md Soyav. 2020. Role of employee behaviour in hospitality industry. International Journal of Scientific and Technology Research 9: 2208–10. [Google Scholar]
- Baquero, Asier. 2022. Net Promoter Score (NPS) and Customer Satisfaction: Relationship and Efficient Management. Sustainability 14: 2011. [Google Scholar] [CrossRef]
- Baquero, Asier. 2023. Hotel Employees’ Burnout and Intention to Quit: The Role of Psychological Distress and Financial Well-Being in a Moderation Mediation Model. Behavioral Sciences 13: 84. [Google Scholar] [CrossRef]
- Barusman, Andala, Evelin Rulian, and Susanto Susanto. 2019. The Antecedent of Customer Satisfaction and Its Impact on Customer Retention in Tourism as Hospitality Industry. International Journal of Advance Science Technology 28: 322–30. [Google Scholar]
- Bello, Yekini Ojo, and Mercy Busayo Bello. 2017. Employees’ empowerment, service quality and customers’ satisfaction in hotel industry. Strategic Journal of Business & Change Management 4: 1001–19. [Google Scholar]
- Berezina, Katerina, Anil Bilgihan, Cihan Cobanoglu, and Fevzi Okumus. 2016. Understanding Satisfied and Dissatisfied Hotel Customers: Text Mining of Online Hotel Reviews. Journal of Hospitality Marketing and Management 25: 1–24. [Google Scholar] [CrossRef]
- Cheah, Sarah, Yuen-Ping Ho, and Shiyu Li. 2018. Business model innovation for sustainable performance in retail and hospitality industries. Sustainability 10: 3952. [Google Scholar] [CrossRef]
- Chen, Chiang-Ming, Yi-Chun Tsai, and Hsien-Hung Chiu. 2017. The decision-making process of and the decisive factors in accommodation choice. Current Issues in Tourism 20: 111–19. [Google Scholar] [CrossRef]
- Chuah, Stephanie Hui-Wen, Siriprapha Jitanugoon, Pittinun Puntha, and Eugene Cheng-Xi Aw. 2022. You don’t have to tip the human waiters anymore, but… Unveiling factors that influence consumers’ willingness to pay a price premium for robotic restaurants. International Journal of Contemporary Hospitality Management 34: 3553–87. [Google Scholar] [CrossRef]
- Díez-Martín, Francisco, Giorgia Miotto, and Gabriel Cachón-Rodríguez. 2022. Organizational legitimacy perception: Gender and uncertainty as bias for evaluation criteria. Journal of Business Research 139: 426–36. [Google Scholar] [CrossRef]
- Dimitropoulos, Panagiotis E. 2018. Profitability determinants of the Greek hospitality industry: The crisis effect. In Innovative Approaches to Tourism and Leisure. Cham: Springer, pp. 405–16. [Google Scholar]
- Eisape, Davis. 2020. Comparing platform business models: A balanced scorecard approach based on the platform business model canvas. Nordic Journal of Media Management 1: 401–32. [Google Scholar]
- Escortell, Raquel, Asier Baquero, and Beatriz Delgado. 2020. The impact of transformational leadership on the job satisfaction of internal employees and outsourced workers. Cogent Business & Management 7: 1837460. [Google Scholar] [CrossRef]
- Falces, Carlos, Benjamín Sierra, Alberto Becerra, and Pablo Briñol. 1999. HOTELQUAL: Una escala para medir calidad percibida en servicios de alojamiento. Estudios Turísticos 139: 95–110. [Google Scholar]
- Florido, Carmen, Marta Jacob, and Margarita Payeras. 2019. How to carry out the transition towards a more circular tourist activity in the hotel sector. The role of innovation. Administrative Sciences 9: 47. [Google Scholar] [CrossRef]
- Ganić, Emir, Versna Babić-Hodović, and Maja Arslanagić-Kalajdžić. 2018. Effects of Servperf dimensions on students’ loyalty-Do you know what is behind the scene. International Journal of Business and Social Science 9: 215–24. [Google Scholar]
- Goh, Edmund, and Fevzi Okumus. 2020. Avoiding the hospitality workforce bubble: Strategies to attract and retain generation Z talent in the hospitality workforce. Tourism Management Perspectives 33: 100603. [Google Scholar] [CrossRef]
- Guttentag, Daniel, and Stephen Smith. 2017. Assessing Airbnb as a disruptive innovation relative to hotels: Substitution and comparative performance expectations. International Journal of Hospitality Management 64: 1–10. [Google Scholar] [CrossRef]
- Haile, Getinet. 2021. Organisational accreditation, workforce training and perceptions of performance. Industrial Relations Journal 52: 291–314. [Google Scholar] [CrossRef]
- Hair, Joseph, William Black, Barry Babin, and Rolph Anderson. 2010. Multivariate Data Analysis. Upper Saddle River: Prentice-Hall, Inc. [Google Scholar]
- Hayes, Andrew. 2012. PROCESS: A Versatile Computational Tool for Observed Variable Mediation, Moderation, and Conditional Process Modeling [White Paper]. Available online: http://www.afhayes.com/public/process2012.pdf (accessed on 1 August 2022).
- He, Yuanqiong, Wenli Li, and Kin Keung Lai. 2011. Service climate, employee commitment and customer satisfaction: Evidence from the hospitality industry in China. International Journal of Contemporary Hospitality Management 23: 592–607. [Google Scholar] [CrossRef]
- Hermus, Marieke A. A., Inge C. Boesveld, Marit Hitzert, Arie Franx, J. P. de Graaf, E. A. P. Steegers, Therese A. Wiegers, and Karin M. van der Pal-de Bruin. 2017. Defining and describing birth centres in the Netherlands-a component study of the Dutch Birth Centre Study. BMC Pregnancy and Childbirth 17: 1–11. [Google Scholar] [CrossRef]
- Hill, Nigel, John Brierley, and Rob MacDougall. 2017. How to Measure Customer Satisfaction. London: Taylor and Francis. [Google Scholar]
- Hom, Willard. 2000. An Overview of Customer Satisfaction Models; Pacific Gove: Policy, Planning & External Affairs Division, California Community Colleges.
- Huang, Ming-Hui, and Roland Rust. 2021. Engaged to a robot? The role of AI in service. Journal of Service Research 24: 30–41. [Google Scholar] [CrossRef]
- Ivanov, Stanislav, Ulrike Gretzel, Katerina Berezina, Marianna Sigala, and Craig Webster. 2019. Progress on robotics in hospitality and tourism: A review of the literature. Journal of Hospitality and Tourism Technology 10: 489–521. [Google Scholar] [CrossRef]
- Kandampully, Jay, and David Solnet. 2019. Competitive advantage through service in hospitality and tourism: A perspective article. Tourism Review 75: 247–51. [Google Scholar] [CrossRef]
- Kandampully, Jay, and Dwi Suhartanto. 2000. Customer loyalty in the hotel industry: The role of customer satisfaction and image. International Journal of Contemporary Hospitality Management 12: 346–51. [Google Scholar] [CrossRef]
- Kandampully, Jay. 2006. The new customer-centred business model for the hospitality industry. International Journal of Contemporary Hospitality Management 18: 173–87. [Google Scholar] [CrossRef]
- Karatepe, Osman, and Sanaz Vatankhah. 2014. The effects of high-performance work practices on perceived organizational support and turnover intentions: Evidence from the airline industry. Journal of Human Resources in Hospitality & Tourism 13: 103–19. [Google Scholar] [CrossRef]
- Keshavarz, Yousef, and Dariyoush Jamshidi. 2018. Service quality evaluation and the mediating role of perceived value and customer satisfaction in customer loyalty. International Journal of Tourism Cities 4: 220–44. [Google Scholar] [CrossRef]
- Kim, Bona, Seongseop Kim, and Cindy Heo. 2019a. Consequences of Customer Dissatisfaction in Upscale and Budget Hotels: Focusing on Dissatisfied Customers’ Attitude Toward a Hotel. International Journal of Hospitality and Tourism Administration 20: 15–46. [Google Scholar] [CrossRef]
- Kim, Bona, Seongseop Kim, Brian King, and Cindy Yoonjoung Heo. 2019b. Luxurious or economical? An identification of tourists’ preferred hotel attributes using best–worst scaling (BWS). Journal of Vacation Marketing 25: 162–75. [Google Scholar] [CrossRef]
- Kloutsiniotis, Panagiotis V., and Dimitrios M. Mihail. 2018. The link between perceived high-performance work practices, employee attitudes and service quality: The mediating and moderating role of trust. Employee Relations 40: 801–21. [Google Scholar] [CrossRef]
- Kloutsiniotis, Panagiotis V., and Dimitrios Mihail. 2020. High performance work systems in the tourism and hospitality industry: A critical review. International Journal of Contemporary Hospitality Management 32: 2365–95. [Google Scholar] [CrossRef]
- Kutner, Michael H., Christopher J. Nachtsheim, John Neter, and William Li. 2004. Applied Linear Regression Models. Chicago: McGraw-Hill. [Google Scholar]
- Lai, Ching-Sung, and Minh C. Nguyen. 2017. Factors affecting service quality, customer satisfaction and loyalty of mobile phone service providers in Vietnam. International Journal of Organizational Innovation 10: 75–85. [Google Scholar]
- Langvinienė, Neringa, and Ingrida Daunoravičiūtė. 2015. Factors influencing the success of business model in the hospitality service industry. Procedia-Social and Behavioral Sciences 213: 902–10. [Google Scholar] [CrossRef]
- Lee, Sang-Hyeop, Shuet May Toh, and Hak-Seon Kim. 2016. The Customers’ Perception on Luxury Hotel: A Case of Sunway Resort Hotel and Spa. Culinary Science & Hospitality Research 22: 145–150. [Google Scholar]
- Lu, Luqi, and Saloomeh Tabari. 2019. Impact of Airbnb on customers’ behavior in the UK hotel industry. Tourism Analysis 24: 13–26. [Google Scholar] [CrossRef]
- Marković, Susana, and Sanja Raspor Janković. 2013. Exploring the relationship between service quality and customer satisfaction in Croatian hotel industry. Tourism and Hospitality Management 19: 149–64. [Google Scholar] [CrossRef]
- Martin-Rios, Carlos, and Teofil Ciobanu. 2019. Hospitality innovation strategies: An analysis of success factors and challenges. Tourism Management 70: 218–29. [Google Scholar] [CrossRef]
- Mathong, Punnatorn, Panitas Sureeyatanapas, Sirawadee Arunyanart, and Thanawath Niyamosoth. 2020. The assessment of service quality for third-party logistics providers in the beverage industry. Cogent Engineering 7: 1785214. [Google Scholar] [CrossRef]
- McDaniel, Carl, and Roger Gates. 2019. Marketing Research. Hoboken: Wiley. [Google Scholar]
- Mendez-Diaz, Monica, and Clara Martin-Duque. 2021. Open innovation through customer satisfaction: A logit model to explain customer recommendations in the hotel sector. Journal of Open Innovation: Technology, Market, and Complexity 7: 180. [Google Scholar] [CrossRef]
- Murphy, Kevin, Edwin Torres, William Ingram, and Joe Hutchinson. 2018. A review of high performance work practices (HPWPs) literature and recommendations for future research in the hospitality industry. International Journal of Contemporary Hospitality Management 30: 365–88. [Google Scholar] [CrossRef]
- Nguyen, Thi Le Ha, and Keisuke Nagase. 2019. The influence of total quality management on customer satisfaction. International Journal of Healthcare Management 12: 277–85. [Google Scholar] [CrossRef]
- Nobar, Hossein Bodaghi Khajeh, and Reza Rostamzadeh. 2018. The impact of customer satisfaction, customer experience and customer loyalty on brand power: Empirical evidence from hotel industry. Journal of Business Economics and Management 19: 417–30. [Google Scholar] [CrossRef]
- Nunnally, Jum. 1978. Psychometric Theory. New York: McGraw Hill. [Google Scholar]
- Nurcahyo, Rianto, Annisa Fitriyani, and Irma Nur Hudda. 2017. The influence of facility and service quality towards customer satisfaction and its impact on customer loyalty in Borobudur Hotel in Jakarta. Binus Business Review 8: 23–29. [Google Scholar] [CrossRef]
- Ogiemwonyi, Osarodion, Amran Harun, Abdul Rahman, Mohammad Nurul Alam, and Nawazad Majeed Hamawandy. 2020. The relationship between service quality dimensions and customer satisfaction towards hypermarket in Malaysia. International Journal of Psychosocial Rehabilitation 24: 2062–71. [Google Scholar] [CrossRef]
- Oshins, Mike. 2017. Change in the Hospitality Industry: New Paradigms, Frames, and Perspectives. Available online: https://www.bu.edu/bhr/2017/06/12/hospitality-change-paradigm-and-perspective/ (accessed on 1 August 2022).
- Pamukcu, Huseyin, and Mehmet Sariisik. 2020. Suggestions for standardization of halal tourism in hospitality industry. Journal of Islamic Marketing 12: 389–407. [Google Scholar] [CrossRef]
- Panda, Tapan K., and Satyabrata Das. 2014. The role of tangibility in service quality and its impact on external customer satisfaction: A comparative study of hospital and hospitality sectors. IUP Journal of Marketing Management 13: 53–69. [Google Scholar]
- Parasuraman, A. Parsu, Valarie A. Zeithaml, and Leonard L. Berry. 1985. A conceptual model of service quality and its implications for future research. Journal of Marketing 49: 41–50. [Google Scholar] [CrossRef]
- Pascual Nebreda, Laura, Francisco Díez Martín, and Alicia Blanco González. 2021. Changes and evolution in the intellectual structure of consumer dissatisfaction. Journal of Consumer Behaviour 20: 160–72. [Google Scholar] [CrossRef]
- Pizarro Romero, Kelvin, and Omar Martinez Mora. 2020. Análisis factorial exploratorio mediante el uso de las medidas de adecuación muestral KMO y esferidad de Bartlett para determinar factores principales. Journal of Science and Research: Revista Ciencia e Investigación 5: 903–24. [Google Scholar]
- Presenza, Angelo, Antonio Messeni Petruzzelli, and Angelo Natalicchio. 2019. Business model innovation for sustainability. Highlights from the tourism and hospitality industry. Sustainability 11: 212. [Google Scholar] [CrossRef]
- Priyo, Joko Sadoso, Bahtiar Mohamad, and Raji Ridwan Adetunji. 2019. An examination of the effects of service quality and customer satisfaction on customer loyalty in the hotel industry. International Journal of Supply Chain Management 8: 653–63. [Google Scholar]
- Radojevic, Tijana, Nemanja Stanisic, and Nenad Stanic. 2015. Ensuring positive feedback: Factors that influence customer satisfaction in the contemporary hospitality industry. Tourism Management 51: 13–21. [Google Scholar] [CrossRef]
- Rasyida, Dyah, M. Mujiya Ulkhaq, Priska R. Setiowati, and Nadia A. Setyorini. 2016. Assessing Service Quality: A Combination of SERVPERF and Importance-Performance Analysis. MATEC Web of Conferences 68: 06003. [Google Scholar] [CrossRef]
- Reilly, Peter. 2018. Building customer centricity in the hospitality sector: The role of talent management. Worldwide Hospitality and Tourism Themes 10: 42–56. [Google Scholar] [CrossRef]
- Srivastava, Saurabh. 2021. Analysing Covid Adjustments in Hospitality Business Models: Insights from Indian Hospitality Sector Through Social Media Analytics. In Globalization, Deglobalization, and New Paradigms in Business. Cham: Palgrave Macmillan, pp. 103–16. [Google Scholar]
- Sugiarto, Sigit, and Vivi Octaviana. 2021. Service Quality (SERVQUAL) Dimensions on Customer Satisfaction: Empirical Evidence from Bank Study. Golden Ratio of Marketing and Applied Psychology of Business 1: 93–106. [Google Scholar] [CrossRef]
- Tran, Lobel Trong Thuy, Pham This Minh Ly, and Loc Tuan Le. 2019. Hotel choice: A closer look at demographics and online ratings. International Journal of Hospitality Management 82: 13–21. [Google Scholar] [CrossRef]
- Turner, Michael J., and James W. Hesford. 2019. The impact of renovation capital expenditure on hotel property performance. Cornell Hospitality Quarterly 60: 25–39. [Google Scholar] [CrossRef]
- Wu, Wann Yih, Alfiyatul Qomariyah, Nguyen Thi Truong Sa, and Yingkai Liao. 2018. The integration between service value and service recovery in the hospitality industry: An application of QFD and ANP. International Journal of Hospitality Management 75: 48–57. [Google Scholar] [CrossRef]
- Xiao, Zengrui, Ying Wang, and Dongjie Guo. 2022. Will Greenwashing Result in Brand Avoidance? A Moderated Mediation Model. Sustainability 14: 7204. [Google Scholar] [CrossRef]
- Zaitseva, Natalia A., Anna A. Larionova, Konstantin V. Yumatov, Natalia M. Korsunova, and Nina V. Dmitrieva. 2016. Assessment of the Impact of Globalization on the Introduction of Innovative Technology Companies in the Hospitality Industry. International Journal of Environmental and Science Education 11: 7176–85. [Google Scholar]
- Zhavoronkova, Olga R., and I. R. Nikiforov. 2020. Topical Issues of Staffing in the Hospitality Industry of the Republic of Crimea. In IOP Conference Series: Earth and Environmental Science. Bristol: IOP Publishing, p. 032094. [Google Scholar] [CrossRef]


Disclaimer/Publisher’s Note: The statements, opinions and data contained in all publications are solely those of the individual author(s) and contributor(s) and not of MDPI and/or the editor(s). MDPI and/or the editor(s) disclaim responsibility for any injury to people or property resulting from any ideas, methods, instructions or products referred to in the content. |
© 2023 by the author. Licensee MDPI, Basel, Switzerland. This article is an open access article distributed under the terms and conditions of the Creative Commons Attribution (CC BY) license (https://creativecommons.org/licenses/by/4.0/).