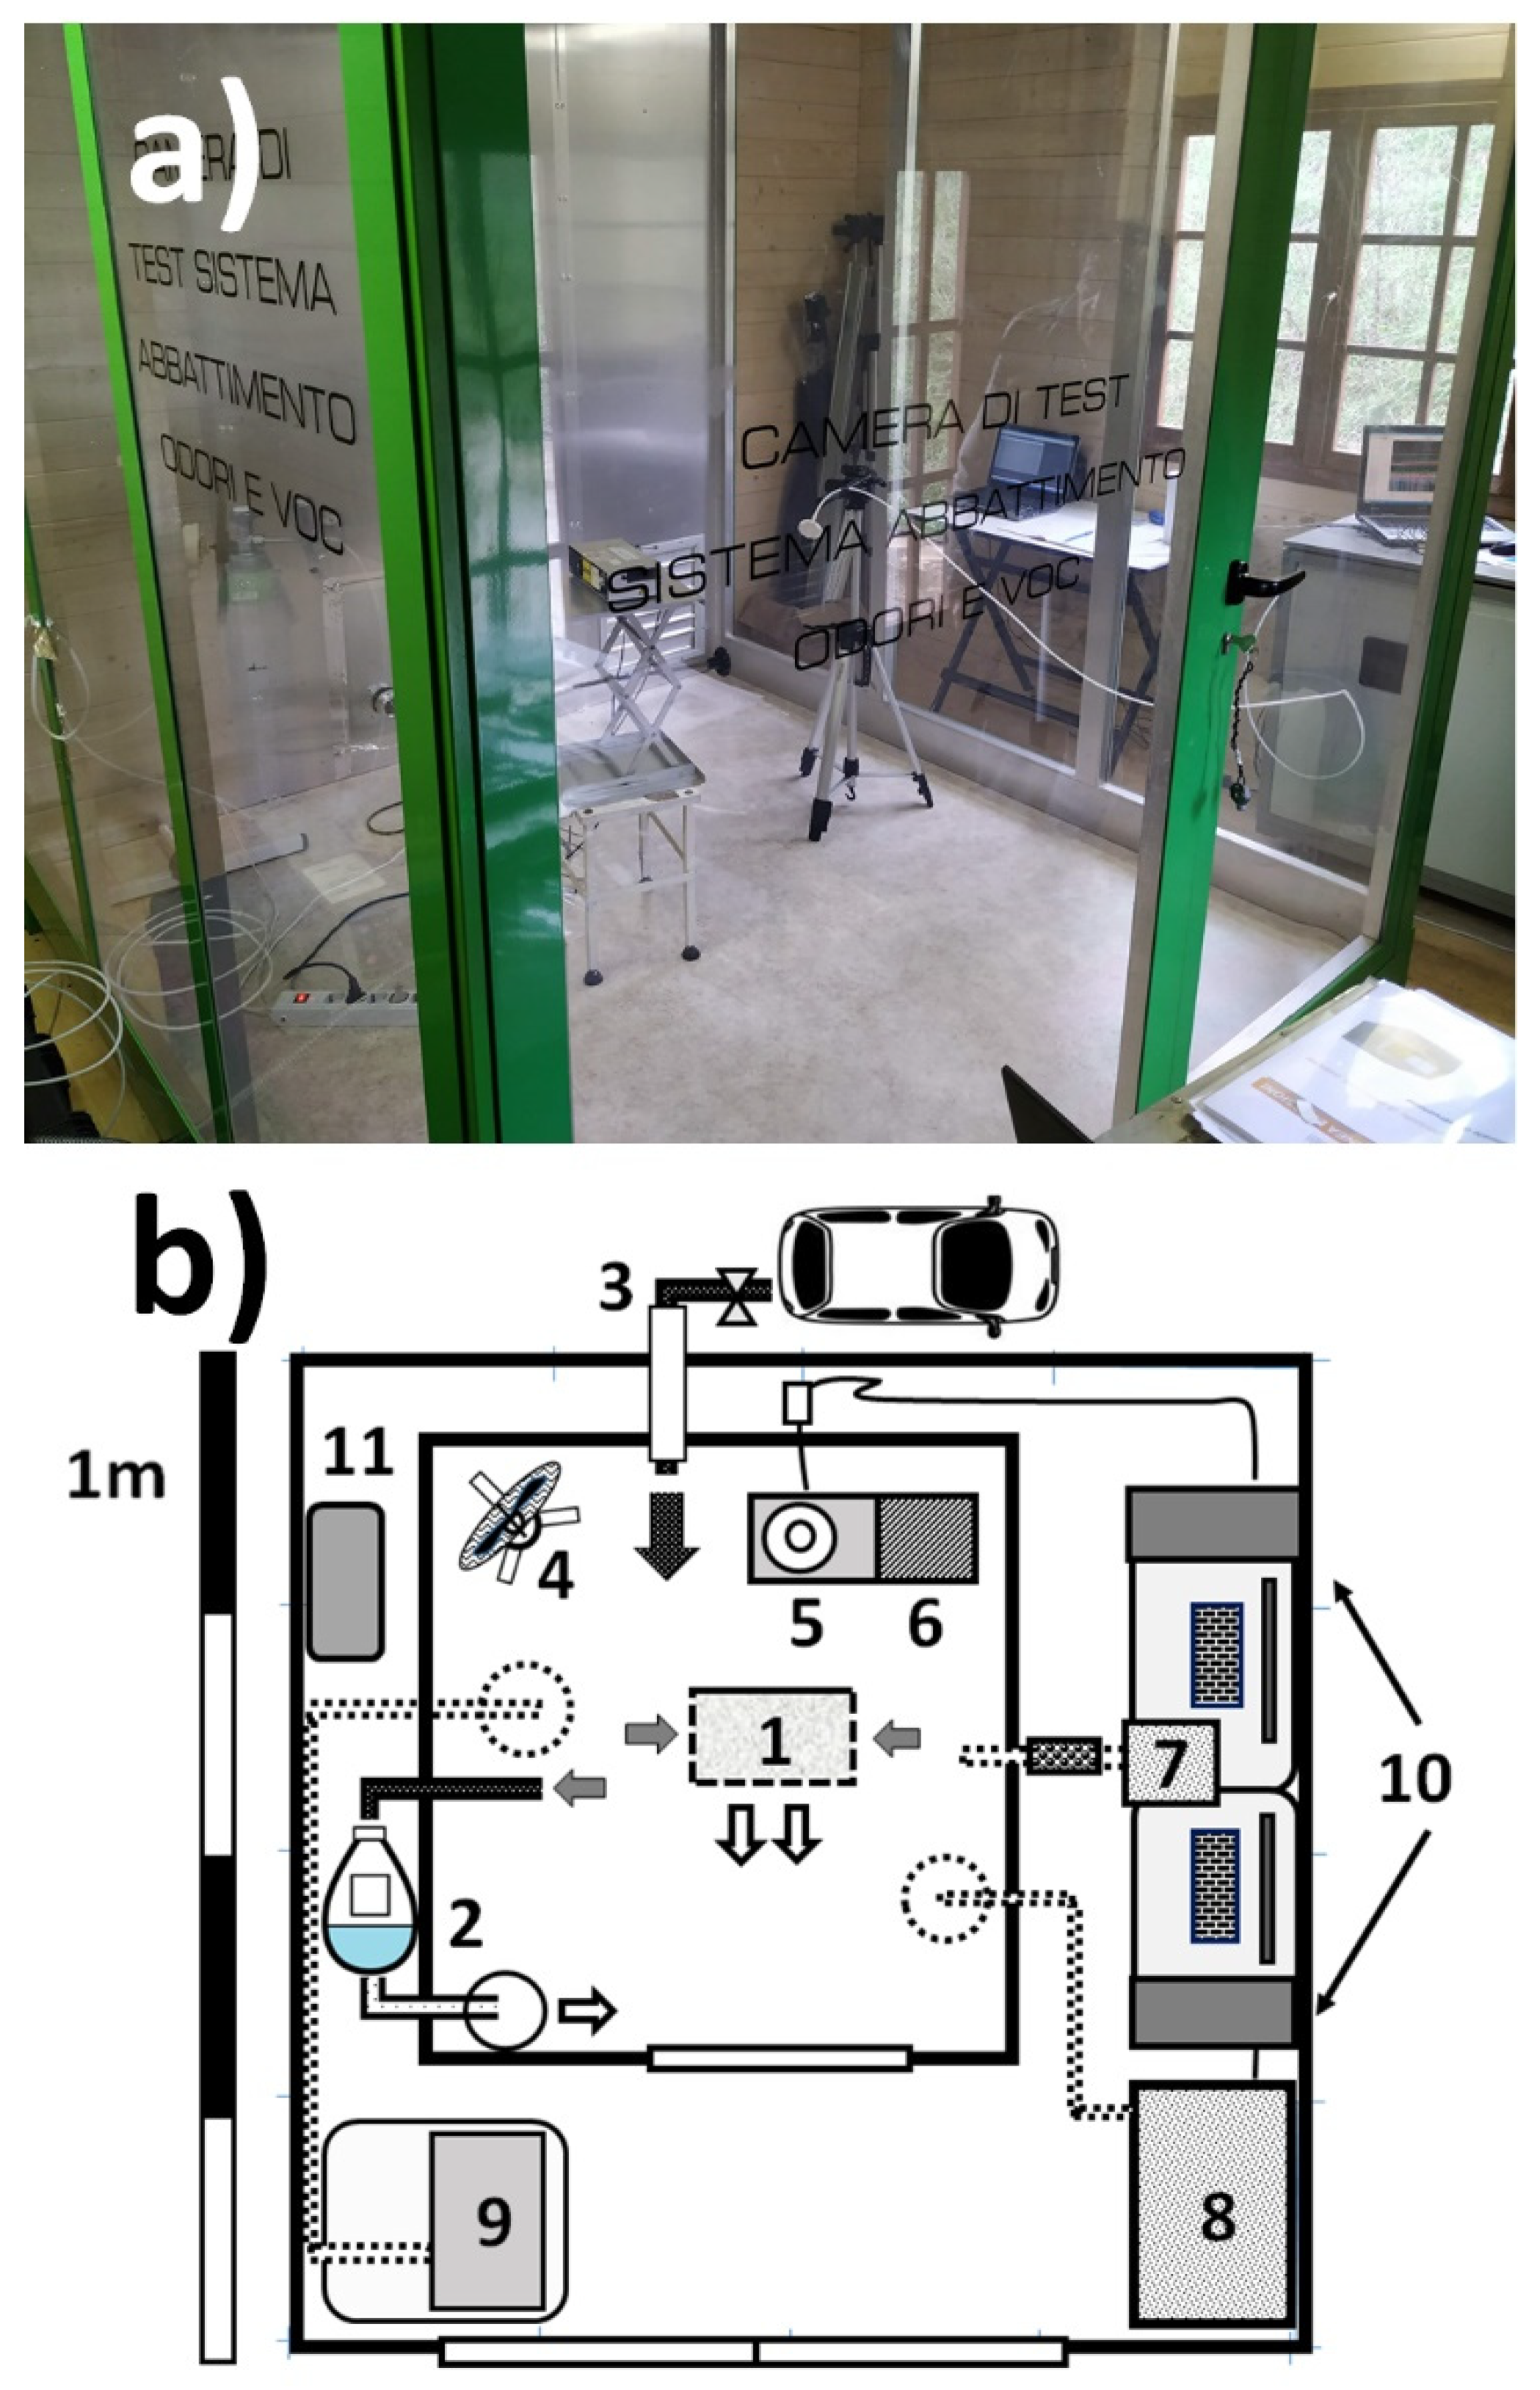
Since diesel exhaust emission has never been used before to assess the performances of air cleaners; in this paper, a specific section has been devoted to the experiments performed in the testing room with this source. In the following Subsections, studies performed with two different air cleaners are presented.
3.1.1. Understanding Removal Processes to Assess Indoor Toxicity
The study performed on the GIOEL air cleaner provides a good example of the way in which the testing room was used to obtain information on the processes responsible for the removal of indoor contaminants, and how it was exploited for other applications.
Since the system was already certified for the removal of bacteria and viruses, the company was interested to know if, and to what extent, the water cavitation effect [
25] generated by the system was also able to remove other potentially toxic indoor contaminants, such as fine particles, VOCs and inorganic gases. This task was quite challenging because, to the best of our knowledge, little is known about the way in which indoor pollutants are removed by such technology. To answer this question, diesel exhaust emission was preferred to cigarette smoke, which is the most widely used source in the USA and Japan for this kind of study [
17,
18]. Diesel exhaust emission is as equally toxic as cigarette smoke, as it contains high amounts of carcinogenic (PAH) and mutagenic compounds (nitrated PAH) [
20,
26], but also of harmful pyrogenic VOCs (such as formaldehyde, benzene, toluene and xylenes) together with NOx (NO + NO
2) and CO [
27], commonly present in other combustion sources [
28]. A substantial portion of emitted particles is made of soot, consisting of elemental black carbon and high levels of silica [
27,
29]. As a result of this, gases and vapors emitted by this source are far less dependent on temperature and pressure variations than cigarette smoke consisting of fine liquid aerosol particles, whose equilibrium with vapors and gases is much more dependent on the environmental indoor conditions [
30]. The presence of black carbon particles was an important factor in the selection of the pollution source, because their removal from the room must have been mirrored by the formation of black deposits in water, or in its reservoir. Moreover, this source simulated well the type of indoor pollution occurring in residential buildings located in urban areas in Europe, where diesel exhaust emission is most responsible for the exceedance of the atmospheric levels of PM
10 and PM
2.5 [
31], and, if not removed, it can severely affect the indoor air quality.
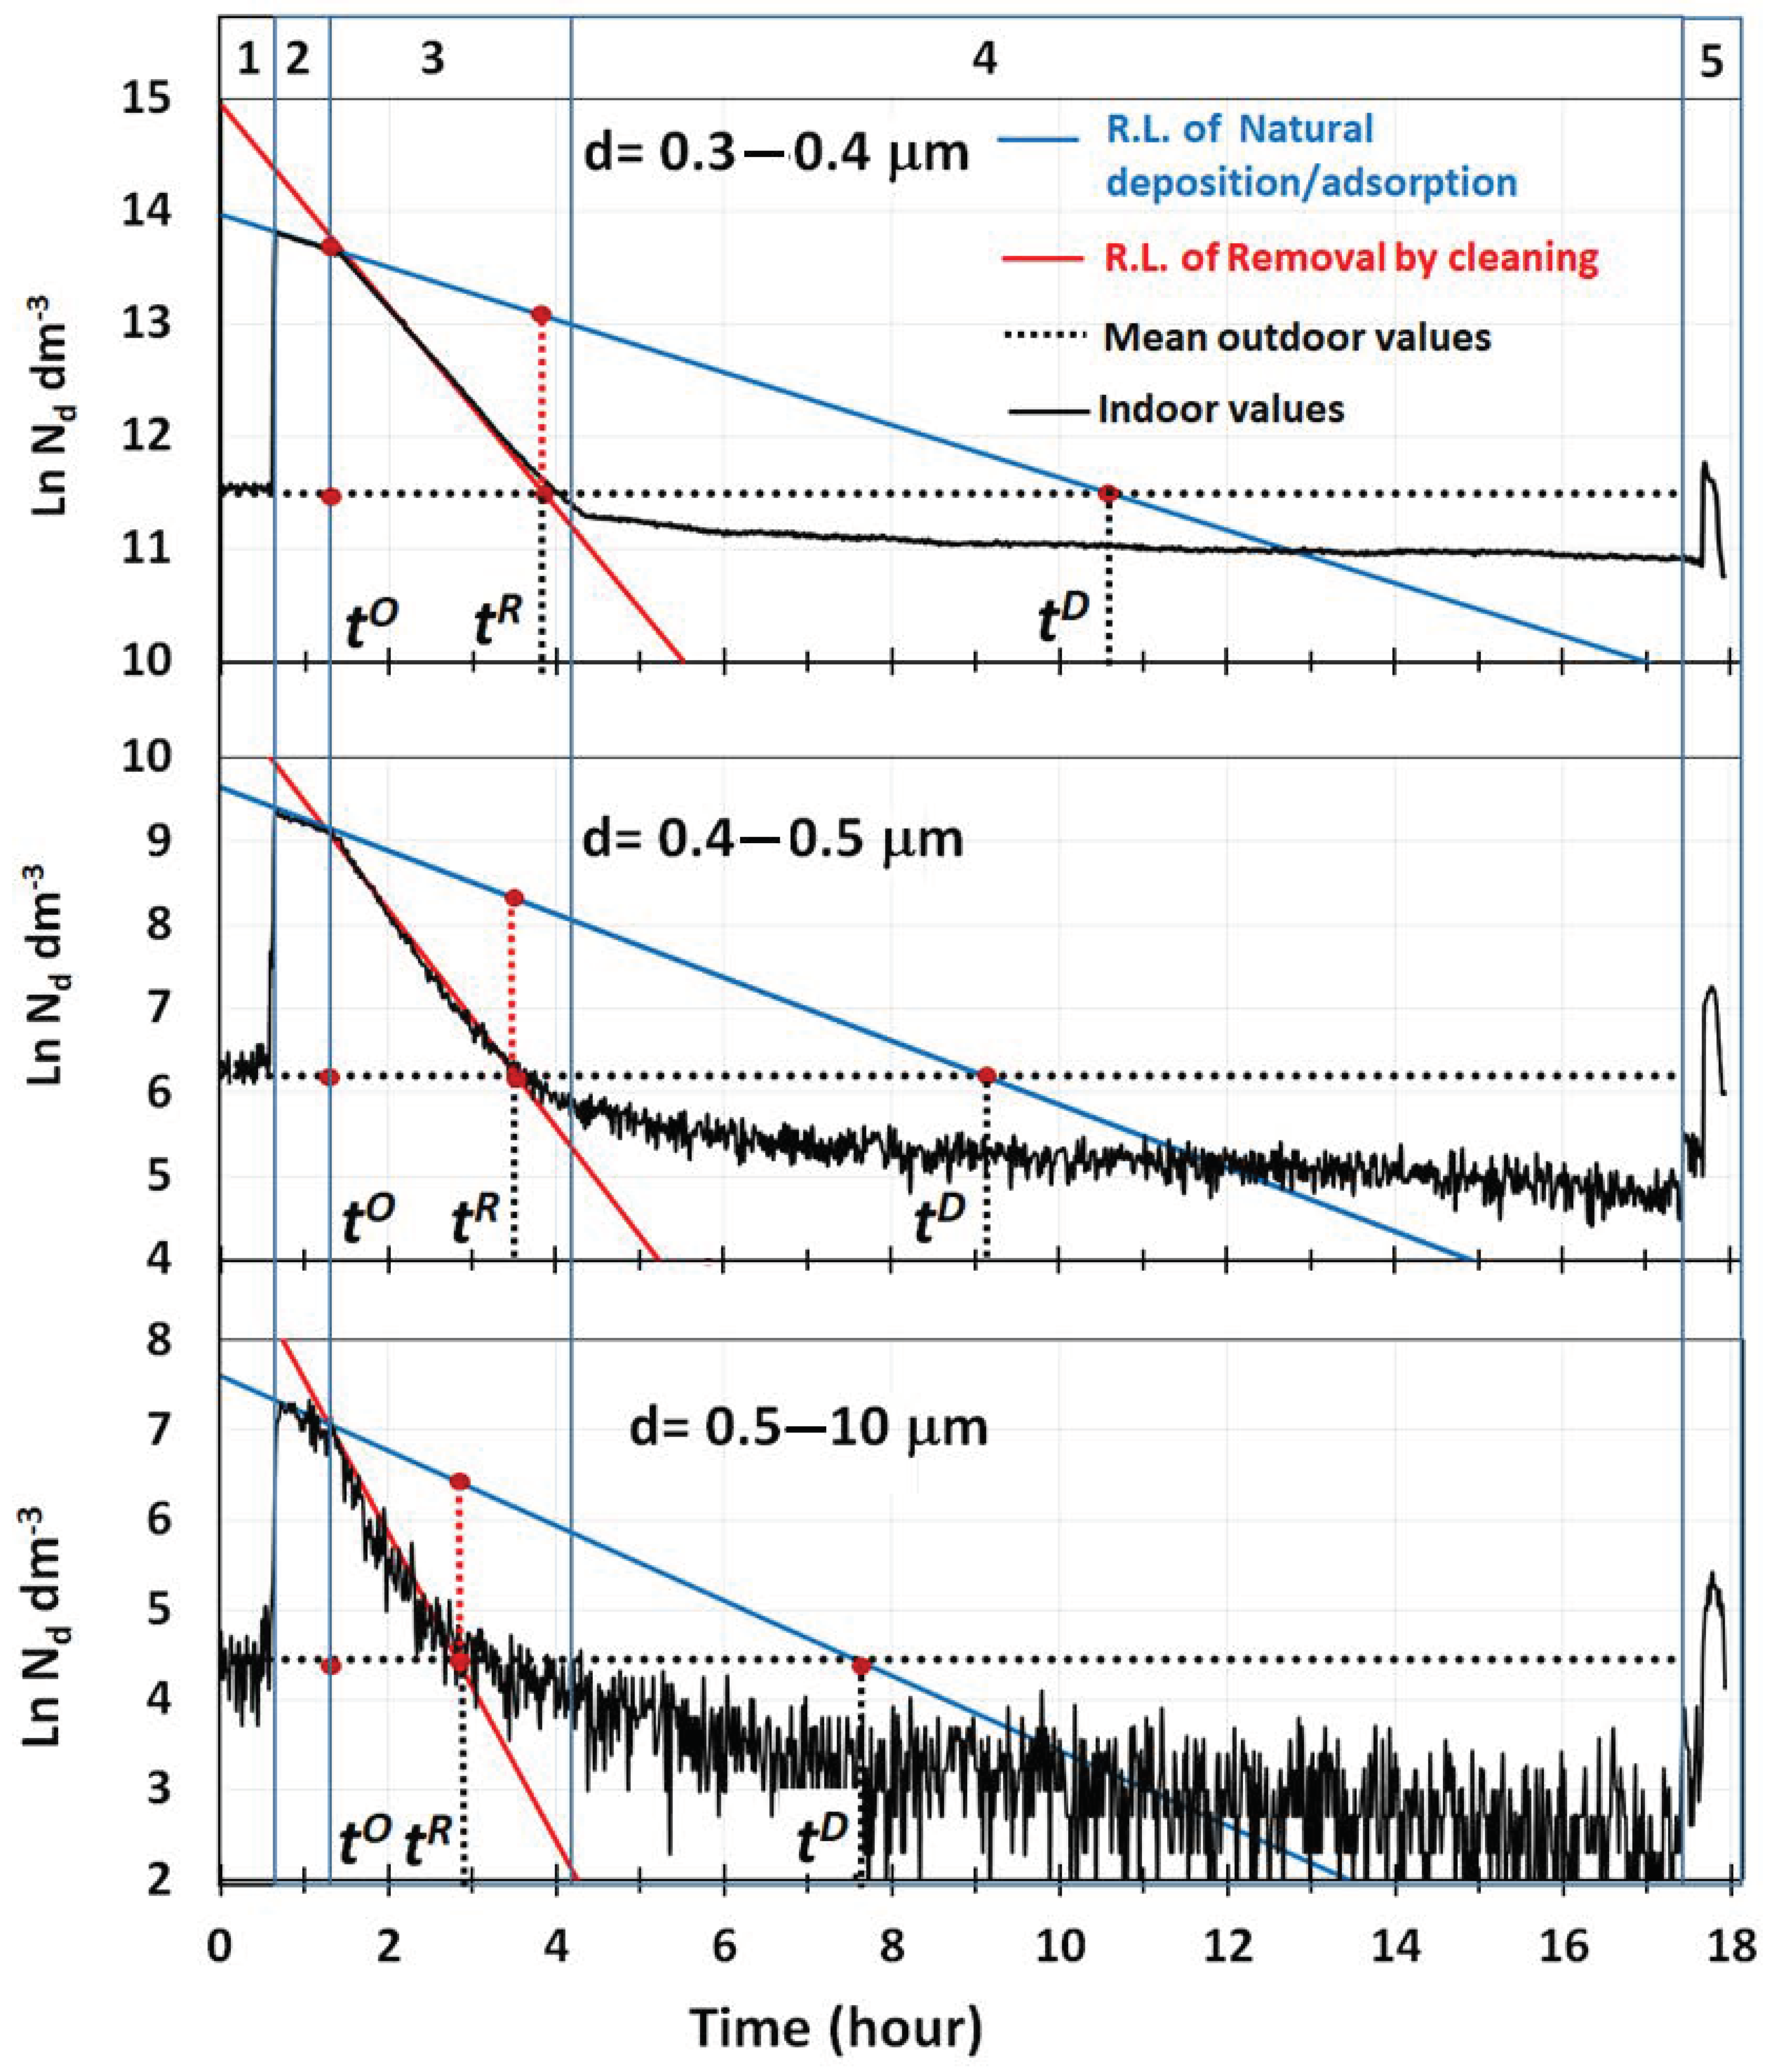
Preliminary experiments were performed to define a testing protocol that could have been extended, with few modifications, to other pollution sources, including cigarette smoke. It was found that enough levels of indoor pollution were generated in the room by delivering the emission from the exhaust pipe of a diesel engine, after having isolated the room from the outdoor environment (phase 2 of
Figure 2). This step was performed after the room was cleaned and maintained in communication with ambient air for more than 1 h (phase 1 of
Figure 2). This was also the phase when the monitoring of pollutants started. Four minutes of delivering were sufficient to obtain enough indoor pollution to test the performances of a residential air cleaner, by using the exhaust emission of a Euro 3 diesel engine, not equipped with particle filters. Pollutants were generated by keeping the car in the idle mode, and by accelerating the engine from 800 up to 2500 r.p.m. for 4–5 s each minute. This was performed because cold transients produce a much higher emission of pollutants than normal road conditions [
32]. As discussed in the following section, indoor pollution at the end of the mixing phase was sufficiently high (PM
2.5 from 350–450 μg m
−3 and total VOCs from 900–1000 μg m
−3) to accurately follow the removal of different pollutants from the room. These levels were 3–5 times higher than those reached at night in the most polluted cities of Europe [
7]. Once the desired level of pollution was generated indoors, the line of the exhaust pipe was isolated and the pollutants were allowed to mix inside the room, until a dynamic equilibrium between gases and particles was achieved, producing clear trends in the variation of their indoor levels with the time. The mixing phase might have lasted from 45 min to 4 h, depending on the pollutant. Only in phase 3 of
Figure 2, the cleaning device was activated producing a decay of pollutants that was mainly, but not exclusively, produced by the air cleaner and by the working conditions in which it was operated. The removal phase might have lasted from 3–4 h or more, in order to be certain that well-defined decay trends were followed by the various pollutants inside the room. In phase 4 of
Figure 2, the cleaning process was stopped, and the persistence of residual pollutants in the room was monitored for 12 h, if needed. In the last phase of the experiment (phase 5 of
Figure 2), the room was opened and equilibrated with the outdoor air to observe if the indoor pollution was higher or lower than that existing outdoors. This step allowed us to check that trends of pollutants inside the room were solely determined by indoor equilibria, and no exchanges between the outdoor and indoor air occurred during the entire experiment.
A continuous monitoring was performed to find out how accurately the decay rates of indoor pollutants followed an exponential trend, and their concentrations vs. time were described by the following equation:
where
is the removal rate constant in h
−1 of a pollutant,
i, due to a specific removal process,
a, in the room;
is the concentration of
i at a time,
t, from the moment when an initial concentration of
was present in the room. Plots of
vs. time were generated in each experiment because the logarithmic form of Equation (1) can be assimilated to a straight line:
where
is the intercept, and
is the slope. In this way, the decay processes can be quantified, and adequately modeled, by finding the regression lines that fit better with the experimental points.
Since nothing was known about the removal mechanism of the GIOEL system, the first experiments were performed by setting the suction flow rate of air, Φ, at a minimum value of 45 m3 h−1. This allowed us to obtain the highest number of points for the regression analysis. In these conditions, 3.75 air changes per hour (ACPH) occurred in the room, because ACPH = , where is the volume of the room in m3. To assess the removal rates of particles, a mixing phase lasting 45 min followed by a cleaning phase of 2 h and 45 min was used without replacing the water in the reservoir. At the end of the cleaning phase, particle number concentrations were monitored for more than 12 h before the room was opened.
Semi-logarithmic plots of particle number concentrations vs. time for the three main size ranges detected by the OPC are reported in
Figure 2, together with the main parameters used to assess the performances of the air cleaner. Two distinct decay trends, closely following Equation (2), were detected, and they were both accurately described by linear regression curves showing a good fit (R
2 > 0.998) with the measured values. Regression lines in blue, in
Figure 2, describe the removal of particles during the mixing phase, when deposition to the ground and adsorption were the only removal processes active in the room. The values of their intercept and slope are reported in
Table 2, in which they are indicated by the subscript
d (deposition). In
Figure 2 and in
Table 2, the intercepts are referred to the starting time of the experiment,
, which is different from the time,
, used here to indicate the starting time of the removal phase by cleaning. Assessing the removal rates of particles by deposition/adsorption was fundamental, because only by quantifying this contribution was it possible to determine the net removal efficiency of pollutants by the air cleaner.
Data in
Figure 2 show that the removal by deposition/adsorption increased with the mean particle size. Since the same density can be assumed for diesel particles, volumes estimated from the mean size diameters are proportional to their mass, indicating that gravitational settling was the process most responsible for the removal of particles inside the room. In spite of the short duration of the mixing phase, the values of the slopes and intercepts of the regression lines obtained in this experiment were the same as those measured when diesel particles were allowed to deposit for more than 16 h in the room.
The removal of particles by water cavitation is described, instead, by the linear regression curves in red in
Figure 2, whose intercepts and slopes are reported in
Table 2, in which they are indicated by the subscript,
r (removal). The black dotted line in
Figure 2 indicates, instead, the mean concentrations of particles, (
), measured at the beginning and at the end of each experiment, when only atmospheric particles were present in the room at much lower levels than the air quality limits established for the atmosphere. This line, in combination with the pair of regression lines originated at the time,
, allows for the assessment of the net percent removal of a pollutant by the cleaner at any time,
.
By inserting into Equation (2) the value of
and those of the slope and intercepts reported
Table 2, the initial concentrations of particles at the beginning of the cleaning phase can be obtained, if logarithmic values are converted in their exponential form. At the time,
,
, and this is the value in
Figure 2, in which the regression lines by deposition/adsorption across the ones obtained by cleaning are presented.
By accounting for the concentration, , of atmospheric particles present in the room at the beginning of the experiment (), the net concentrations of particles to be removed by the cleaner are .
If deposition/adsorption is the only removal process active in the room, the net percent removal of particles at any time,
, can be calculated as:
Removal is complete when
, and
, where
is the time and where the blue lines cross the black dotted line in
Figure 2. The time to completely remove particles from the room by deposition/adsorption is thus
.
When removal by cleaning starts in the room, the net percent removal at any given time,
, must be calculated with respect to the concentration of particles that survived deposition/adsorption at the time,
. By accounting for them, the net percent removal of particles by the air cleaner is:
A complete removal occurs when
, and
, where
is the time in
Figure 2, in which the red regression lines across the black dotted ones. The net concentration of particles removed by the cleaner at the time,
, is indicated in
Figure 2 by the dotted vertical segments in red. Based on this, the time required by the cleaner to achieve a complete removal of particles from the room is
.
Having clarified the meaning of all curves displayed in
Figure 2, and how to use them, we can now discuss the results obtained. They show that diesel particles in the size ranges investigated were all completely removed when the air cleaner was still in operation (phase 3 of
Figure 2). The dependence of the decay rates from the mean particle size indicated that, in the experimental conditions used, water cavitation was more efficient in removing particles with a higher mass. The sudden increase in concentrations observed when the room was opened, confirmed that the room was tight enough to maintain sub-ambient levels of particles for quite a long time, and the values of the decay rates reported in
Table 2 were not affected by intrusion or ventilation effects. Since no continuous monitoring of PM
2.5 and PM
10 was performed in this experiment, parallel determinations were carried out indoors and outdoors with the gravimetric method, once the cleaner was switched off. Results obtained by monitoring the particle mass were consistent with those obtained with the particle number, since the indoor value of PM
2.5 (5 μg m
−3) was 3 times lower than the outdoor one. Using a similar approach, an average concentration of PM
2.5 of 402 μg m
−3 was found to be present in the room during the mixing phase. By considering that the black carbon particles in diesel emission account for 55 to 70% of the total mass [
29], an average concentration of ca. 250 μg m
−3 was estimated to be present in the room at the
time, corresponding to a total mass of black carbon particles of ca. 3.23 mg.
Removal rates of VOCs present in the diesel exhaust emission were also determined, but in separate experiments. Since the deposition rates of gases and vapors are usually much lower than those of particles [
33], the mixing phase was increased to 4 h and 45 min, and the cleaning phase reduced to 2 h.
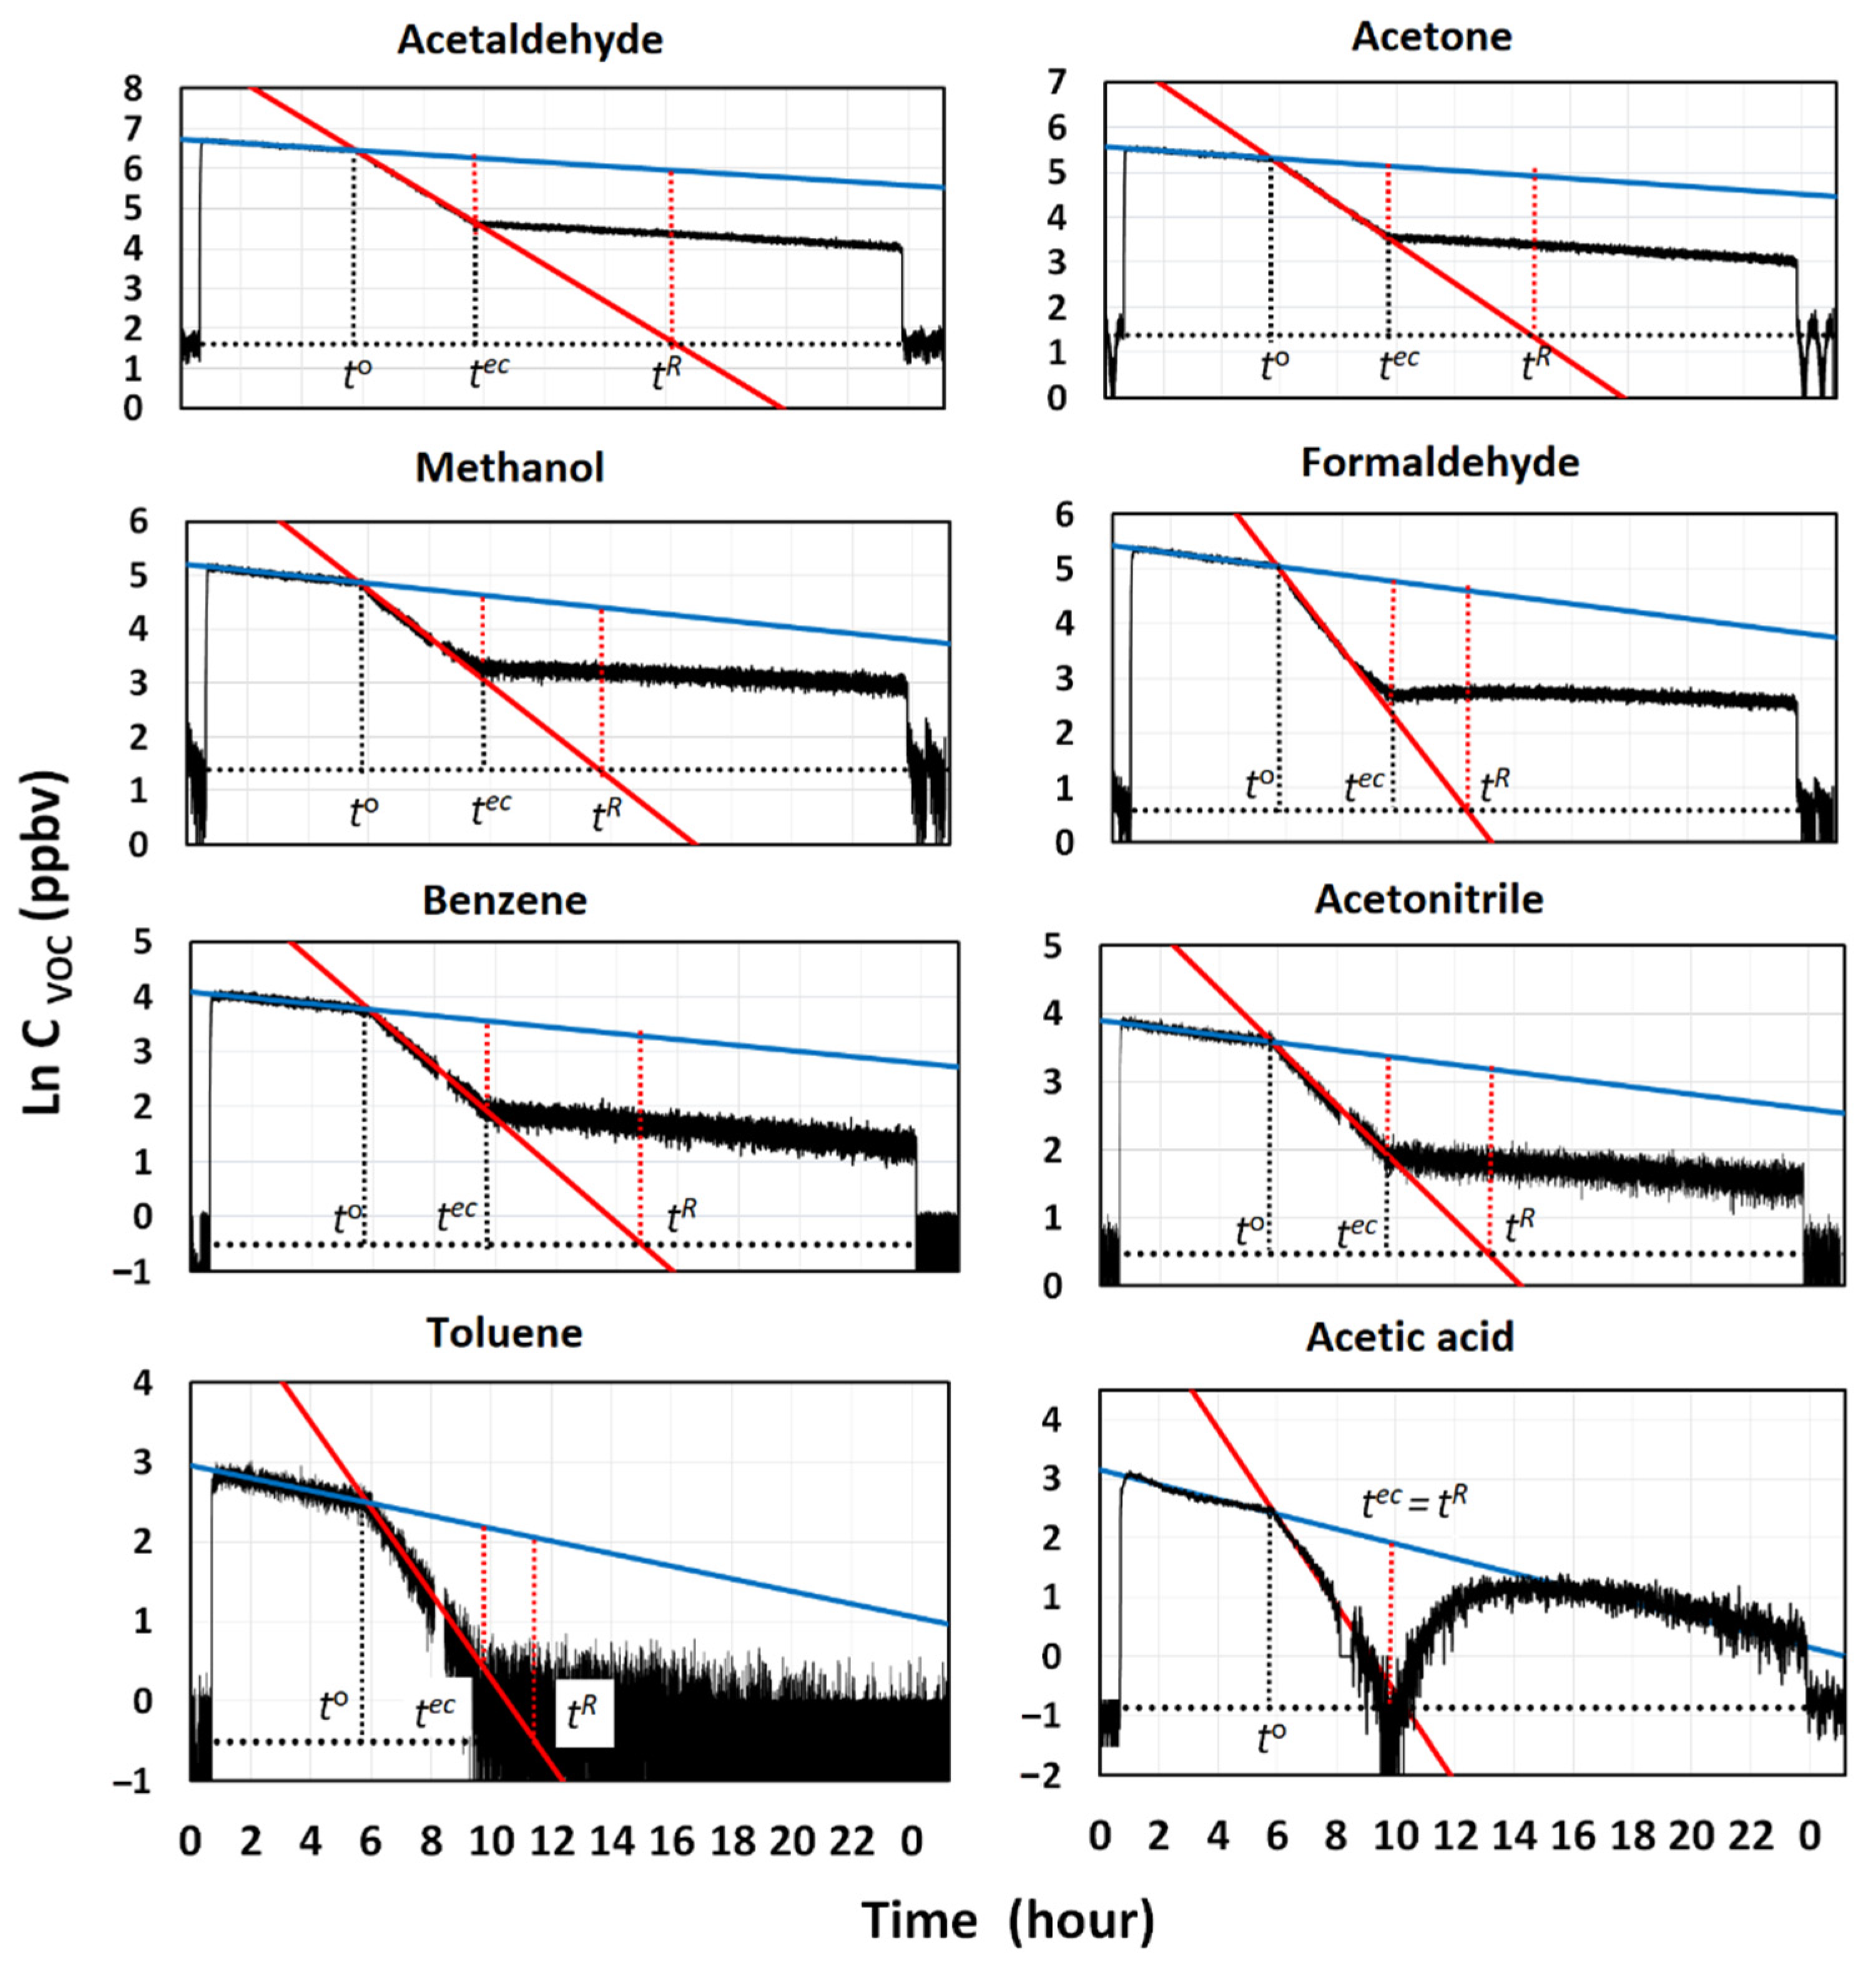
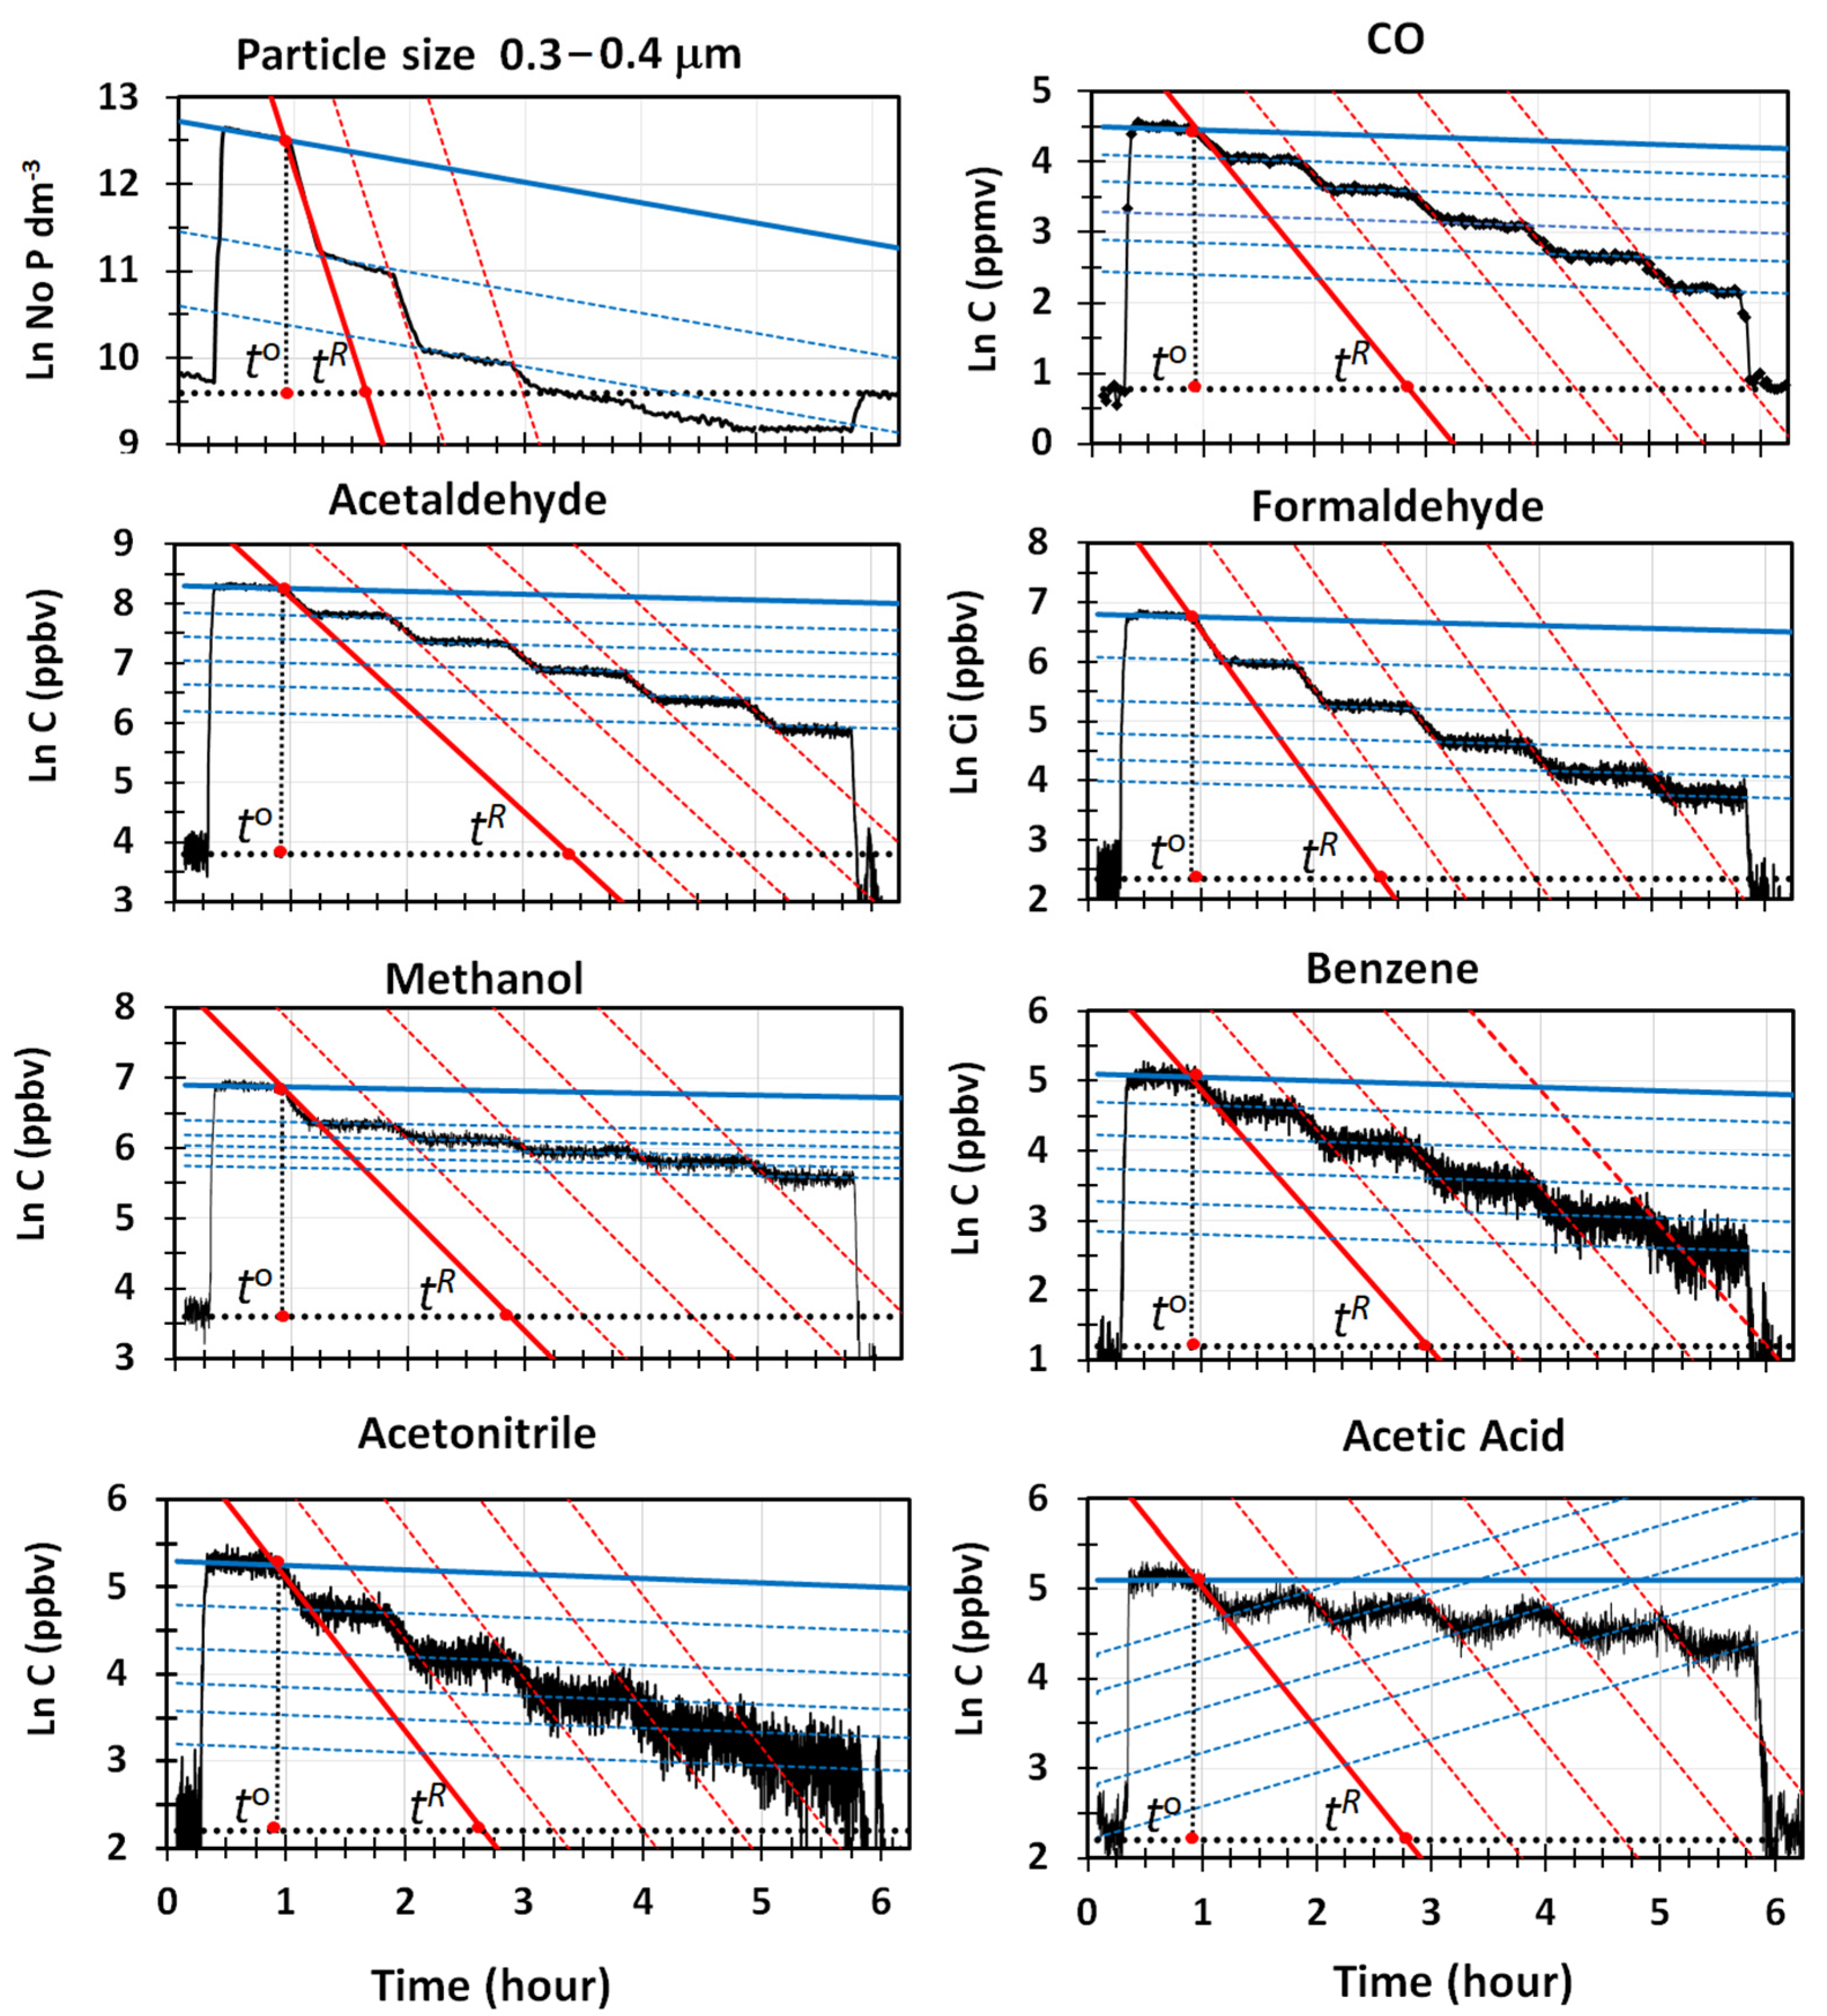
Figure 3 reports the semi-logarithmic plots of the mixing ratios of VOCs vs. time, for the most abundant components sensed by PTR-MS, together with the regression lines generated for the mixing and cleaning phases, and the line indicating the average levels of VOCs measured at the beginning and the end of the experiment. Very accurate regression lines (R
2 > 0.998) were obtained for the decay of VOCs in the room. The values of their intercepts and slopes for natural deposition and water cavitation are listed in
Table 2. Data consistently show that water cavitation was less efficient in removing VOCs than particles. Except for the acetic acid, not one of the other VOCs was completely removed from the room at the end of the cleaning phase, indicated by the time,
, in
Figure 3. Thus, the levels higher than those existing outdoors persisted in the room until it was opened, and a sudden drop in the indoor concentrations was observed. The net fractions of VOCs removed by the GIOEL cleaner ranged from 75% to 85%, depending on the VOC type. They can be visually estimated by comparing the lengths of the vertical dotted segments in red, in
Figure 3, recorded at the times
and
, respectively. In the experimental conditions used, a time of
8 h was needed to completely remove all VOCs from the testing room.
The removal rate constants reported in
Table 2 showed that the working mechanism of water cavitation was substantially different from a simple dissolution–partition of VOCs in water, because their values were not consistent with the air–water distribution ratio
, which is a dimensionless form of Henry’s law, in which the concentrations of a species,
, in air,
, and in water,
, are used. According to this formulation, a compound strongly retained in water by solution–partition is characterized by a very low value of
(typically < 1 × 10
−5), whereas a compound poorly retained in water has values higher than ca. 0.1 [
34].
By comparing the values of
, from the literature [
34,
35], with the removal rate constants reported in
Table 2, we can see that a very poorly soluble compound in water, such as benzene (K
AW = 0.23), was removed by the GIOEL cleaner at a rate comparable to those of the most highly soluble ones, such as methanol (K
AW = 1.82 × 10
−4), acetonitrile (K
AW = 8.71 × 10
−4) and acetone (K
AW = 1.58 × 10
−3). This suggests that the removal of VOCs by water cavitation is rather complex, and several phase transitions can take place from the time when bubbles form in the water, until they explode on the surfaces, after having collapsed [
25]. It cannot be excluded that the amount and chemical nature of particles can play an important role in the selective removal of VOCs by adsorption and condensation processes.
Data in
Figure 3 clearly show that the removal behavior of acetic acid from the room differs from those of the other VOCs. At the end of the experiment, the indoor concentration was higher than the outdoor one, although it was completely removed at the end of the cleaning phase, because of the high solubility in water (K
AW = 7.76 × 10
−6) and the capability to stick onto surfaces. The trend followed at the time
, shows that an unexpected increase in concentration occurred. It lasted until the indoor levels matched those of the regression line describing the natural decay of acetic acid by deposition/adsorption. If the removal rate by water cavitation is faster than the kinetics governing the adsorption equilibrium of acetic acid in the room, then a decay in concentration will be observed as long as cleaning is performed. When cleaning ceases, desorption from the room starts to take place, to restore the equilibrium between the gas and the solid surfaces. Adsorption of acetic acid is possible in our case, because it can interact with the
groups of the polycarbonate polymer through hydrogen bonds. If so, adsorption must have occurred at the beginning of the mixing phase (phase 2 in
Figure 2), when the highest concentrations of VOCs were reached inside the room.
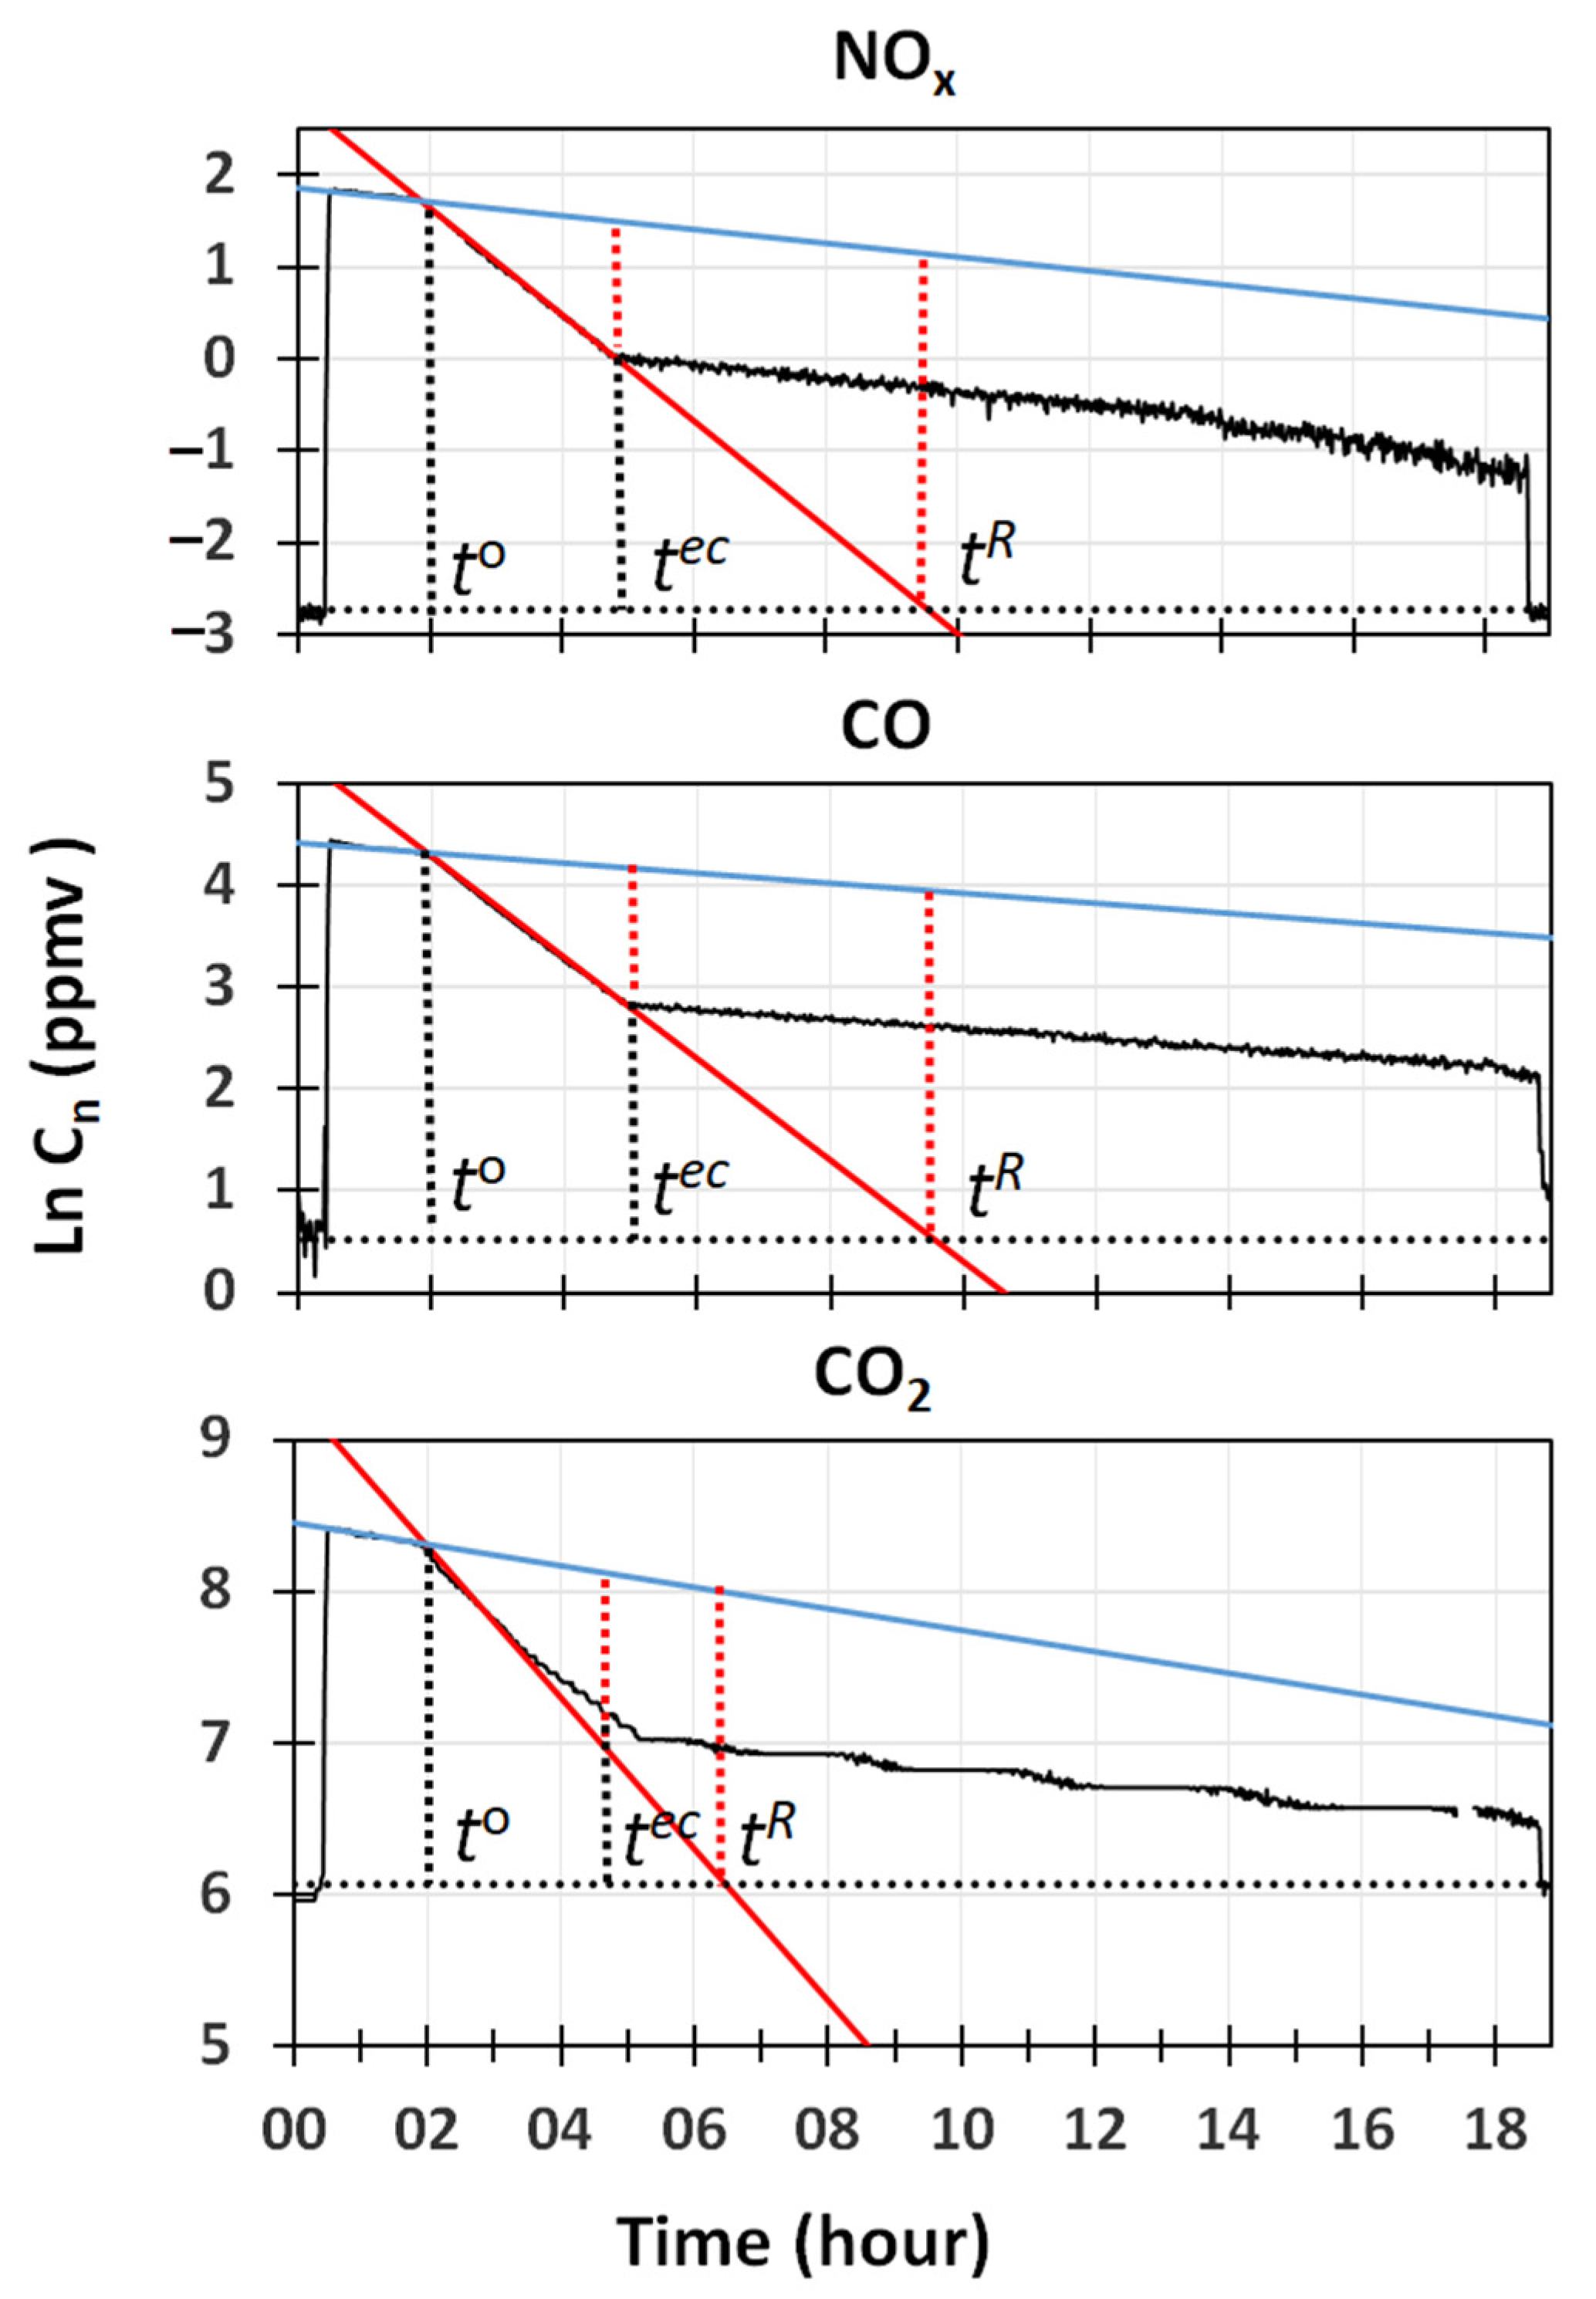
The capability of water cavitation, to remove gases that were nearly insoluble in water, was confirmed by the results displayed in
Figure 4. It reports semi-logarithmic plots of
vs. time for NOx (NO + NO
2), CO and CO
2, together with the regression lines obtained in the mixing and cleaning phases, and the line indicating the mean concentrations measured at the beginning and the end of the experiment. While an excellent fitting (R
2 > 0.998) was obtained for the linear regression curves of CO and NOx, a lower accuracy (R
2 = 0.96) was obtained for CO
2, due to the stepwise behavior of the sensor used.
Values of the slope and intercepts of the regression lines for the removal by natural deposition/adsorption, and by cleaning obtained for these gases, are also reported in
Table 2. Results obtained with CO
2 confirmed the unique features of water cavitation. Since CO
2 has a much higher solubility in pure water (K
AW = 1), than NO (K
AW = 20) and CO (K
AW = 50), it should have been removed much faster than the other two gases by air–water partition. Removal rates of CO
2 can be even higher if a precipitate of calcium carbonate is formed. This was possible in our case, because water with average concentrations of Ca
+2 ions between 50 and 99 mg L
−1, and a pH between 7.4 and 7.6, was used in all the experiments. Certainly, the removal rates of CO and NOx (that in combustion emission is mainly NO) were quite high, as they were comparable to those of many VOCs that were quite soluble in water. Moreover, in this case, a value of
8 h was required by the GIOEL system to completely remove these gases from the room.
To find out how the suction rate of air affected the removal rates of pollutants by water cavitation, experiments were performed by running the system at the maximum value (180 m3 h−1). In these conditions, the number of ACPH was 4 times higher than in previous experiments. The system was operated in a pulsed mode, by alternating removal phases with mixing phases, for which the system was switched off. This was necessary because, at the highest suction rate, the cleaner cannot run continuously for more than ca. 90 min. The reduction of the water volume in the reservoir is significantly elevated, to strongly limit the water cavitation effect. With the pulsed protocol used, a sufficient number of decay curves for natural deposition/adsorption and water cavitation could have been generated to assess the decay rates of the various pollutants from the room. With this approach, it was also possible to define the most suitable procedure for the collection of water samples for in vitro testing. Since a minimum of 3 water samples needed to be collected for each experiment, and ca. 10 min was necessarily required to obtain the sample, clean the water reservoir and to refill it with fresh water, the pulsed experiment also allowed us to check how regular and predictable the decay trends of pollutants in the room were, when no flow of air was passing through it.
Figure 5 reports the semi-logarithmic plots of
vs. time, for the most significant pollutants recorded in the room when 5 removal steps of 20 min were alternated with mixing phases of 35 min. As shown in
Figure 5, a stepwise trend in concentration was followed by all pollutants. The decay was so clear, that it was possible to clearly distinguish when removal by cleaning and by mixing occurred. The trends of the pollutants were so well described in Equation (2), that it was possible to generate regression lines for the removal by deposition/adsorption and by cleaning for any time,
, when cleaning started. The fitting of the regression lines with the experimental points was good enough (0.998 < R
2 < 0.988), that reliable values of the slopes and intercepts were obtained for each one of the cleaning and mixing steps performed in the pulsed experiment. To make it easier to read the curves in
Figure 5, it is important to remember that only one regression line for the removal by natural deposition/adsorption and one for the removal by cleaning are generated at each time,
. In a regular pulsed mode, each pair of regression lines is also related to those generated at the time,
, because
, where
n is the number of removal steps assuming the first equals to 0, and
the time interval between each removal step (35 min in our case).
From the observation of the regression lines generated in the various removal steps, indicated by the red lines in
Figure 5, we can see that their parallelism is so close that, by setting
= 0, they all combine into the curve generated at
. Under these conditions, the regression line generated at
is formally equivalent to the one generated when the air cleaner is run in a continuous mode. The values of the slopes and intercepts of the
regression lines for the removal by cleaning obtained for the various pollutants investigated are reported in
Table 3, in which they are indicated by the subscript,
r. By comparing them with the values reported in
Table 2, it can be observed that a 4 time increase in the ACPH produced a significantly variable increase in the removal rate constants of the various pollutants, with values ranging from 1.4 to 4.6. The fact that a 3.8 increment was observed for some particles and many VOCs, suggests that the
ratio strongly affects the value of
. This effect can be better expressed by observing that
, where
αi is an adimensional term, ranging from 0.3 to 1, measuring the impact of water cavitation on the species,
. Values of
identified by these regression lines, provide an estimate of the time (
necessary to completely remove a pollutant from the room, if the cleaner was run on a continuous mode. From the data displayed in
Figure 5, a time of ca. 2 h was needed to remove all the pollutants from the room, with respect to the 8 h necessary when the cleaner was continuously run at the minimum airflow rate.
These conclusions hold, if the regression lines by deposition/adsorption, indicated in blue in
Figure 5, also combine into the one obtained at the time,
. This occurs if all regression lines generated at any time,
, show a decrease in the initial concentrations that match the amount removed by the cleaner in the previous removal step, and such a difference is maintained during all the mixing steps. In geometrical terms, all regression lines generated at any time,
, must be parallel to that generated at the time,
, and properly downscaled in their initial concentrations by the amount removed in each cleaning step.
Data in
Figure 5 show that these conditions were met by all compounds, except the acetic acid. The values of the slopes and intercepts of the regression lines obtained at
, for deposition/adsorption, are reported in
Table 3, in which they are indicated by the subscript,
d. Decay rates by natural deposition/adsorption measured in the pulsed mode were generally lower than those reported in
Table 2; however, with the only exception being represented by the acetic acid, the differences were sufficiently small to not substantially affect the value of the net percent removal of various pollutants by the air cleaner.
Results obtained in the pulsed experiment confirmed that the desorption of acidic acid from the room occurred, and it was not negligible. As shown in
Figure 5, the regression line generated at the time,
, was characterized by the same small negative slope than the other VOCs, whereas those generated in the following mixing steps all showed a positive slope with a constant value of 9 h
−1, correlating well with the experimental points (R
2 > 0.98). These results confirmed that the emission of acetic acid was slower than the removal by water cavitation, for which a value of −38 h
−1 was measured. As shown in
Figure 5, the duration of the mixing step was significantly long, that the amount of acetic acid released at any step,
, almost matched that removed by the air cleaner. The net effect was that the amount of acetic acid removed from the room at the end of the experiment, was not so much lower than that removed by natural deposition/adsorption.
Based on the
value for acetic acid, shown in
Figure 5, the desorption effects could have been eliminated by running the air cleaner in a continuous mode for more than 2 h. Since this was not possible, a pulsed protocol was designed to limit the desorption effects as much as possible. It consisted of 3 removal steps of 40 min, alternated with 3 mixing steps of 10 min. This protocol allowed for the collection of 3 water samples in the time interval, between
and
, in addition to the one collected when the room was opened to the outdoor air for 1 h. Decay curves recorded in this pulsed experiment were fully consistent with those displayed in
Figure 5, with the only difference that 2 removal steps were combined into 1, and mixing reduced by 1/3. The release of acetic acid was still visible, but it was sufficiently low, so that the regression lines by cleaning did not differ too much from the
regression line in red, in
Figure 5. The complete removal of VOCs from the room, at the end of the experiment, was confirmed by a parallel sampling performed indoors and outdoors on traps, later analyzed by GC-MS. Results obtained confirmed that the indoor levels of VOCs were lower than those measured outdoors. The parallel sampling of PM
2.5 and PM
10 also confirmed that the indoor levels of particles were smaller than those existing outdoors, and they were consistent with the data provided by the OPC.
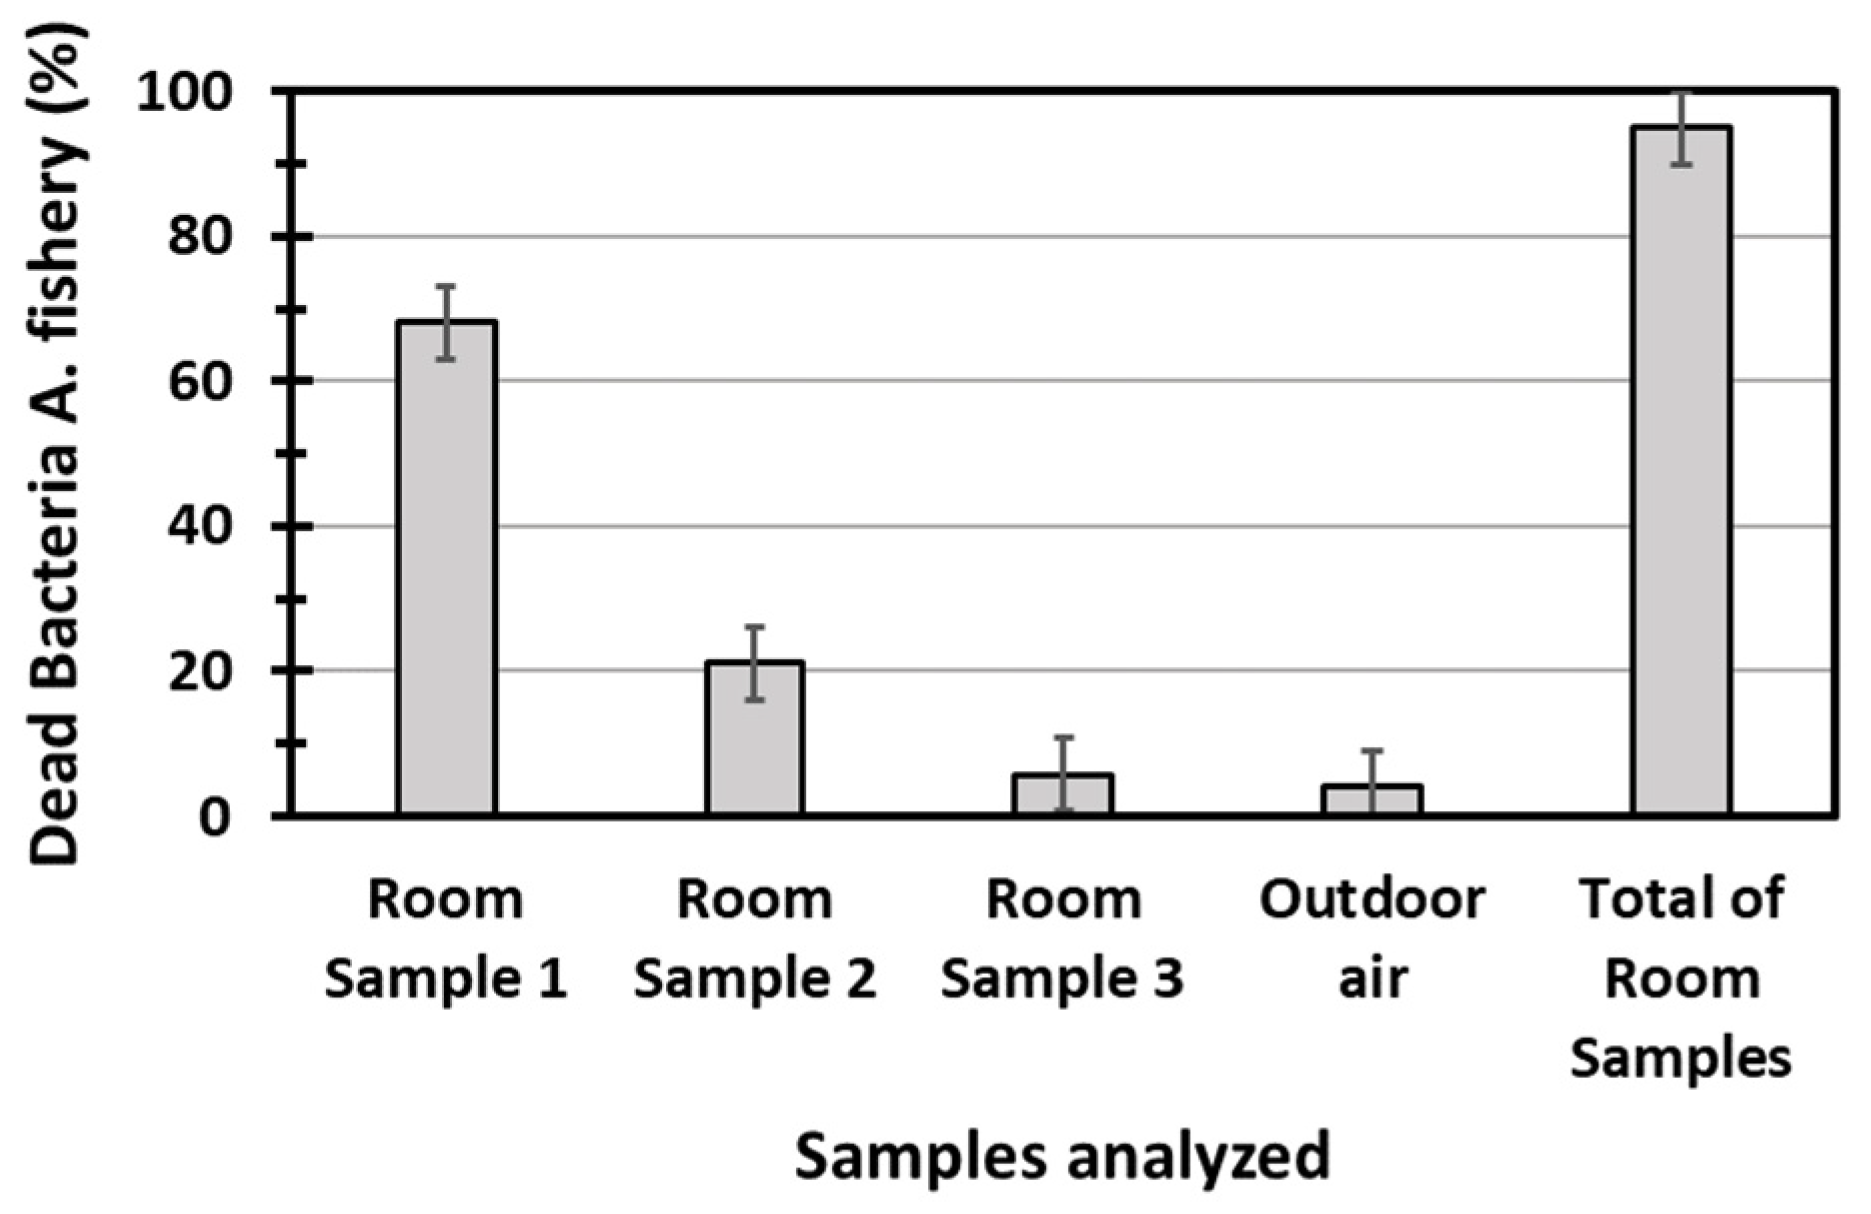
Figure 6 reports the dead fractions of the bioluminescent bacteria of
Allivibrio fischeri, measured by submitting the water samples collected in the pulsed experiment to the Microtox
® test. The value of the total toxicity, obtained by mixing equal aliquots of the first three samples collected in the room, is also reported in
Figure 6.
Results reported in
Figure 6 show that that the total toxicity of diesel exhaust emission was significantly elevated, that 95% of the bacteria were killed by the toxic substances contained in the emissions collected in a single experiment, estimated to be in the range of 5.2–5.5 mg. As indicated by the bar graphs in
Figure 6, 70% of the toxicity was concentrated in the first 40 min sample, whose collection started at
. In this sample, more than 80% of the particles were concentrated, based on the black deposit, 2 cm wide, that was accumulated in the areas of the reservoir in which the bubbles exploded. The volume of black particles appeared to be consistent with the amount of ca. 3.3 mg, estimated in the previous experiment. SEM analysis showed that the deposit was mostly made by large aggregates of fine black carbon particles, where sparse atmospheric particles of pollen were present, together with well-developed crystals of calcite, probably formed by calcium carbonate precipitation in water. The second 40 min sample showed a limited toxicity, mostly determined by VOCs and inorganic gases, as the deposition of black particles in the reservoir was just visible. The last 40 min sample showed a toxicity that, within the experimental errors, was the same as that of outdoor air. The decay trend of toxicity vs. time, followed an exponential decay, with a slope of −1.85 h
−1 when plotted in a semi-logarithmic scale. This represents quite a noticeable decay, if we consider the limited sensitivity scale of the Microtox
® test. The results suggest that the GIOEL system could have been used as a sampler to assess the capability of any other cleaning system, providing that the diesel exhaust emission is used as a pollution source.
3.1.2. Checking the Performances of Prototypes for Possible Improvements
The study performed on the SANINDOOR prototype, provides an example of how the room was used to check if a cleaning system meets the requirements defined in the technical project, or if improvements are needed before the system is put into production.
In contrast with the GIOEL system, the SANINDOOR prototype was designed to run continuously until the indoor levels in a room reached the air quality standards defined for the atmospheric air. The air cleaner was also designed to remove those organic and inorganic compounds, such as methyl mercaptan and H
2S, producing annoyance because of their intense, malodorous smell. With this cleaner the removal of pollutants is obtained by combining the effects of different filtering agents exploiting adsorption, with a stage in which VOCs are oxidized to CO
2 by gaseous oxidants generated in two sequential steps, in which the final one is a photochemical flow reactor. Using the US-EPA classification [
15], the air cleaner can be classified as a combination of systems using adsorption on fiber filters, plasma and photolysis. The company did not provide information about the way that these modules work, as they can be modified before the final system is produced. The only information available was that it presently operates at a flow rate of 380 m
3 h
−1 (19–33 ACPH in our room). In addition to the removal of particles and VOCs, the system must have been tested for the removal of NO
2 and the ozone (O
3) production. When the system was in operation, the indoor levels of O
3 must have been comparable to those present in the outdoors (35–40 ppbv). To maintain these levels, the system was programmed to automatically reduce the O
3 production by 50%, if indoor levels in the room exceeded 35 ppbv. Since no specific modules for the removal of CO
2 were present in the cleaner, no removal of this gas from the room was expected to occur during the cleaning phase. Thus, the decay of CO
2 was assumed to be the same as that described by the regression line for the deposition/adsorption reported in
Figure 4. This was reasonable because the levels of CO
2 generated by diesel exhaust emission at the time,
, were so high (3 × 10
3 and 4 × 10
3 ppmv), that any possible removal or production by the cleaner (estimated in the order of ±10 ppmv) could have never detectably changed the behavior of this gas in the room.
Given the complex oxidation system used, a high number of VOCs was monitored. The reliability of solid-state sensors for total VOCs and PM
2.5 and PM
10 was also tested. Since many companies use these types of sensors to control their air cleaners, it was important to know how their signals fitted with those provided by other methods. This was particularly true for sensors measuring the total VOC content, whose real meaning is not yet clear. Since formaldehyde is, by definition, a VOC, (it is indeed an organic compound with a vapor pressure at ambient conditions higher than 0.13 kPa [
36]), the use of a specific sensor for this compound conflicts with term used to identify any total VOC type of sensors. Furthermore, it cannot be excluded that such sensors poorly detect other very volatile compounds.
The protocol followed with the SANINDOOR prototype was the same as that used with the GIOEL system, with the only difference being that the air cleaner was run continuously for 16 h, after the mixing phase.
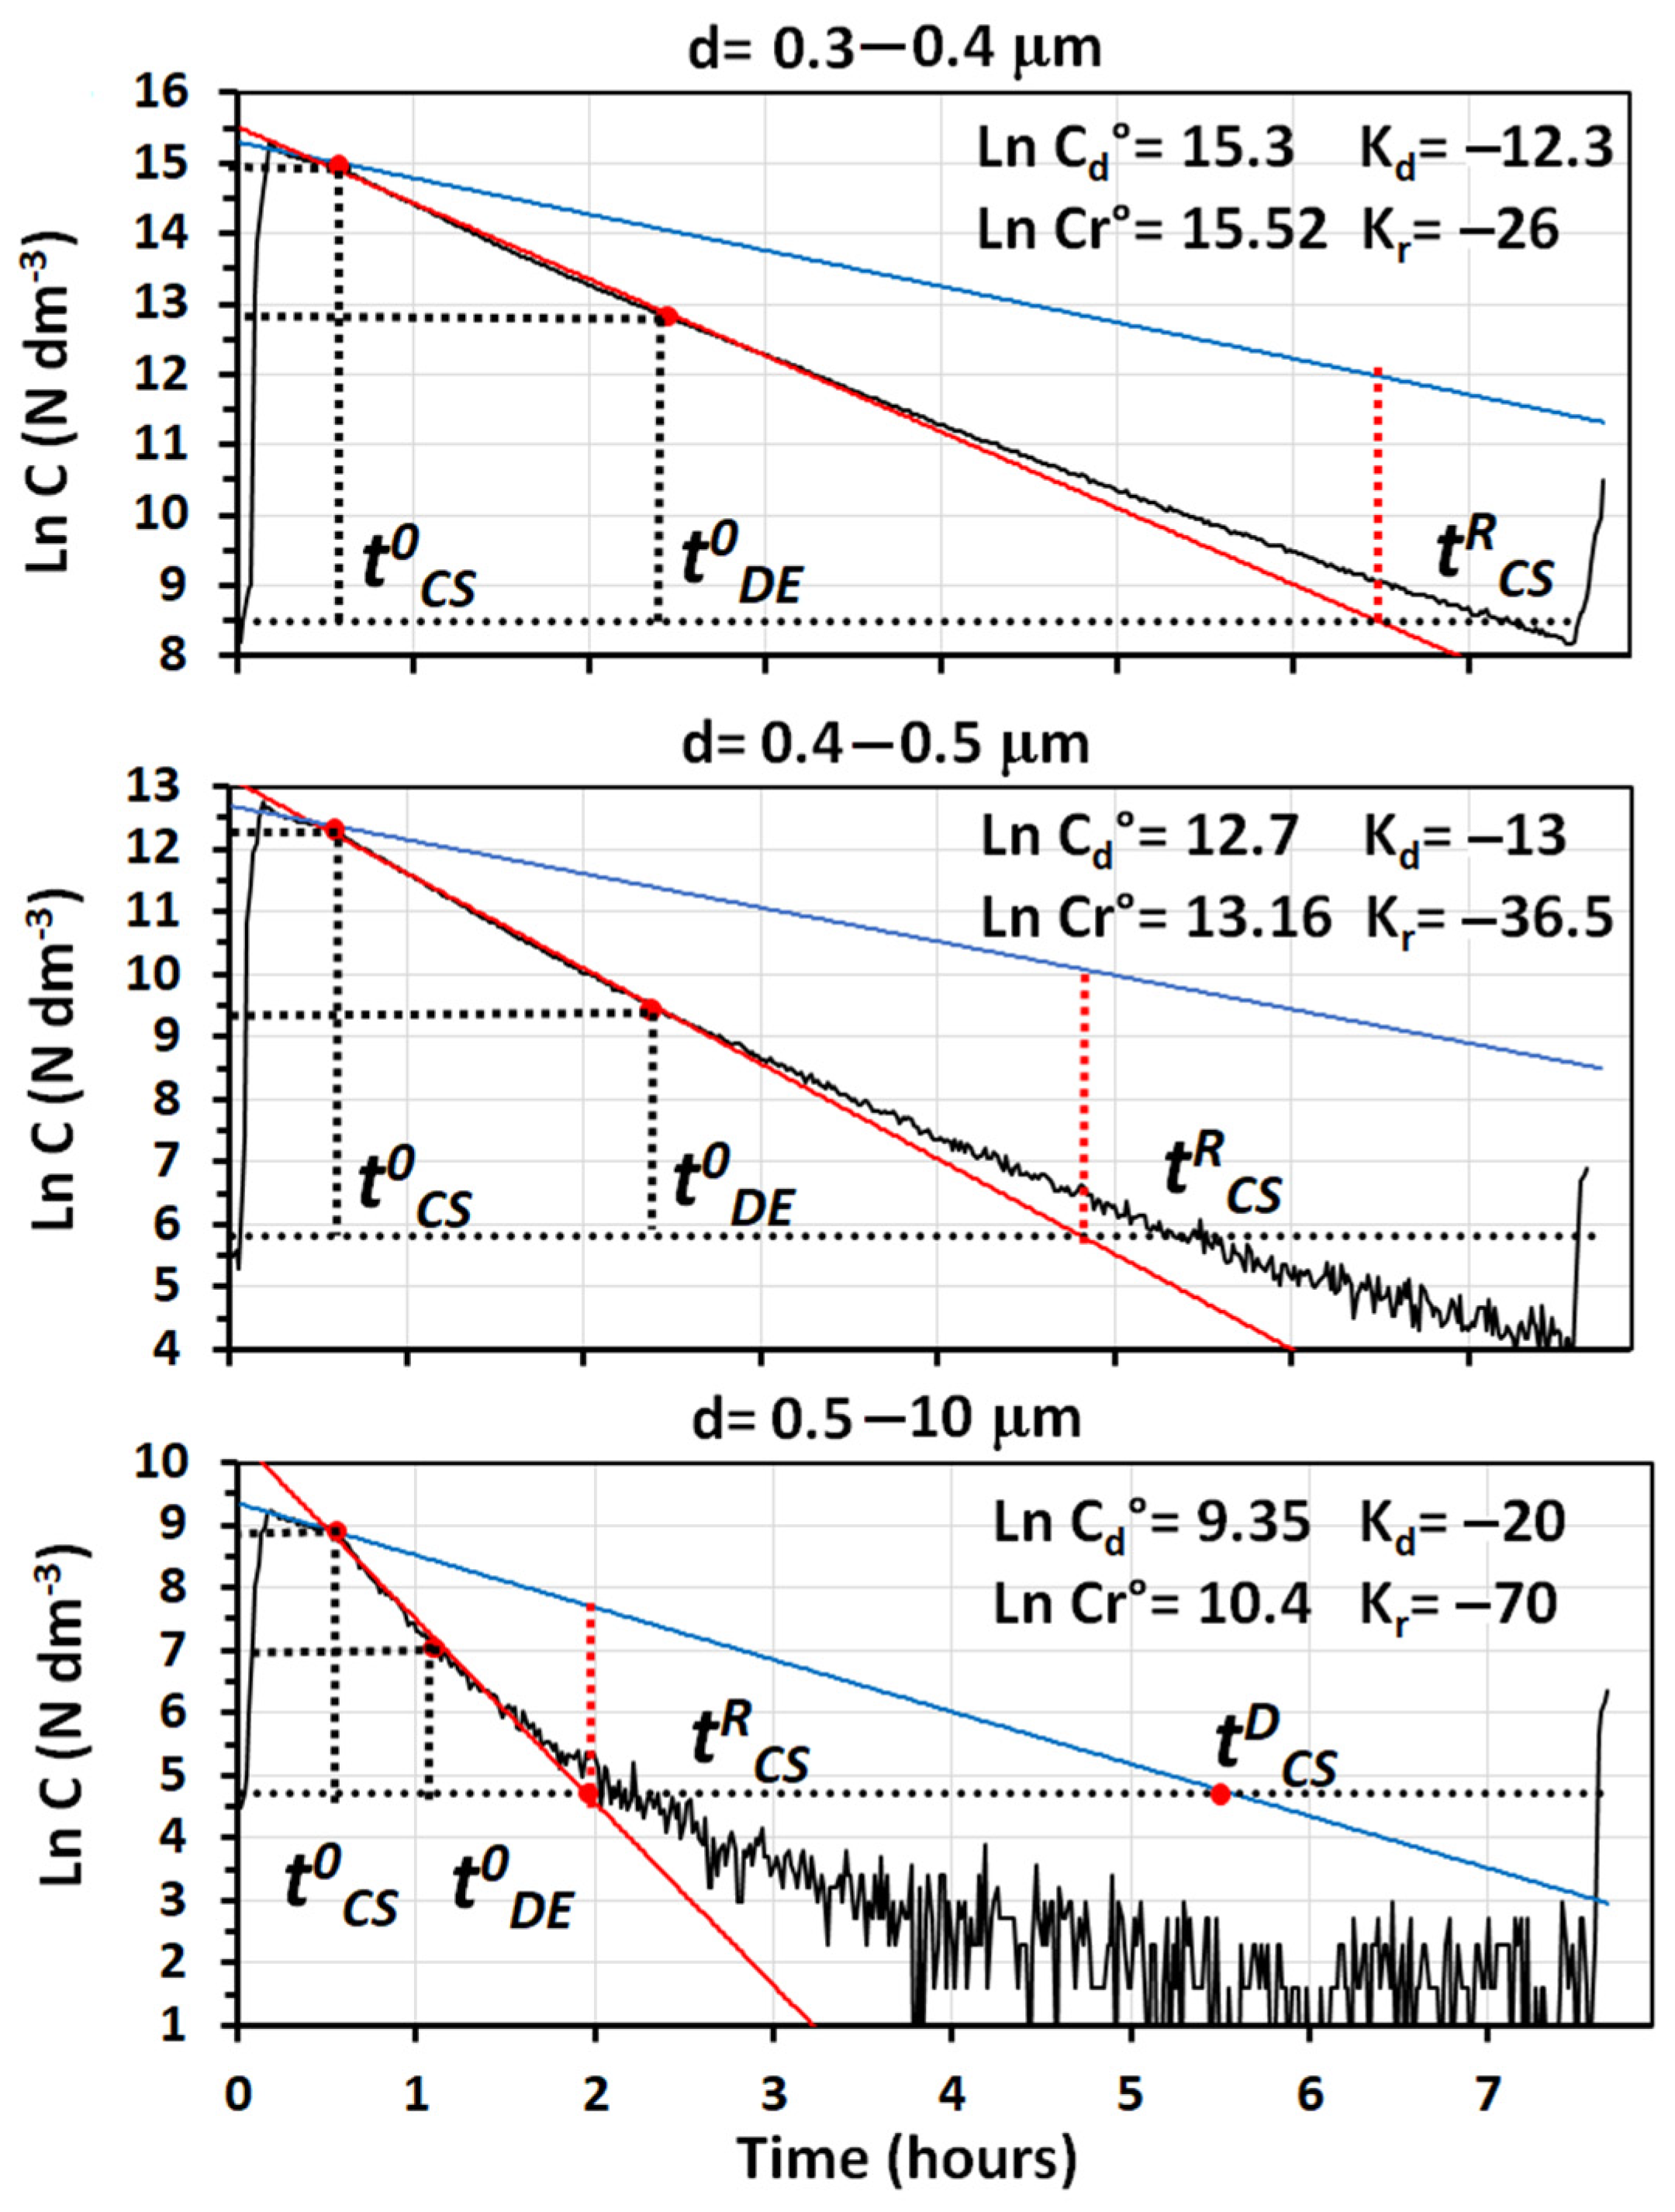
Figure 7 reports the semi-logarithmic plots of particle number concentrations vs. time recorded in the room, during an experiment performed with diesel exhaust emissions. The size ranges reported are the same as in
Figure 2. Together with the regression lines determined in the mixing and removal phases of the experiment, the values of their intercepts and slopes are also reported in
Figure 7. By neglecting the data of natural deposition, that were essentially the same as those reported in
Table 1 and
Table 2, the decay rates by cleaning obtained with the SANINDOOR prototype were sufficient to remove all particles recorded by the OPC in about 3 h; although, only the particles in the greatest size range were removed at the same rate as water cavitation working at the maximum speed.
Furthermore, in this case, the removal efficiency increased with the particle size. This was consistent with the fact that larger particles are better retained on fiber filters by impaction.
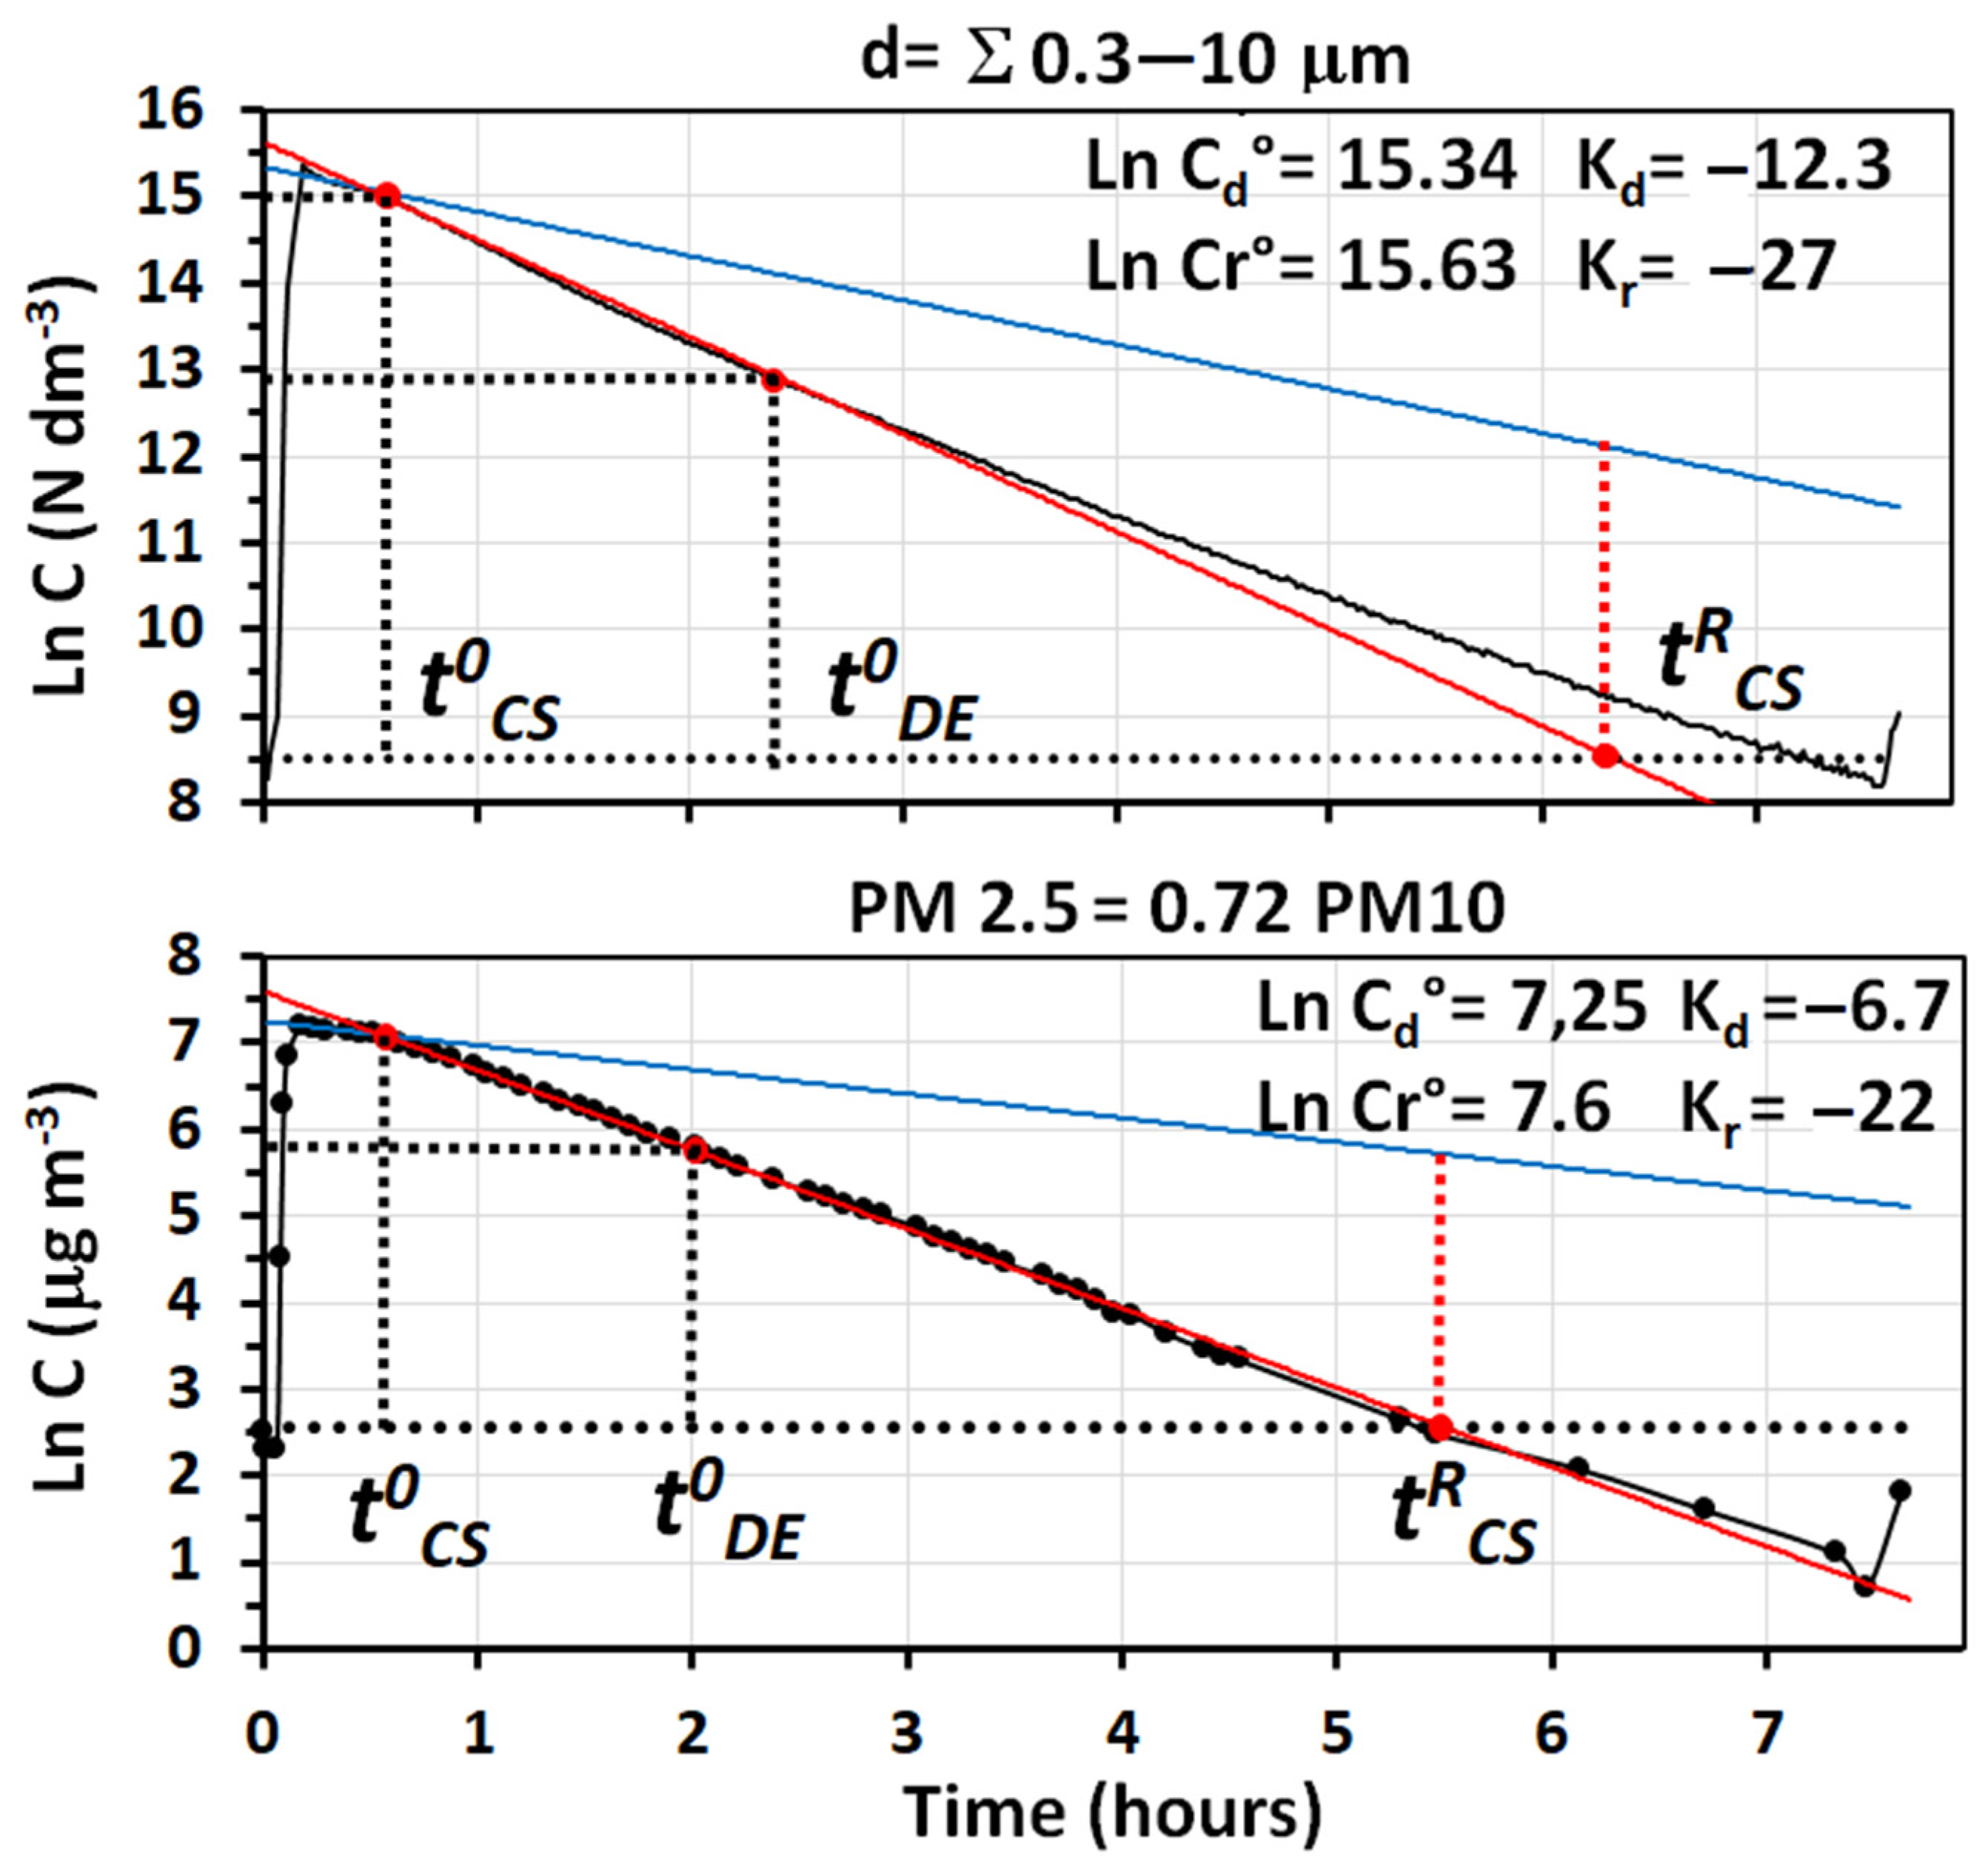
The removal efficiency of the system can be fully evaluated, by looking at the data reported in
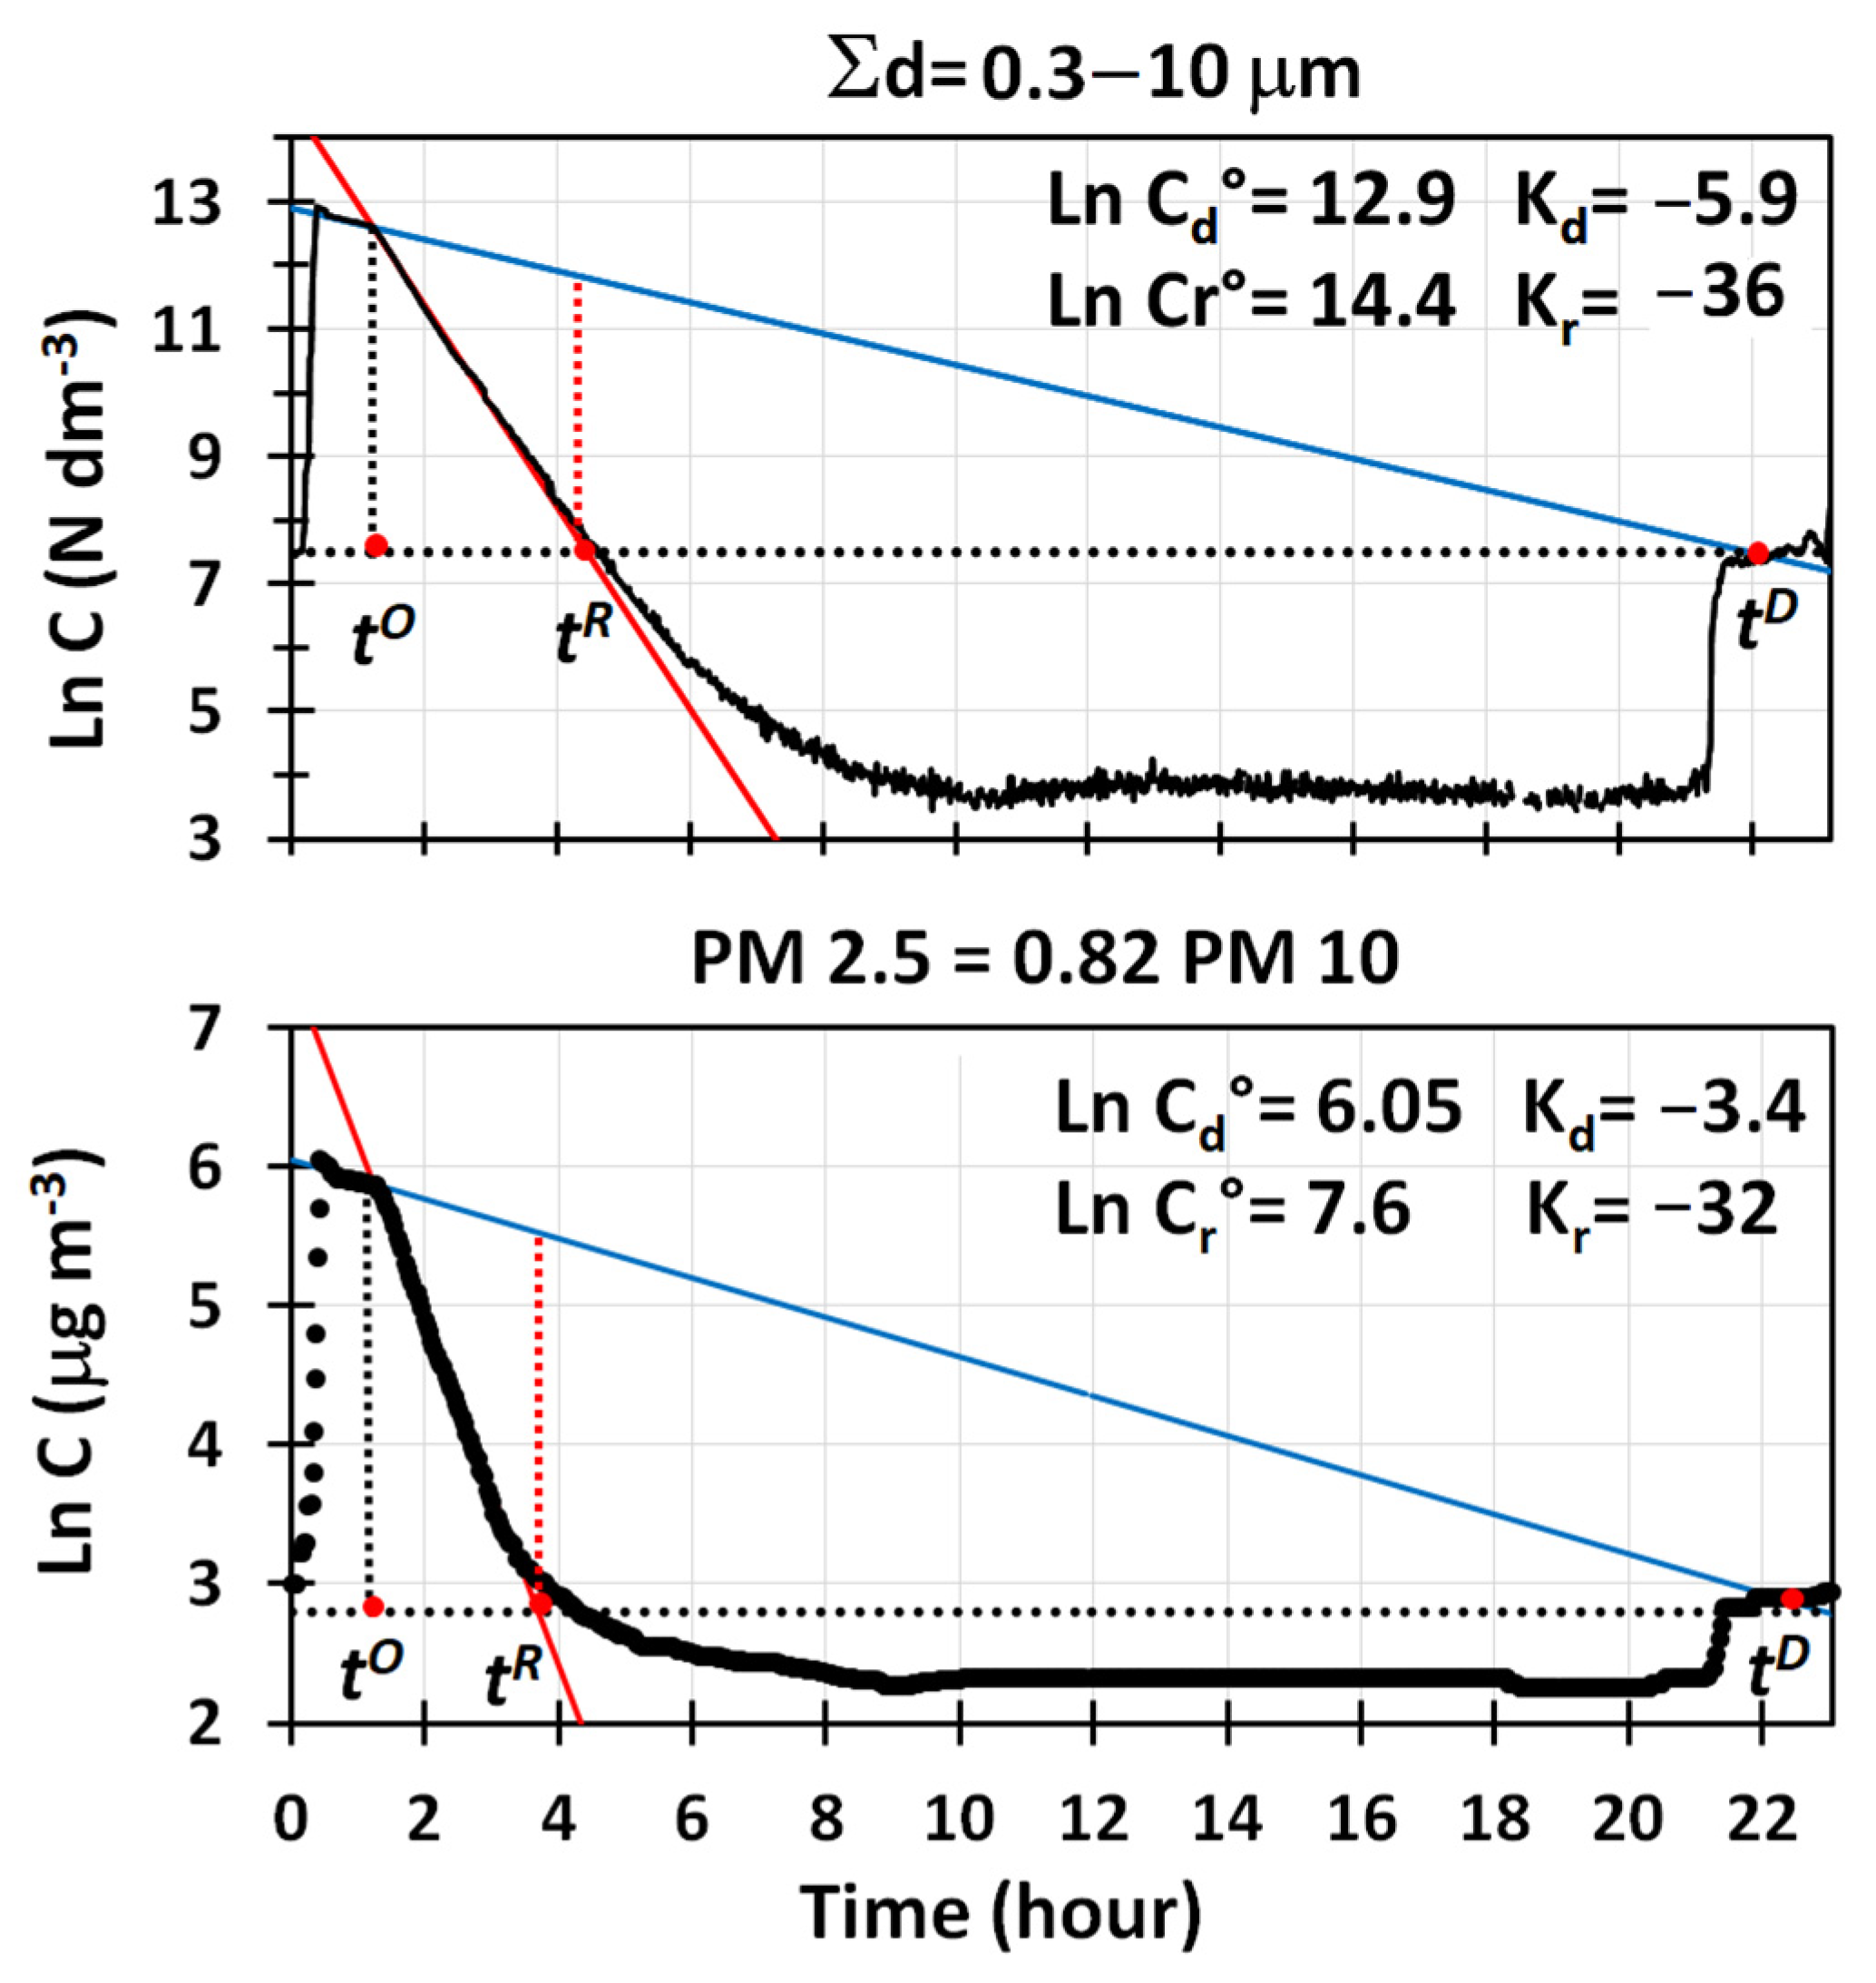
Figure 8, in which the semi-logarithmic plot vs. time of total particle number concentration sensed by the OPC is compared to that obtained by monitoring the total particle mass. In this experiment, the values of PM
2.5 and PM
10 were determined with two different solid state-sensors, one from PCE and the other from Tea Group, whose responses were previously calibrated with the gravimetric method.
Data in
Figure 8 show that the air cleaner can reduce the initial concentrations of PM
2.5 in the room, from 388 μg m
−3 to ambient levels (ca. 16.5 μg m
−3) in ca. 3 h, and levels as low as 5–6 μg m
−3 are maintained until the room is opened. It is worth noting that the curves obtained by the two solid state sensors, measuring PM
2.5 and PM
10, agreed so well that only one is reported in
Figure 8. By considering that the indices measured by the two types of monitors are different and that the instruments used are also different, a satisfactory agreement was found between the decay curves obtained using particle number and particle mass concentrations.
As far as VOCs are concerned, attention was concentrated on 14 chemical species that, although present at levels ranging from more than 100 ppbv to 0.01 ppbv, were all considered as crucial to test the working mechanism of the air cleaner. This was justified by the fact that some VOCs, such as methyl butadiene, are quickly oxidized by common atmospheric oxidants (such as ozone and OH radicals) to form methacrolein (MAC), methyl vinyl ketone (MVK) and formaldehyde [
9], whereas others, such as benzene, methanol, acetonitrile and acetone, are only slowly and partly oxidized by them [
9].
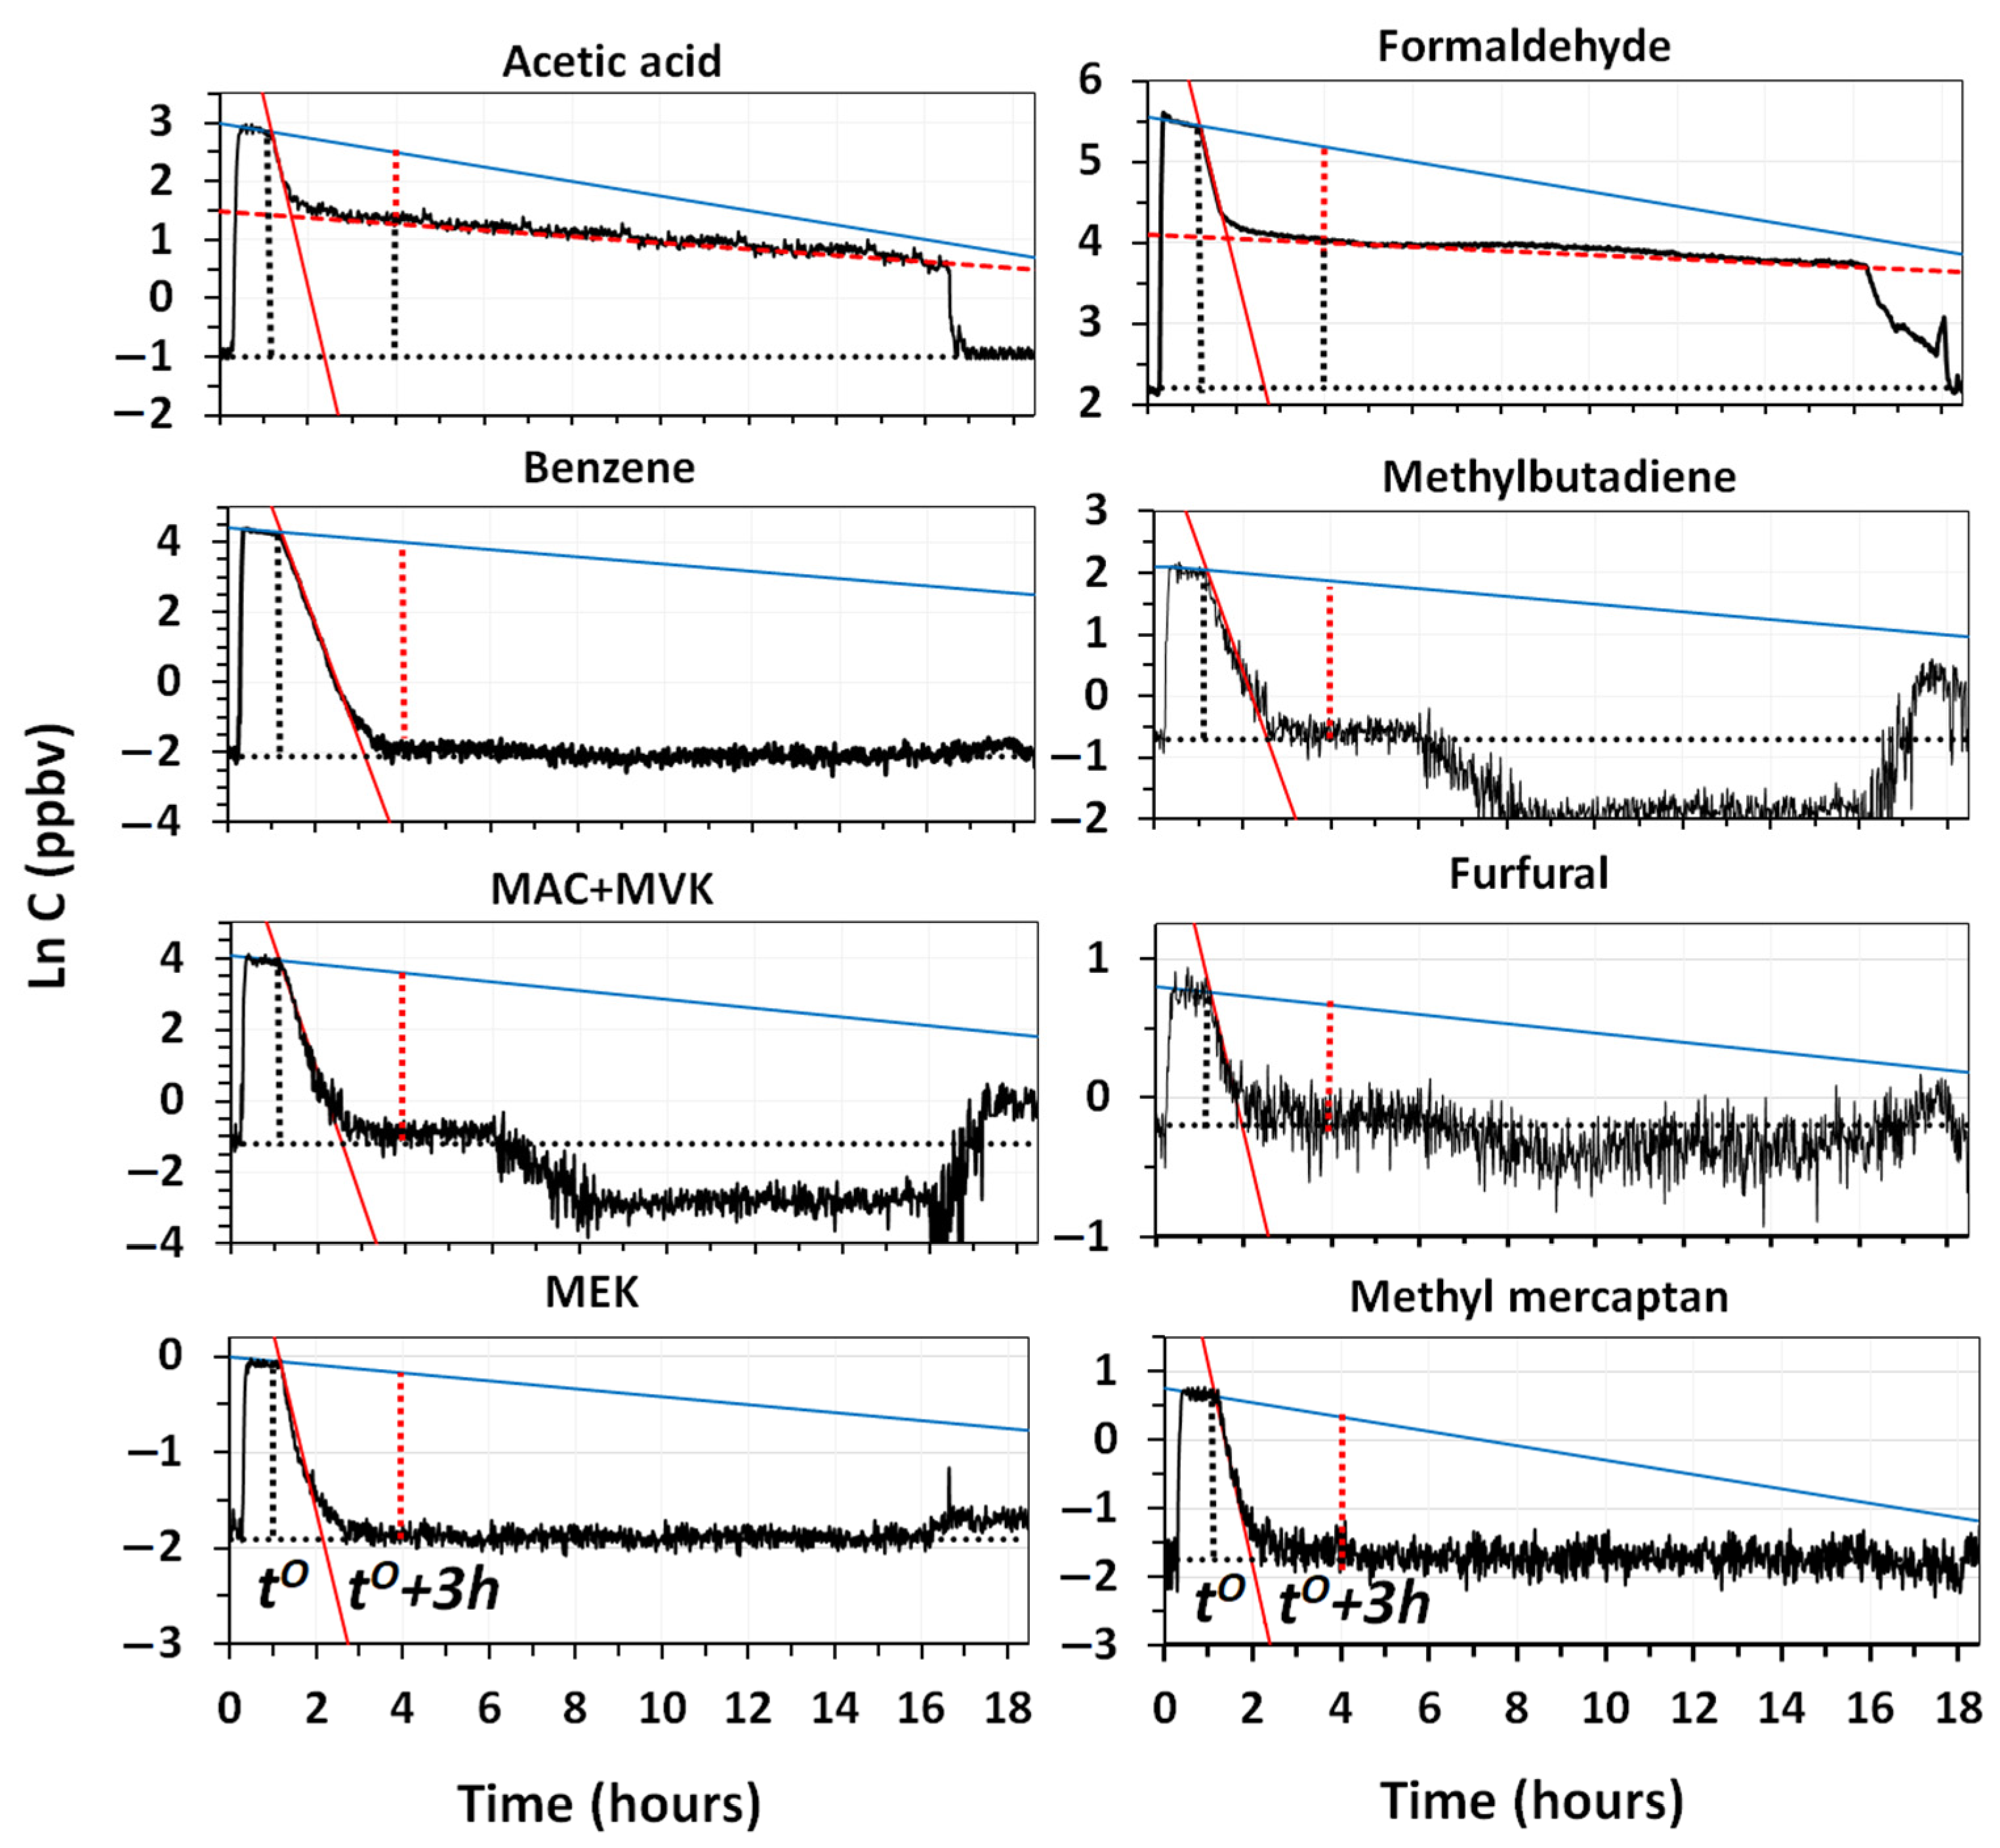
Figure 9 reports the decay trends of selected VOCs measured in the room, in a diesel experiment lasting 16 h.
As shown in
Figure 9, some compounds were only partly removed by the system after 3 h of cleaning, whereas others were already totally removed within this time interval. During the experiment, some of them reached values much lower than the outdoor ones, confirming that ventilation or penetration effects did not affect the equilibrium inside the room. Information provided by curves in
Figure 9, are complemented with those reported in
Table 4, in which the values of the intercepts and slopes of the regression lines are obtained for natural deposition/adsorption, and for the removal by cleaning are listed.
Table 4 also reports the values of the regression lines obtained using the solid-state sensor of total VOCs, together with the net fraction of each VOC removed by the system, after 3 h of cleaning.
The results show that the lowest removal efficiency was reached by methanol and acetaldehyde, whereas values higher than 60% were obtained for the other most volatile VOCs (acetone, acetonitrile, acetic acid and formaldehyde). The result for methanol was somehow expected, since it is very hard to remove by adsorption on the fiber filters, even if coated with carbon, and, similar to acetonitrile and acetone, it is poorly oxidized by ozone and OH radicals [
9]. Instead, all compounds with a molecular weight higher than methacrolein (70 g mol
−1) were completely removed from the room in less than 3 h, although some of them, such as MAC and MVK, were certainly produced by the oxidation of methyl butadiene and other reactive olefins. The higher percent removal of formaldehyde, in respect to acetaldehyde and methanol, indicated that the specific module to convert formaldehyde into CO and CO
2 worked, to some extent, especially if we consider that the high levels of this pollutant present in diesel emissions are further increased by the oxidation of methyl butadiene and of many other olefins, such as ethylene and 2–3 butadiene [
9]. The removal of benzene, toluene and xylenes + ethylbenzenes, indicated that the filtration module of the system performed quite well. The use of the same filter, for more than one year, did not show any release of these toxic compounds from it.
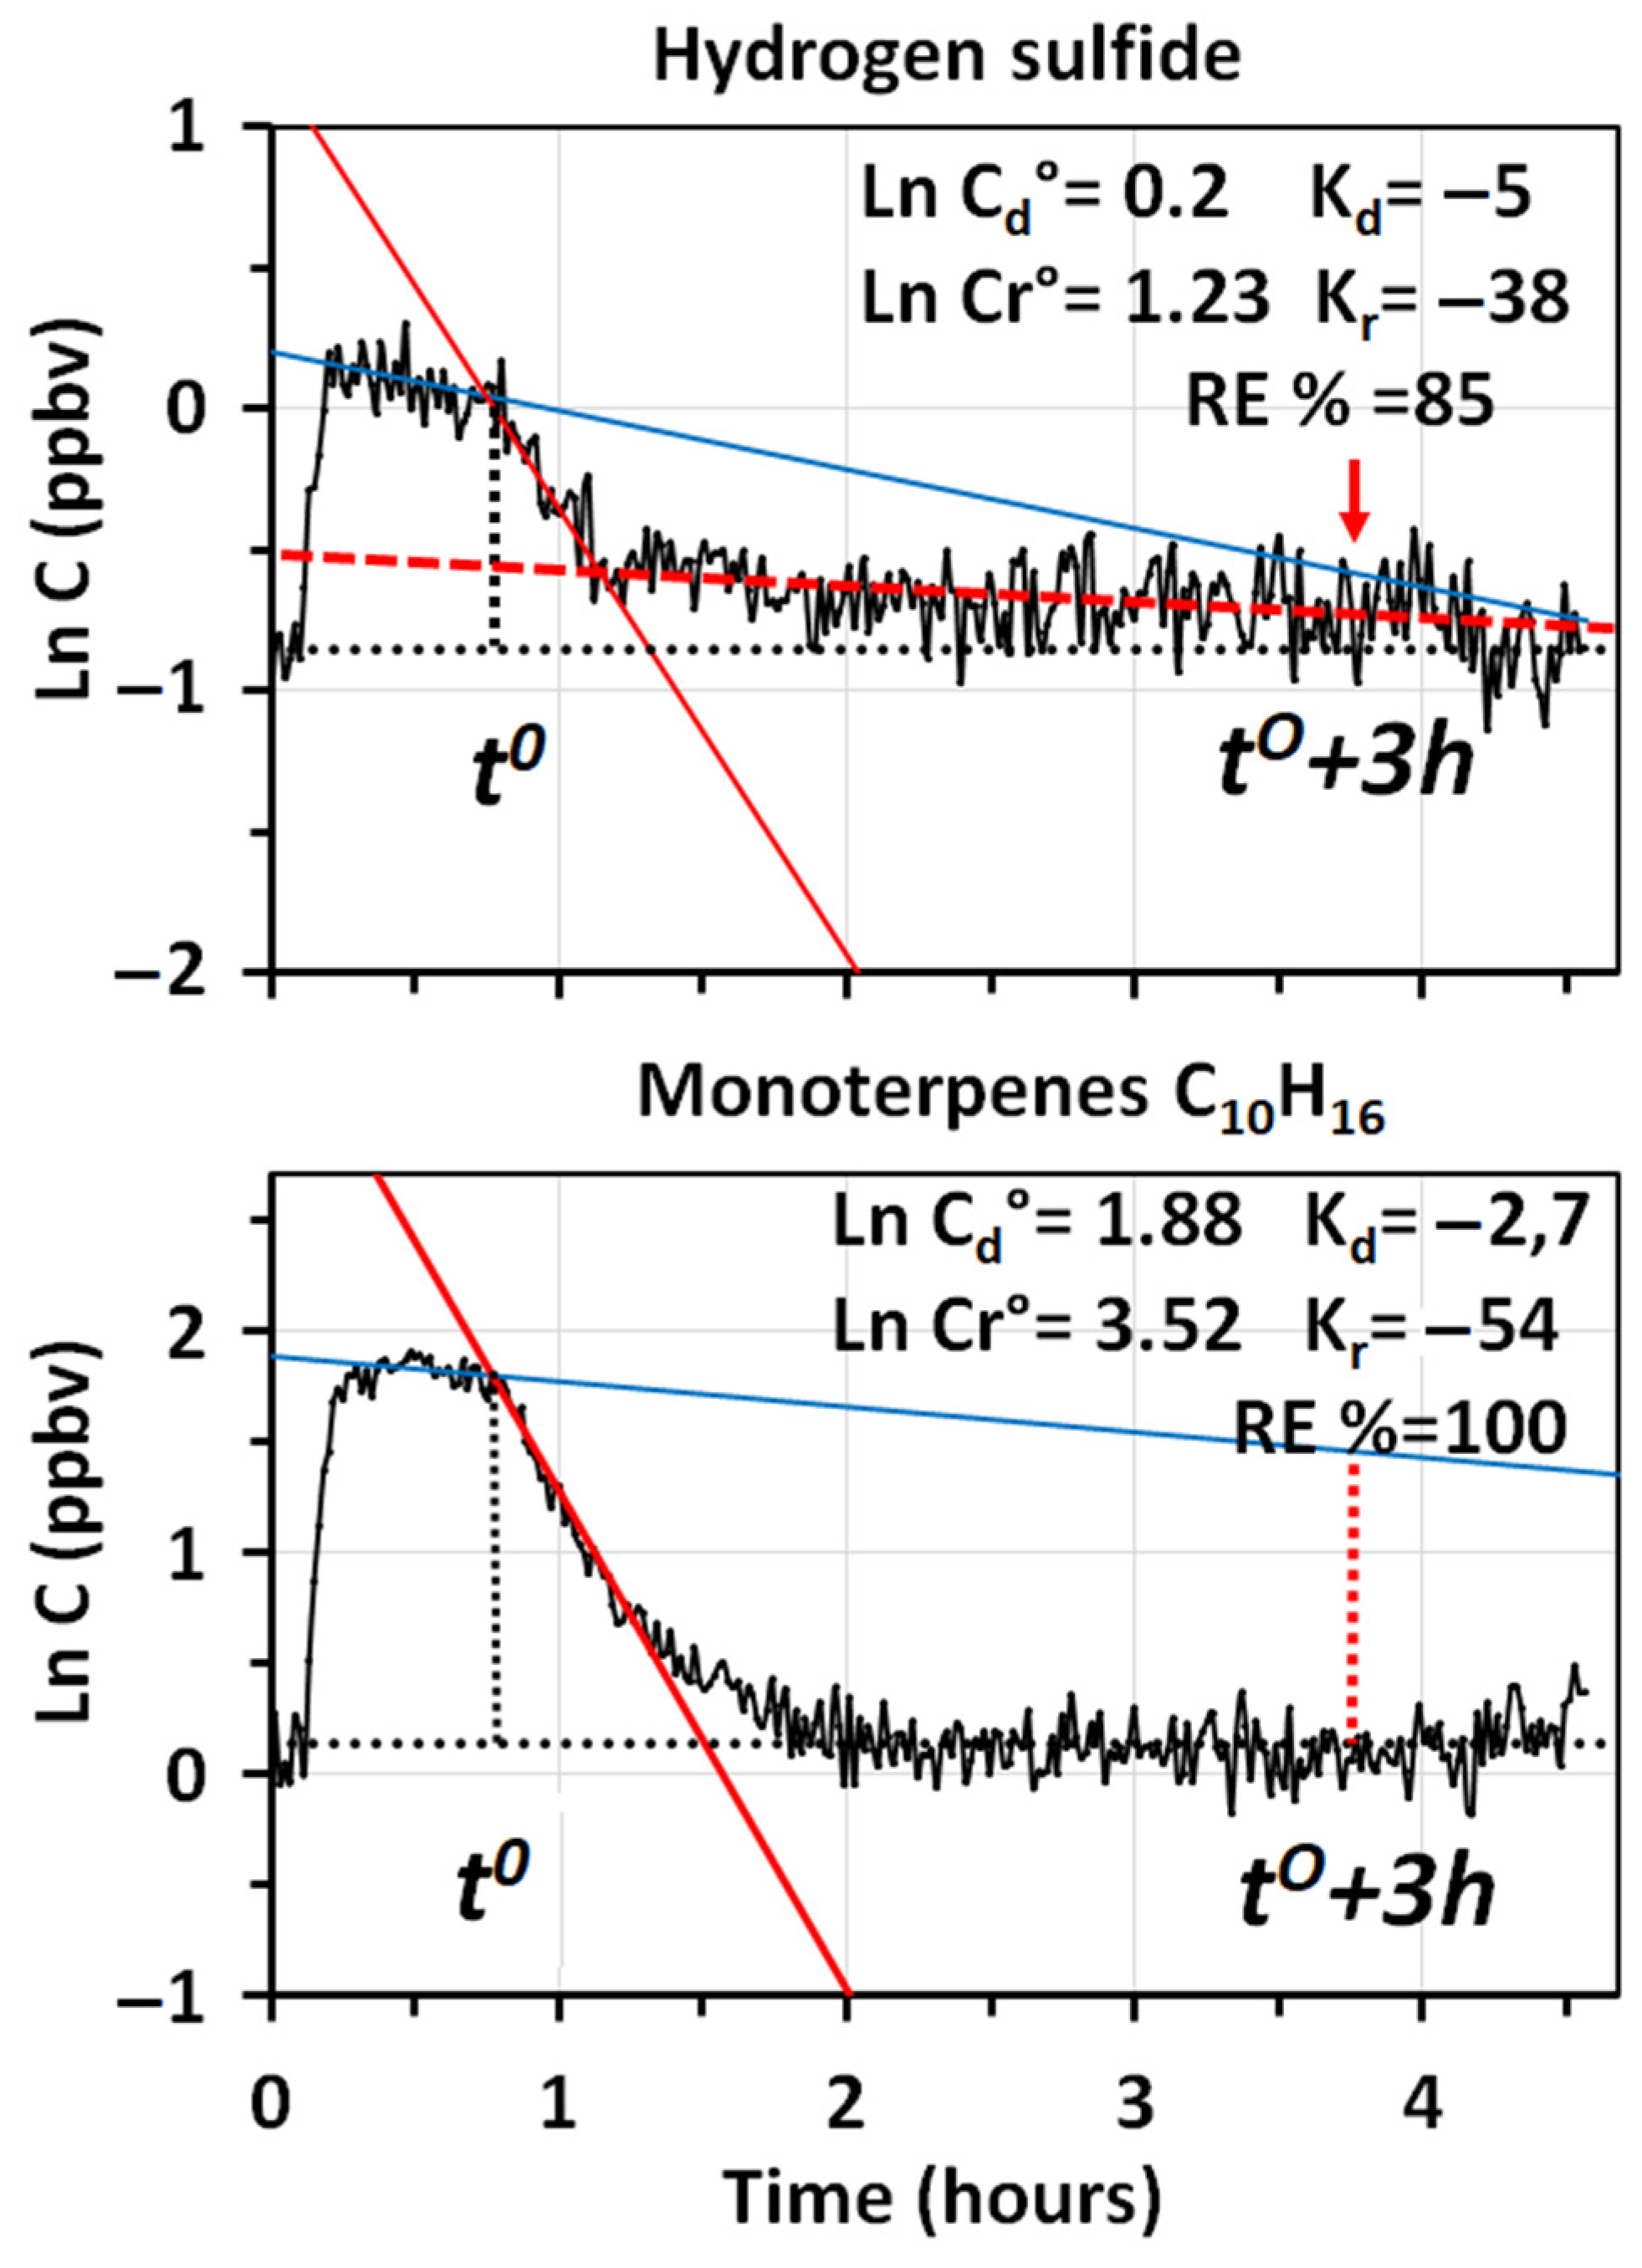
The complete removal of the most odorous compounds (furfural and methyl mercaptan) released by diesel emissions was particularly important. The high sensitivity afforded by PTR-MS, allowed us to accurately observe the removal of methyl mercaptan from the room, in spite of the very low concentrations (2.2 ppbv) present at the time,
. High sensitivity was fundamental in this case, since the odor threshold of methyl mercaptan is only 0.07 ppbv [
37]. Although a signal of H
2S was detected, it was too small to assess the net percent amount removed by the cleaner. This compound is important because its odor threshold is also rather low (0.41 ppbv) [
37].
Data in
Table 4, show that total VOC content determined with solid-state sensors was somehow consistent with that obtained by PTR-MS, and this index, together with that of PM
10 and/or PM
2.5, would have allowed us to compare the performances of the prototype system with those of the air cleaners in the market that are equipped with the same type of sensors. To obtain a more comprehensive view of the removal of VOCs, the suite of solid-state sensors should definitely include that for the monitoring of formaldehyde, as it provided results not too different to those obtained with PTR-MS, and with the electrochemical sensor we used.
Data on the removal of NO
2 and the production of O
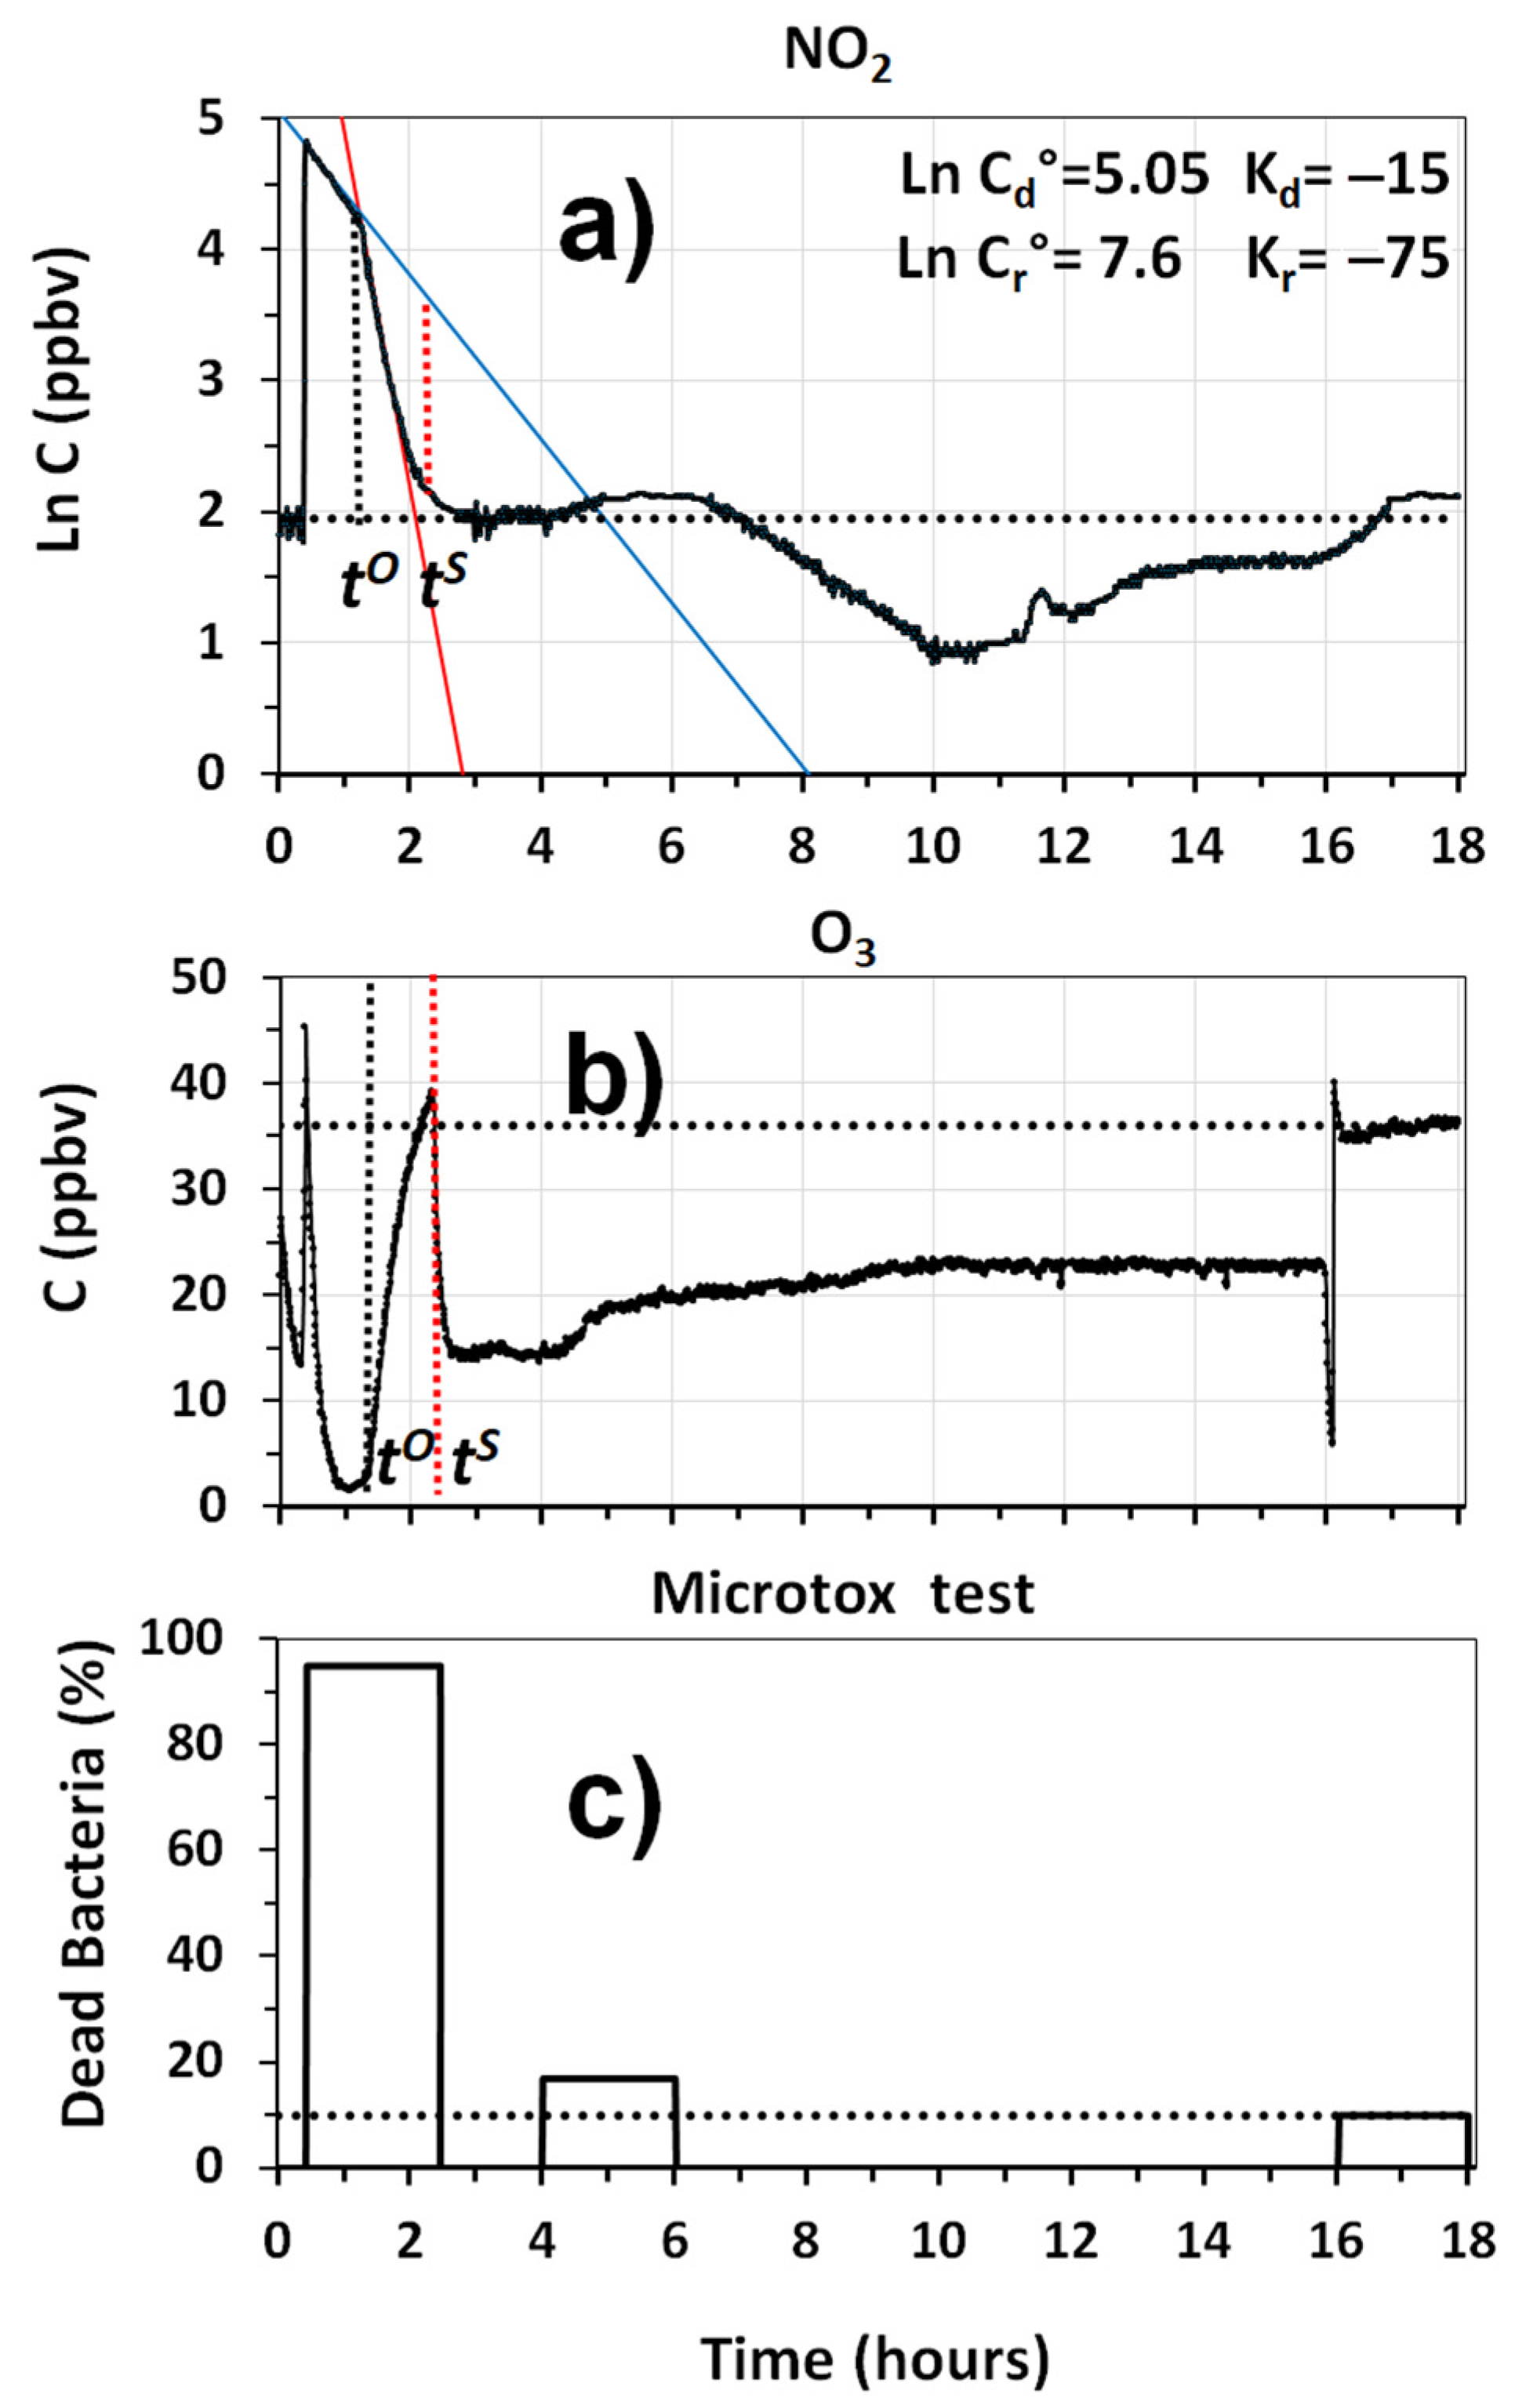
3 were also obtained in a separate experiment. Results reported in
Figure 10a, show that the system was able to rapidly remove NO
2 from the room, although a continuous production of this pollutant must have occurred by the reaction of NO with the O
3 produced by the plasma. This effect is clearly visible from the strong decay of O
3, when NOx was introduced into the chamber, as shown in
Figure 10b. Once the titration of O
3 by NO decreased, the O
3 levels in the room started to increase until a value of 35 ppbv was exceeded. At this point, indicated as
in
Figure 10b, the internal regulation of the O
3 production was automatically activated, cutting the amount of O
3 produced by the system by 50%. This avoided the exceedance of 40 ppbv of O
3 in the room, and allowed us to keep the indoor levels in the range of 20 ppbv for the rest of the experiment.
Figure 10c provides information on the capability of the prototype to remove toxic substances from the room. It reports the results of the Microtox
® tests performed on water samples collected with the GIOEL system, during different phases of the experiment. Data show that the toxicity of the sample, collected after 3.5 h from the beginning of the experiment, was much smaller than that measured during the mixing phase, because the fraction of dead bacteria was in the range of 17%, which is a value that is only 7% higher than that present in the outdoor air. This means that the cleaning system was able to remove 78 to 80% at least, of toxic substances, sensitive to this microbial test, that were present in diesel exhaust emissions. Although satisfactory, these results can be improved in what concerns the removal of some VOCs, especially formaldehyde. Further work should be conducted, to implement the performances of two of the modules present in the air cleaner.
