Article

Morphospecies Abundance of Above-Ground Invertebrates in Agricultural Systems under Glyphosate and Microplastics in South-Eastern Mexico

by
Edilberto Hernández-Gutiérrez
1,
Jaime Rendón-von Osten
2,
Griselda Escalona-Segura
3,
Jorge Mendoza-Vega
1,
Ricardo Dzul-Caamal
2,
Sita Posthumus
4,
Rianne Vastenhouw
4,
Xiaomei Yang
4,
Violette Geissen
4 and
Esperanza Huerta-Lwanga
1,4,*
1
Departamento de Agricultura, Sociedad y Ambiente, Unidad Campeche, El Colegio de la Frontera Sur (ECOSUR), Campeche 24500, Mexico
2
Instituto de Ecología, Pesquerías y Oceanografía del Golfo de México (EPOMEX), Universidad Autónoma de Campeche, Campeche 24070, Mexico
3
Departamento de Conservación de la Biodiversidad, Unidad Campeche, El Colegio de la Frontera Sur (ECOSUR), Campeche 24500, Mexico
4
Department of Soil Physics and Land Management Degradation, Wageningen University & Research, 6708 PB Wageningen, The Netherlands
*
Author to whom correspondence should be addressed.
Environments 2021, 8(11), 130; https://doi.org/10.3390/environments8110130
Submission received: 15 October 2021 / Revised: 13 November 2021 / Accepted: 15 November 2021 / Published: 20 November 2021
(This article belongs to the Special Issue Plastic Contamination: Challenges and Solutions)

Abstract

:
Soil invertebrates are important for diverse soil ecosystem services, which are jeopardized by pesticides and microplastics. In the present study, we aimed to assess above-ground invertebrates’ morphospecies abundance in the presence of glyphosate (GLY), its main metabolite aminomethylphosphonic acid (AMPA), and microplastics (MPs). Three land-use systems were analyzed: agricultural systems with and without plastic mulch and pesticides (AwPM, AwoPM) and natural unmanaged farming systems (UF). Soil GLY, AMPA, MP concentrations and above-ground invertebrates were quantified. GLY concentrations were also assessed inside invertebrate tissues. GLY, AMPA and the highest concentration of GLY in invertebrates’ tissue were found only in AwoPM at 0.14–0.45 mg kg−1, 0.12–0.94 mg kg−1 and 0.03–0.26 mg kg−1, respectively. MPs were present as follows: AwPM system (100%, 400–2000 particles kg−1) > AwoPM (70.8%, 200–1000 particles kg−1) > UF (37.5%, 200–400 particles kg−1). No significant correlations were found between soil MPs, GLY and AMPA. There was a significant correlation between MPs and morphospecies from the order Entomobrymorpha (Collembola, R = 0.61, p < 0.05). Limnophila, Mesogastropoda (Gastropoda) and Siphonaptera morphospecies were only present in the UF system. GLY in invertebrate tissue was inversely correlated with soil GLY (R = −0.73, p < 0.05) and AMPA (R = −0.59, p < 0.05). Further investigations are required to understand these phenomena.

Graphical Abstract

1. Introduction

Soil diversity is considered to be the key to soil resilience, fulfilling functions and providing services such as biomass generation; biochemical cycling; the regulation of water movement, climate and pollution; biological regulation (pests and diseases); the maintenance and development of soil structure; as well as the detoxification of xenobiotics and pollutants [1].
Above-ground invertebrates are essential in agricultural areas because of their role in maintaining both nutrient cycling and the physico-chemical properties of the soil [2,3]. They are in danger when emergent pollutants such as glyphosate (GLY) and microplastics (MPs) are present in the soil. Recent studies have demonstrated how these pollutants affect soil invertebrate communities, especially in agricultural areas [4,5,6,7].
GLY has been the most commonly used herbicide in agriculture worldwide since the 1970s [2,8], with an annual use between 600–750 million tons, which is expected to increase to 740–920 million tons by 2025 [8]. Globally, the pesticide consumption in 2018 was 5,896,023 tons of pesticides [9]. In the same year, Mexico consumed 53,144 tons of pesticides [9]. Among global pesticide consumption in 2020, 918 tons of GLY were imported for the period from January to July in Mexico [10]. GLY application rates in agricultural areas from USA have been reported up to 6.6 kg ha−1 in maize, 3.9 kg ha−1 in broad beans, 0.7 kg ha−1 in wheat and 0.4 kg ha−1 in cotton [8]. Recently, in European farmland soils a median soil GLY concentration of 9.6 µg kg−1 has been reported, and a maximum of 2 mg kg−1 of soil GLY in USA [11,12]. AMPA has been found in concentrations between 0.05–1.92 mg kg−1 in those European farmland soils [12].
Plastic mulch implementation in agricultural lands is an increasingly common practice [13], in which the collection of mulch does not take place at the end of its useful life (mainly due to difficulties in the collection process [14]), and MPs are generated [15]. Even though there are several classifications, MPs are defined mainly as particles of <5 mm in size [6,16]. They result from the abrasion and fragmentation of large plastic pieces [15,17], or are manufactured in small sizes. They enter agricultural soils directly through plastic-coated fertilizers, as well as plastic mulch fragments and other implements used in plasticulture, and indirectly through compost, sewage sludge, wastewater irrigation and atmospheric deposition [6,18,19,20,21]. China is the country with the highest number of investigations on MPs in the terrestrial environment. Research has revealed severe MP contamination with counts between 6.75–78 particles kg−1 of soil in the first 3 cm in Shanghai suburbs; 7100–42,960 particles kg−1 of soil in the first 10 cm near Dian Lake and a maximum of 381 kg ha−1 in the Xinjiang region, with these levels increasing in recent years [22,23].
The increasing and ubiquitous presence of these emergent pollutants is a hazardous combination for non-target organisms such as above-ground soil invertebrates [19,24,25]. Several studies have reported the effects of GLY on soil invertebrates [24,25,26,27,28], but there is a special concern with its main by-product, aminomethylphosphonic acid (AMPA) [2,8], because it is four times more soluble (50 g L−1) and is more persistent and toxic than GLY [29,30]. Furthermore, GLY and AMPA have been observed to accumulate mainly in the first centimeter of the soil [5,31]. Likewise, agricultural lands are considered to be a major sink for MPs [32]. However, few studies have addressed the presence of MPs on agricultural and non-agricultural lands [6,21]. Thus, exposure to the continuous migration of pesticides such as GLY into the soil matrix [15] and the gradual accumulation of MPs over time [23] puts above-ground-dwelling invertebrates at risk.
To date, no field studies have assessed the abundance and composition of soil invertebrates on agricultural lands with GLY and MPs. Moreover, there are no studies indicating whether there is more GLY occurring in above-ground-dwelling invertebrate tissue in the presence of both pollutants. Therefore, the main objectives were: (1) to determine GLY and MP concentrations in soils under conditions of plastic mulch and glyphosate use, (2) to analyze whether the presence of soil MPs is associated with the incidence of GLY in invertebrate tissues, and (3) to assess the abundance of above-ground-dwelling invertebrates in agricultural systems with the presence of GLY and MPs.

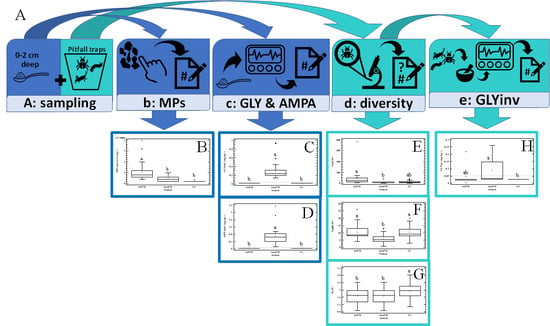
2. Materials and Methods

2.1. Study Area and Plot Selection

The present study was conducted in Alfredo V. Bonfil, Campeche, south-east Mexico (Figure 1), located within the eco-region of the Yucatan central plain, in a tropical semideciduous forest [33], growing over Luvisol and Phaeozem soils [34]. The weather is warm sub-humid, with rainfall in summer, Aw1 according to the Köppen classification modified by García [35], and the mean temperature varies between 24.1 °C–25.9 °C, with an annual precipitation between 1162–1184 mm and total evaporation between 1184–1896 mm [36,37]. The implementation of plastic mulch in this area was introduced in 2009, according to interviews conducted in March 2019. In this study area, the surveyed plots were chosen with similar slope conditions and clay percentages (Table 1, Figure S1).

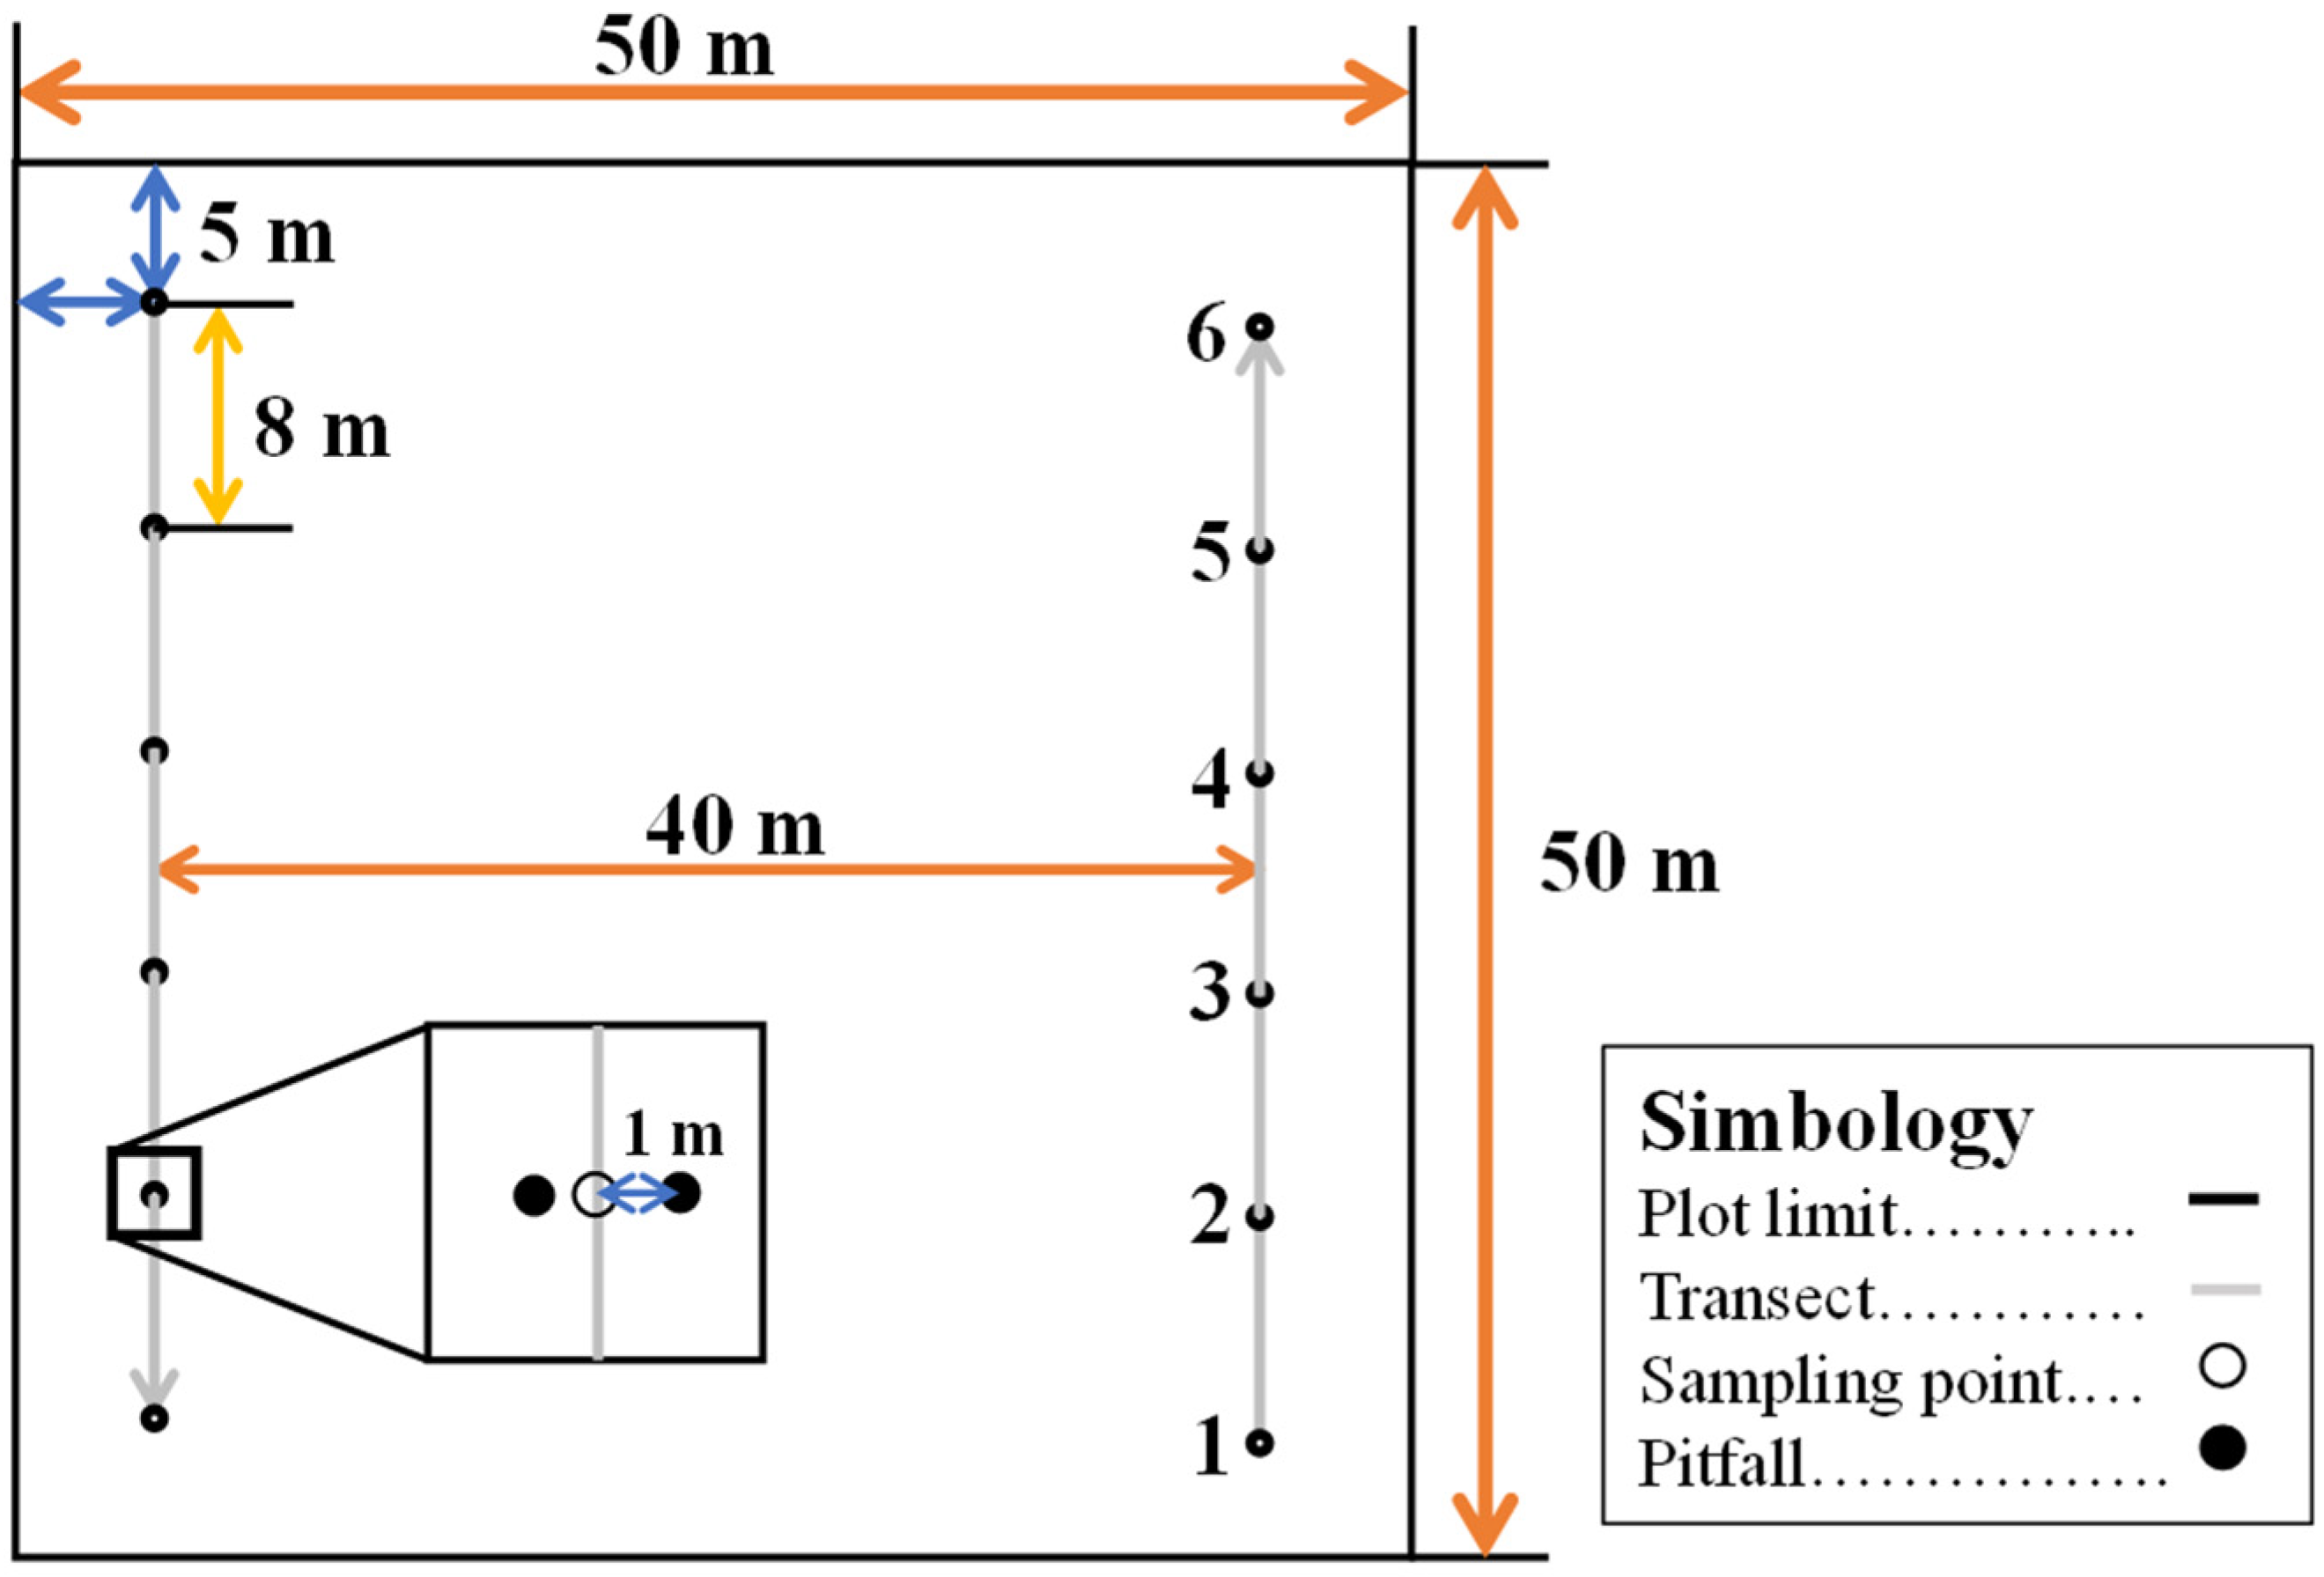
2.2. Experimental Design

Following the OECD field plot design protocol ([38], p. 22), three systems were evaluated: (1) an agricultural system with plastic mulch (AwPM) and glyphosate use, which implies the use of plastic mulch for the main crop in the last three years; (2) an agricultural system without plastic mulch (AwoPM) and the use of GLY; in this system, non-plastic mulch was used in the last 10 years; and (3) an unmanaged farming system (UF) with vegetation that has not been under farming management for at least 20 years (Table 1). Two 50 m × 50 m plots were established in each system, two 40 m transects were installed in each plot and six sampling points were taken in each transect with 8 m of distance between the sampling points. In order to avoid the edge effect, transects were placed 5 m from the field border (Figure 2). Twenty-four samples were collected per system; thus, a total of 72 samples were taken.

2.3. Sample Collection

Soil and invertebrates were collected during the dry season (April) of 2019. According to the standard operating procedure for soil sampling from the Environmental Protection Agency [39] (pp. 2, 10, 11), sampling for “near-surface soil can be accomplished with tools such as spoons” in soft soils, as in the case of our area of study. At each sampling point, 200 g of soil was taken from the first two centimeters with a stainless-steel spoon, being careful to clean the spoon with a clean rag for each new sampling. Samples were stored in polyethylene bags, transported in a cooler, and then kept frozen at −3 °C until analysis in El Colegio de la Frontera Sur.
Before extracting microplastics (MPs) and performing glyphosate (GLY) assessments, soil samples were dried at room temperature for 24 h. Macroplastics were removed manually. A homogenized sample was obtained by spreading out the sample in a flat round polyethylene plastic container, divided into eight parts, then a subsample of 2.5 g was spooned out from each part to make up 20 g, and determine the microplastic counts. Afterwards, the rest of the soil sample was sieved at 2 mm, homogenized, and then weighed at 10 g to determine the concentration of GLY and AMPA. All samples had excess material available for duplicates or eventual loss. They were stored in paper bags and kept frozen at −3 °C until analysis.
Invertebrates were captured using the pitfall trap method [40]. An open pitfall trap design [40] was used, but without bait because particular taxa were not sought [41]. For these traps, two 250 cm3 transparent polypropylene cups were buried with the rim flush with the ground. They contained ~30 cm3 of pure glycerin (to avoid water that could affect the determination of glyphosate in the invertebrate tissue), although Cheli and Corley [42] have highlighted that glycerin could reduce the number of arthropods captured because of its higher density than water. This may lead to an underestimation of morphospecies abundance, richness, and diversity.
These traps were placed perpendicular to the transect ~1 m from the soil sampling point (Figure 2). Both cups were left for 48 h to adjust the logistic time for all sampling points, and because we observed that one day was not enough to collect above-ground invertebrates, which showed greater nocturnal activity due to the temperatures that were reached during the day. This sampling time was enough to capture invertebrates and avoid damaging the specimens during a long sampling time [42]. Samples were stored in polyethylene bags and transported in a cool box. They were placed in a freezer, where they were kept at −3 °C until analysis.
Above-ground dwellers from each sampling point were classified by morphospecies [43,44] and included in their respective order. Once the order to which each morphospecies belonged was identified, they were each assigned a different number to differentiate them and a key was generated for each one. Each organism was observed through a Stemi 305 stereoscope, and photographs from a smartphone were taken to generate a catalogue with its respective key. Finally, the organisms were counted according to the key assigned to each morphospecies. During this process, prolonged exposure to light and heat was carefully avoided. They were kept in a cooling box until they were identified. For the analysis of GLY in the invertebrate tissue, composite samples were made by joining the samples from points 1–3 and 4–6 from each transect that were duplicated across two plots, so that eight composite samples were obtained for each system.

2.4. Soil Glyphosate and AMPA Analysis

For the determination of soil glyphosate and AMPA levels, the method proposed by Yang et al. [45] was used. All 72 samples were prepared in duplicate, and from each one 2 g of soil were obtained. Each soil sample was put in a 50 cm3 tube, where 10 cm3 of 0.6 M KOH was added. After mechanical shaking (1 h) and centrifuging (15 min at 3500 rpm), 1 cm3 of supernatant was transferred to a plastic tube of 10 cm3 in size, and 80 μL of 6 M HCl was added to adjust the pH value before derivatization. A standard curve was prepared by putting 1 cm3 of eight different standards of glyphosate/AMPA concentrations ranging from 0.02 to 4 μg cm−3 in a plastic tube (10 cm3), and a 0 μg cm−3 standard was made by adding 1 cm3 of Millipore water instead of the standard glyphosate/AMPA concentrations, to act as a control.
For the derivatization step, 20 μL of isotope-labelled glyphosate/AMPA solution (5 μg cm−3) was added to all the tubes, together with 0.5 cm3 of 5% borate buffer and 0.5 cm3 of 6.5 mM FMOC-Cl (9-fluorenylmethoxycarbonyl chloride). Tubes were vortexed and incubated for 30 min at room temperature. Then, 50 μL of formic acid was added to stop the reaction. All samples were vortexed again, and 0.5 cm3 was transferred to plastic LC vials, and 0.45-μm PFTE filters were integrated for filtration. One vial was filled with Millipore water to act as a control. Glyphosate and AMPA concentrations were determined by means of liquid chromatography–tandem mass spectrometry (LC-MS/MS) using an XBridge™ Shield RP C18 column (3.5 μm particle size, 150 mm × 2.1 mm i.d.) (Waters, Etten-Leur, The Netherlands). Mobile phase A consisted of 2.5 cm3 (1 M NH4Ac) + 497.5 cm3 Millipore water + 200 μL (25% NH3·H2O). Mobile phase B consisted of 2.5 cm3 (1 M NH4Ac) + 47.5 Millipore water + 450 cm3 MeOH +200 μL (25% NH3·H2O).
The quantification of glyphosate/AMPA levels was carried out using the software programs ‘MassLynx’ and ‘QuanLynx’ (Waters, The Netherlands). Limits of detection (LODs) for GLY and AMPA were 0.03 and 0.039 mg kg−1, respectively, according to the laboratory’s standards [45]. Calculations were made with a limit of quantification (LoQ) of <0.05 mg kg−1. Results were expressed in mg kg−1.

2.5. Glyphosate Analysis in Above-Ground Dwellers’ Tissue

For the determination of GLY in invertebrate tissue, the procedure used for vertebrate tissue in previous investigations was used [46,47]. Composite samples were formed for this analysis, because some sampling points did not have enough material for GLY analysis in tissue. Organisms were taken from the corresponding sampling points until the amount of material required was completed (200 mg). The orders Orthoptera, Araneae and Dermaptera contributed the most material to these samples due to size, whereas Hymenoptera (Formicidae) contributed the most due to abundance.
Once the required material was obtained from the invertebrate mixture, the extraction methodology followed was that proposed by Douros et al. [47]. This material was crushed in Eppendorf tubes with a glass stirring bar, but based on Krüger et al. [46], the use of 7 cm3 of methanol was changed for 5 cm3 of ultrapure water of HPLC grade to determine GLY in tissue. GLY quantification was performed following the protocol of the Abraxis LLC kit (Warminster, PA, USA). The LOD of glyphosate in water was 0.05 μg L−1 and a quantification limit of 0.13 μg L−1, a maximum detectable concentration of 4 μg L−1, and a mean recovery rate of 102%. A two-concentration calibration curve with a blank (0.00, 0.02, 1 μg L−1) was used for quantification. Results were expressed in mg kg−1.

2.6. Soil Microplastic Quantification

The method proposed by Zhang et al. [48] was used to determine the concentration of microplastics (MPs) in the soil. This method was selected because low-density polyethylene (LDPE) was the plastic mulch used in the AwPM system and was the main plastic source for those plots. This methodology was developed to quantify low-density MPs (<1 g cm−3) such as polyethylene and polypropylene. However, in practice, this methodology is very time-consuming during the extraction of LDPE-MPs from the soil through flotation. Later studies should consider whether this methodology is adapted to their needs, both in terms of the plastic type and the time available for its extraction.
Soil samples were prepared beforehand to extract MPs. Large (>1 cm) particles of organic matter (OM) were taken out of each sample with tweezers to detect MPs correctly under a microscope. A sample of 5 g was obtained from each sample by duplicating. The floatation technique was applied for MP extraction [48]. Each sample was put into a glass beaker, 50 cm3 of distilled water was added and mixed with a glass stirring bar and was then covered with a cardboard to prevent contamination. Floating material was collected several times according to this methodology in a labelled filter (<50 µm pore size) until no flotation was visible anymore. Filters were dried at 40 °C for 48 h.
After the extraction of MPs, the material collected in the filters was brushed off and collected on a glass microscope plate. Several plates were used if a high OM was visible, to spread out and minimize plastic particles that were covered by OM particles. Each glass plate was photographed, then heated for 8–10 s at 120 °C–130 °C on a hot plate and then carefully moved back to the microscope for a second picture. All pictures were taken with ImageFocus Alpha software at a resolution of 4912 × 3684 pixels by using a ZEISS Stemi 508 microscope with a 6.4× lens connected to a computer. These pictures were compared for signs of melted particles to identify plastic particles and count them. This count has been multiplied by 200 to express it in particles kg−1.

2.7. Statistical Analysis

The Shapiro–Wilk test was applied to validate the normality of the data. The variables that did not comply with the normality of variance were transformed by means of a square root or natural logarithm. If they did not comply with the normality of variance, Kruskall–Walis analysis was performed to identify significant differences and Spearman correlations. A post hoc Mann–Whitney U-Test was then applied with STATGRAPHICS Centurion XVI and R version 4.0.2, respectively. A Spearman correlation analysis of GLY and AMPA concentrations in the soil, and GLY in invertebrate tissue with MP counts, as well as invertebrate variables, was performed on the STATGRAPHICS Centurion XVI program version 16.1.02 (32-bits). The number of individuals and morphospecies was determined and the Shannon index (H) for diversity was calculated for each sampling point with PAST version 2.17c.

3. Results

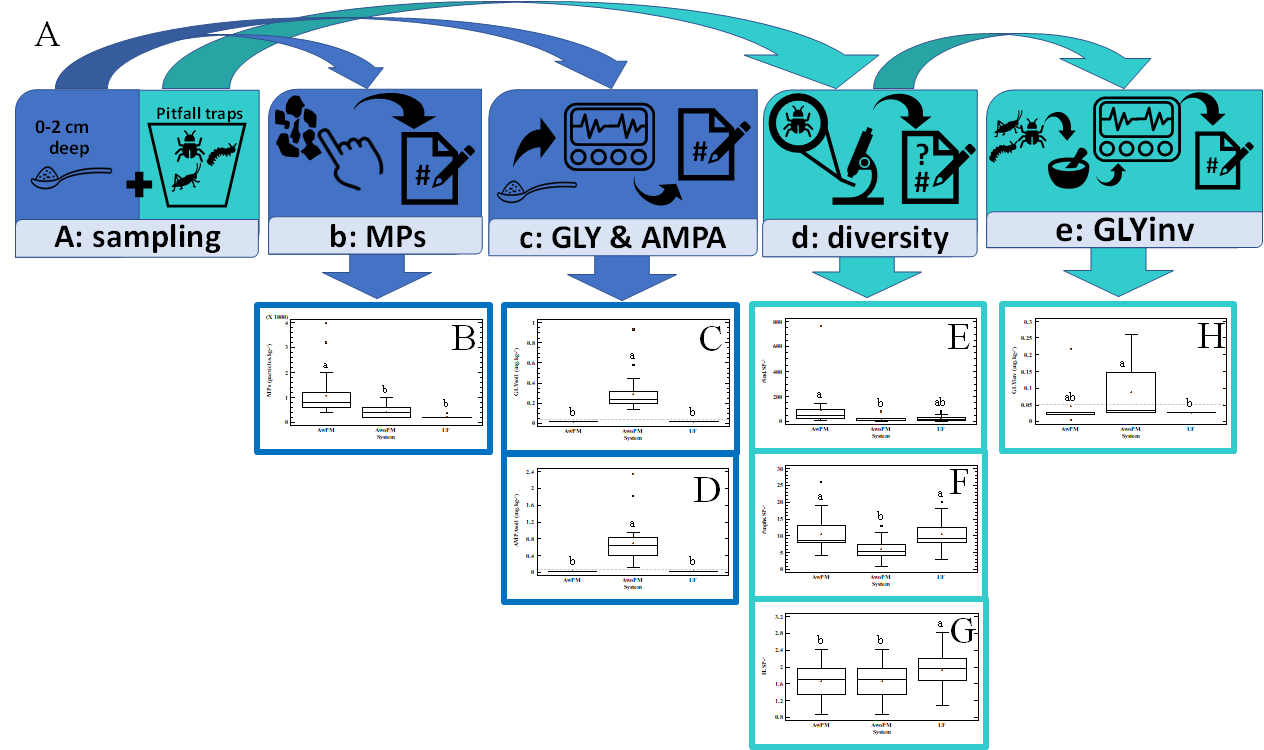
3.1. Glyphosate and AMPA in Soils

Soil GLY and AMPA concentrations were above the limit of detection in all samples from the AwoPM system, with a median of 0.23 (0.14–0.45) mg kg−1 and 0.64 (0.12–0.94) mg kg−1, respectively (Figure 3). In the AwPM and UF systems, soil GLY and AMPA concentrations were under the limit of detection.

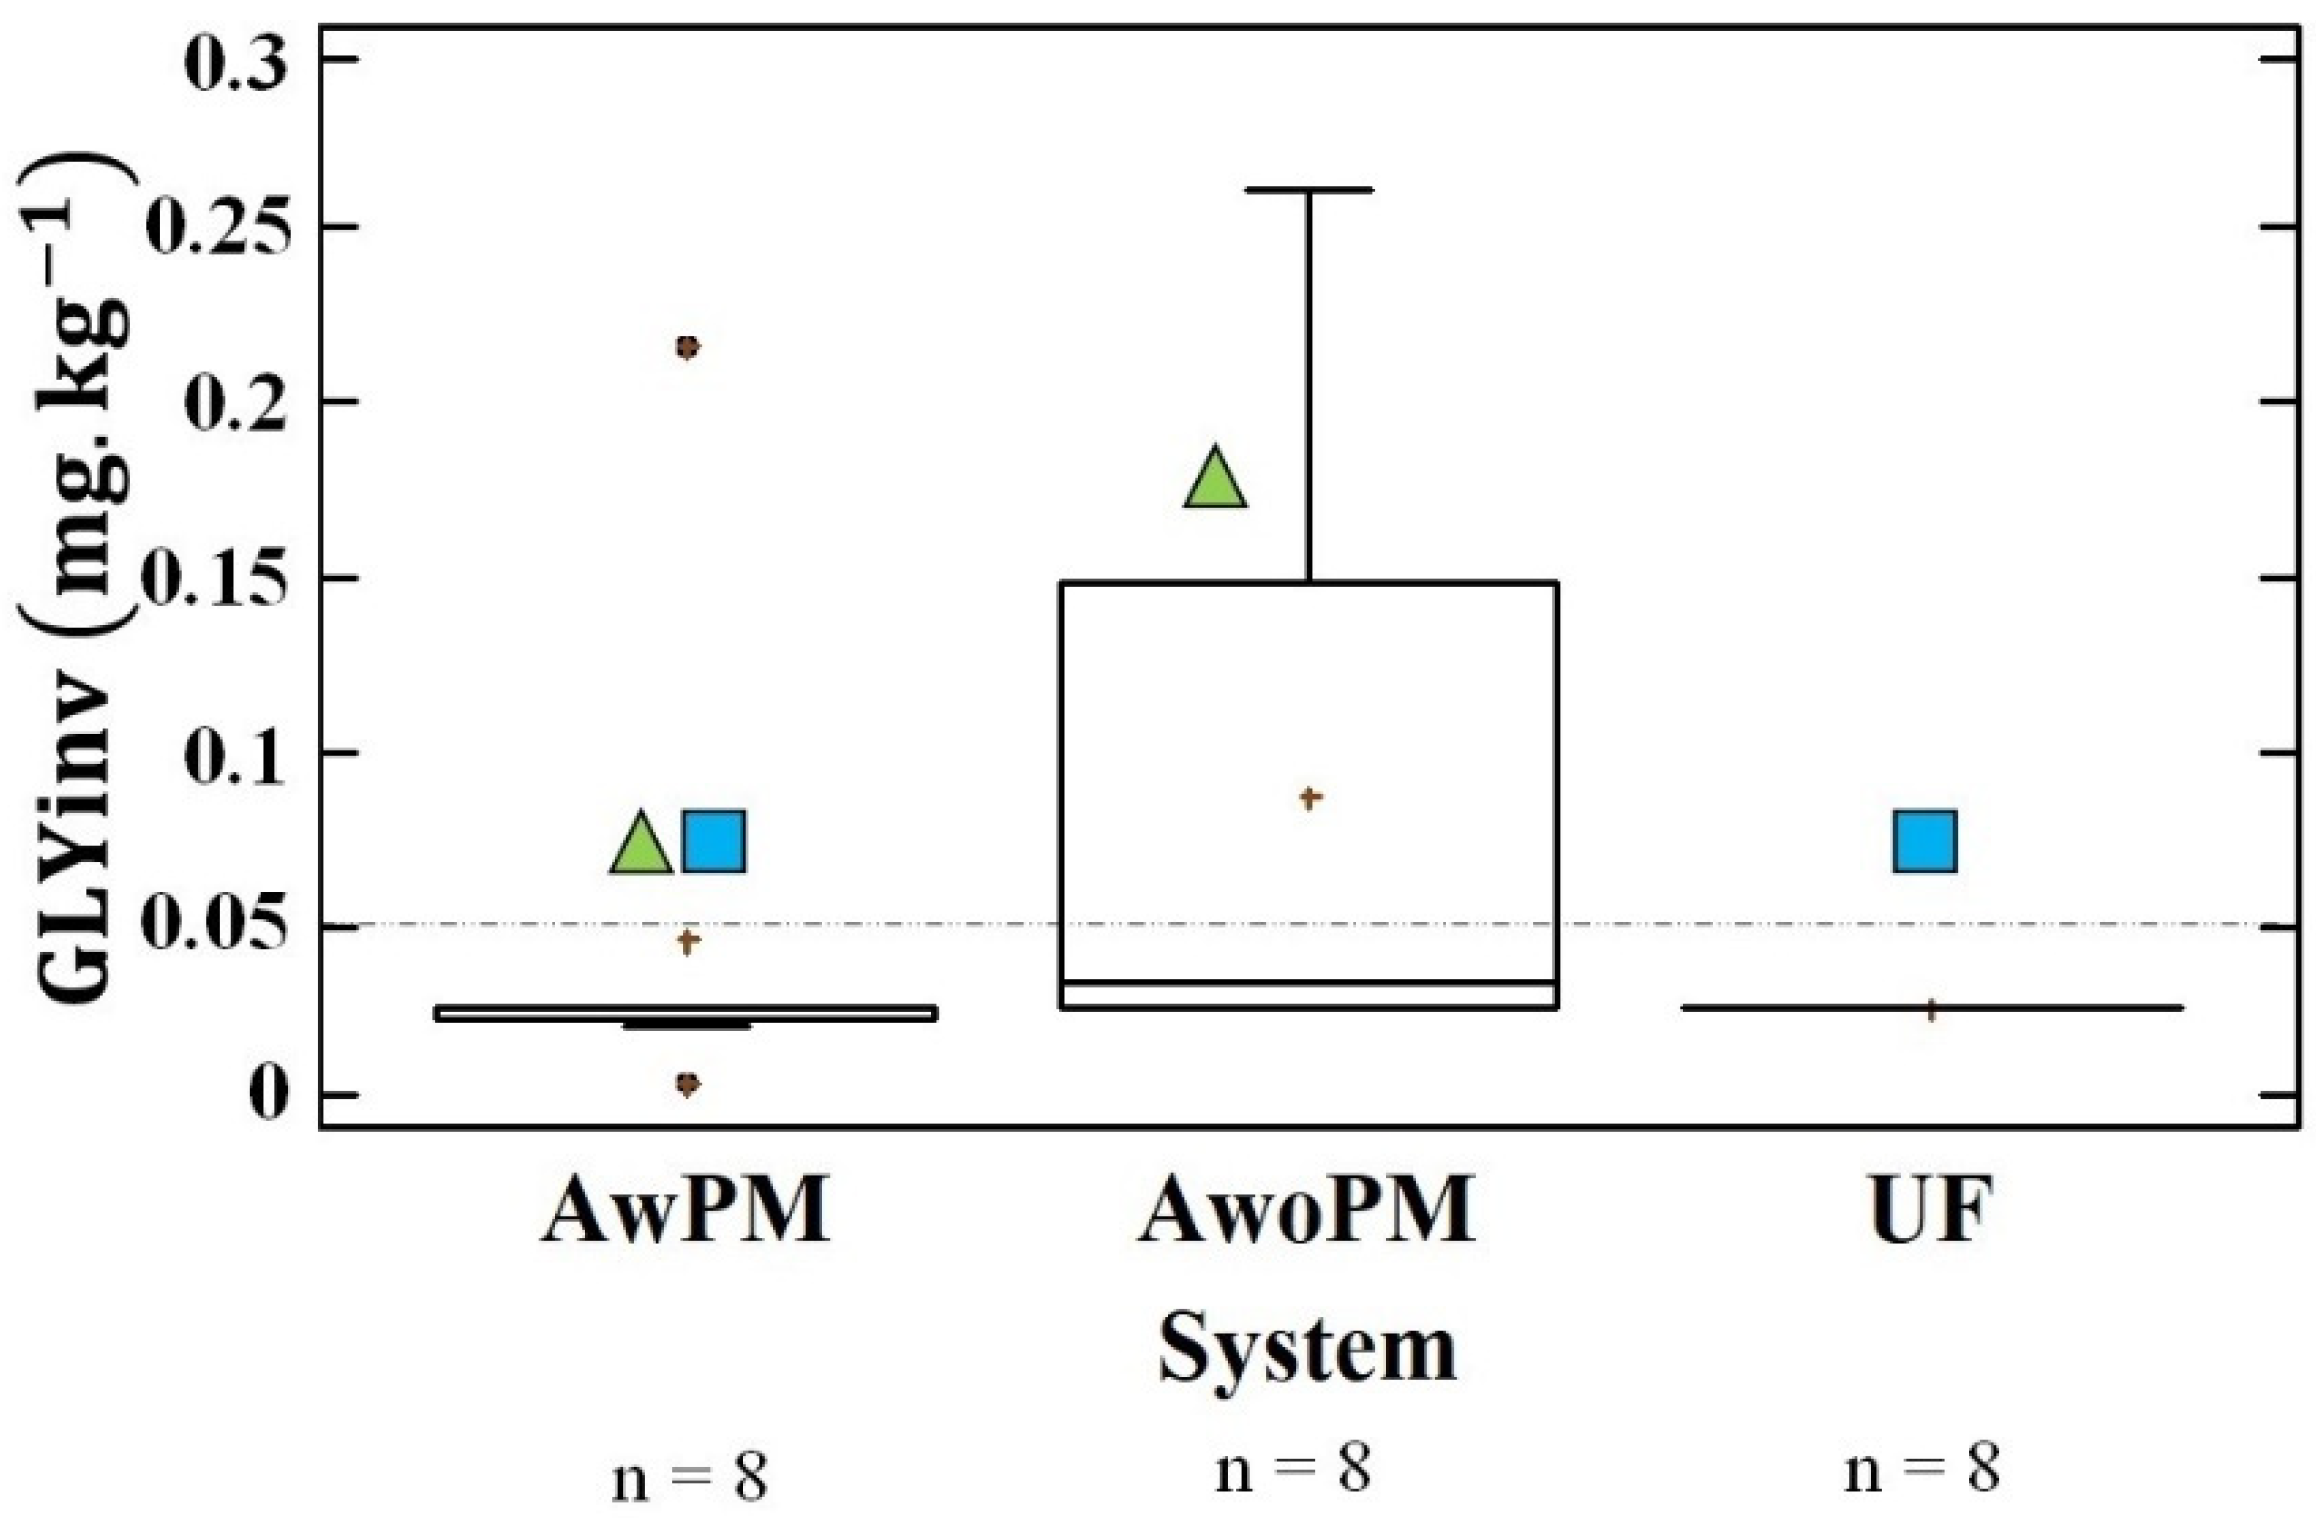
3.2. Glyphosate in Above-Ground Dwellers’ Tissue

Invertebrate tissue GLY concentrations were found in 62.5% of the composite samples in the AwoPM system with a median of 0.03 (0.03–0.26) mg kg−1, whereas they were found in 37.5% of the composite samples from the AwPM system with a median of 0.03 (<5 × 10⁻³–0.22) mg kg−1. No soil GLY concentrations were detected in the samples of the UF system (Figure 4). A negative correlation between invertebrate-tissue GLY concentration with soil GLY and AMPA (R = −0.73, p < 0.05, R = −0.59, p < 0.05, respectively) was found (Table S1). The concentration of GLY found in invertebrate tissue in the AwoPM system represents 14% of the concentration of GLY found in the soil of the same system.

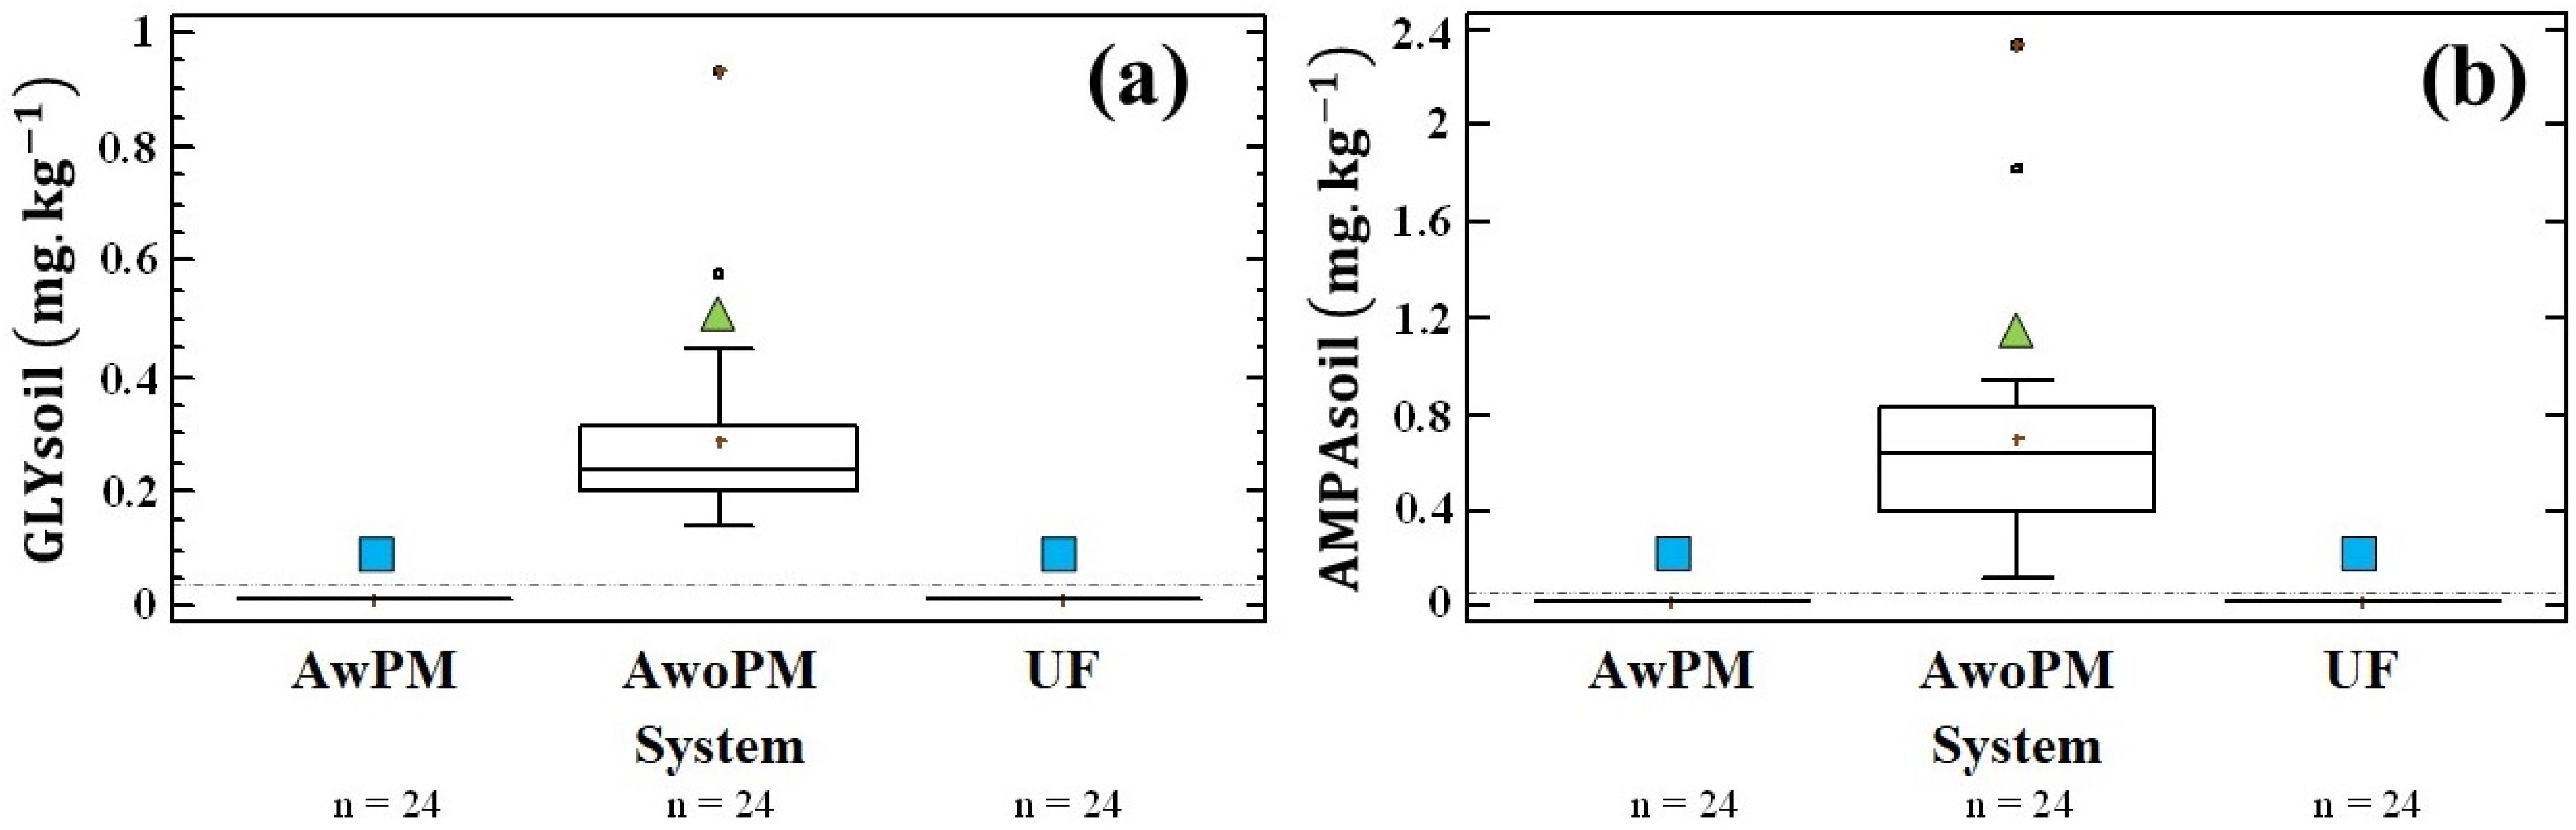
3.3. Microplastics in Soil

The highest soil microplastic (MP) counts were found in the AwPM system, with a mean of 1075 (400–2000) particles kg−1 of soil present in all samples, followed by the AwoPM system which had a mean of 411.8 (200–1000) particles kg−1 of soil in 70.8% of the samples. However, the UF system had the lowest MPs counts in 37.5% of the samples, with a mean of 222.2 (200–400) particles kg−1 of soil (Figure 5).

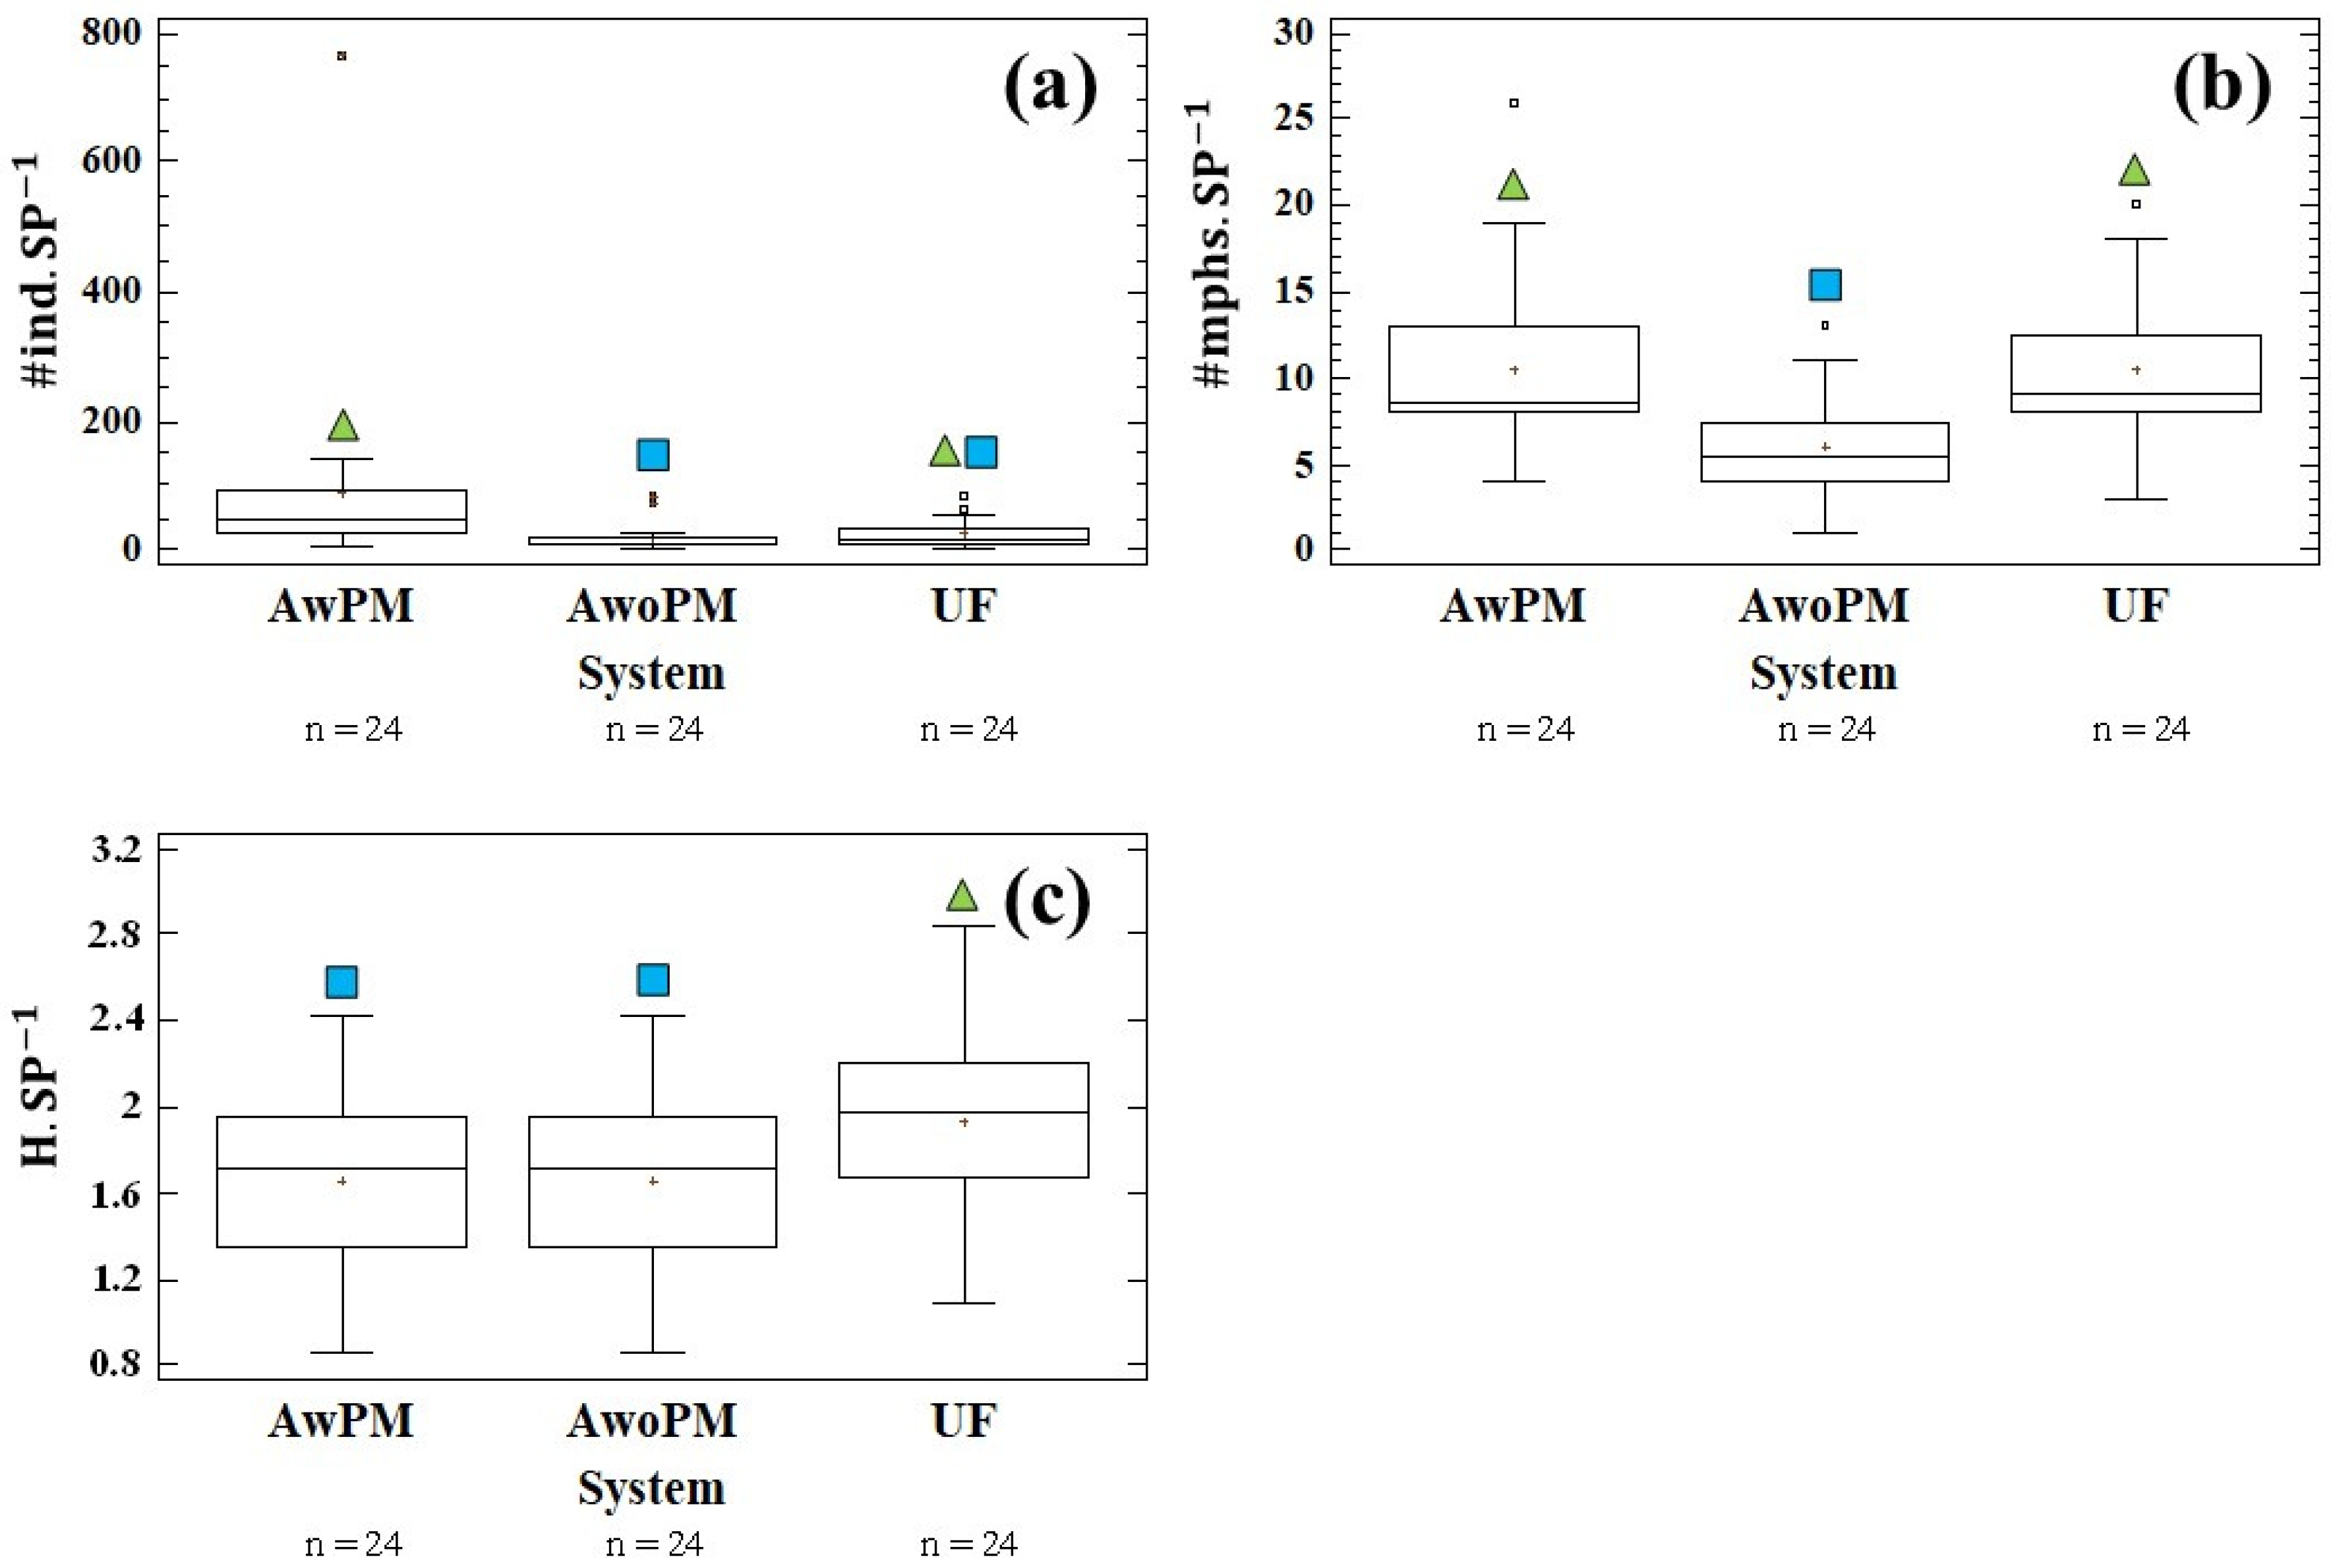
3.4. Above-Ground Dweller Communities in the Presence of Soil GLY, AMPA and MPs

A total of 3192 organisms were collected, of which 171 morphospecies were identified and grouped into 20 orders (Table S2). The AwPM system presented the highest number of individuals per sampling point (Figure 6a) and the highest number of morphospecies per sampling point, together with the UF system (Figure 6b). The highest Shannon diversity index (H) per sampling point was found in the UF system (1.93 ± 0.09, Figure 6c). The UF system harbored 18 orders, followed by AwPM with 14 orders and AwoPM with 12 orders. Likewise, the UF system had the highest presence of morphospecies with 112, followed by AwPM with 90 morphospecies and AwoPM with 51 morphospecies.
Soil GLY and AMPA concentrations did not significantly correlate with the number of individuals, nor with the number of morphospecies or diversity (H) per sampling point (Table S1). On the other hand, MPs counts showed a significant correlation with the number of individuals per sampling point of the order Entomobryorpha (Collembola, R = 0.61, p < 0.05, Tables S3 and S4).

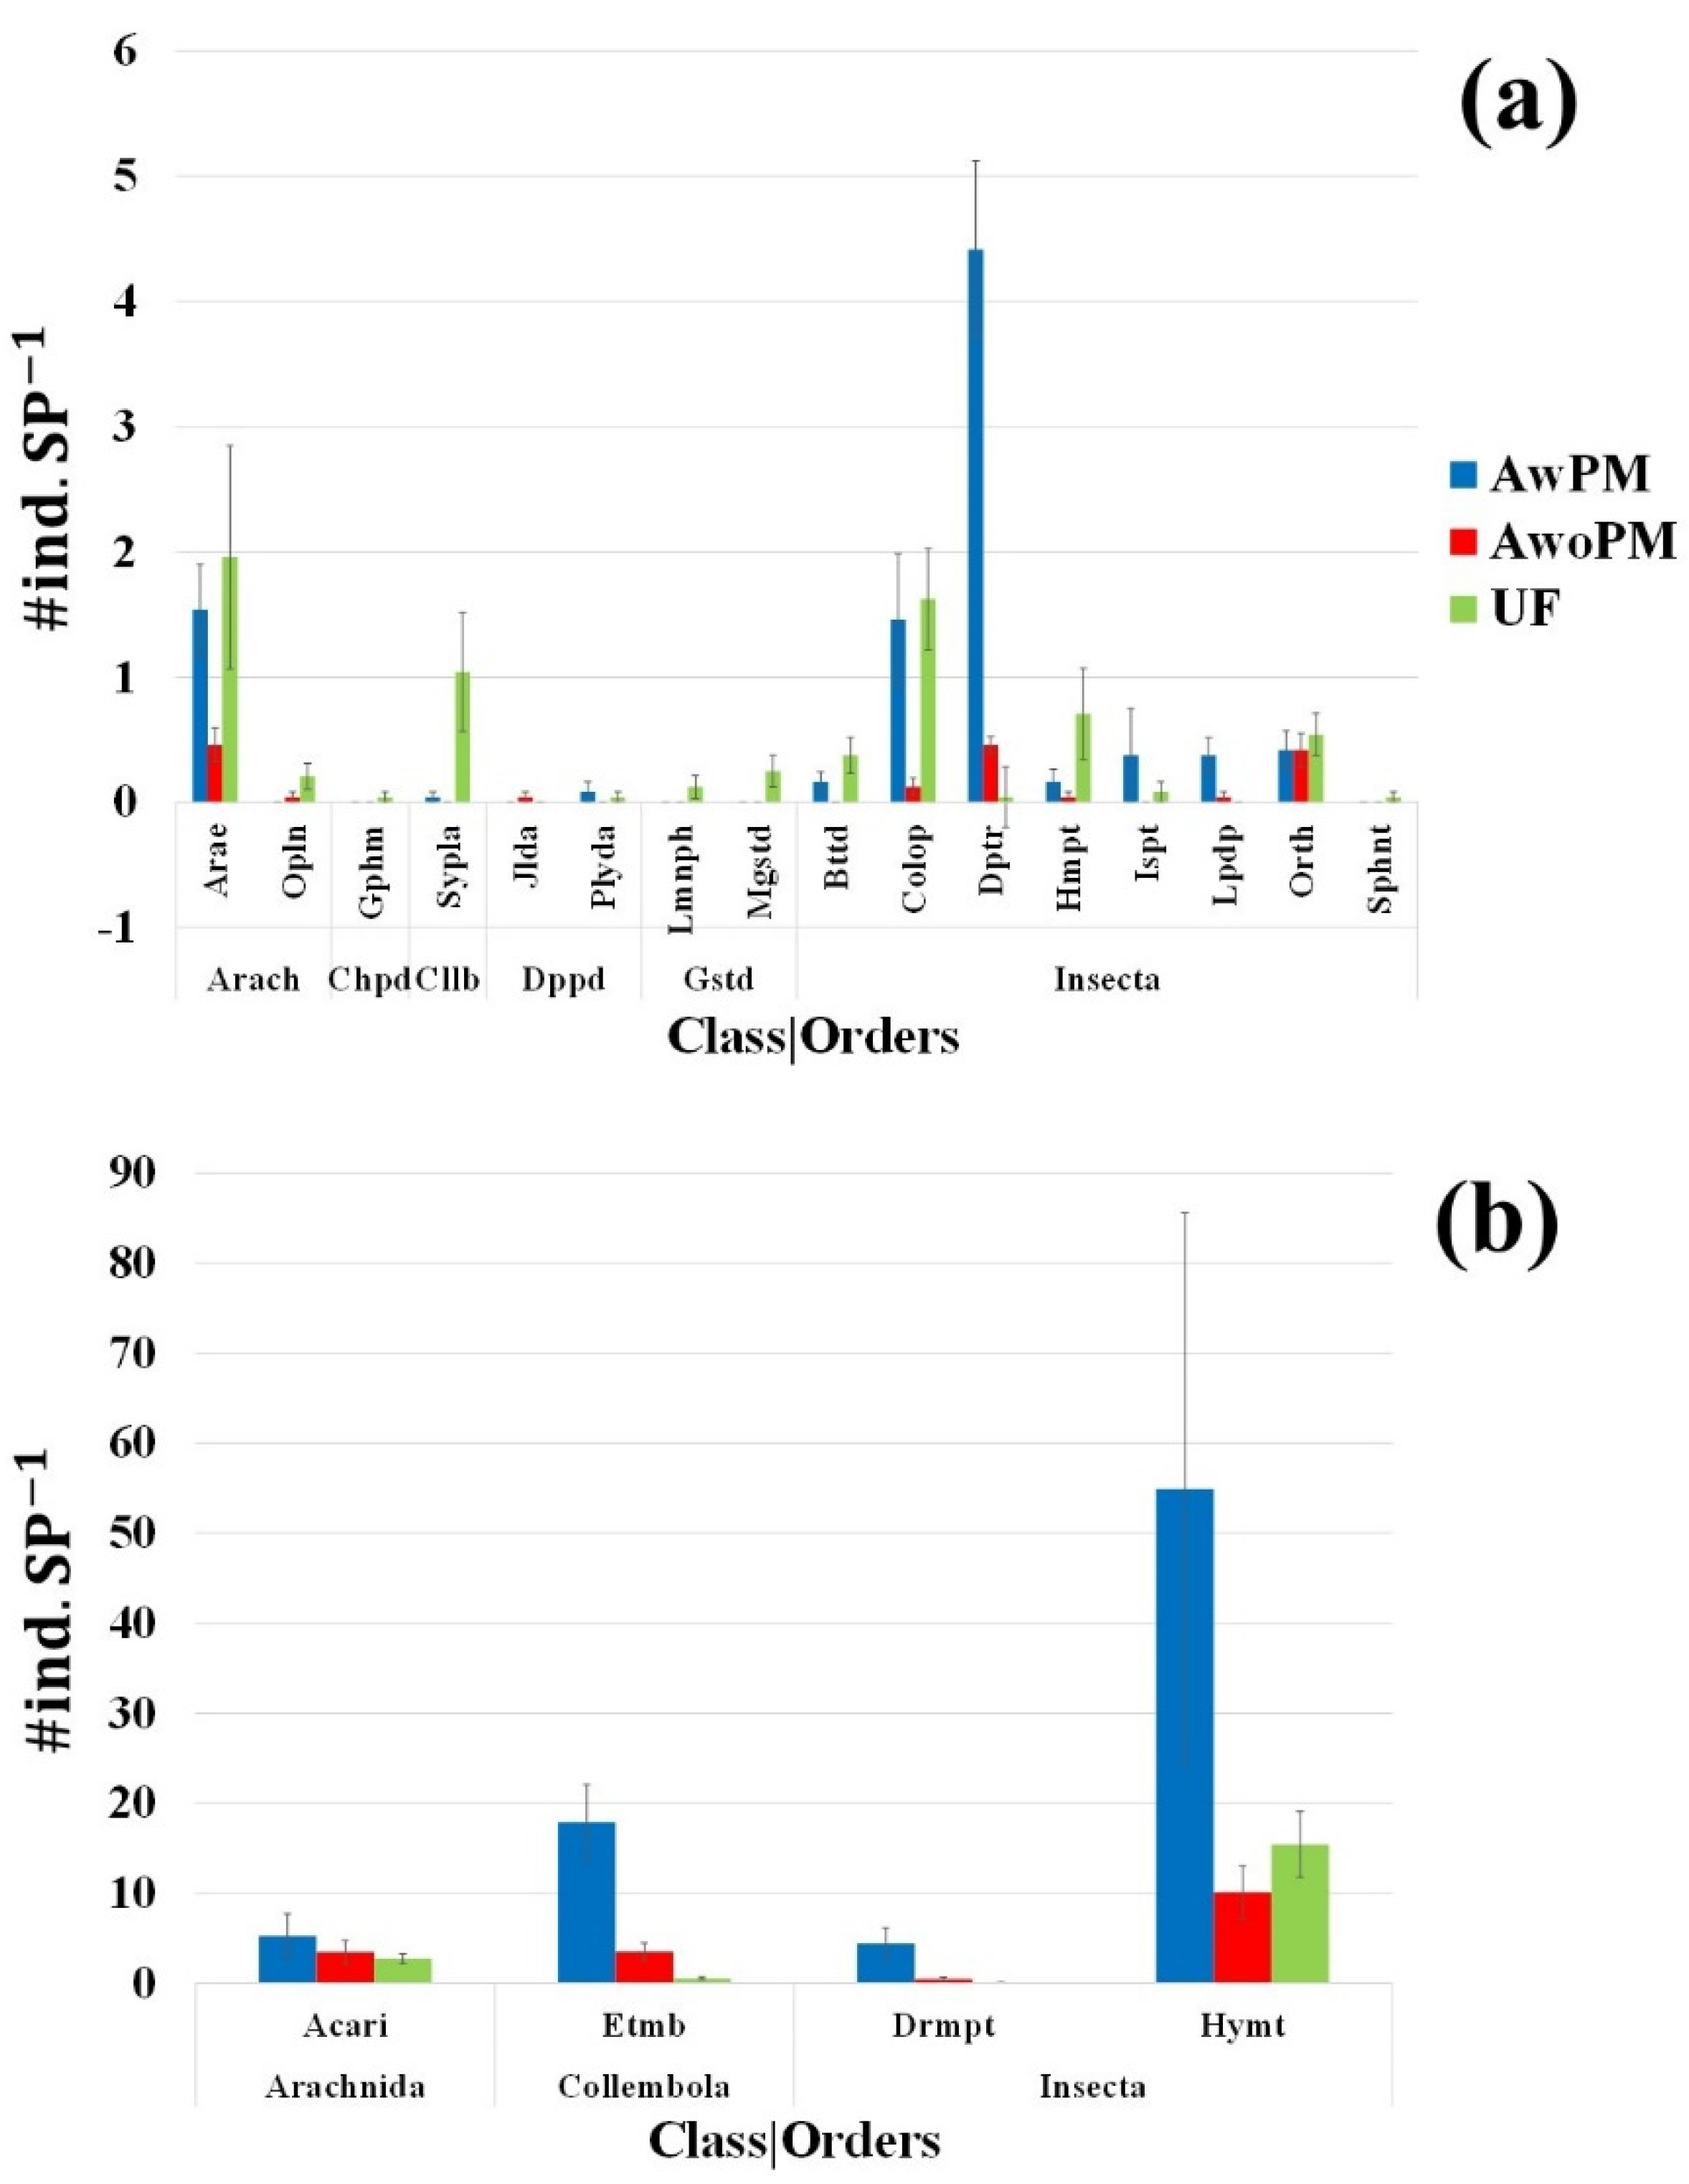
3.4.1. Numbers of Individual Above-Ground Dwellers per Order

The orders Symphypleona (Collembola), Mesograstropoda (Gastropoda), Blattodea, Coleoptera, Hemiptera and Lepidoptera were the least frequent groups in the agricultural systems (Figure S2f,j,k,l,o,r; respectively), showing significant differences (p < 0.05). Symphypleona, Mesograstropoda, Blattodea, and Hemiptera had the highest presence per sampling point in UF. In contrast, Coleoptera had the highest abundance in both UF and AwPM systems, where the most representative family was Carabidae, with 35.9% and 22.9% of the total individuals of this order, respectively. The highest presence of the order Lepidoptera was in the AwPM system (Figure 7a and Figure S2r). The order Araneae had the highest number of total individuals in the UF system (1.96 ± 0.89 individuals), followed by AwPM (1.54 ± 0.36 individuals) and AwoPM (0.46 ± 0.13 individuals), although there was no significant difference in the number of individuals per sampling point between the systems (Figure S2b).
The number of individuals per sampling point of dominant orders Acari, Entomobryomorpha (Collembola), Dermaptera, and Hymenoptera were higher in the AwPM system. However, only with regard to Entomobryomorpha and Dermaptera orders were there significant differences among the systems (p < 0.05, Figure 7b and Figure S2e,m). The highest number of Entomobryomorpha (Collembola) was in AwPM (17.87 ± 4.20 individuals), followed by AwoPM (3.50 ± 0.98 individuals) and UF (0.54 ± 0.17 individuals) (Figure 7b). In the same way, the highest number of Dermaptera was in AwPM (4.42 ± 1.74 individuals), followed by AwoPM (0.46 ± 0.19 individuals) and UF (0.04 ± 0.0.04 individuals) (Figure 7b). The family Formicidae dominated the number of total individuals in all the systems, with the highest presence observed in AwPM (54.46 ± 30.63 individuals), followed by UF (15.29 ± 3.68 individuals) and AwoPM (10.04 ± 2.92 individuals). In addition, the number of individuals per sampling point of the order Hymenoptera showed a significant correlation with the total number of individuals per sampling point (R = 0.64, p < 0.05, Table S5). Furthermore, although the order Acari did not show a significant difference (Figure S2a), the highest presence of individuals was in AwPM (5.25 ± 2.46 individuals), followed by AwoPM (3.46 ± 1.27 individuals) and UF (2.71 ± 0.54 individuals) (Figure 7b).

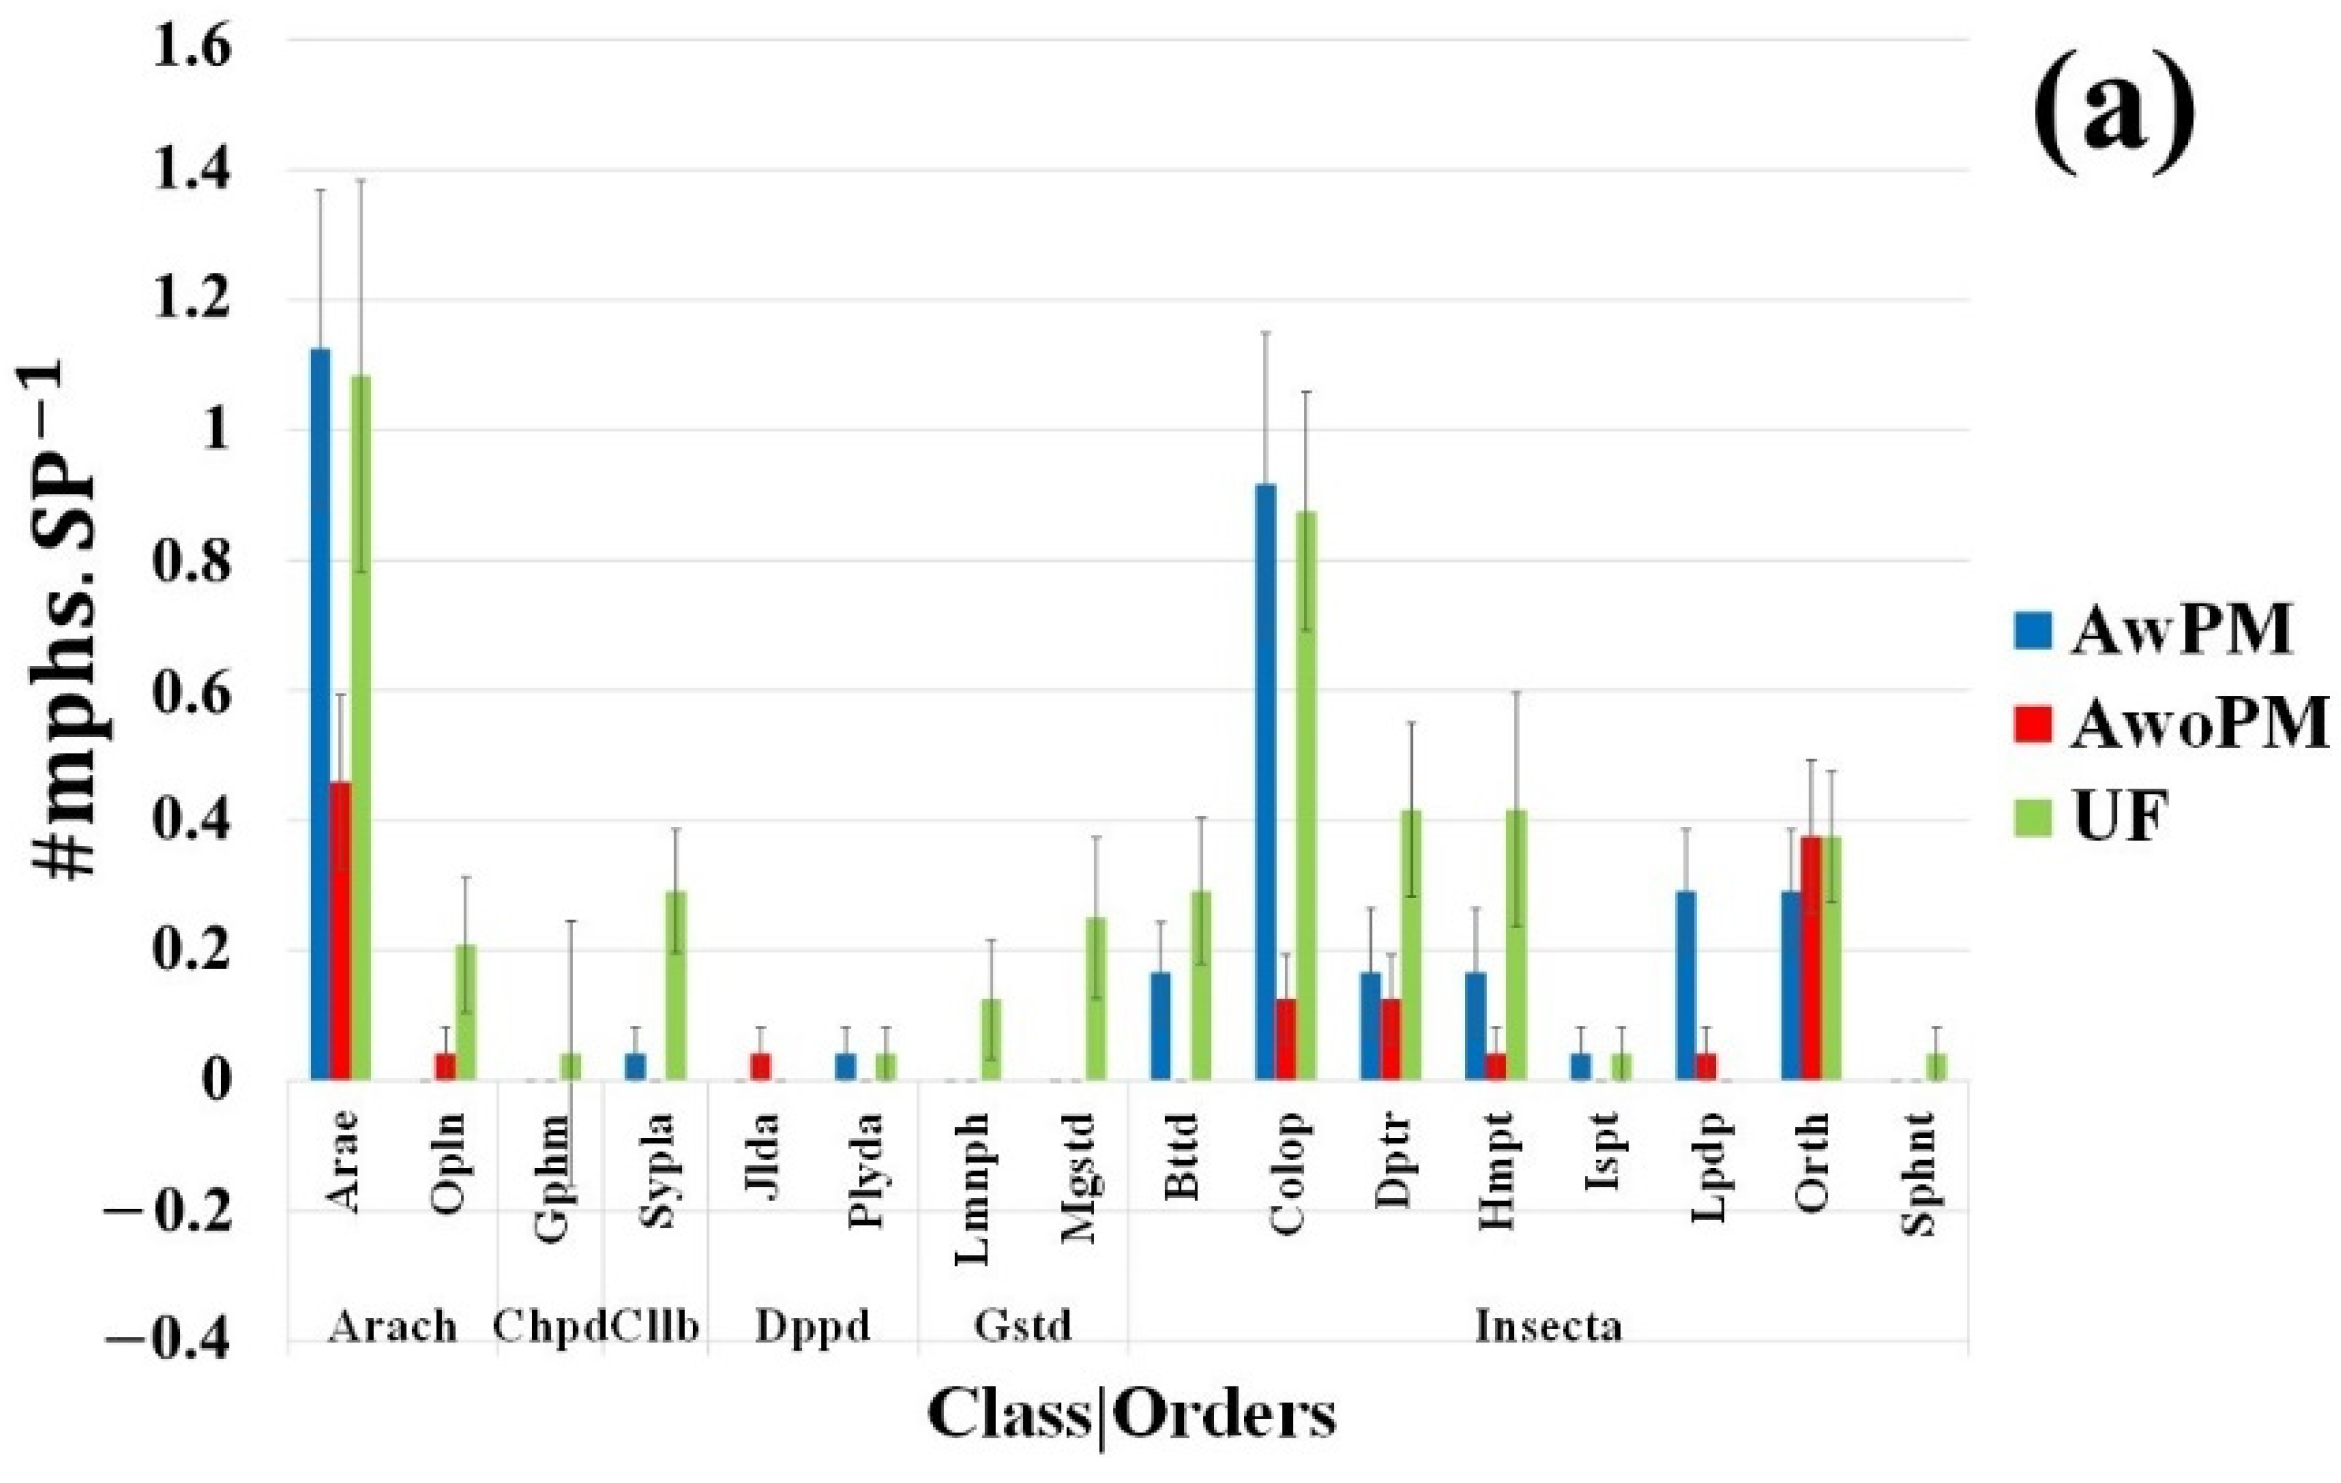
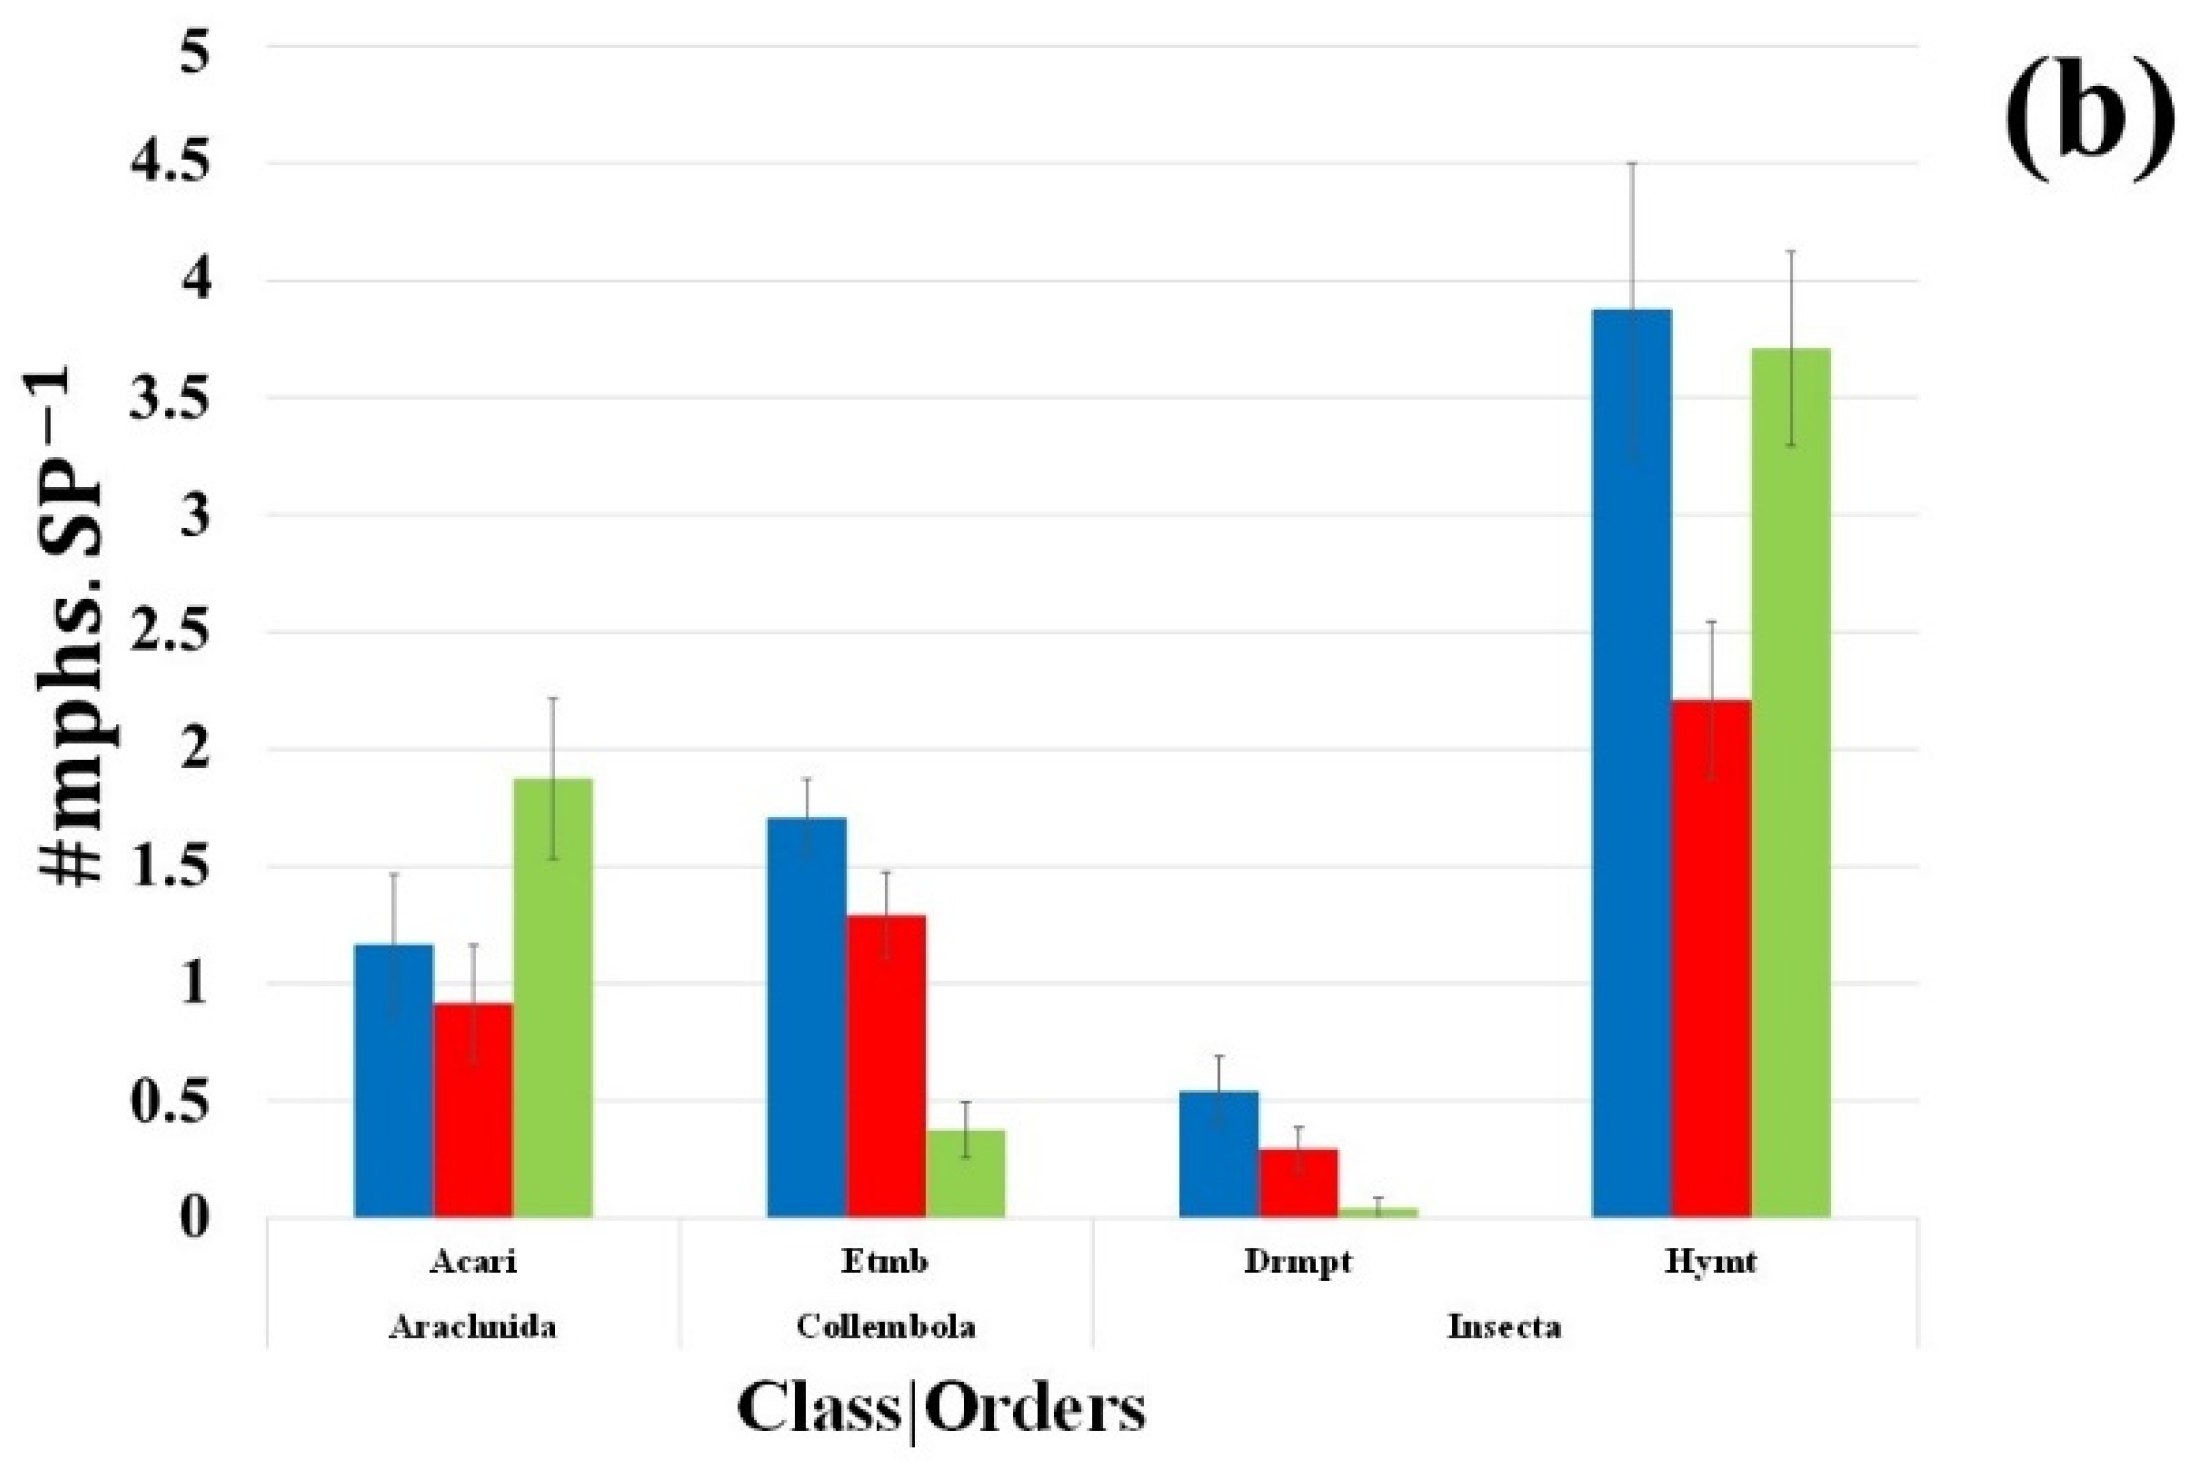
3.4.2. Above-Ground Dwellers’ Morphospecies per Order

The number of morphospecies per sampling point of the less dominant orders Symphypleona (Collembola), Mesograstropoda, Blattodea, Coleoptera and Lepidoptera (Figure S3f,j,k,l,r; respectively) showed significant differences among the systems (p < 0.05). The orders Symphypleona, Mesograstropoda and Blattodea had the highest number of morphospecies per sampling point in the UF system. In contrast, Coleoptera had the highest number of morphospecies in both the AwPM and UF systems, where the family Carabidae accounted for 30.8% and 28.6% of the total number of morphospecies of this order, respectively. On the other hand, the highest number of morphospecies of the order Lepidoptera was found in AwPM (Figure 8a and Figure S3r). The order Araneae had the highest number of morphospecies in UF (1.87 ± 0.34 morphospecies), followed by AwPM (1.17 ± 0.30 morphospecies) and AwoPM (0.92 ± 0.25 morphospecies), although there was no significant difference in the number of morphospecies between sampling points among the systems (Figure S3b).
The number of morphospecies per sampling point of the dominant orders Acari, Entomobryomorpha (Collembola), Dermaptera and Hymenoptera (Figure S3a,e,m,p) showed significant differences per systems (p < 0.05). Acari had the highest number of morphospecies in UF (1.87 ± 0.34). The order Entomobryomorpha had the highest number of morphospecies in AwPM (1.71 ± 0.16) and AwoPM (1.29 ± 0.18). Dermaptera had the highest number of morphospecies in AwPM with 0.54 ± 0.15 (Figure 8b and Figure S3m). The order Hymenoptera had the highest number of morphospecies in the AwPM (3.87 ± 0.62) and UF (3.71 ± 0.41) systems. Within Hymenoptera, the family Formicidae dominated the number of total morphospecies with 3.58 ± 0.57 morphospecies in AwPM, 3.5 ± 0.38 morphospecies in UF, and 2.17 ± 0.33 morphospecies in AwoPM.
On the other hand, the number of morphospecies per sampling point of the orders Hymenoptera (R = 0.70, p < 0.05), Araneae (R = 0.59, p < 0.05) and Coleoptera (R = 0.53, p < 0.05) showed significant correlation with the number of morphospecies per sampling point (Table S6). Moreover, there were significant correlations of the number of morphospecies per sampling point between the orders Araneae and Coleoptera (R = 0.50, p < 0.05) (Tables S7 and S8).

4. Discussion

This study addressed for the first time the community of above-ground-dwelling invertebrates in agricultural systems with soil glyphosate (GLY), AMPA and microplastics (MPs). The initial expectation was to find a low diversity of above-ground dwellers in those sites with the highest concentrations of GLY and MPs. However, soil samples in AwPM had GLY concentrations under the limit of detection. We try to understand this behavior by means of external factors such as drip irrigation in the area and the time that elapsed between the last application and the sampling period; however, more studies are required. Furthermore, in AwoPM, we expected not to find MP particles, but we also found them in this system. Even in the unmanaged farming system MP particles were found; nevertheless, their presence had a different percentage of incidence. This will be discussed in the following sections.

4.1. GLY, AMPA and MP Presence in Soil

Several studies have analyzed the impact of GLY on invertebrates, but only under controlled conditions [24,25,26,27,28]. However, it has not been studied with regard to the variations of the soil GLY concentration in agricultural fields. In this study, GLY was found in the soil of the AwoPM system, where this herbicide was applied. The concentrations presented by the AwoPM system were in the range of 0.14–0.45 mg kg−1 soil, which are lower than the concentrations reported in farmland in Europe and the USA (0.5 mg kg−1 soil) [11,12]. Although AwoPM concentrations are considered sublethal doses [26,49], it has been observed that even 0.05 mg L−1 causes oxidative stress in Lumbriculus variegatus [28]. Similar results were observed by Tate et al. [25] in Pseudosuccinea columella, with 0.1 mg L−1, who noted that stress increases with an increase in the concentration (Table 2).
The AMPA concentrations (0.12–0.94 mg kg−1 soil) found in the AwoPM system were lower than those reported by Silva et al. [12] in agricultural soils in Europe, which presented a maximum of 1 mg kg−1 soil. There are no papers reporting the effects of AMPA on terrestrial invertebrates even though AMPA is four times more soluble (50 g L−1), more persistent and toxic than GLY [29,30]. It has been reported that in general AMPA levels in soils are higher than GLY [50,51,52], which was confirmed by this study. This implies that it is a result of its decomposition, but this concentration seems not to be altered by the presence of MPs [31].
Table 2. Previous studies about the effects of glyphosate on soil invertebrates.
Taxonomic GroupExposure Concentration of GLYEffectReference
Araneae
(Alpaida veniliae)
Coated preys (Musca domestica) with 192 mg (48% GLY) L−1 analytical grade acetone.Negative effect on prey consumption, web construction, fecundity, fertility and progeny development time.Benamú et al. [53]
(Pardosa milvina)12 and 7.68 g L−1 distilled waterFemales attracted fewer males, as males were less able to detect and/or react to female signals.Griesinger et al. [54]
(Tigrosa helluo, Pardosa milvina)Exposure to filter paper immersed in a solution with 12 g L−1 distilled waterTigrosa subdued the cricketers more quickly and with fewer lunges than Pardosa.Rittman et al. [55]
(Hogna cf. bivittata)Exposure to filter paper immersed in a solution with 280 mg L−1 distilled waterConsumption of caterpillars (Anticarsia gemmatalis) but especially ants (Acromyrmex sp.) decreased.Lacava et al. [24]
Araneae (Pardosa agricola) and Carabidae (Poecilus cupreus)Exposure to filter paper immersed in a solution (1:25) with 19.2 mg L−1 distilled water.It seems harmless to Pardosa but it slowed down the translational movement of Poecilus.Michalková et al. [56]
Araneae (Pardosa milvina, Hogna helluo) and Carabidae (Scarites quadriceps)12 g L−1 distilled waterDepending on topical, contact or combined exposure, translational (Pardosa) or seasonal (Hogna and Scarites) movement decreased, to the extent that prolonged exposure increased mortality (Pardosa).Evans et al. [57]
Gastrropoda (Pseudosuccinea columella)0.1, 1 and 10 mg L−1 distilled waterIncrease in amino acids as GLY concentration increases (alanine, glycine, glutamic acid, serine and threomine).Tate et al. [25]
Hymenoptera
(Apis mellifera)
0–3.7 mg L−1It reduced sensitivity to nectar and affected associative learning. However, no effect was found on foraging behavior.Herbert et al. [49]
-2.5, 5 and 10 mg L−1It affected the cognitive abilities needed to retrieve and integrate spatial information for a successful return to the hive.Balbuena et al. [26]
-1.25, 2.5 and 5 ng bee−1β-carotene and retinaldehyde decreased with increasing GLY dose, implying increased oxidative stress.Helmer et al. [58]
(Melipona quadrifasciata)3 µL of GLY dissolved in 10 µL of waterIt killed all larvae after only a few days of exposure.Eler et al. [27]
Oligochaeta
(Eisenia fetida)
0.2 and 0.8 mg kg−1 soilDirect relationship with concentration, decreased weight and reproduction.Yasmin et al. [59]
(Lumbriculus variegatus)0.05, 0.1, 0.5 and 5 mg L−1The Roundup Ultra formulation caused greater oxidative stress than pure GLY, even at non-toxic levels.Contardo-Jara et al. [28]
GLY = glyphosate.
The MP counts in the first centimeters of the soil where above-ground-dwelling invertebrates are exposed to plastic mulches varies significantly according to the management and time of use of plastic mulch in agricultural areas [60]. In this work, more MPs were found at a depth of 0–2 cm in the AwPM (1075 particles kg−1 ± 180.90) system than Liu et al. [61] found in agricultural lands showing an abundance of microplastics of 78.00 ± 12.91 particles kg−1 in the soil at a depth of 0–3 cm. On the other hand, MPs were found in 100% of the samples, as in Zhang and Liu [62], who found a concentration of MPs in Nitisols with a range of 7100–26,630 particles kg−1 in soil and in Gleysols with a range of 13,470–42,960 particles kg−1 in soil of 0–5 cm depth, in vegetable production sites with greenhouses and plastic mulch. However, these concentrations are far above those found in the agricultural sites of this study (Table 3).
In the present work, there were also MPs in the UF system, and lower MPs counts (200–400 particles kg−1) compared to what Zhang and Liu [62] found in the soil of their riparian buffer (8180–18,100 particles kg−1) at a depth of 0–5 cm, possibly because the authors mention that this was farmland that in 2009 was reforested with indigenous trees. Like Piehl et al. [63], who found MPs on agricultural land without the use of plastics, in the present study the AwoPM and UF systems showed lower concentrations and even lower incidence in the samples, possibly because they are transported by wind from surrounding plots and/or roads that are sources of plastics [64].
Table 3. Previous investigations quantifying microplastics in farmlands.
Plastic TypePlastic MulchMPs ConcentrationDepthCropSoil TypeReference
PE, PPNO153 (20–325) * items kg−10–5 cmRiceNDKim et al. [60]
PE, PET,YES65 (10–265) items kg−1Pepper and cabbage
PP, PSNO310 (75–7630) items kg−1 (in greenhouse)Tomatoes, cucumbers and eggplants (in greenhouse)
PE, PET, PPNO2110 (215–3315) items kg−1 (out of greenhouse)
Biodegradable polylactic acidNO320–12,560 items kg−10–20 cmRiceNDChen et al. [65]
NDYES12,050 (7100–26,630 particles kg−1)
26,070 (13,470–42,960 particles kg−1)
0–5 cmLettuceNitisol
Gleysol
Zhang and Liu [62]
NO14,440 (8180–18,100 particles kg−1)Indigenous trees
PE, PMMA, PP, PS, PVCNO0.34 ± 0.36 ** particles kg−10–5 cmWheat, barley,
lucerne, triticale, white mustard, and corn
Entisol and VertisolPiehl et al. [63]
PP, PE, PA, PET, PVC, PC, ABS, PMMA y PSYES78 ± 12.91 items kg−10–3 cmVegetablesNDLiu et al. [61]
* = median (minimum-maximum); ** = mean ± standard deviation; ND = no defined; ABS = acrylonitrile butadiene styrene; PC = polycarbonate, PE = polyethylene; PET = PE terephthalate; PMMA = polymethyl methacrylate; PP = polypropylene; PS = polystyrene; PVC = polyvinyl chloride.

4.2. Presence and Origin of GLY in Above-Ground Dwellers’ Tissue

This is the first record of GLY residues in invertebrate tissue from a field study. Previously, GLY concentrations have been reported in vertebrate tissue from cows and tortoises [47,48,66]. However, in invertebrates it has been only recorded in earthworm tissue under controlled conditions, but it was combusted to determine the bioaccumulated concentration by means of 14C-labeled glyphosate [28]. The concentrations reported in invertebrate studies could be considered non-hazardous [67] from an anthropocentric perspective, as the tolerance limits are made for an agro-industry targeted for human consumption. Nevertheless, no standards have been developed to establish tolerance limits for other organisms such as above-ground invertebrates in field conditions.
Agricultural conditions are the result of different technologies and implemented inputs, within which plastic mulch and GLY could be a hazardous combination designed to increase its uptake by above-ground invertebrates. It was expected that the AwPM system would have the highest incidence and concentration of GLY in the invertebrate tissue. However, this incidence of GLY was higher in the AwoPM system. Moreover, although the AwPM system did not have GLY present in the soil, it did have GLY present in the invertebrates’ tissue. The ranges of GLY concentrations in invertebrates’ tissue for the AwoPM and AwPM systems were 0.03–0.26 and 0.01–0.22 mg kg−1, respectively, which are considered sublethal doses [26,49]. It was observed that invertebrate tissue GLY concentrations were lower in the presence of high MP levels (AwPM). However, the presence of GLY in the invertebrate tissue of the AwPM system could be due to the AwPM1 plot being close to AwoPM system plots (Figure 1).
The GLY residues in invertebrates’ tissue from the AwPM system could be due to environmental contamination [66] or invertebrates’ home range. The absence of GLY in the soil from this system rules out contamination from soil erosion by wind or water [66]. Nonetheless, in this study, the AwPM1 plot had no GLY in the soil due to the almost simultaneous use of the irrigation system with the application of herbicide in November 2018 (Table 1) and its high solubility (10.5 g L−1, Pow = −3.2) [67], which led to it being washed out by the sampling time in March 2019 [47]. But the presence of GLY in the invertebrate tissue could be due to individuals of some orders having high incidence in the samples and/or dominating the amount of material for GLY quantification in the tissue, and the fact that they have a wider range of distribution.
Hymenoptera (Formicidae), Dermaptera, Araneae and Orthoptera orders were the main tissue sources for composite samples of GLY in invertebrate tissue. The wider distribution range of these orders may have allowed them to move from sites with the highest presence of GLY in the soil (AwoPM) to the AwPM1 plot. Proximity to fields where GLY is applied has been shown to influence the concentration of GLY in vertebrates’ tissues [47], but these have a much wider distribution range than above-ground invertebrates. So, although these orders have a larger distribution range compared to the other orders present, it might not be sufficient to avoid their chronic exposure to GLY residues in the soil or crop leftovers [50] of the AwoPM system, where GLY was most used while there was no irrigation (Table 1), which resulted in higher GLY uptake.

4.3. Above-Ground Invertebrates in the Presence of Soil GLY and MPs

The extensive and intensive use of GLY in agriculture is a big concern due to its reported negative effects on non-target crops and plants, as well as its toxicity to mammals, micro-organisms, and invertebrates [4,30]. Several studies have reported that exposure to different levels of GLY concentrations from sublethal doses (0.05–10 mg L−1) to the maximum concentration found in the field (192 mg L−1) affected various taxonomic groups of terrestrial invertebrates, such as Araneae, Carabidae, Gastropoda, Hemiptera and Oligochaeta (Table 2). Moreover, it has been reported that different factors influence the soil GLY concentration [30], and it accumulates predominantly in the first soil centimeter [5,33,53], where above-ground-dwelling invertebrates are more exposed and can take it up.
Although above-ground invertebrates are exposed to other pesticides present in the field, GLY can modify soil invertebrate community diversity and structure. Several studies have reported how GLY affects certain groups of them in their performance and survival, albeit on an individual basis (Table 2). Thus, the absence of the order Gastropoda in both AwoPM and AwPM systems would not only be related to the change in land use and the low water conditions present during the sampling time, but also due to the use of GLY, since it has been observed to affect the survival of this order [25]. Moreover, not only does GLY persist in the stubble, but also AMPA [50], which are present in the active crop [68] or other plants and invertebrates, even if they were non-target organisms for eradication [30].
Other orders probably affected by the use of GLY are predators, which are essential for nutrient cycling, as they contribute indirectly to the process of controlling organisms at a lower trophic level that alter the physicochemical conditions of soil and mulch [69]. The order Araneae had the lowest number of individuals and morphospecies in the AwoPM system. This lower presence of the order Araneae also occurred at some sampling points in the AwPM system. The decrease in spider species has been related to GLY in transgenic soybean crops [53]. Previously, spiders have been observed to be sensitive to insecticides [70], but GLY has recently been reported to affect them [55,56,71]. GLY has been reported to affect spiders’ prey consumption, web construction, fecundity, fertility, progeny development time and reproductive capacity [53,54], in addition to the decline of the spiders’ prey populations [24], as observed in the AwPM and AwoPM systems.
The mode and time of exposure to GLY have been reported to affect the survival of some spiders and carabids, as it may decrease their ability to move [56,57]. In carabids, this exposure could make them easy prey or decrease their foraging activity [55] and consequently increase their mortality. Therefore, in this study, the absence of the Carabidae family in the AwoPM system could be related to exposure to GLY and AMPA present in the soil, resulting in the highest invertebrate tissue GLY concentration, which reveals a higher uptake. Unlike the UF system, there was no presence of these pollutants in the soil and invertebrate tissue, where the highest presence of this family was found.
Other invertebrates that play an important role in ecosystem resilience are exposed to soil GLY residues. Ants (Formicidae) are considered ecosystem engineers because they intervene in soil physical processes, and they could also be affected by GLY use. Chanatásig et al. [72] observed a similar number of morphospecies between their reference and monoculture systems where GLY was used, but a higher abundance of them in monoculture systems, as we observed between the UF and AwPM systems. These authors mentioned that a morphospecies decline in the family Formicidae (Hymenoptera) was related to the use of herbicides. This was observed in our AwoPM system, where the abundance and richness of morphospecies of this family were strongly affected and to a lesser extent in AwPM system (Figure 8b).
The sensitivity to pesticides of some orders studied in the laboratory does not coincide with what is observed in the field. Such is the case for the springtails observed in this study, where the high abundance of the order Entomobryomorpha (Collembola) in the AwPM system, which showed residues of GLY in invertebrate tissue, seems to contradict the sensitivity that this order might have to a wide range of toxic modes of action (biocides, fungicides, herbicides and insecticides). However, this has only been tested in Folsomia candida [73]. Nevertheless, in this work it was observed that the number of morphospecies of this order does decrease.
A negative relationship was observed between the concentration of GLY in invertebrate tissue and the soil. We infer that there may be some mobility of this herbicide from the soil to the invertebrate body, due to their exposure to the GLY residues in the soil [47]. This GLY mobility in the invertebrate tissue represented 14% of the soil GLY concentration. This percentage appears to be a constant proportion of GLY mobility, and this was also noted by Yang et al. [5,45] who observed that 14% of the GLY that had been applied to the soil was mobilized in runoff and in the soil of earthworm burrows closer to the soil surface. However, no studies have reported GLY mobility in invertebrate tissue (Table 2).
In Mexico, the increased use of plastic mulch on agricultural lands has been demonstrated [71,74,75,76]. However, there are no statistics that exclusively address the use of plastic mulch in agriculture. So far, there has been no field work addressing the impact of MPs on above-ground-dwelling invertebrates’ diversity and structure. The effects of plastic mulch use on soil invertebrates have been reported but do not show similar trends [7,77,78,79]. Most studies are about the effects that MPs have on soil invertebrates, specifically on Oligochaeta and Collembola classes, and to a lesser extent the orders Isopoda (mealybugs) and Gastropoda (snails), as well as nematodes [19,20].
In this work, no significant correlation of MP counts with invertebrate diversity was found (Table S1). Nevertheless, we observed relationships with the number of individuals and morphospecies per sampling point of some orders. In all systems, MPs were present in different proportions of incidence and a significant correlation was encountered with the number of individuals and morphospecies of the Entromobryomorpha (Collembola), Dermaptera and Lepidoptera orders, which were most abundant in the AwPM system (Table S3). However, MP counts were negatively correlated with the abundance of the Symphypleona (Collembola) order, which is more abundant in the UF system, and with the Mesogastropoda (Gastropoda) order, which was not found in the agroecosystems, where the highest abundance of MPs was found (Table S3).
In this study, it was expected that there would be a lower diversity of above-ground dwellers in agricultural areas with the presence of MPs and GLY. However, there was no significant difference between the invertebrate diversity of the two agroecosystems (Figure 6c), the soil with the highest concentration of MPs (AwPM) and the system with GLY in the soil (AwoPM). Nevertheless, both agroecosystems presented a significantly lower diversity than the UF system. Furthermore, the orders Entomobryomorpha (Collembola) and Dermaptera had high abundance in the agroecosystems, especially in the AwPM system, and together with the family Formicidae (Hymenoptera), gave to this system the highest abundance of organisms per sampling point and a similar number of morphospecies as that of the UF system. This could occur since the AwPM system did not use GLY in recent months (see Section 4.2), explaining why soil GLY concentrations were not detected. However, GLY was found in the invertebrates’ tissue in the AwPM system. The higher concentration of GLY and AMPA in the soil of the AwoPM system can be related to the intensive application of this herbicide in that system [50,66]. Thus, the decrease in invertebrate diversity cannot be entirely attributed to the presence of MPs.
Investigations that have analyzed the relationship of plastic mulch use with soil invertebrates have reported changes in invertebrate community structure such as those observed in this study [7,77,78,79]. Schirmel et al. [7] observed a decrease in taxonomic richness, as occurred in the AwPM system. However, the AwoPM system had the lowest diversity. Miñarro et al. [78] observed a decrease in the number of individuals of the family Carabidae, as observed here in the AwPM system, where it decreased both in terms of the number of individuals and the total morphospecies with respect to the UF system. In this work a high abundance of the orders Entomobryomorpha (Collembola), Dermaptera and Acari was observed, unlike that of Addison et al. [77] who observed a low number of springtails, attributing this condition to the high abundance of predators of the orders Dermaptera and Hemiptera. In the present study, the number of individuals per sampling point of the order Dermaptera proved to be closely related to individuals of the orders Entomobryomorpha (Collembola) and Acari.
This relationship between Dermaptera, Entomobryomorpha and Acari orders could be due to predator–prey interactions. Since springtails are part of the diet of both earwigs [80] and mites [81], this could have increased the populations of both predatory orders. Studies related to the order Dermaptera indicate that they function as a biological control without affecting the main crop [82,83], so their presence seems to have a strong reaction to the population explosion of springtails as observed here, as well as by the abundance of mites that are also part of the diet of Dermaptera [84].
In this research, the number of MPs was observed to correlate with the number of individuals (Table S1), dominated by the order Hymenoptera (Table S5). However, the orders Entomobryomorpha (Collembola) and Dermaptera were also influential in the AwPM system. In addition, the abundance of the order Dermaptera was related to the decrease in diversity per sampling point (Table S5), which seems to imply that sites with a higher presence of MPs would tend to have low diversity. However, it is not clear whether this is due to the presence of this order, which could cause the displacement of other orders, or to the presence of MPs.
The high abundance of springtails in the system with plastic mulch could be due to the presence of MPs. Taking into account the fact that MPs are hydrocarbon derivatives that have been plasticized [85], Uribe-Hernández et al. [86] observed that the Collembola class was more abundant in hydrocarbon-contaminated soils, especially pointing out that a species of the order Poduromorpha and Symphypleona could be indicators of acidic environments and high hydrocarbon concentrations. In this work, a similar trend was observed with the order Entomobryomorpha, so that different orders of springtails seem to be resistant to this type of pollutant, but Zhu et al. [87] and Ju et al. [88] observed with low concentrations of PVC-MPs and PE-MPs a reduction in growth and the reproduction of species of the order Entomobryomorpha.

5. Conclusions

The abundance of above-ground dwellers decreased in agricultural systems with regard to the reference system of this study, i.e., Limnophila, Mesogastropoda (Gastropoda) as well as Siphonaptera clearly decreased, but this condition seems to be unrelated to the presence of glyphosate, AMPA and/or microplastics, because no correlation was observed among these invertebrates and those pollutants in this study. These outcomes suggest that the order Entomobryomorpha (Collembola) is more abundant in agricultural soils with high microplastic counts (AwPM system, 17.87 ± 4.20 ind SP−1, 400–2000 MPs kg−1, R = 0.61, p < 0.05), and this order might serve as indicator of microplastic pollution. GLY concentrations in invertebrates’ tissue were not higher in the presence of both pollutants. Contrary to our expectations, our findings show no relationship between microplastic counts and the concentration of glyphosate in the soil, nor with the concentration of glyphosate in the tissue of invertebrates. Furthermore, a negative (significant) relationship was observed between increasing GLY concentrations in invertebrates’ tissues with GLY and AMPA concentrations in the soil. This concentration represents about 14% of the soil glyphosate concentration. Experimental field studies with more controlled factors are needed to clarify the interaction of both pollutants, and to understand their relationship with above-ground-dwelling invertebrates.

Supplementary Materials

The following are available online at https://www.mdpi.com/article/10.3390/environments8110130/s1, Figure S1: Clay percentage (%) per treatment. + = mean, middle horizontal line in the box indicates median, n = number of sampling points for statistical analysis, Figure S2: Number of individuals per sampling point (#ind SP−1, n = 24) per each order. Each small square indicates an outlier, + = mean, middle horizontal line in the box indicates median, n = number of sampling points for statistical analysis. Different geometric figures implies significantly different groups (Mann–Whitney U test, p < 0.05), Figure S3: Number of morphospecies per sampling point (#mphs SP−1, n = 24) per each order. Each small square indicates an outlier, + = mean, middle horizontal line in the box indicates median, n = number of sampling points for statistical analysis. Different geometric figures implies significantly different groups (Mann–Whitney U test, p < 0.05), Table S1: Correlations between microplastic counts (MPs, n = 20), soil glyphosate concentration (GLYsoil, n = 24), soil AMPA concentration (AMPAsoil, n = 24) and glyphosate in invertebrate tissue (GLYinv, n = 72), number of individuals (#ind, n = 72) and morphospecies (#mphs, n = 72) of invertebrates and Shannon diversity index (H, n = 72) per sampling point. n = number of sampling points for statistical analysis, Table S2: Number of morphospecies at each classification level., Table S3: Correlations between soil microplastics (MPs, n = 66), soil glyphosate concentration (GLYsoil, n = 24), soil AMPA concentration (AMPAsoil, n = 24) and glyphosate in invertebrate tissue (GLYinv, n = 72) with the number of individuals per sampling point per order. n = number of sampling points for statistical analysis, Table S4: Correlations between soil microplastics count (MPs, n = 66), soil glyphosate concentration (GLYsoil, n = 24), soil AMPA concentration (AMPAsoil, n = 24) and glyphosate in invertebrate tissue (GLYinv, n = 72) with the number of morphospecies per sampling point per order. n = number of sampling points for statistical analysis, Table S5: Correlations between global abundance and global diversity with relative abundance by order of above-ground invertebrates (n = 72). n = number of sampling points for statistical analysis, Table S6: Correlations between global richness and global diversity with relative richness by order of above-ground invertebrates (n = 72), Table S7: Correlation between the number of individuals per sampling point (#ind SP−1) per orders of soil invertebrates (n = 72). n = number of sampling points for statistical analysis., Table S8: Correlation between number of morphospecies per sampling point (#mphs SP−1) per orders of above-ground invertebrates (n = 72). n = number of sampling points for statistical analysis.

Author Contributions

Conceptualization, E.H.-G. and E.H.-L.; methodology, E.H.-G., S.P., R.V., E.H.-L., X.Y. and V.G.; software, E.H.-G.; validation, E.H.-G., J.R.-v.O., G.E.-S., J.M.-V., R.D.-C., S.P., R.V., X.Y., V.G. and E.H.-L.; formal analysis, E.H.-G., J.R.-v.O., G.E.-S., X.Y. and E.H.-L.; investigation, E.H.-G., G.E.-S. and E.H.-L.; resources, E.H.-L., J.R.-v.O., E.H.-G. and G.E.-S.; data curation, E.H.-G., R.D.-C., E.H.-L. and J.R.-v.O.; writing—original draft preparation, E.H.-G. and E.H.-L.; writing—review and editing, E.H.-G., J.R.-v.O., G.E.-S., J.M.-V., R.D.-C. and E.H.-L.; visualization, E.H.-G. and E.H.-L.; supervision, E.H.-G., J.R.-v.O., G.E.-S., J.M.-V., R.D.-C. and E.H.-L.; project administration, E.H.-G. and E.H.-L.; funding acquisition, E.H.-L., G.E.-S. and V.G. All authors have read and agreed to the published version of the manuscript.

Funding

E.H.-G. acknowledge CONACYT (Consejo Nacional de Ciencia y Tecnología) PhD scholarship, grant number 364201.

Institutional Review Board Statement

Not applicable.

Informed Consent Statement

Not applicable.

Data Availability Statement

Not applicable.

Acknowledgments

Thanks to the producers of the locality Alfredo V. Bonfil for allowing us to work with them, especially to the Aguilera Vázquez family for their accommodation. To biologists Andrea Margarita Flores Balche and Carlos Baños for their support in identifying morphospecies, determining glyphosate in the invertebrate tissue and during the field work. To Centro INAH Campeche for the permits granted, to the archaeologist Antonio Benavides Castillo (2018) and the archaeologist Adriana Velázquez Morlet (2019) during their respective management to work in the Archaeological Zone of Edzná, as well as to the person in charge and the other members working in Edzná, and finally to N. den Bok for the English edition. Special thanks to reviewers who contributed to enhancing this paper.

Conflicts of Interest

The authors declare no conflict of interest.

References

  1. Tibbett, M.; Fraser, T.D.; Duddigan, S. Identifying Potential Threats to Soil Biodiversity. PeerJ 2020, 8, e9271. [Google Scholar] [CrossRef] [PubMed]
  2. Hagner, M.; Mikola, J.; Saloniemi, I.; Saikkonen, K.; Helander, M. Effects of a Glyphosate-Based Herbicide on Soil Animal Trophic Groups and Associated Ecosystem Functioning in a Northern Agricultural Field. Sci. Rep. 2019, 9, 8540. [Google Scholar] [CrossRef] [PubMed]
  3. Maran, A.M.; Weintraub, M.N.; Pelini, S.L. Does Stimulating Ground Arthropods Enhance Nutrient Cycling in Conventionally Managed Corn Fields? Agric. Ecosyst. Environ. 2020, 297, 106934. [Google Scholar] [CrossRef]
  4. Rossi, E.M. Antología Toxicológica de Glifosato +1000: Evidencias Científicas Publicadas Sobre Los Impactos Del Glifosato En La Salud, Ambiente y Biodiversidad. Available online: https://semillasdeidentidad.org/es/articulos/de-1000-evidencias-cientificas-publicadas-sobre-los-impactos-del-glifosato-en-la-salud-ambiente-y-biodiversidad (accessed on 28 September 2020).
  5. Yang, X.; Lwanga, E.H.; Bemani, A.; Gertsen, H.; Salanki, T.; Guo, X.; Fu, H.; Xue, S.; Ritsema, C.; Geissen, V. Biogenic Transport of Glyphosate in the Presence of LDPE Microplastics: A Mesocosm Experiment. Environ. Pollut. 2019, 245, 829–835. [Google Scholar] [CrossRef]
  6. Guo, J.J.; Huang, X.P.; Xiang, L.; Wang, Y.Z.; Li, Y.W.; Li, H.; Cai, Q.Y.; Mo, C.H.; Wong, M.H. Source, Migration and Toxicology of Microplastics in Soil. Environ. Int. 2020, 137, 105263. [Google Scholar] [CrossRef]
  7. Schirmel, J.; Albert, J.; Kurtz, M.P.; Muñoz, K. Plasticulture Changes Soil Invertebrate Assemblages of Strawberry Fields and Decreases Diversity and Soil Microbial Activity. Appl. Soil Ecol. 2018, 124, 379–393. [Google Scholar] [CrossRef]
  8. Maggi, F.; la Cecilia, D.; Tang, F.H.M.; McBratney, A. The Global Environmental Hazard of Glyphosate Use. Sci. Total Environ. 2020, 717, 137167. [Google Scholar] [CrossRef]
  9. Organización de las Naciones Unidas para la Alimentación y la Agricultura División de Estadística. Plaguicidas Uso. Available online: http://www.fao.org/faostat/es/#data/RP (accessed on 28 September 2020).
  10. Sistema de Información Arancelaria Vía Internet. Fracción 2931.90.19 Sal Isopropilamonica de N(fosfonometil)Glicina. Sal de Glifosato. Available online: http://www.economia-snci.gob.mx/ (accessed on 28 September 2020).
  11. Battaglin, W.A.; Meyer, M.T.; Kuivila, K.M.; Dietze, J.E. Glyphosate and Its Degradation Product AMPA Occur Frequently and Widely in U.S. Soils, Surface Water, Groundwater, and Precipitation. JAWRA J. Am. Water Resour. Assoc. 2014, 50, 275–290. [Google Scholar] [CrossRef]
  12. Silva, V.; Montanarella, L.; Jones, A.; Fernández-Ugalde, O.; Mol, H.G.J.; Ritsema, C.J.; Geissen, V. Distribution of Glyphosate and Aminomethylphosphonic Acid (AMPA) in Agricultural Topsoils of the European Union. Sci. Total Environ. 2018, 621, 1352–1359. [Google Scholar] [CrossRef]
  13. Huang, Y.; Liu, Q.; Jia, W.; Yan, C.; Wang, J. Agricultural Plastic Mulching as a Source of Microplastics in the Terrestrial Environment. Environ. Pollut. 2020, 260, 114096. [Google Scholar] [CrossRef]
  14. Steinmetz, Z.; Wollmann, C.; Schaefer, M.; Buchmann, C.; David, J.; Tröger, J.; Muñoz, K.; Frör, O.; Schaumann, G.E. Plastic Mulching in Agriculture. Trading Short-Term Agronomic Benefits for Long-Term Soil Degradation? Sci. Total Environ. 2016, 550, 690–705. [Google Scholar] [CrossRef]
  15. Briassoulis, D.; Hiskakis, M.; Tserotas, P. Combined Effect of UVA Radiation and Agrochemicals on the Durability of Agricultural Multilayer Films. Polym. Degrad. Stab. 2018, 154, 261–275. [Google Scholar] [CrossRef]
  16. Ng, E.L.; Huerta Lwanga, E.; Eldridge, S.M.; Johnston, P.; Hu, H.W.; Geissen, V.; Chen, D. An Overview of Microplastic and Nanoplastic Pollution in Agroecosystems. Sci. Total Environ. 2018, 627, 1377–1388. [Google Scholar] [CrossRef] [PubMed]
  17. Duis, K.; Coors, A. Microplastics in the Aquatic and Terrestrial Environment: Sources (with a Specific Focus on Personal Care Products), Fate and Effects. Environ. Sci. Eur. 2016, 28, 2. [Google Scholar] [CrossRef] [PubMed] [Green Version]
  18. Corradini, F.; Casado, F.; Leiva, V.; Huerta-Lwanga, E.; Geissen, V. Microplastics Occurrence and Frequency in Soils under Different Land Uses on a Regional Scale. Sci. Total Environ. 2021, 752, 141917. [Google Scholar] [CrossRef] [PubMed]
  19. Khalid, N.; Aqeel, M.; Noman, A. Microplastics Could Be a Threat to Plants in Terrestrial Systems Directly or Indirectly. Environ. Pollut. 2020, 267, 115653. [Google Scholar] [CrossRef]
  20. Kumar, M.; Xiong, X.; He, M.; Tsang, D.C.W.; Gupta, J.; Khan, E.; Harrad, S.; Hou, D.; Sik, Y.; Bolan, N.S. Microplastics as Pollutants in Agricultural Soils. Environ. Pollut. 2020, 265, 114980. [Google Scholar] [CrossRef]
  21. Ruimin, Q.; Jones, D.L.; Li, Z.; Liu, Q.; Changrong, Y. Behavior of Microplastics and Plastic Film Residues in the Soil Environment: A Critical Review. Sci. Total Environ. 2020, 703, 134722. [Google Scholar] [CrossRef]
  22. Changrong, Y.; Wenqing, H.; Turner, N.C.; Enke, L.; Qin, L.; Shuang, L. Plastic-Film Mulch in Chinese Agriculture: Importance and Problems. World Agric. 2014, 4, 32–36. [Google Scholar]
  23. Zhang, D.; Liu, H.; Hu, W.; Qin, X.; Ma, X.; Yan, C.; Wang, H. The Status and Distribution Characteristics of Residual Mulching Film in Xinjiang, China. J. Integr. Agric. 2016, 15, 2639–2646. [Google Scholar] [CrossRef] [Green Version]
  24. Lacava, M.; García, L.F.; Viera, C.; Michalko, R. The Pest-Specific Effects of Glyphosate on Functional Response of a Wolf Spider. Chemosphere 2021, 262. [Google Scholar] [CrossRef]
  25. Tate, T.M.; Jackson, R.N.; Christian, F.A. Effects of Glyphosate and Dalapon on Total Free Amino Acid Profiles of Pseudosuccinea Columella Snails. Bull. Environ. Contam. Toxicol. 2000, 64, 258–262. [Google Scholar] [CrossRef] [PubMed]
  26. Balbuena, M.S.; Tison, L.; Hahn, M.; Greggers, U.; Menzel, R.; Farina, W.M. Effects of Sublethal Doses of Glyphosate on Honeybee Navigation. J. Exp. Biol. 2015, 218, 2799–2805. [Google Scholar] [CrossRef] [Green Version]
  27. Eler Seide, V.; Cupertino Bernardes, R.; Guedes Pereira, E.J.; Pereira Lima, M.A. Glyphosate Is Lethal and Cry Toxins Alter the Development of the Stingless Bee Melipona quadrifasciata. Envionmental Pollut. 2018, 243, 1854–1860. [Google Scholar] [CrossRef] [PubMed]
  28. Contardo-Jara, V.; Klingelmann, E.; Wiegand, C. Bioaccumulation of Glyphosate and Its Formulation Roundup Ultra in Lumbriculus variegatus and Its Effects on Biotransformation and Antioxidant Enzymes. Environ. Pollut. 2009, 157, 57–63. [Google Scholar] [CrossRef] [PubMed]
  29. Duke, S.O. Glyphosate: Environmental Fate and Impact. Weed Sci. 2020, 68, 201–207. [Google Scholar] [CrossRef]
  30. Singh, S.; Kumar, V.; Datta, S.; Wani, A.B.; Dhanjal, D.S.; Romero, R.; Singh, J. Glyphosate Uptake, Translocation, Resistance Emergence in Crops, Analytical Monitoring, Toxicity and Degradation: A Review; Springer International Publishing: Berlin/Heidelberg, Germany, 2020; Volume 18. [Google Scholar] [CrossRef]
  31. Yang, X.; Bento, C.P.M.; Chen, H.; Zhang, H.; Xue, S.; Lwanga, E.H.; Zomer, P.; Ritsema, C.J.; Geissen, V. Influence of Microplastic Addition on Glyphosate Decay and Soil Microbial Activities in Chinese Loess Soil. Environ. Pollut. 2018, 242, 338–347. [Google Scholar] [CrossRef]
  32. Qi, Y.; Yang, X.; Pelaez, A.M.; Huerta Lwanga, E.; Beriot, N.; Gertsen, H.; Garbeva, P.; Geissen, V. Macro- and Micro- Plastics in Soil-Plant System: Effects of Plastic Mulch Film Residues on Wheat (Triticum Aestivum) Growth. Sci. Total Environ. 2018, 645, 1048–1056. [Google Scholar] [CrossRef]
  33. Villalobos Zapata, G.J.; Mendoza Vega, J. La Biodiversidad En Campeche: Estudio de Estado, 1st ed.; Villalobos-Zapata, G.J., Mendoza Vega, J., Eds.; Comisión Nacional para el Conocimiento y Uso de la Biodiversidad: Mexico City, Mexico, 2010. [Google Scholar]
  34. Instituto Nacional de Estadística y Geografía. Prontuario de Información Geográfica Municipal de los Estados Unidos Mexicanos: Campeche. Available online: http://www3.inegi.org.mx/contenidos/app/mexicocifras/datos_geograficos/04/04002.pdf (accessed on 8 August 2018).
  35. Instituto Nacional de Estadística y Geografía. Guía para la Interpretación de Cartografía Climatológica. Available online: http://internet.contenidos.inegi.org.mx/contenidos/productos/prod_serv/contenidos/espanol/bvinegi/productos/historicos/1329/702825231781/702825231781_1.pdf (accessed on 28 March 2021).
  36. Comisión Nacional del Agua. Estaciones Climatológicas, Datos de la Estación 4063: EDZNA II. Available online: http://smn.conagua.gob.mx/tools/RESOURCES/Normales5110/NORMAL04063.TXT (accessed on 8 August 2018).
  37. Comisión Nacional del Agua. Estaciones Climatológicas, Datos de la Estación 4058: NOH YAXCHE. Available online: http://smn.conagua.gob.mx/tools/RESOURCES/Normales5110/NORMAL04058.TXT (accessed on 8 August 2018).
  38. Organisation for Economic Co-operation and Developmet. Guidance Document for Conducting Pesticide Terrestrial Field Dissipation Studies. Available online: http://www.oecd.org/officialdocuments/publicdisplaydocumentpdf/?cote=ENV/JM/MONO(2016)6&docLanguage=En (accessed on 31 July 2018).
  39. Environmental Protection Agency. Soil Sampling-Standard Operating Procedure ENV 3.13; Environmental Protection Agency: New York, NY, USA, 1997.
  40. Siewers, J.; Schirmel, J.; Buchholz, S. The Efficiency of Pitfall Traps as a Method of Sampling Epigeal Arthropods in Litter Rich Forest Habitats. Eur. J. Entomol. 2014, 111, 69–74. [Google Scholar] [CrossRef]
  41. McCravy, K.W. A Review of Sampling and Monitoring Methods for Beneficial Arthropods in Agroecosystems. Multidiscip. Digit. Publ. Inst. 2018, 9, 170. [Google Scholar] [CrossRef] [Green Version]
  42. Cheli, G.H.; Corley, J.C. Efficient Sampling of Ground-Dwelling Arthropods Using Pitfall Traps in Arid Steppes. Neotrop. Entomol. 2010, 39, 912–917. [Google Scholar] [CrossRef] [PubMed] [Green Version]
  43. Burch, J.B.; Cruz-Reyes, A. Clave Genérica Para La Identificación de Gastrópodos de Agua Dulce En México. México; Instituto de Biología, UNAM: Mexico City, Mexico, 1987. [Google Scholar]
  44. Comisión Nacional para el Conocimiento y Uso de la Biodiversidad. Catálogo de Autoridades Taxonómicas de Especies de Flora y Fauna con Distribución en México. Available online: https://www.snib.mx/taxonomia/descarga/ (accessed on 10 January 2021).
  45. Yang, X.; Wang, F.; Bento, C.P.M.; Xue, S.; Gai, L.; van Dam, R.; Mol, H.; Ritsema, C.J.; Geissen, V. Short-Term Transport of Glyphosate with Erosion in Chinese Loess Soil—A Flume Experiment. Sci. Total Environ. 2015, 512–513, 406–414. [Google Scholar] [CrossRef] [PubMed]
  46. Krüger, M.; Schledorn, P.; Schrödl, W.; Hoppe, H.-W.; Lutz, W.; Shehata, A.A. Detection of Glyphosate Residues in Animals and Humans. J. Environ. Anal. Toxicol. 2014, 4, 1–5. [Google Scholar] [CrossRef]
  47. Douros, D.L.; Gaines, K.F.; Novak, J.M. Atrazine and Glyphosate Dynamics in a Lotic Ecosystem: The Common Snapping Turtle as a Sentinel Species. Environ. Monit. Assess. 2015, 187, 114. [Google Scholar] [CrossRef]
  48. Zhang, S.; Yang, X.; Gertsen, H.; Peters, P.; Salánki, T.; Geissen, V. A Simple Method for the Extraction and Identification of Light Density Microplastics from Soil. Sci. Total Environ. 2018, 616–617, 1056–1065. [Google Scholar] [CrossRef] [PubMed] [Green Version]
  49. Herbert, L.T.; Vázquez, D.E.; Arenas, A.; Farina, W.M. Effects of Field-Realistic Doses of Glyphosate on Honeybee Appetitive Behaviour. J. Exp. Biol. 2014, 217, 3457–3464. [Google Scholar] [CrossRef] [PubMed] [Green Version]
  50. Arregui, M.C.; Lenardón, A.; Sanchez, D.; Maitre, M.I.; Scotta, R.; Enrique, S. Monitoring Glyphosate Residues in Transgenic Glyphosate-Resistant Soybean. Pest Manag. Sci. 2004, 60, 163–166. [Google Scholar] [CrossRef] [PubMed]
  51. Bento, C.P.M.; van der Hoeven, S.; Yang, X.; Riksen, M.M.J.P.M.; Mol, H.G.J.; Ritsema, C.J.; Geissen, V. Dynamics of Glyphosate and AMPA in the Soil Surface Layer of Glyphosate-Resistant Crop Cultivations in the Loess Pampas of Argentina. Environ. Pollut. 2019, 244, 323–331. [Google Scholar] [CrossRef] [PubMed]
  52. Yang, X.; Wang, F.; Bento, C.P.M.; Meng, L.; van Dam, R.; Mol, H.; Liu, G.; Ritsema, C.J.; Geissen, V. Decay Characteristics and Erosion-Related Transport of Glyphosate in Chinese Loess Soil under Field Conditions. Sci. Total Environ. 2015, 530–531, 87–95. [Google Scholar] [CrossRef]
  53. Benamú, M.A.; Schneider, M.I.; Sánchez, N.E. Effects of the Herbicide Glyphosate on Biological Attributes of Alpaida Veniliae (Araneae, Araneidae), in Laboratory. Chemosphere 2010, 78, 871–876. [Google Scholar] [CrossRef]
  54. Griesinger, L.M.; Evans, S.C.; Rypstra, A.L. Effects of a Glyphosate-Based Herbicide on Mate Location in a Wolf Spider That Inhabits Agroecosystems. Chemosphere 2011, 84, 1461–1466. [Google Scholar] [CrossRef] [PubMed]
  55. Rittman, S.; Wrinn, K.M.; Evans, S.C.; Webb, A.W.; Rypstra, A.L. Glyphosate-Based Herbicide Has Contrasting Effects on Prey Capture by Two Co-Occurring Wolf Spider Species. J. Chem. Ecol. 2013, 39, 1247–1253. [Google Scholar] [CrossRef] [PubMed]
  56. Michalková, V.; Pekár, S. How Glyphosate Altered the Behaviour of Agrobiont Spiders (Araneae: Lycosidae) and Beetles (Coleoptera: Carabidae). Biol. Control 2009, 51, 444–449. [Google Scholar] [CrossRef]
  57. Evans, S.C.; Shaw, E.M.; Rypstra, A.L. Exposure to a Glyphosate-Based Herbicide Affects Agrobiont Predatory Arthropod Behaviour and Long-Term Survival. Ecotoxicology 2010, 19, 1249–1257. [Google Scholar] [CrossRef] [PubMed]
  58. Helmer, S.H.; Kerbaol, A.; Aras, P.; Jumarie, C.; Boily, M. Effects of Realistic Doses of Atrazine, Metolachlor, and Glyphosate on Lipid Peroxidation and Diet-Derived Antioxidants in Caged Honey Bees (Apis Mellifera). Environ. Sci. Pollut. Res. 2015, 22, 8010–8021. [Google Scholar] [CrossRef] [PubMed]
  59. Yasmin, S.; D’Souza, D. Effect of Pesticides on the Reproductive Output of Eisenia Fetida. Bull. Environ. Contam. Toxicol. 2007, 79, 529–532. [Google Scholar] [CrossRef] [PubMed]
  60. Kim, S.K.; Kim, J.S.; Lee, H.; Lee, H.J. Abundance and Characteristics of Microplastics in Soils with Different Agricultural Practices: Importance of Sources with Internal Origin and Environmental Fate. J. Hazard. Mater. 2021, 403, 123997. [Google Scholar] [CrossRef]
  61. Liu, M.; Lu, S.; Song, Y.; Lei, L.; Hu, J.; Lv, W.; Zhou, W.; Cao, C.; Shi, H.; Yang, X.; et al. Microplastic and Mesoplastic Pollution in Farmland Soils in Suburbs of Shanghai, China. Environ. Pollut. 2018, 242, 855–862. [Google Scholar] [CrossRef]
  62. Zhang, G.S.; Liu, Y.F. The Distribution of Microplastics in Soil Aggregate Fractions in Southwestern China. Sci. Total Environ. 2018, 642, 12–20. [Google Scholar] [CrossRef]
  63. Piehl, S.; Leibner, A.; Löder, M.G.J.; Dris, R.; Bogner, C.; Laforsch, C. Identification and Quantification of Macro- and Microplastics on an Agricultural Farmland. Sci. Rep. 2018, 8, 17950. [Google Scholar] [CrossRef] [Green Version]
  64. Rezaei, M.; Riksen, M.J.P.M.; Sirjani, E.; Sameni, A.; Geissen, V. Wind Erosion as a Driver for Transport of Light Density Microplastics. Sci. Total Environ. 2019, 669, 273–281. [Google Scholar] [CrossRef]
  65. Chen, H.; Wang, Y.; Sun, X.; Peng, Y.; Xiao, L. Mixing Effect of Polylactic Acid Microplastic and Straw Residue on Soil Property and Ecological Function. Chemosphere 2020, 243, 125271. [Google Scholar] [CrossRef] [PubMed]
  66. Chang, F.; Simcik, M.F.; Capel, P.D. Occurrence and Fate of the Herbicide Glyphosate and Its Degradate Aminomethylphosphonic Acid in the Atmosphere. Environ. Toxicol. Chem. 2011, 30, 548–555. [Google Scholar] [CrossRef] [PubMed]
  67. Vicini, J.L.; Jensen, P.K.; Young, B.M.; Swarthout, J.T. Residues of Glyphosate in Food and Dietary Exposure. Compr. Rev. Food Sci. Food Saf. 2021, 20, 5226–5257. [Google Scholar] [CrossRef] [PubMed]
  68. Nguyen, N.K.; Dörfler, U.; Welzl, G.; Munch, J.C.; Schroll, R.; Suhadolc, M. Large Variation in Glyphosate Mineralization in 21 Different Agricultural Soils Explained by Soil Properties. Sci. Total Environ. 2018, 627, 544–552. [Google Scholar] [CrossRef] [PubMed]
  69. Anderson, J.M. Cycling in Ecosystems Invertebrate-Mediated Transport Processes in Soils. Agric. Ecosyst. Environ. 1988, 24, 5–19. [Google Scholar] [CrossRef]
  70. Jänsch, S.; Frampton, G.K.; Römbke, J.; Van Den Brink, P.J.; Scott-Fordsmand, J.J. Effects of Pesticides on Soil Invertebrates in Model Ecosystem and Field Studies: A Review and Comparison with Laboratory Toxicity Data. Environ. Toxicol. Chem. 2006, 25, 2490–2501. [Google Scholar] [CrossRef]
  71. Bastida Tapia, A. Evolución y Situación Actual de La Agricultura Protegida En México. Available online: https://www.berger.ca/es/recursos-para-los-productores/tips-y-consejos-practicos/estado-actual-la-agricultura-protegida-mexico/ (accessed on 28 September 2020).
  72. Chanatásig-Vaca, C.I.; Huerta Lwanga, E.; Rojas Fernández, P.; Ponce-Mendoza, A.; Mendoza Vega, J.; Morón Ríos, A.; Van der Wal, H.; Dzib-Castillo, B.B. Efecto Del Uso de Suelo En Las Hormigas (Formicidae: Hymenoptera) de Tikinmul, Campeche, México. Acta Zoológica Mexicana 2011, 27, 441–461. [Google Scholar] [CrossRef]
  73. Frampton, G.K.; Jänsch, S.; Scott-Fordsmand, J.J.; Römbke, J.; Van den Brink, P.J. Effects of Pesticides on Soil Invertebrates in Laboratory Studies: A Review and Analysis Using Species Sensitivity Distributions. Environ. Toxicol. Chem. 2006, 25, 2490–2501. [Google Scholar] [CrossRef] [PubMed]
  74. Comité International des PLastiques en Agriculture. Plasticulture: Definition. Available online: http://cipa-plasticulture.com/ (accessed on 28 March 2018).
  75. Centro de Investigación en Química Aplicada. Plásticos en la Agricultura. Available online: http://www.ciqa.mx/index.php/departamentos/19-plasticos-en-la-agricultura (accessed on 17 August 2017).
  76. Servicio de Información Agroalimentaria y Pesquera. Datos Abiertos: Superficie Cubierta y Número de Instalaciones de Agricultura Protegida SIAP. Available online: http://infosiap.siap.gob.mx/gobmx/datosAbiertos.php (accessed on 28 March 2018).
  77. Addison, P.; Baauw, A.H.; Groenewald, G.A. An Initial Investigation of the Effects of Mulch Layers on Soil-Dwelling Arthropod Assemblages in Vineyards. S. Afr. J. Enol. Vitic. 2013, 34, 266–271. [Google Scholar] [CrossRef] [Green Version]
  78. Miñarro, M.; Espadaler, X.; Melero, V.X.; Suárez-Álvarez, V. Organic versus Conventional Management in an Apple Orchard: Effects of Fertilization and Tree-Row Management on Ground-Dwelling Predaceous Arthropods. Agric. For. Entomol. 2009, 11, 133–142. [Google Scholar] [CrossRef]
  79. Tuovinen, T.; Kikas, A.; Tolonen, T.; Kivijärvi, P. Organic Mulches vs. Black Plastic in Organic Strawberry: Does It Make a Difference for Ground Beetles (Col., Carabidae)? J. Appl. Entomol. 2006, 130, 495–503. [Google Scholar] [CrossRef]
  80. Sunderland, K.D. The Diet of Some Predatory Arthropods in Cereal Crops. J. Appl. Ecol. 1975, 12, 507. [Google Scholar] [CrossRef]
  81. Zhu, D.; Bi, Q.-F.; Xiang, Q.; Chen, Q.-L.; Christie, P.; Ke, X.; Wu, L.-H.; Zhu, Y.-G. Trophic Predator-Prey Relationships Promote Transport of Microplastics Compared with the Single Hypoaspis Aculeifer and Folsomia Candida. Environ. Pollut. 2018, 235, 150–154. [Google Scholar] [CrossRef] [PubMed]
  82. Orpet, R.J.; Goldberger, J.R.; Crowder, D.W.; Jones, V.P. Field Evidence and Grower Perceptions on the Roles of an Omnivore, European Earwig, in Apple Orchards. Biol. Control 2019, 132, 189–198. [Google Scholar] [CrossRef]
  83. Romeu-Dalmau, C.; Piñol, J.; Espadaler, X. Friend or Foe? The Role of Earwigs in a Mediterranean Organic Citrus Orchard. Biol. Control 2012, 63, 143–149. [Google Scholar] [CrossRef]
  84. Winkler, K.; de Sytske, W.; Helsen, H. Feeding Pattern during the Nesting Phase of the European Earwig Forficula Auricularia. Available online: https://edepot.wur.nl/400560 (accessed on 25 July 2020).
  85. Thompson, R.C.; Swan, S.H.; Moore, C.J.; Vom Saal, F.S. Our Plastic Age. Philos. Trans. R. Soc. B Biol. Sci. 2009, 364, 1973–1976. [Google Scholar] [CrossRef] [Green Version]
  86. Uribe-Hernández, R.; Juárez-Méndez, C.H.; De Montes Oca, M.A.; Palacios-Vargas, J.G.; Cutz-Pool, L.; Mejía-Recarmier, B.E. Collembola (Hexapoda) as Quality Bioindicators of the Hydrocarburans Polluted Soils in Southestern Mexico. Rev. Mex. Biodivers. 2010, 81, 153–162. [Google Scholar] [CrossRef] [Green Version]
  87. Zhu, D.; Chen, Q.L.; An, X.L.; Yang, X.R.; Christie, P.; Ke, X.; Wu, L.H.; Zhu, Y.G. Exposure of Soil Collembolans to Microplastics Perturbs Their Gut Microbiota and Alters Their Isotopic Composition. Soil Biol. Biochem. 2018, 116, 302–310. [Google Scholar] [CrossRef]
  88. Ju, H.; Zhu, D.; Qiao, M. Effects of Polyethylene Microplastics on the Gut Microbial Community, Reproduction and Avoidance Behaviors of the Soil Springtail, Folsomia Candida. Environ. Pollut. 2019, 247, 890–897. [Google Scholar] [CrossRef]
Figure 1. Location of the study area and the plots with the different production systems. AwPM = agriculture system with plastic mulch and GLY; AwPM = agriculture with plastic mulch and GLY; AwoPM = agriculture without plastic mulch and the use of GLY; UF = unmanaged farming system.
Environments 08 00130 g001
Figure 2. Transect and plot sampling design.
Environments 08 00130 g002
Figure 3. (a) Soil GLY concentration (GLYsoil) and (b) soil AMPA concentration (AMPAsoil) per system. Each small square indicates an outlier, + = mean, middle horizontal line in the box indicates median, n = number of sampling points for statistical analysis, dotted line indicates the LOD. Different geometric figures implies significantly different groups (Mann–Whitney U test, p < 0.05). AwPM = agriculture with plastic mulch and GLY; AwoPM = agriculture without plastic mulch and the use of GLY; UF = unmanaged farming system.
Environments 08 00130 g003
Figure 4. GLY concentration in invertebrate tissue (GLYinv) per system. Each small square indicates an outlier, + = mean, middle horizontal line in the box indicates median, n = number of sampling points for statistical analysis, dotted line indicates the LOD. Different geometric figures implies significantly different groups (Mann–Whitney U test, p < 0.05. AwPM = agriculture with plastic mulch and GLY; AwoPM = agriculture without plastic mulch and the use of GLY; UF = unmanaged farming system.
Environments 08 00130 g004
Figure 5. Microplastic counts (MPs) per system. Each small square indicates an outlier, + = mean, middle horizontal line indicates median, n = number of sampling points to statistical analysis. Different geometric figures implies significantly different groups (Mann–Whitney U test, p < 0.05). AwPM = agriculture with plastic mulch and GLY; AwoPM = agriculture without plastic mulch and the use of GLY; UF = unmanaged farming system.
Environments 08 00130 g005
Figure 6. (a) Number of individuals per sampling point (#inds SP−1), (b) the number of morphospecies per sampling point (#mphs SP−1) and (c) Shannon diversity index per sampling point (H SP−1) in each system. Each small square indicates an outlier, + = mean, middle horizontal line indicates median, n = number of sampling points for statistical analysis. Different geometric figures implies significantly different groups (Mann–Whitney U test, p < 0.05). AwPM = agriculture with plastic mulch and GLY; AwoPM = agriculture without plastic mulch and use of GLY; UF = unmanaged farming system.
Environments 08 00130 g006
Figure 7. Composition of above-ground dwellers. Mean number of individuals per sampling point (#ind SP−1) of (a) least dominant and (b) most dominant orders. Arach= Arachnida, Arae = Araneae, Bttd = Blattodea, Chpd = Chilopoda, Cllb = Colembolla, Colop = Coleoptera, Dppd = Diplopoda, Dptr = Dermaptera, Etmb = Entomobryomorpha, Gphm = Geophilomorpha, Gstd = Gastropoda, Hmpt = Hemiptera, Istp = Isoptera, Jlda = Julida, Lmnph = Limnophila, Lpdp = Lepidoptera, Mgstd = Mesogastropoda, Opln = Opiliones, Orth = Orthoptera, Plyda = Polydesmida, Sphnt = Siphonaptera, Sypla = Symphypleona. AwPM = agriculture with plastic mulch and GLY; AwoPM = agriculture without plastic mulch and the use of GLY; UF = unmanaged farming system: SP = sampling point.
Environments 08 00130 g007
Figure 8. Composition of above-ground dwellers. Mean number of morphospecies per sampling point (#mphs.SP−1) of (a) least dominant and (b) most dominant orders. Arach= Arachnida, Arae = Araneae, Bttd = Blattodea, Chpd = Chilopoda, Cllb = Colembolla, Colop = Coleoptera, Dppd = Diplopoda, Dptr = Dermaptera, Etmb = Entomobryomorpha, Gphm = Geophilomorpha, Gstd = Gastropoda, Hmpt = Hemiptera, Istp = Isoptera, Jlda = Julida, Lmnph = Limnophila, Lpdp = Lepidoptera, Mgstd = Mesogastropoda, Opln = Opiliones, Orth = Orthoptera, Plyda = Polydesmida, Sphnt = Siphonaptera, Sypla = Symphypleona. AwPM = agriculture with plastic mulch and GLY; AwoPM = agriculture without plastic mulch and the use of GLY; UF = unmanaged farming system: SP = sampling point.
Environments 08 00130 g008aEnvironments 08 00130 g008b
Table 1. Study site characterization in Alfredo V. Bonfil, Campeche, Mexico.
SystemCharacteristicsGlyphosate Application
AwPM (agriculture with plastic mulch)AwPM1: Active cultivation of Cucurbita pepo pepo, using plastic mulch since 2016. Drip irrigation since November 2018, use of low-density polyethylene (LDPE) plastic film but no mulch during sampling. Use of fungicide (Benzimidazole, Boscalid, Carbendazim, Chlorothalonil, Pyraclostrobin), herbicide (Glyphosate) and insecticide (Imidacloprid).Application by tractor in November 2018 (1.5 L 150 L−1 of water per hectare) and some sporadic applications (2–3 backpacks, each backpack = 200 cm3 20 L−1 of water per hectare) mainly on the periphery and patches of grass between bushes.
AwPM2: Freshly laid crop of Carica papaya, using mulch since 1998. Use of LDPE plastic film but no mulch during sampling. Use of acaricide (Abamectin, Etoxazole), fungicide (Thiophanate methyl, Boscalid, Carbendazim) and herbicide (Glyphosate).Before planting papayas in 2016. Fumigation with 1 L 200 L−1 of water per hectare.
AwoPM (agriculture without plastic mulch)Both plots had dormant cultivation of Glycine max. Mennonite management. Use of herbicide (Glyphosate) and other unrecorded pesticides.At the end of June and July, as well as in September 2018. Each spraying with 1 L 200 L−1 of water per hectare.
UF (Natural unmanaged farming)UF1: Unmanaged secondary forest in regeneration since 1980.No glyphosate application.
UF2: Vegetation not exploited since late 1970s within Archaeological Zone of Edzná.
Publisher’s Note: MDPI stays neutral with regard to jurisdictional claims in published maps and institutional affiliations.

