Article

From Boiling to Frozen? The Rise and Fall of International Tourism to Iceland in the Era of Overtourism

by
Anna Dóra Sæþórsdóttir
1,*,
C. Michael Hall
2,3 and
Margrét Wendt
1
1
Department of Geography & Tourism, Faculty of Life and Environmental Sciences, University of Iceland, 102 Reykjavík, Iceland
2
Department of Management, Marketing and Entrepreneurship, University of Canterbury, Christchurch 8140, New Zealand
3
Department of Service Management and Service Studies, Lund University Helsingborg, SE-251 08 Helsingborg, Sweden
*
Author to whom correspondence should be addressed.
Environments 2020, 7(8), 59; https://doi.org/10.3390/environments7080059
Submission received: 10 July 2020 / Revised: 25 July 2020 / Accepted: 30 July 2020 / Published: 3 August 2020

Abstract

:
Overtourism has emerged as a common concept to describe the perceived negative impacts that large numbers of tourists can have on destinations. Iceland is one of the destinations which has been most associated with the concept of overtourism. Tourism in Iceland grew rapidly from 2010 to 2019, much higher than in most other countries, with Iceland reaching a ranking as high as thirteenth on a list of countries with the highest ratio of tourists per inhabitant. The increase in visitors to the country has had various impacts on Iceland’s economy, society and environment. This paper provides an overview of the different ways in which overtourism has revealed itself at a national level in Iceland. The implications of supposed overtourism are shown to be complex, with management responses limited by their relative focus.

1. Introduction

Large influxes of tourists have become a major management challenge for many destinations. Among reasons for the growing number of tourists are increased accessibility and decreased travel costs, in particular through the availability of cheap airfares and the availability of alternative and affordable accommodation, through online platforms. The media also plays a significant role in influencing travel demand and trends, including with respect to highlighting particular activities and destinations [1,2,3,4]. For some destinations and attractions, tourist growth has caused problems with crowding that are reflected in the quality of tourists’ experiences, the quality of life of the local inhabitants, and concerns over the supposed decline of destinations as infrastructure and image are affected [5]. Although these topics have long been a concern of tourism researchers and managers, these issues have become crystallised in the media in the concept of overtourism and, increasingly, in academia as a shorthand way of describing this situation [6].
Iceland is one of the destinations which has been most associated with the concept of overtourism in the international media. Iceland, has shifted from being described in 2010 when the number of international visitors to Iceland was about 460,000 as the ‘once well-kept secret of Europe’ [7], to a destination where by 2018 arrivals had reached approximately 2.3 million [8] and it was stated that ‘overtourism poses a genuine threat, both socially and environmentally’ [7]. While two million visitors is not many in global terms, Iceland is the most sparsely populated country in Europe, with only about 350,000 inhabitants on an island of just over 103,000 km2 [9]. Tourism had become the largest export sector [10] and by 2019 Iceland had reached thirteenth on the list of countries with the highest ratio number of tourists per inhabitant in the world (6.5:1) [11], the majority of which are islands (Table 1). However, due to the size of the country, there are not that many tourists per square kilometer compared to the other countries on the list. Iceland is also the only high-latitude destination on the high ratio of tourists to inhabitant list, and whose main attraction is wild nature. Accordingly, Iceland provides a potentially valuable case for observing responses to overtourism.
Tourism accommodation is concentrated in Iceland’s capital, Reykjavik [12]. Crowding at the most popular destinations has led to a decrease in the quality of the tourist experience [12], infrastructure, and landscapes [13]. However, in 2019 the number of monthly visitors compared to the previous year fell every month of the year, with a total decline in arrivals of 14.1% over the previous year [8]. This was the first annual decline in arrivals since 2010.
The aim of this paper is to give an overview of the different ways in which overtourism reveals itself at a national level in Iceland. It centers around existing research about tourism, crowding and tourism carrying capacity in Iceland and is based on a secondary data analysis strategy [14], focusing on studies which relate to residents’ attitudes, tourists’ attitudes, tourism’s impact on nature and the state of Iceland’s infrastructure and economy. As argued by Callahan [15], analyzing the existing data and literature helps to identify synergies and gaps in knowledge. By doing so, one can ‘reach new forms of understanding and working theories based on diverse evidence’ [14]. Data were primarily derived from three electronic databases: leitir.is, the data base of the Icelandic Tourism Research Center, and that of the Icelandic Tourist Board, as well as an analysis of bibliometric databases. In addition, the literature review included reports and articles from public organizations, such as the Environment Agency of Iceland and Ministries.
The results present how overtourism manifests itself in Iceland, from the growth of the industry, its economic impacts, the experience of tourists to its impact on residents, nature and infrastructure. The paper concludes by discussing reasons for and reactions to overtourism.

2. Background

2.1. The Overtourism Concept

The basic issues of overtourism have been a concern of research on tourism and outdoor recreation since, at least, the 1960s [16]. However, terminologies to describe tourist pressure on destinations and attractions have shifted over time. For example, in the 1980s and 1990s, tourism carrying capacity (TCC) morphed into overcrowding and sustainability [17,18] and has, more recently, been reframed as overtourism. These concepts all share the same key essence which is to describe when a destination reaches the tipping point of what a place can tolerate, or to use each concept’s terminology: when it reaches its carrying capacity/becomes unsustainable/has too many visitors. Therefore, TCC is fundamentally the threshold or limit that indicates the point at which the condition becomes unsustainable, putting the destination in a state of overtourism.
According to Swarbrooke [19] there are six types of TCC: (i) Physical capacity is the number of tourists that can physically be in a given site, based on its geographical space. (ii) Environmental capacity is the number of tourists a site can receive before the physical environment gets spoilt. (iii) Economic capacity is the number of tourists a site can accommodate before the economic life of the local inhabitants begins to be unfavorable for the area. (iv) Infrastructure capacity is the number of tourists a site can accommodate before the infrastructure becomes unable to deal with the number of visitors in a sufficient way. (v) Sociocultural capacity is the number of tourists that can visit a destination before the local population perceives their community to be negatively affected by visitors. (vi) Perceptual capacity is the number of tourists an area can accommodate before the experience of the visitors gets spoiled due to other visitors.
The issues of overtourism and carrying capacity, are closely related to some of the most fundamental questions in environmental management, that is, to what extent humans can utilize the environment sustainably without destroying its most valuable aspects. This approach is based on the assumption that there is a limit to growth [17]. In the context of (over)tourism, this question can be phrased: how many visitors can visit a tourist destination without diminishing the quality of life of residents, the quality of experiences of tourists, and/or the quality of the physical environment? Thus, one of the earliest responses to manage overconsumption was to set ‘caps’ or limits on the number of tourists at a destination [20].
Overtourism is therefore directly linked to the longstanding concerns regarding the overuse of the ‘commons’ [21] and the potential ‘tragedy’ of their demise. The principle addresses that there are limits to the utilization of resources or a specific environment while overtourism similarly describes ‘overconsumption’ of destination resources [3,4,17]. The notion of carrying capacity provides one of the foundations for Butler’s [22] model of the tourism area life cycle, where it is argued that reaching a destination’s TCC will lead to its decline and loss of attractiveness. In other words, it would become a victim of overtourism.
However, setting ‘caps’ or ‘limits’ has mostly been limited to single sites rather than entire destinations [2] and is extremely challenging as a policy measure. One reason for this is that many governments and industry stakeholders believe that limiting tourist numbers would also place a limit on economic returns [2,3,4,23,24], while Hall [25] also argues that many decision makers regard growth as an inherent good.

2.2. Overtourism and Crowding

At the destination level, overtourism primarily manifests itself as crowding—whether in terms of public and private spaces or even with respect to competition for housing. The concept of crowding has been a recurring topic of tourism research since the early 1970s. According to Stokols [26] seminal paper crowding is the psychological and physical stress arising from perceived human density. The triggers of that feeling are highly complex and interrelated with societal and situational problems. Stokols [26] distinguishes between non-social and social crowding. Non-social crowding depends on spatial factors such as the space available and its design and can be triggered by, for example, noise and visual stimulants. Social crowding depends on the presence of other people, as well as on the connection between them, e.g., people might experience crowding with a group of strangers, while they would be happy with the same number of friends. Crowding is usually perceived when the sociocultural carrying capacity is overstepped, which in turn is mostly defined by social or personal norms [27,28,29,30,31].
Crowding can also bring about various negative impacts on the physical environment. The impact depends on the settings but usually nature destinations are more sensitive towards high visitation than urban areas [32]. Common negative impacts on natural areas include trampling, littering, ecosystem disturbance, and water pollution. However, impacts of overtourism on the physical environment of a destination often have consequences for how tourists as well as residents perceive the quality of the area, although knowledge and social concern may affect how such impacts are seen [33].
In contrast to natural environments, urban areas usually have better infrastructure and can therefore welcome comparably more visitors without causing physical damage. However, cities are not immune to the effects of overtourism in terms of physical change, or what Koens et al. [34] describe as ‘physical touristification of city centres and other often-visited areas’, that can lead to a loss of resident amenities [5]. Other negative urban impacts of overtourism include increased noise, localised inflation, and housing availability, to name a few [1,34]. These negative impacts can, in turn, decrease resident’s quality-of-life and generate negative attitudes towards tourists [35,36,37]. However, as pointed out by Goodwin [4], this conceptualisation is an oversimplification of a complicated situation as different residents in different destinations experience tourism in different ways. While residents in certain communities may prefer minor tourism development, others may favour greater development [35].
In the same way that tourists’ presence can disturb residents, it can also cause irritation among tourists themselves. Crowding is often a main reason for dissatisfaction with a destination [38,39]. Just like residents, tourists will also have different perceptions of overtourism, based on their cultural background, the activities they engage in, and the setting [4].
According to Manning [17] there are three variables which influence the perception of crowding in natural areas, such as those which are the focal point for tourism in Iceland. First, perceived crowding is influenced by the characteristics of an individual, including the type of activity they are engaged in [40]. Secondly, it is also influenced by the characteristics of those an individual encounters and their activities [41]. Third, the situation context of the encounter affects the perception of crowding [4,40]. For instance, tolerance for congestion is much higher in urban areas than natural ones [42]. However, in some situations, crowding may be perceived more positively. For example, if many people travel to the same destination, this can be perceived as an indication that one is ‘in the right place’ [2]. In addition, it can provide tourists with a feeling of belonging and safety [43]. Nevertheless, the concept of overtourism is generally associated more with negative impacts which require management responses [2,24].

3. Results: Manifestations of Overtourism in Iceland

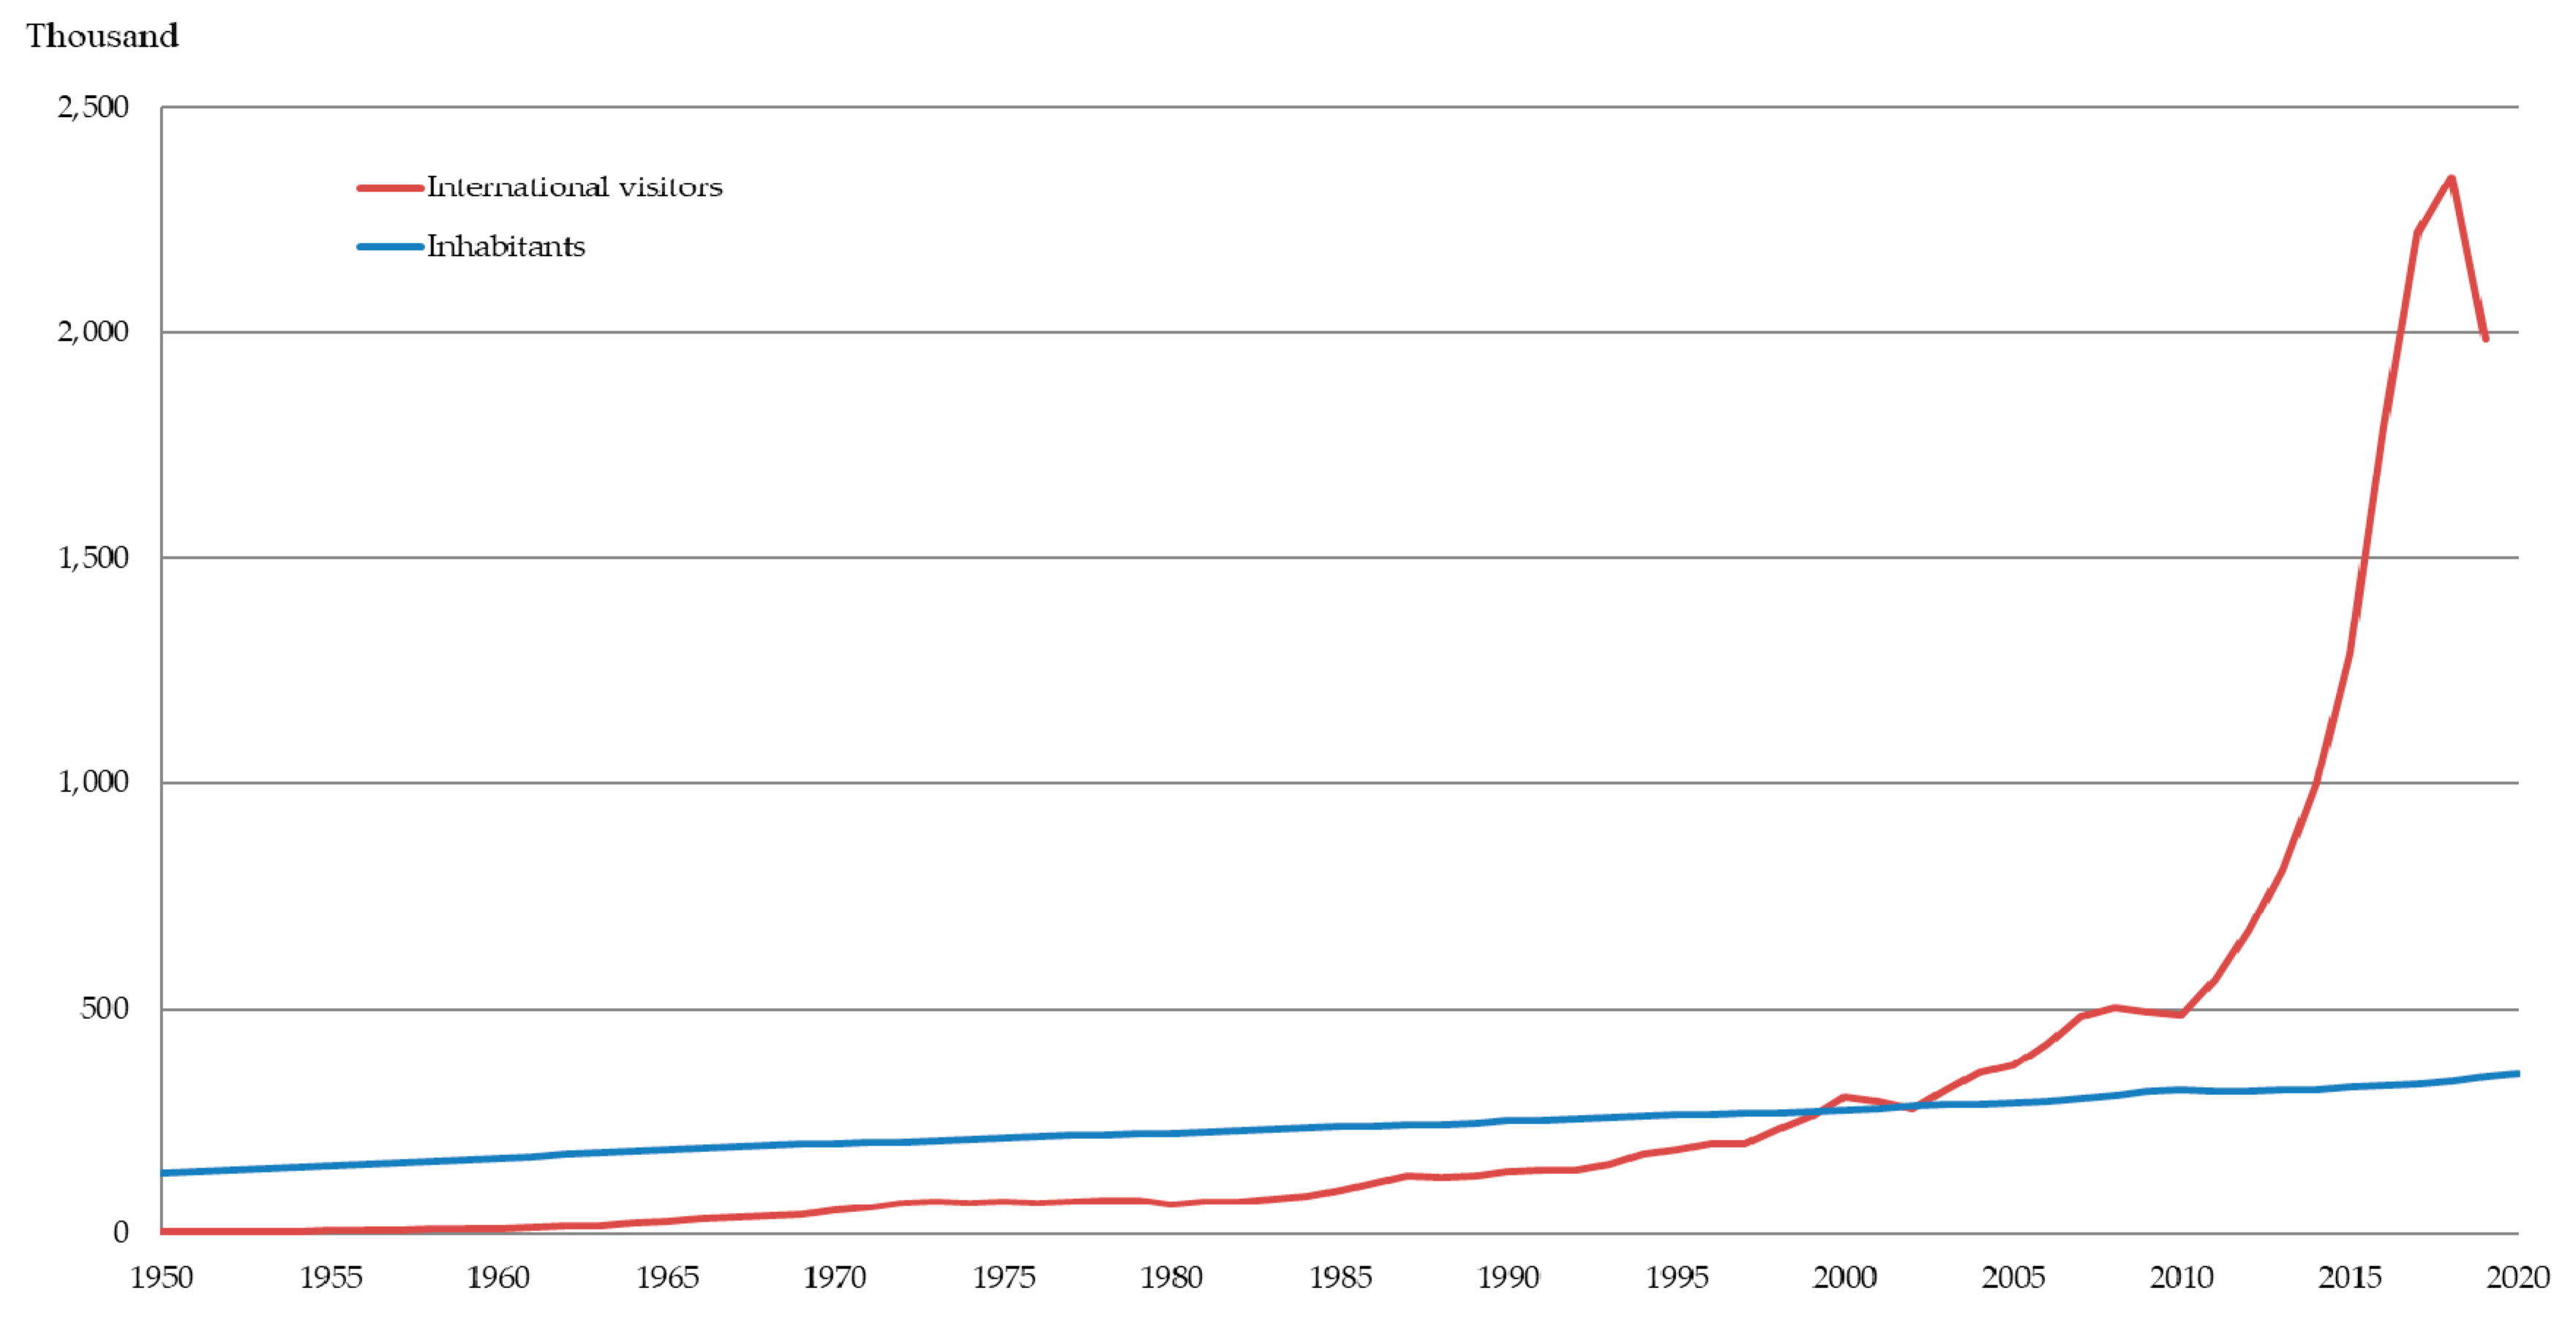
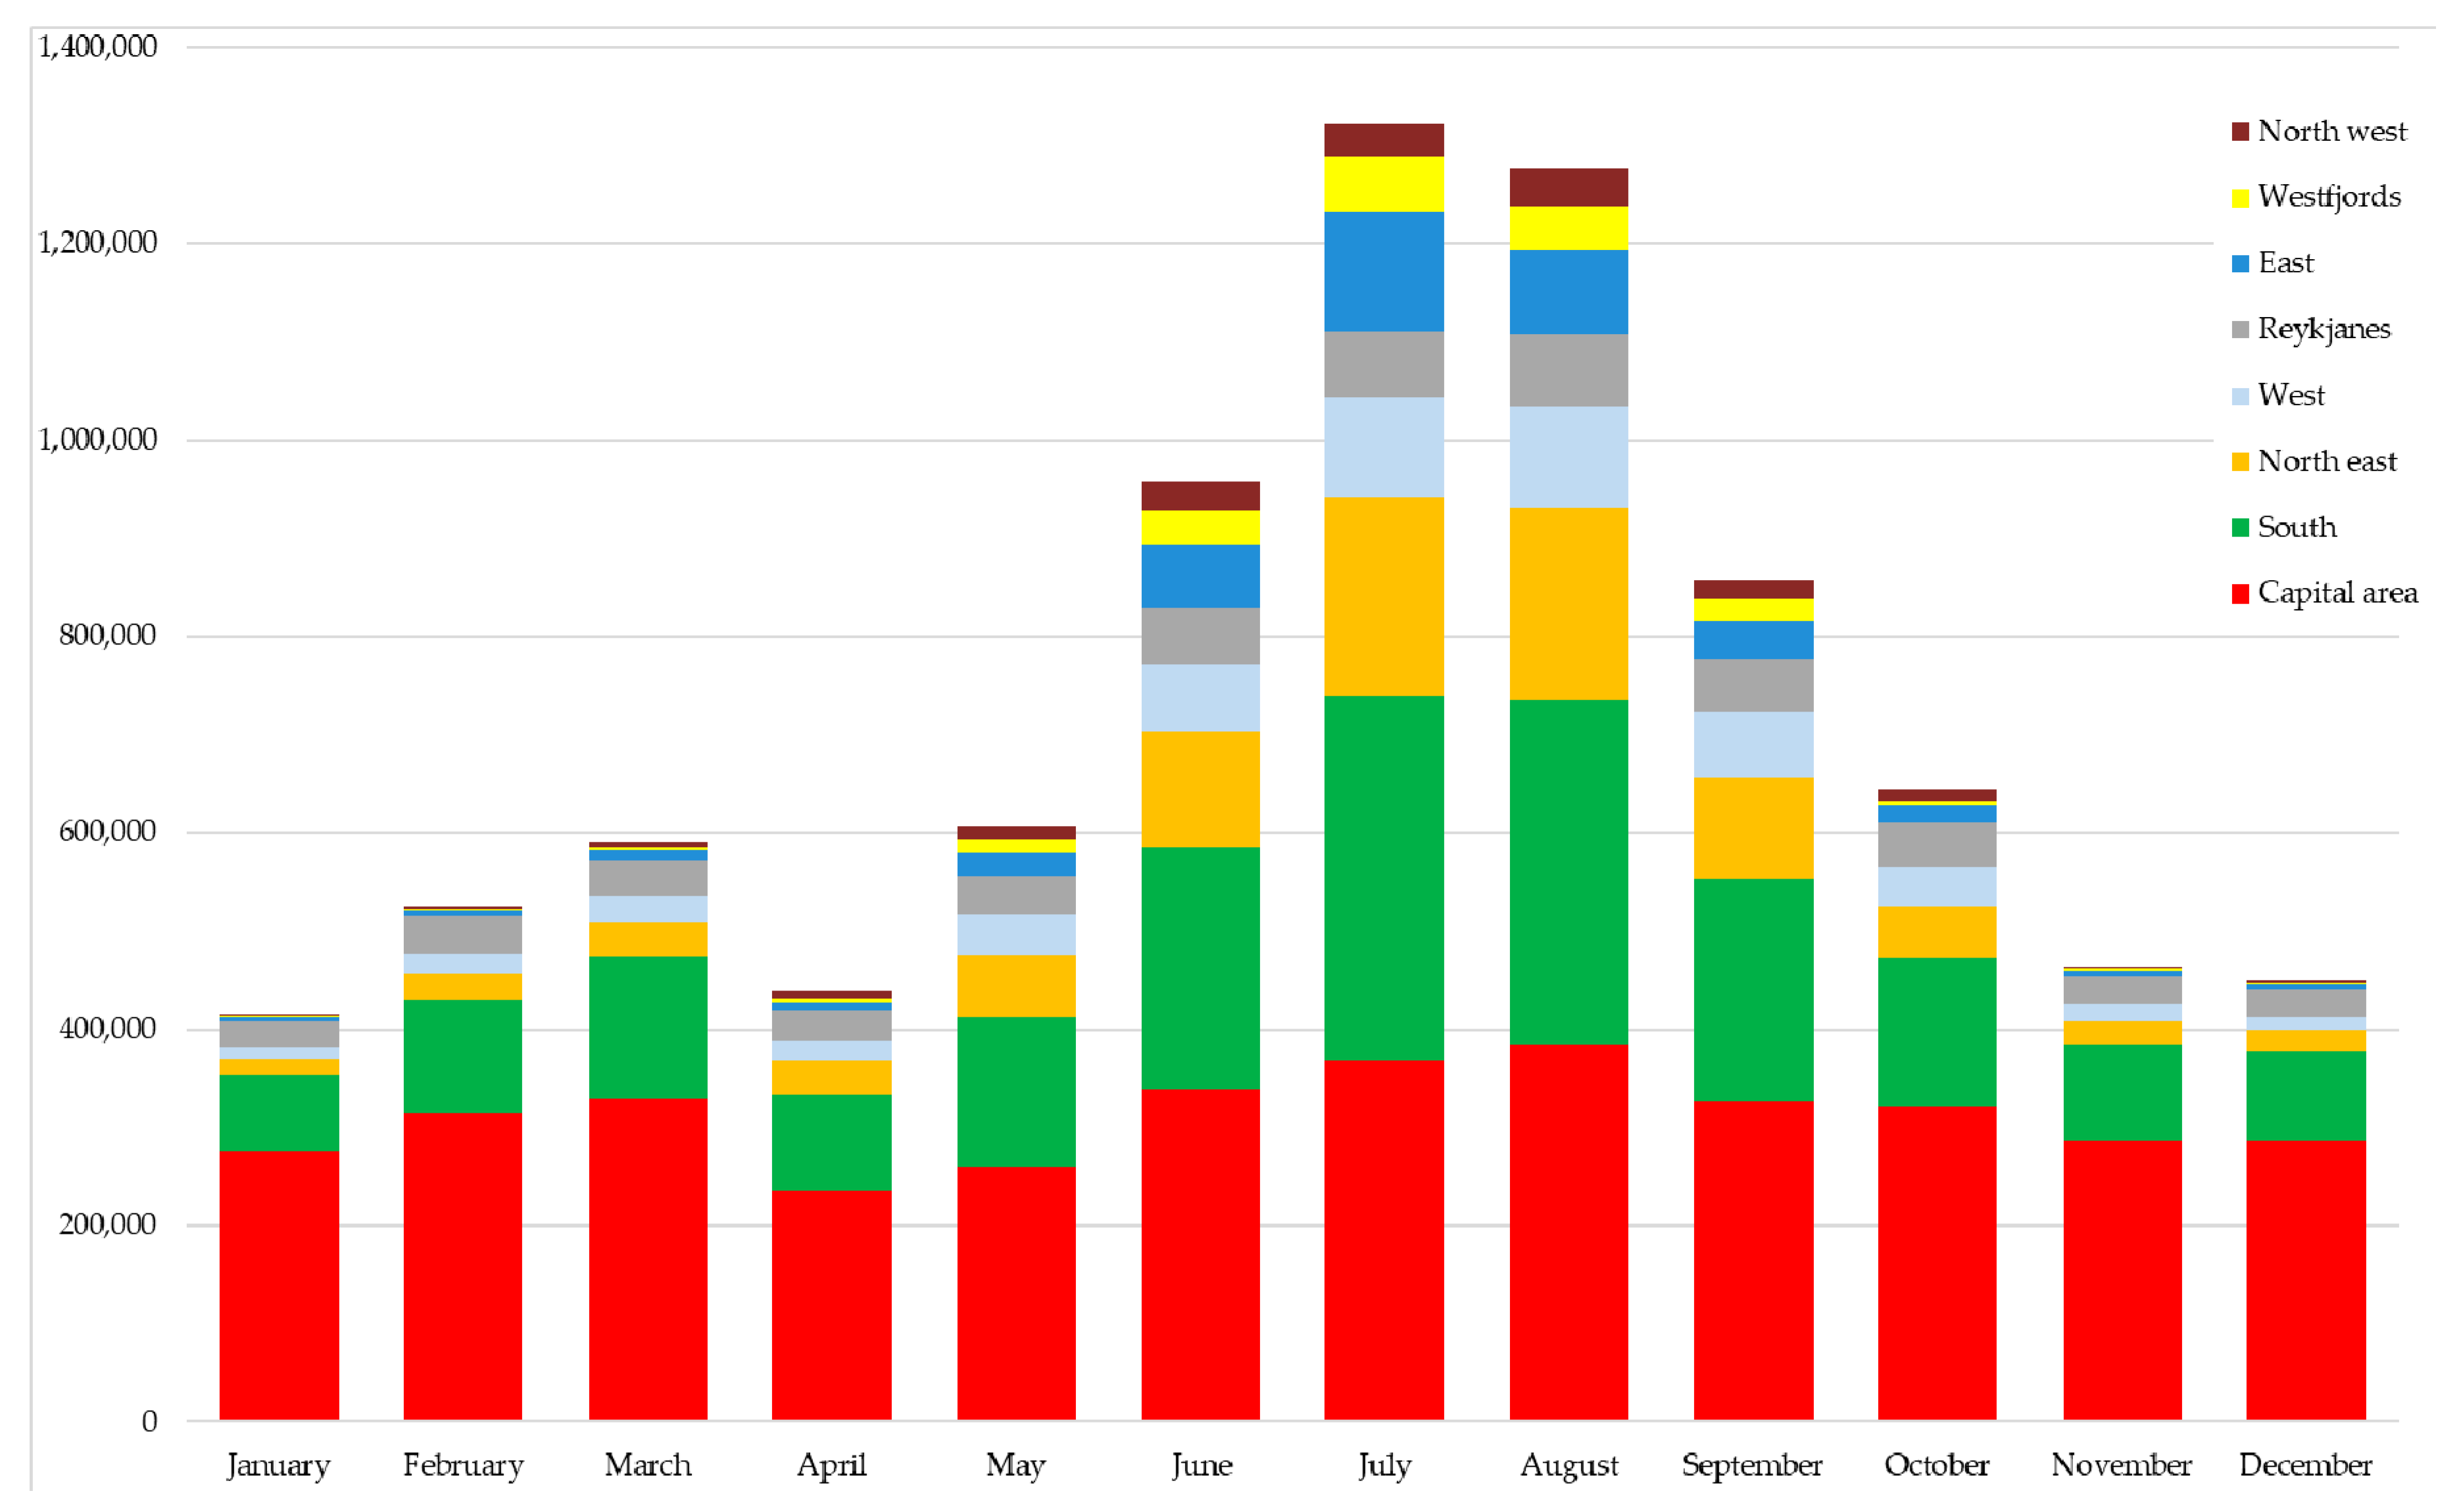
3.1. The Growth of Tourism in Iceland

Iceland is located just south of the Arctic Circle in the North Atlantic. Due to its geographical isolation, very few travellers came to the island until the late 18th century when scientists and well-educated aristocrats visited with the aim to study its wild landscape created by ‘fire and ice’ [44]. In the Nineteenth century pleasure travellers arrived to enjoy Romantic ‘sublime’ Icelandic nature which laid much of the foundation for the imaging of Iceland to the present day. The places mostly visited were nature destinations like the Þingvellir national park which is also a UNESCO World Heritage Site, Geysir hot spring area, Gullfoss—the ‘golden’ waterfall, the Snæfellsnes peninsula in West Iceland and Mývatn lake in the North of Iceland as well as towns like Reykjavík and Akureyri, which remain focal points for tourism to the present day [44]. Indeed, ‘nature’ remains the main reason that tourists visit Iceland. When tourists are asked about the reasons for visiting, 92% say that Iceland’s ‘unique’ and ‘unspoiled’ nature as well as various natural phenomena such as geothermal areas, waterfalls, glaciers, volcanoes and northern lights contributed to their decision of travelling to Iceland [45].
Transportation in Iceland was for a long time very poor, both between Iceland and Europe but also within the country due to its large glacial rivers and vast lava fields. Almost all settlement in Iceland is below 200 m and is scattered along the coast. The interior of the country is called the Central Highlands and covers about 40% of the country [46]. That area is uninhabited and is often referred to as one of the largest remaining wilderness areas in Europe [44]. At the beginning of the 20th century there were mainly horse and walking trails. Bridges did not exist in Iceland until the 1890s when the first two were built over the largest glacial rivers on the south coast. Gradually, the so-called ring road was built around the country’s coastline, but this was not completed until 1974 when the last bridges were built over the rivers coming from the Vatnajökull glacier.
The biggest milestone for the development of tourism was when the first international flights started in 1945 and, a decade later, the first transatlantic flights. At that time about 5,000 visitors came to Iceland. Since 1950 the average annual growth in visitor arrivals has been about 10%. Declines in visitor arrivals only occurred in the 1970s (international oil crisis), 2001 (9/11), 2009 (financial crisis) and after the Eyjafjallajökull eruption in 2010. A dramatic increase in tourist arrivals began in 2010 (Figure 1) growing from nearly 500,000 to 2.3 million in 2018. Between 2010 and 2018, tourist arrivals had an annual average increase of approximately 22%, with a 39% increase in tourist arrivals in 2016 [8]. There has also been substantial growth in cruise ship passenger arrivals from about 100,000 passengers in 2015 to over 180,000 in 2019, representing a 22% average annual increase. However, for the first time in a decade, the total number of international visitors to Iceland declined in 2019 by 14.1% from the previous year [8].
The growth in international visitor arrivals to Iceland during 2010–2019 has been higher than most other countries [47]. During this period, the average annual growth in visitor arrivals to Iceland was 17% compared to 6% in Europe and 6% globally [48].
There are several possible explanations for the sudden rise of tourism in Iceland. Due to the financial crisis in 2008, the value of the local currency (the Icelandic Krona ISK) decreased drastically. Consequently, travelling to Iceland became more affordable [49]. Two years later, the eruption of the volcano Eyjafjallajökull and the consequent disruption of air traffic across all of Europe created international discussion about Iceland. The government, industry and tourism organisations were worried that the volcanic eruption would decrease visitation to the country and therefore started a promotional campaign under the name ‘Inspired by Iceland’ [50]. What followed was an increase in media attention about Iceland and many popular travel websites began publishing promotional material about the country, including National Geographic’s Best of the World [51] and Fodor’s Travel Best of Europe 2012—Emerging Hot Spots [52]. Iceland and Reykjavík also won Lonely Planet’s Travel Readers’ Choice award [53,54]. Iceland was also used as a location in popular television shows like Game of Thrones and films including Oblivion, Interstellar and The Secret Life of Walter Mitty. The number of flights also increased. While there were eleven airlines flying to and from Keflavík Airport during the summer of 2009 [55], there were 30 airlines in 2018 [56].
Tourists are dispersed unevenly around the country, both in time and space. Seasonality has long been a challenge with a relatively short high season in the summer (June–August). This is, for example, reflected in the distribution of overnight stays, with about 42% of all overnight stays in the country concentrated in the three summer months. Nevertheless, seasonality has decreased, with the proportion of tourists arriving in the three summer months dropping from 50% in 2010 to 34% in 2019 [57].
The uneven geographical distribution of visitors is reflected in that 44% of all overnight stays occur in the capital area, 25% in the South and 10% in the Northeast (Figure 2). The Northwest and the Westfjords receive only 2% of overnight stays each. While seasonality has diminished quite dramatically in the capital area, it remains very high elsewhere. About 70% of all overnight stays in the East and in the Westfjords are in the summer and over half in the Northeast and West [58]. Approximately 92% of international visitors visited Reykjavík. The most popular nature destinations are in the south such as the Geysir hot spring area, which was visited by 82% of international visitors, Þingvellir (70%) and Jökulsárlón glacier lagoon (52%) and, in the north, Mývatn lake (73%) [45].

3.2. Iceland’s Boom and Bust Economy

The Icelandic economy is highly export-driven and dependent on foreign trade. As a resource dependent economy, Iceland has experienced multiple boom–bust cycles [49]. According to Einarsson et al. [59], between 1875 and 2013, there have been over twenty financial crises in Iceland, meaning that Iceland suffers from a financial crisis approximately every fifteen years. The trigger to many of the crises has been collapses in demand and international financial crises, which have commonly been followed by currency crises along with inflation and reductions in capital inflow [59].
In 2008 the Icelandic banking system collapsed after years of financial success and Iceland became the poster child of the Global Credit Crunch [60]. Tourism played a key role in the country’s economic turnaround [61], with nature as the new natural resource [62]. The tourism industry became by far the largest export sector in Iceland with its share of foreign exchange earnings increasing from 19% in 2010 to 42% in 2018. Tourism replaced seafood, which used to be the dominant export sector, which accounted for 18% of exports by value in 2018, and aluminium products (from smelting), which accounted for about 17% [10]. The tourism industry also became the main provider of new jobs after the financial crisis. Since 2010 there has been a 60% increase in employment in the tourism industry, while employment in other sectors increased by 14% [63]. This growth has been especially important in rural areas, many of which are experiencing a decline in fishing and agriculture [64]. However, growth in demand for workers was substantially met by employing migrants who comprise around 30% of all employees in the tourism industry. Their contribution is particularly high within the accommodation sector, where they account for around 40% of all workers [65].
The growth of tourism has also resulted in infrastructure investments, such as in airports, and the hotel and restaurant sector. During 2015–2017, the average investment was about ISK 72 million (USD 600,000), which is around 3.5 times the investments made during the years 1990–2014 [66]. For instance, investments in the accommodation sector have resulted in a steep increase in new or enlarged hotels. In 2018, hotel rooms in the capital area increased by 4.7% and elsewhere in the country by 9.4%. Between 2010 and 2018, accommodation revenues grew by 380% [56].

3.3. Residents

In 2019, 62% of Iceland’s 350,000 inhabitants lived in the capital area. The rest lives in towns, villages and on farms scattered along the coast. While the yearly average increase in tourist arrivals between 2010 and 2018 was 22% [8], the increase in population was only 1.1% [9]. Thus, although Iceland’s population has been growing, the ratio of tourists per inhabitant had reached 6.73 by 2018 (Figure 1).
The steep increase of tourist arrivals in Iceland raised questions about residents’ attitude towards tourists and the tourism industry. Two nationwide research projects have been carried out on this topic in 2014 [67] and 2017 [68]. Overall, the results indicate that residents in Iceland do not feel that the number of tourists coming to Iceland is too high (Figure 3). In the summer of 2014 about 30% said that the number of tourists was rather high or too high [67] but this figure had fallen slightly by 2017 (27%) [68]. In the winter of 2014 only 3% were of that opinion [67] and 7% in 2017 [68]. Therefore, despite the fact that tourist arrivals increased by 1.2 million in these three years, residents’ opinion did not change substantially. A separate survey by Market and Media Research [69] has confirmed that residents’ overall attitudes towards foreign tourists is generally positive. However, their results show that the proportion of residents who expressed positive attitudes towards tourists decreased from 80% in 2015 to 68% in 2016, 64% in 2017% and 68% in 2018 [69].
Several community-based surveys have examined residents’ attitudes [70,71,72,73,74,75,76]. The geographical difference is evident. The most negative attitude towards tourists is among residents in South Iceland and in the capital area where 42% and 30% respectively think that tourist numbers are too many or way too many. These are also the two areas where most tourists come and stay [68]. Attitudes also differ within specific regions. For example, about a quarter of residents in North Iceland considered tourists to be too many during summer [68] with 77% of residents in Mývatn in the North being of that opinion [73]. Thus, the characteristics of each place and community, including its history and economy, as well as number of visitors who visit the area, seem to play a vital role in shaping the residents’ attitudes.
Issues that residents perceive as positive effects from tourism are improved quality of life, increased diversity, job creation, increased service levels and increased revenue [68]. Despite the overall positive attitudes some negative impacts were also identified. For example, participants mentioned inflation, low salary levels and limited career options. In addition to these economic impacts, increased traffic and the marginalization of locals were mentioned. Residents worried about the housing market, as many apartments were rented to tourists, which decreased options for locals. However, residents do not blame tourists for the negative community impacts, as their frustration is aimed at policy makers, tourism companies, stores and the municipalities [70,71,72,75]. The negative tourism impacts are instead seen to stem from a lack of infrastructure development [68,74].

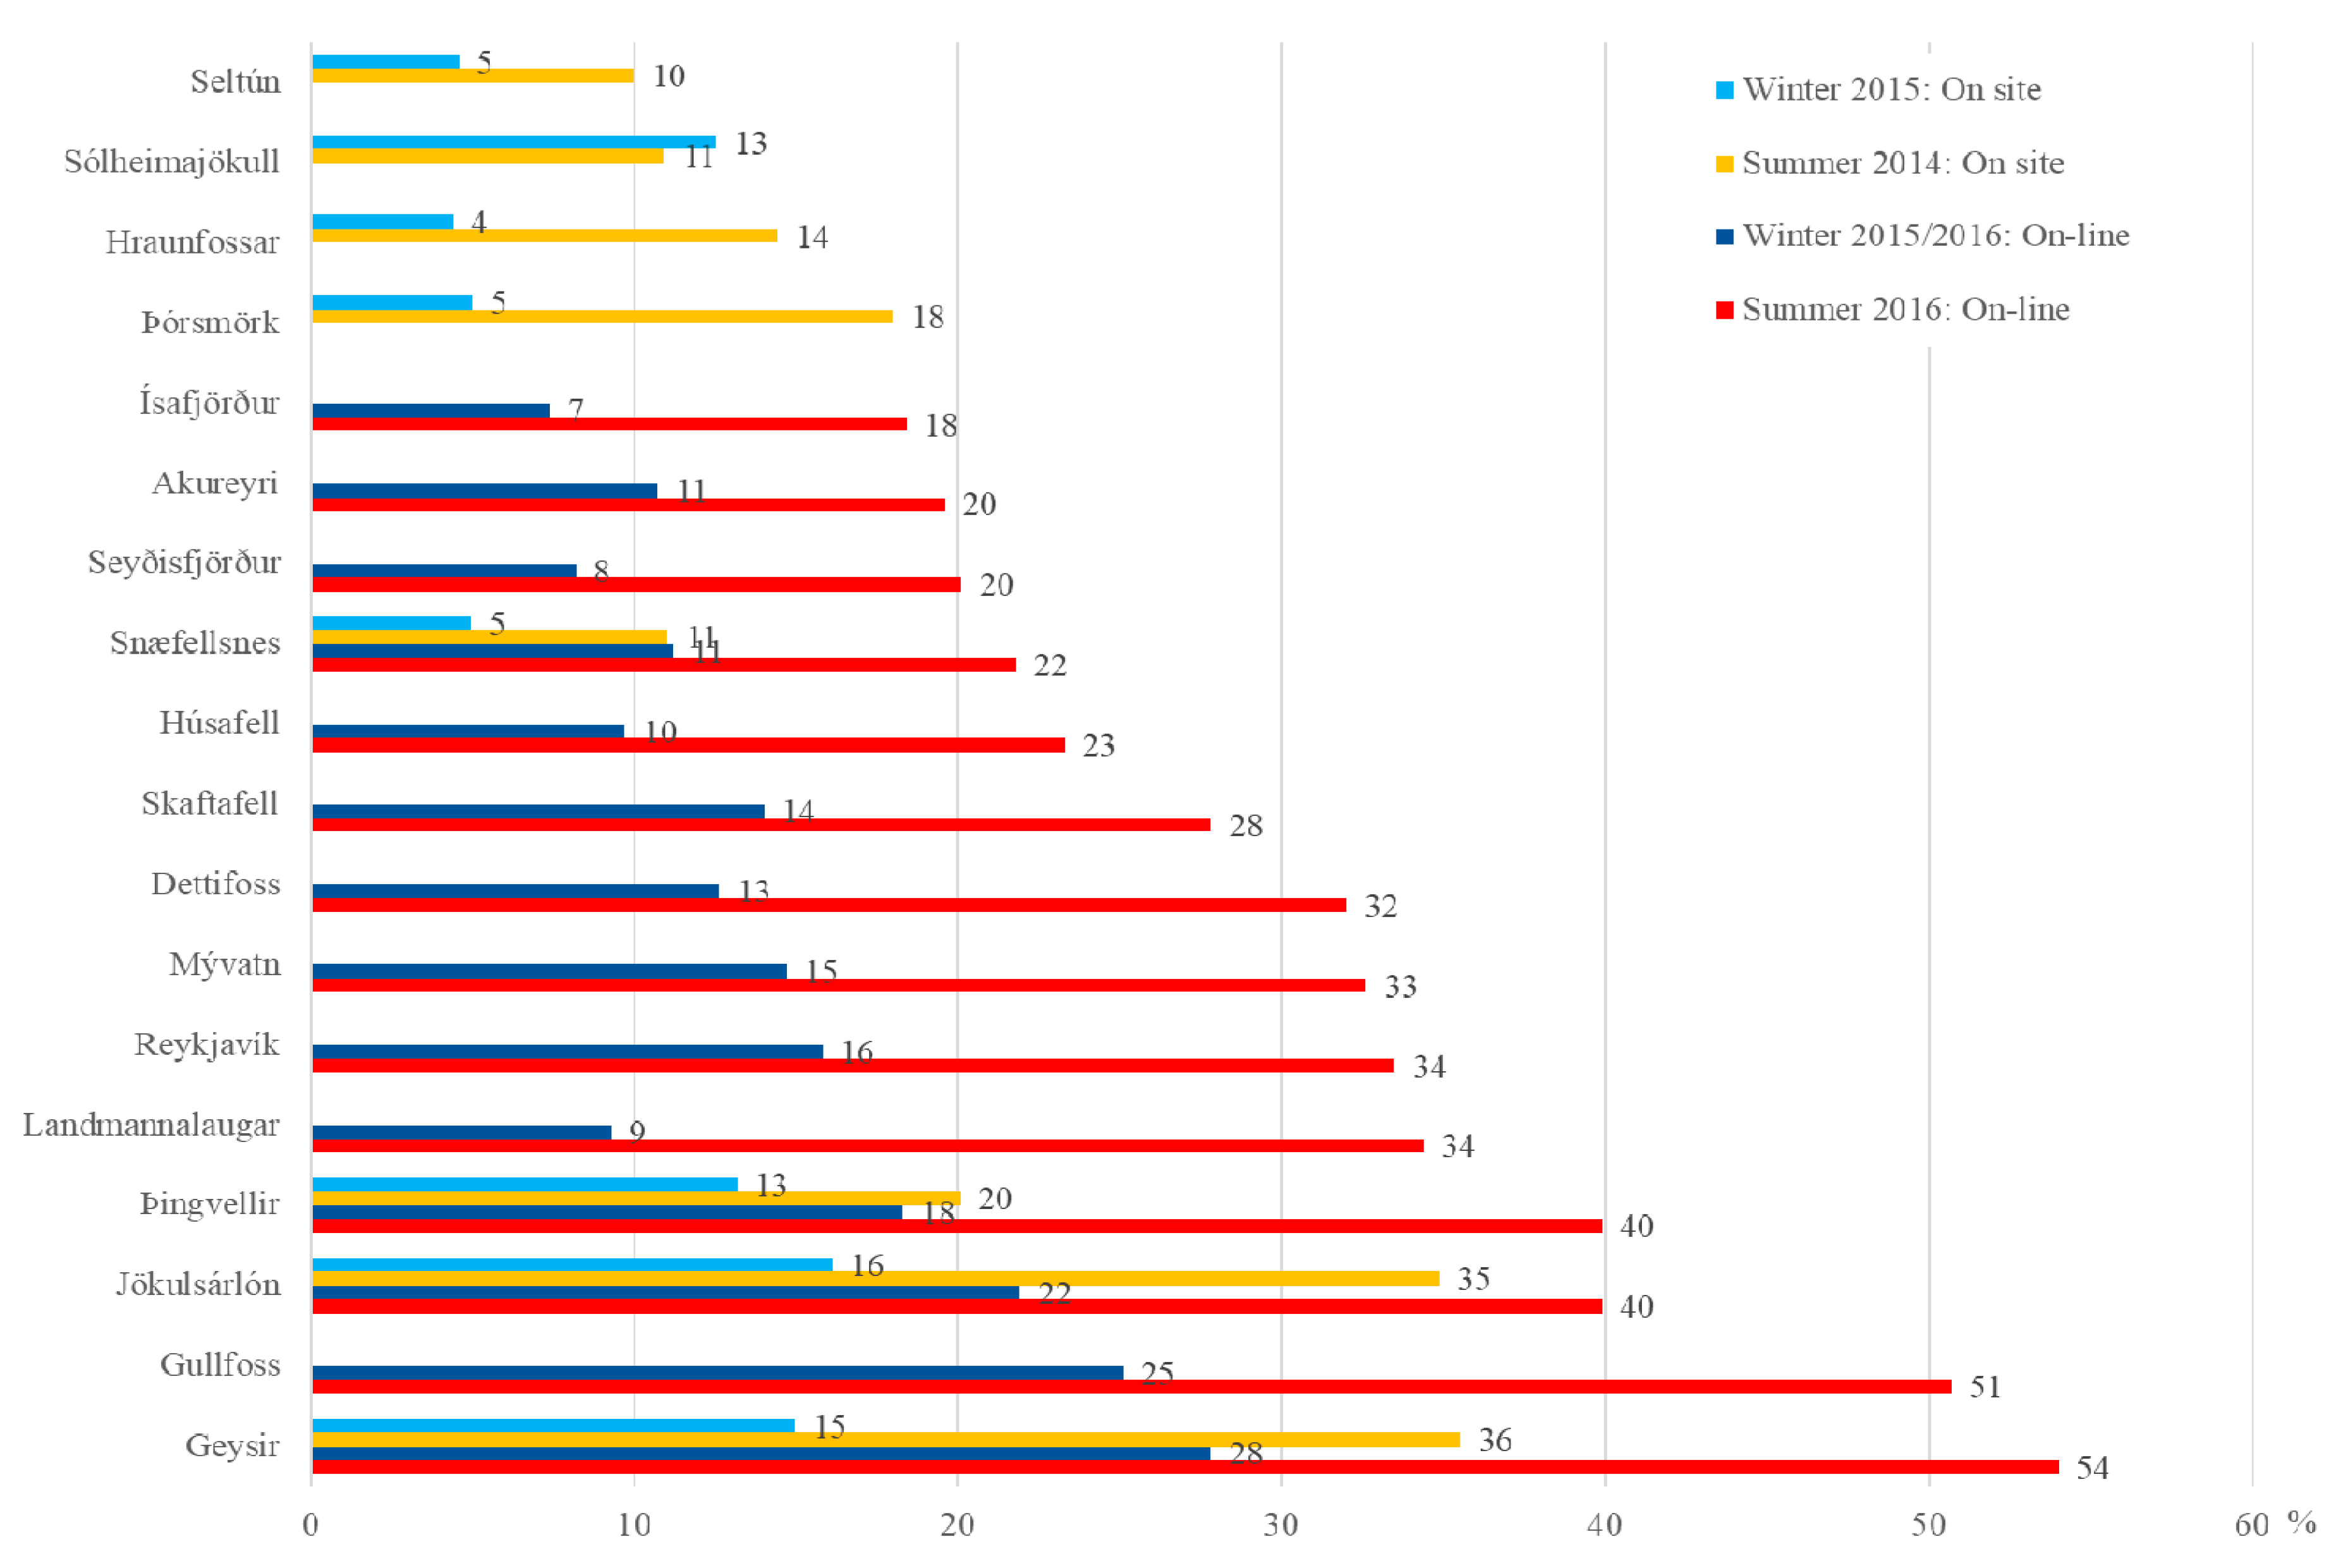
3.4. Perceived Crowding

The increase in tourist arrivals to Iceland has raised questions as to how tourists themselves perceive the number of tourists and how their experience has changed with the increased number of visitors. In Iceland, like in most other destinations, longitudinal research which monitor trends on visitors’ experiences is scarce. However, in 2000 a research project on tourism carrying capacity was started at five nature destinations, covering both social and physical parts of TCC [77,78,79]. Data regarding visitors’ experiences now exist for 24 tourist destinations. The same data collection method has been used, an on-site questionnaire survey in the summer high season, with the same questions. At six of the destinations, the same research has been repeated twice, and at one, Landmannalaugar, it has been conducted three times.
One of the questions asked whether the participants considered the number of tourists as few, rather few, acceptable, many or too many. The results indicate that crowding does not seem to have been a significant problem at most of the destinations since at most places less than 20% perceive tourists to be many or too many (Figure 4). There are a few exceptions such as at Þingvellir national park and Landmannalaugar where the most recent longitudinal studies have been conducted. They show that the perception of overcrowding has increased. While, in 2014, around 20% found the number of tourists at Þingvellir to be many or too many, this percentage increased to 40% in 2019 [80]. Similarly, the percentage of tourists in Landmannalaugar who regarded tourists to be many or too many increased from 22% in 2000, to 32% in 2009 and to 48% in 2019 [54,80]. During those twenty years the number of international visitors to Iceland increased by 556% [8]. Landmannalaugar is in the Highlands and since pristine wilderness is an important attraction the area is potentially more sensitive towards crowding. Landmannalaugar is the most visited Highland destination, but compared to Þingvellir National Park, which is less than an hour drive from Reykjavík, its visitor numbers are still much lower [81,82,83].
A few other places stand out as being perceived to be too crowded. Unsurprisingly, two of them, Geysir (hot spring area) and Jökulsárlón (glacier lagoon), are among the most visited destinations in the country. Hrafntinnusker, on the other hand, is a very remote area in the Highlands, only accessibly by hikers and not visited by many, confirming that the setting matters when it comes to the experience of crowding.
Despite growth in tourist arrivals, crowding is experienced by less visitors at some of the destinations. For example, between 2000 and 2013 the percentage of tourists at Skaftafell, Langisjór, Lónsöræfi and Mývatn, who felt there were many or too many tourists, actually decreased (Figure 4). In the case of Skaftafell nearly 30% of the respondents in 2000 thought that tourists were many or too many, while only 16% said the same thirteen years later [86]. At the same time the number of international visitors to Iceland had increased by 167% from about 302,000 to 807,000 [8].
At some destinations surveys were carried out both in the summer and fall of 2014 and winter of 2015. The results revealed that there was a big variation depending both on location and seasonality. At two of the most popular destinations, Geysir and Jökulsárlón, 35–36% of visitors in the summer, 15–16% in winter and 8–10% in the fall perceived that visitors in general were too many (Figure 5). That proportion was even higher regarding organized group tourists as about 38–39% perceived too many in the summer, 24–29% in the winter and 18–19% in the fall. Notably, the tolerance levels of Icelandic travelers was much higher since only 9–10% thought they were too many in the summer and 2–4% in the winter and the fall [12,87].
In the winter of 2015/2016 and summer of 2016, the Icelandic Tourist Board asked the same question regarding crowding at some of the same destinations as the previous survey. In the two years that had passed between the two summer surveys, the proportion that experienced too many tourists at Geysir increased from 36% to 54%, at Jökulsárlón from 35% to 40% and at Þingvellir from 20% to 40% (Figure 5). Similarly, visitors perceived crowding far less in the winter. Nevertheless, at Geysir, 28% of those surveyed perceived that there were too many visitors [88] with the proportion increased from 15% to 28% in a year.
However, the studies varied with regards to the methods which were used. The Icelandic Tourist Board [83,88] used an online questionnaire survey sent to foreign visitors after their trip to Iceland and specifically asked about fourteen tourist destinations in Iceland. Accordingly, the survey is a reflection on visitors’ memory after the trip. Furthermore, there is no guarantee that the respondents can differentiate between the fourteen places with the ‘difficult’ Icelandic names as well as it is not certain that they have been to the places they express their opinion about. The survey by Sæþórsdóttir, Guðmundsdóttir and Stefánsson [87] was, on the other hand conducted on site and consisted of both international and domestic visitors at the destination. Interestingly, the study by the Icelandic Tourist Board [83,88] also found that Reykjavík was perceived as having too many visitors by one-third of the visitors in the summer and 16% in the winter. Nevertheless, despite their differences, these two surveys suggest there are substantial differences in perception of crowding between the summer months and winter months.
While crowding is affecting the experience of tourists at certain destinations, tourists continue to be satisfied with their overall experience in Iceland. In the surveys conducted by the Icelandic Tourist Board from 2011 to 2016, respondents were asked if their recent trip met their expectations to a greater or lesser extent. The results showed that around 95% of respondents replied positively during both summer and winter. Similarly, in 2016, Sæþórsdóttir, Guðmundsdóttir and Stefánsson [87] found that 88% of tourists at eight popular tourist sites were overall happy with their trip. The most recent surveys from 2018 and 2019 show that this trend continues, with 95–96% of international visitors being either happy or very happy with their overall stay in Iceland [90], with 75% of tourists who came to Iceland in 2018 being likely to recommend Iceland as a destination [45].

3.5. Nature

Iceland’s main tourist attraction is its nature. However, it is also quite environmentally sensitive with its ecosystems vulnerable when faced with external physical impacts, including the impacts of tourism [13]. The uninhabited Central Highlands are especially sensitive with volcanos, highly erodible soils and a short growing season [91]. At the same time the wilderness and unspoiled nature is the main attraction of the Highlands [85].
Few studies have looked directly at the environmental impacts of tourism in Iceland, and those which exist have mostly focused on trampling and its impact on hiking trail conditions. Ólafsdóttir and Runnström [13] assessed the status of hiking trail conditions in Þórsmörk and the Fjallabak Nature Reserve where Landmannalaugar is located. Over 30% of the trail system in Þórsmörk was said to be in bad and very bad condition, whereas this was the case for only 12% of the Fjallabak Nature Reserve’s trail system. Another study by Ólafsdóttir and Runnström [92] focused on the impact of recreational trampling at Þingvellir National Park and again at Fjallabak Nature Reserve. They found, for example, that tourists using hiking sticks caused higher soil compaction compared to those who did not. They point out the ‘importance to understand the resistance of Icelandic ecosystems to different recreational pressures, in order to prevent severe or even irreversible land degradation’ [92].
That seems to have happened to some extent more recently. The Environment Agency of Iceland monitors the condition of protected areas. In 2018, they concluded that five areas are in great danger of degradation due to the impacts of tourism and 15 locations are threatened [93,94]. The Environment Agency occasionally closes off areas in order to protect them from trampling, for example, during thawing conditions. However, visitors generally do not observe many negative environmental effects of tourism in Iceland. The most observed issue being erosion on footpaths and damaged vegetation and, in the Central Highlands, the effects of off-road driving [12,85].

3.6. Infrastructure

In 2017, a project called ‘Balance-axis for tourism’ was carried out for the Icelandic Ministry of Industries and Innovation. It evaluated the impact of tourism on Iceland’s economy, infrastructure, public service and society, and whether the tourism carrying capacity of these factors had been reached. It also assessed how the TCC would develop assuming different growth scenarios. The work was based on the assessment of expert groups [95].
The report [96] concludes that many parts of the infrastructure such as the road system, as well as the main harbors and airports are close to reaching their carrying capacity. In addition, the infrastructure at nature sites is close to reaching its carrying capacity and many tourist sites are in need of improvement or simply lack sanitary facilities. Sewage treatment and waste disposal have already reached their carrying capacity. Healthcare services in the country, especially outside the capital area, as well as law enforcement, are also close to reaching their capacity. The Balance-Axis project [96] also discusses the impact that renting out private apartments to tourists, especially via Airbnb, has had on the housing market. Around 38% of all overnight stays in the capital area in 2018 were in accommodation rented through Airbnb, with the result being a shortage of housing for residents in urban areas, in particular in Reykjavík [56]. However, the results of the Balance-Axis project indicate that the housing market has not reached its carrying capacity [96] and in 2019 more tourists were staying in hotels and guesthouses [56].

4. Reactions to Overtourism in Iceland

A new tourism strategy was set out in 2015, called the Road Map for Tourism in Iceland. It included seven major goals and tasks that relate to: distributing tourists better in time and space, ensuring nature conservation, creating a positive visitor experience, increasing profitability for the industry, improving skills and quality in the industry, gathering reliable data and implementing coordinated management of tourism. Along with the Road Map, a Tourism Task Force was established to ensure that the goals would be reached [97]. An important accomplishment of the Tourism Task Force together with the Icelandic Tourist Board was the establishment of Destination Management Plans (DMPs) [98] that are concerned with organizing, developing and marketing tourist sites and are carried out by the regional marketing offices, so that they reflect each region’s specific needs, i.e., the needs of visitors, residents, businesses and the environment.
An important aspect of managing the growth of tourists to Iceland has been the development of destination infrastructure. In order to finance these, the Tourist Site Protection Fund was established in 2011 to develop, maintain and protect tourist sites across all of Iceland, regardless of whether they are publicly or privately owned. The fund is also aimed at developing new or less frequently visited attractions in order to decrease the stress on more popular sites [98]. In addition, legislation on the national strategy for the development of infrastructure to protect natural and cultural heritage [99] was enacted with the aim to develop and coordinate policy on the restoration, management and maintenance of infrastructure for the protection of nature and cultural heritage due to tourism. However, the Tourist Site Protection Fund has not been able to cover all required investments and thus the question is raised who should pay, for example, for toilet facilities, the maintenance of hiking trails and the development of vantage points. One argument is that the service provider at each destination should pay for and provide toilets. In exchange they would get business from the customer. However, not all ‘toilet users’ become paying customers. Some landowners in Iceland have started to charge entrance fees, but whether they are legally allowed to do so given public rights of access has yet to be determined. The landowners are therefore often in a situation where they cannot charge entrance fees but are also not allowed to close down the area due to public right of access, leaving them to deal with the consequences of tourist traffic.
Others point out that the government should provide these basic facilities, but the question of where the required money should come from remains. In that case it is argued that the tourism industry is a very big taxpayer and that tourists already pay through various taxes. However, others are of the opinion that there is a market failure and that the tourism industry and the tourists themselves are still not paying enough and that they should pay user fees for visiting destinations and using facilities/resources. That was, for example, the opinion of the former Minister of Tourism in Iceland who in 2014 made a parliamentary proposal about a so-called ‘nature passport’ which meant that both international visitors and Icelanders would pay entrance fees for visiting the most popular nature destinations in the country. The proposal was heavily debated in the society and did not get through the parliament due to political and ideological grounds as well as practicalities. It was, for instance, in conflict with the public right of access which makes charging for visiting nature destinations difficult or impossible to implement without changing the law and tradition which has been an integral part of everyone’s right since the settlement of the island. However, the increased pressure from tourism has initiated some discussions in the Icelandic parliament about whether or not the public right of access needs to be changed. Some voices have expressed concern that the public right of access would be sacrificed on the altar of the success of the tourism industry with the common good landscape becoming a commodity for the tourism industry at the cost of the public. One option suggested is to exclude the public right of access to organized tours profiting from public or private lands. User fees would create the opportunity for landowners to utilize the landscape for private profit. At the same time this reduces the public right to enjoy nature as a common good and thereby their well-being. Nevertheless, some national parks and other protected natural areas have started to charge for the use of sanitary facilities and parking where they are allowed to legally do so [100]. A new Transportation Act [101] also allows municipalities to charge parking fees outside of urban areas. The income can be used to create parking spaces or develop, maintain and provide services related to their use, such as toilet facilities and walking paths.

5. Discussion and Conclusions

Despite its popularity, the concept of overtourism is relatively vague and serves as a shorthand for complex issues. It may bring much-needed attention to the problems of high visitation, but much like other cognate concepts, for example, sustainability and TCC, it does not provide a pathway as to how to deal with and solve these issues. Some organizations suggest that it is not overtourism per se which is the enemy but rather how tourism is managed [102,103], and they suggest that destinations should therefore manage tourism better by better balancing supply and demand, decreasing seasonality and dispersing the distribution of tourists in space and time. Others have pointed out alternative options such as setting limits on the number of visitors, de-marketing and raising taxes [2,104]. Given tourism’s economic contribution, government and stakeholders usually refrain from setting limits on growth. An often more popular approach is to seek to increase the profit obtained from each tourist without increasing the overall number of visitors to the country [2,105]. Suggestions that deliberately degrowing tourism to protect natural and social capital, while still bringing an economic return, generally go unheard [25,106,107].
The huge growth in the number of international tourists to Iceland has drastically changed the economy which traditionally relied on fishing and agriculture. After the financial crisis in 2008, nature-based tourism became the backbone of the Icelandic economy. There are some signs of overtourism, for instance when it comes to tourists’ experience, residents’ attitudes at the most popular destinations and infrastructure in the society. However, it is important to note that any negative response from residents is highly seasonal with some regions still desiring more tourists, particularly in the current low seasons. Issues of overtourism in Iceland are therefore tied substantially into the classic seasonality problem of tourism. There is not an anti-tourism movement in Iceland, as in some European centers affected by overtourism [1,6]. There is, instead, a societal debate about the best means to manage and develop tourism in a way that maximizes business and community interests. The attitudes of both visitors and residents generally remain favorable and whether Iceland does suffer from overtourism is not as black and white as some in the international media have made out [108,109].
Iceland has tried to respond to tourism pressures in various ways. Attempts to decrease seasonality have begun to pay off, at least within the capital area and along the South coast, while stakeholders are still trying to find ways to evenly disperse tourists to different tourist sites although extending the length of stay remains key to this. Here, marketing has been the main tool. Some limits to tourism have been mentioned. The 2015 Road Map for Icelandic Tourism states that restricting access to certain sites may well be necessary in order to protect nature and ensure visitor safety. It says that ‘if data indicates that the carrying capacity of a tourism area is being compromised, tourist traffic shall be controlled to protect nature and spread the load, also in the interest of safety’ [97]. Increasing the profit per tourist is also identified as a goal: ‘the objective is for tourism revenue to increase proportionally more than the rise in the number of tourists and that ambitious but realistic rates of return be set for the industry’ [97].
However, while stakeholders work towards managing overtourism, the industry is counteracting itself. In 2019 the number of visitors declined. In early 2019, the Icelandic budget airline WOW Air abruptly ceased operations and tourist arrivals decreased [56]. Interestingly, since the bankruptcy of WOW Air, tourists in Iceland are staying longer in Iceland and spending more money, indicating that WOW Air mostly flew budget travelers. In 2019, revenues per tourist were higher compared to the years before. In addition, Icelandair, the other Icelandic airline, ran into trouble due to the suspension of the Boeing 737-MAX aircraft and the supply of flights to Iceland decreased even further. Labor contracts were renewed, meaning that wages increased, and many companies reported that they had to let employees go [56].
According to the World Economic Forum [110], Iceland has now become less competitive as a tourist destination. In 2019 it is ranked in 30th place out of 140 countries of the most competitive countries in the world when it comes to tourism but has dropped down by 12 places since 2015. The competitiveness is evaluated from various factors. Iceland scores very high on some of them such as safety and security (second), enabling environment (fourth), governmental prioritization of travel and tourism (fourth) and ICT readiness (sixth). However, regarding price competitiveness Iceland almost hits the bottom, ranked as 138 out of 140 countries. Surveys in Iceland have shown that international visitors regard Iceland as an expensive destination and that the price level is one of the most common reasons for why tourists would not recommend Iceland as a destination to their friends and relatives [45], although 75% still do. Hallsdóttir [111], the chairman of the board of the Icelandic Travel Industry Association, blames the decline in the number of international visitors on the fact that Iceland has become too expensive. She blames the high rate of the Icelandic Krona, supposedly high salaries for workers in the industry, and that the tourism industry is paying too high taxes. However, these criticisms seemingly ignore the fact that Iceland had started to achieve a much better economic return per visitor and was also able to position itself in terms of quality rather than being cheap, elements which are seemingly much more significant for destination sustainability than just focusing on growth in visitor numbers [2,105].
Despite the decline in the number of international visitor arrivals in 2019, the number was still higher than it was only three years previously. How this development would have continued in 2020 we will never know as, in March 2020, when this paper was about to be completed, the Covid-19 pandemic shook the world. Iceland’s tourism industry was immediately hit hard, which has wide repercussions for the country’s economy, due to its dependence on tourism. The Government of Iceland [112] has created a response plan to help ease the affects. During the pandemic the government will secure up to 75% of salaries for those who are most effected and are forced to reduce their working hours. This initiative is mostly focused on the tourism industry and related businesses, such as restaurants, shops and other services. In addition, company tax payments will be delayed and reduced. However, just as after the financial crisis in 2008, the government is looking towards the tourism industry as one of the main sectors to help the economy recover once the pandemic is over. Among actions to help the industry boom again is a marketing campaign to increase international tourist arrivals to Iceland, the extension of Akureyri airport, the (temporary) abolition of the overnight tax and investment in domestic tourism. The hope is that once air traffic regenerates, Iceland will be an attractive destination for tourists wanting to escape crowded destinations around the world and seek out places where they can experience nature in solitude. Whether or not this will succeed, only time will tell but, if achieved then with the continued focus on numbers overtourism will become a challenge again. Nevertheless, perhaps the Icelandic experience does provide several insights into overtourism that go beyond Iceland. First, tourism is complex, even when growth pressures are recognized and perceptions of crowding increase over time, visitors —and many residents—still remain in favor of tourism. Second, the management of overtourism is extremely difficult unless government and industry can shift from a focus on the numbers of arrivals to one that examines yield and the overall costs and benefits of tourism. This also includes strategies such as increasing the length of stays so as to be able to achieve a greater spatio-temporal dispersal of tourists. Third, and perhaps most fundamentally, tackling overtourism means ensuring that destination economies are as diversified as possible so as to reduce overdependence on specific markets or tourism in general.

Author Contributions

Writing—review and editing, A.D.S., C.M.H. and M.W. All authors have read and agreed to the published version of the manuscript.

Funding

This research received no external funding.

Conflicts of Interest

The authors declare no conflict of interest.

References

  1. Capocchi, A.; Vallone, C.; Pierotti, M.; Amaduzzi, A. Overtourism: A literature review to assess implications and future perspectives. Sustainability 2019, 11, 3303. [Google Scholar] [CrossRef] [Green Version]
  2. Oklevik, O.; Gössling, S.; Hall, C.M.; Steen Jacobsen, J.K.; Grøtte, I.P.; McCabe, S. Overtourism, optimisation, and destination performance indicators: A case study of activities in Fjord Norway. J. Sust. Tour. 2019, 27, 1804–1824. [Google Scholar] [CrossRef] [Green Version]
  3. Goodwin, H.; The Challenge of Overtourism. Responsible Tourism Partnership Working Paper 4. 2017. Available online: http://www.millennium-destinations.com/uploads/4/1/9/7/41979675/rtpwp4overtourism012017.pdf (accessed on 31 July 2020).
  4. Goodwin, H. Overtourism: Causes, symptoms and treatment. 2019. Available online: https://responsibletourismpartnership.org/wp-content/uploads/2019/06/TWG16-Goodwin.pdf (accessed on 31 July 2020).
  5. Milano, C.; Cheer, J.M.; Novelli, M.; Milano, C.; Cheer, J.M.; Novelli, M. Introduction. In Overtourism: Excesses, Discontents and Measures in Travel and Tourism; Milano, C., Cheer, J.M., Novelli, M., Eds.; CABI: Wallingford, UK, 2019; pp. 1–17. [Google Scholar]
  6. Phi, G.T. Framing overtourism: A critical news media analysis. Curr. Issues Tour. 2019. [Google Scholar] [CrossRef]
  7. Hewitt, M. Why the Westfjords Are Iceland’s Best Kept Secret. Intrepid Travel, 27 February 2018. Available online: https://www.intrepidtravel.com/adventures/visit-westfjords-iceland/ (accessed on 31 July 2020).
  8. Icelandic Tourist Board. Numbers of Foreign Visitors to Iceland. Available online: https://www.ferdamalastofa.is/en/recearch-and-statistics/numbers-of-foreign-visitors (accessed on 10 July 2020).
  9. Statistics Iceland. Population. Available online: https://statice.is/publications/publication/inhabitants/population-development-2018/ (accessed on 10 July 2020).
  10. Statistics Iceland. External Trade. Trade in Goods and Services. Selected ITEMS of the Exports of Goods and Services 2013–2019. Available online: https://px.hagstofa.is/pxen/pxweb/en/Efnahagur/Efnahagur__utanrikisverslun__3_voruthjonusta__voruthjonusta/UTA05003.px (accessed on 10 July 2020).
  11. The World Bank. Indicators. Available online: https://data.worldbank.org/indicator/ (accessed on 9 July 2020).
  12. Sæþórsdóttir, A.D.; Hall, C.M.; Stefánsson, Þ. Senses by seasons: Tourists’ perceptions depending on seasonality in popular nature destinations in Iceland. Sustainability 2019, 11, 3059. [Google Scholar] [CrossRef] [Green Version]
  13. Ólafsdóttir, R.; Runnström, M.C. Assessing hiking trails condition in two popular tourist destinations in the Icelandic highlands. J. Outdoor Recreat. Tour. 2013, 3, 57–67. [Google Scholar] [CrossRef]
  14. Steward, B. Writing a literature review. Br. J. Occup. Ther. 2004, 6, 495–500. [Google Scholar] [CrossRef]
  15. Callahan, J.L. Writing literature reviews: A reprise and update. Hum. Resour. Dev. Rev. 2014, 13, 271–275. [Google Scholar] [CrossRef] [Green Version]
  16. Hall, C.M.; Page, S.J. The Geography of Tourism and Recreation: Environment, Place, and Space, 4th ed.; Routledge: Abingdon, UK, 2014. [Google Scholar]
  17. Manning, R.E. Parks and Carrying Capacity. Commons without Tragedy; Island Press: Washington, DC, USA, 2007. [Google Scholar]
  18. Wall, G. From carrying capacity to overtourism: A perspective article. Tour. Rev. 2020, 75, 212–215. [Google Scholar] [CrossRef]
  19. Swarbrooke, J. Sustainable Tourism Management; CABI Publishing: Wllimgford, UK, 1999. [Google Scholar]
  20. Butler, R.W. The concept of carrying capacity for tourism destinations: Dead or merely buried? In Tourism Development: Environmental and Community Issues; Cooper, C., Wanhill, S., Eds.; John Wiley & Sons: Chichester, UK, 1997; pp. 11–21. [Google Scholar]
  21. Hardin, G. The tragedy of the commons. Science 1968, 162, 1243–1248. [Google Scholar]
  22. Butler, R.W. The concept of a tourism area cycle of evolution: Implications for management of resources. Can. Geogr. 1980, 24, 5–12. [Google Scholar] [CrossRef]
  23. Saarinen, J. Critical sustainability: Setting the limits to growth and responsibility in tourism. Sustainability 2014, 6, 1–17. [Google Scholar] [CrossRef] [Green Version]
  24. Hall, C.M. Constructing sustainable tourism development: The 2030 agenda and the managerial ecology of sustainable tourism. J. Sust. Tour. 2019, 27, 1044–1060. [Google Scholar] [CrossRef]
  25. Hall, C.M. Degrowing tourism: Décroissance, sustainable consumption and steady-state tourism. Anatolia 2009, 20, 46–61. [Google Scholar] [CrossRef]
  26. Stokols, D. A social-psychological model of human crowding phenomena. J. Am. Plan. Assoc. 1972, 38, 72–83. [Google Scholar] [CrossRef]
  27. Neuts, B.; Nijkamp, P. Tourist crowding perception and acceptability in cities: An applied modelling study on Bruges. Ann. Tour. Res. 2012, 39, 2133–2153. [Google Scholar] [CrossRef]
  28. Manning, R.E.; Valliere, W.A.; Wang, B. Crowding norms: Alternative measurement approaches. Leis. Sci. 1999, 21, 219–229. [Google Scholar] [CrossRef]
  29. Graefe, A.R.; Vaske, J.J.; Kuss, F.R. Social carrying capacity: An integration and synthesis of twenty years of research. Leis. Sci. Interdiscip. J. 1984, 6, 395–431. [Google Scholar] [CrossRef]
  30. Heywood, J.L.; Murdock, W.E. Social norms in outdoor recreation: Searching for the behavior-condition link. Leis. Sci. 2002, 24, 283–295. [Google Scholar] [CrossRef]
  31. Donnelly, M.; Vaske, J.; Whittaker, D.; Shelby, B. Toward an understanding of norm prevalence: A comparative analysis of 20 years of research. Environ. Manag. 2000, 25, 403–414. [Google Scholar] [CrossRef]
  32. Vaske, J.; Donnelly, M.; Petruzzi, J. Country of origin, encounter norms, and crowding in a frontcountry setting. Leis. Sci. 1996, 18, 161–176. [Google Scholar] [CrossRef]
  33. Priskin, J. Tourist perceptions of degradation caused by coastal nature-based recreation. Environ. Manag. 2003, 32, 189–204. [Google Scholar] [CrossRef] [PubMed]
  34. Koens, K.; Postma, A.; Papp, B. Is overtourism overused? Understanding the impact of tourism in a city context. Sustainability 2018, 10, 4384. [Google Scholar] [CrossRef] [Green Version]
  35. Andereck, K.L.; Nyaupane, G.P. Exploring the nature of tourism and quality of life perceptions among residents. J. Travel Res. 2011, 20, 248–260. [Google Scholar] [CrossRef]
  36. Doxey, G.V. A Causation Theory of Visitor-Resident Irritants: Methodology and Research Inferences; Travel Research Association Conference: San Diego, CA, USA, 1975; pp. 195–198. [Google Scholar]
  37. Diedrich, A.; García-Buades, E. Local perceptions of tourism as indicators of destination decline. Tour. Manag. 2009, 30, 512–521. [Google Scholar] [CrossRef]
  38. Ryan, C.; Cessford, G. Developing a visitor satisfaction monitoring methodology: Quality gaps, crowding and some results. Curr. Issues Tour. 2003, 6, 457–507. [Google Scholar] [CrossRef]
  39. Manning, R.E.; Lime, D.W. Defining and managing the quality of wilderness recreation experiences. Wilderness Sci. A Time Chang. Conf. 2000, 4, 23–27. [Google Scholar]
  40. Shelby, B.; Heberlein, T.A. Carrying Capacity in Recreation Settings; Oregon State University Press: Corvallis, OR, USA, 1986. [Google Scholar]
  41. Vaske, J.J.; Shelby, B.B.; Graefe, A.R.; Herelein, T.A. Backcountry encounter norms: Theory, method and empirical evidence. J. Leis. Res. 1986, 18, 137–153. [Google Scholar] [CrossRef]
  42. Riganti, P.; Nijkamp, P. Congestion in popular tourist areas: A multi-attribute experimental choice analysis of willingness-to-wait in Amsterdam. Tour. Econ. 2008, 14, 25–44. [Google Scholar] [CrossRef] [Green Version]
  43. Popp, M. Positive and negative urban tourist crowding: Florence, Italy. Tour. Geogr. 2012, 14, 50–72. [Google Scholar] [CrossRef]
  44. Sæþórsdóttir, A.D.; Hall, C.M.; Saarinen, J. Making wilderness: Tourism and the history of the wilderness idea in Iceland. Polar Geogr. 2011, 34, 249–273. [Google Scholar] [CrossRef]
  45. Óladóttir, O.Þ. Erlendir Ferðamenn á Íslandi 2018: Lýðfræði, Ferðahegðun Og Viðhorf. [International Visitors in Iceland 2018. Demography, Travel Behaviour and Attitudes]; Icelandic Tourist Board: Reykjavík, Iceland, 2019. [Google Scholar]
  46. Ministry of the Environment; The National Planning Agency. Miðhálendi Íslands, Svæðisskipulag 2015 [The Central Highlands, Regional Planning 2015]; Ministry of the Environment; The National Planning Agency: Reykjavík, Iceland, 1999.
  47. UNWTO. International Tourism Highlights. Available online: https://www.e-unwto.org/doi/pdf/10.18111/9789284421152 (accessed on 10 July 2020).
  48. UNWTO. Resources. Tourism Data Dashboard. Global and Regional Tourism Performance. Key Tourism Indicators. Available online: https://www.unwto.org/global-and-regional-tourism-performance (accessed on 9 July 2020).
  49. Gil-Alana, L.A.; Huijbens, E.H. Tourism in Iceland: Persistence and seasonality. Ann. Tour. Res. 2018, 68, 20–29. [Google Scholar] [CrossRef]
  50. Benediktsson, K.; Lund, K.A.; Huijbens, E.H. Inspired by eruptions? Eyjafjallajökull and Icelandic tourism. Mobilities 2011, 6, 77–84. [Google Scholar] [CrossRef]
  51. National Geographic. Best of the World. Available online: http://travel.nationalgeographic.com/travel/best-trips-2012/ (accessed on 10 July 2020).
  52. Fodor’s Travel. Available online: http://www.fodors.com/world/europe/iceland/ (accessed on 10 July 2020).
  53. Lonely Planet. Available online: http://www.lonelyplanet.com/europe/travel-tips-and-articles/76855 (accessed on 10 July 2020).
  54. Sæþórsdóttir, A.D. Managing popularity: Changes in tourist attitudes to a wilderness destination. Tour. Manag. Perspect. 2013, 7, 47–58. [Google Scholar] [CrossRef]
  55. Gunnarsson, A. Saga Flugvalla og Flugleiðsögu á Íslandi [The History of Airport and Air Traffic Control in Iceland]; Isavia: Reykjavík, Iceland, 2018. [Google Scholar]
  56. Landsbankinn. Ferðaþjónusta 2019 [The Tourism Industry 2019]. Tímarit Landsbankans. Available online: https://umraedan.landsbankinn.is/umraedan/samfelagid/ferdathjonusta-2019/ (accessed on 31 July 2020).
  57. Icelandic Tourist Board. Visitors to Iceland through Keflavik Airport, 2003–2020. Available online: https://www.ferdamalastofa.is/en/recearch-and-statistics/numbers-of-foreign-visitors (accessed on 31 July 2020).
  58. Statistics Iceland. Business Sectors. Tourism. Accommodation. All Accommodation Establishments. Overnight Stays and Arrivals in All Types of Registered Accommodation 1998–2019. Available online: http://www.statice.is/statistics/business-sectors/tourism/accommodation/ (accessed on 10 July 2020).
  59. Einarsson, B.G.; Gunnlaugsson, K.; Ólafsson, T.T.; Pétursson, T.G. The Long History of Financial Boom-Bust Cycles in Iceland Part I: Financial Crises; Central Bank of Iceland: Reykjavík, Iceland, 2015. [Google Scholar]
  60. Bergmann, E. Iceland and the International Financial Crisis: Boom, Bust and Recovery; Palgrave Macmillan: London, UK, 2014. [Google Scholar]
  61. Jóhannesson, G.Þ.; Huijbens, E.H.; Sharpley, R. Icelandic tourism: Past directions-future challenges. Tour. Geogr. 2010, 12, 278–301. [Google Scholar] [CrossRef]
  62. Sæþórsdóttir, A.D.; Saarinen, J. Challenges due to changing ideas of natural resources: Tourism and power plant development in the Icelandic wilderness. Polar Rec. 2016, 52, 82–91. [Google Scholar] [CrossRef]
  63. Statistics Iceland. Labour Force Survey-Annual Figures. Available online: https://statice.is/statistics/society/labour-market/labour-force-survey/ (accessed on 8 July 2020).
  64. Sæþórsdóttir, A.D.; Hall, C.M. Contested development paths and communities in Iceland: Sustainable energy or sustainable tourism? Sustainability 2019, 11, 3642. [Google Scholar] [CrossRef] [Green Version]
  65. Statistics Iceland. Number of Employees in Sectors according to Files based on Years, Gender, Age and Background 2008–2018. Available online: https://px.hagstofa.is/pxis/pxweb/is/Samfelag/Samfelag__vinnumarkadur__vinnuaflskraargogn/VIN10020.px (accessed on 10 July 2020).
  66. Landsbankinn. Fjárfesting í Ferðaþjónustu Síðustu ár Margföld á við Meðalár [Investments in the Tourism Industry Are Significantly Higher on Average]. Hagfræðideild Landsbankans. 2018. Available online: https://umraedan.landsbankinn.is/umraedan/efnahagsmal/frett/2018/04/13/Hagsja-Fjarfesting-i-ferdathjonustu-sidustu-ar-margfold-a-vid-medalar/ (accessed on 31 July 2020).
  67. Social Science Research Institute. Viðhorf Íslendinga til Ferðaþjónustu. Unnið fyrir Ferðamálastofu. [Icelander’s Attitudes towards the Tourism Industry. Conducted for the Icelandic Tourist Board]; Social Science Research Institute: Reykjavík, Iceland, 2014. [Google Scholar]
  68. Bjarnadóttir, E.J.; Arnalds, Á.A.; Víkingsdóttir, A.S. Því Meiri Samskipti-Því Meiri Jákvæðni. Viðhorf Íslendinga til Ferðamanna og Ferðaþjónustu 2017 [The More Communication—The More Positivity. Icelanders’ Attitudes towards Tourists and the Tourism Industry 2017]; Icelandic Tourism Research Center: Reykjavík, Iceland, 2018. [Google Scholar]
  69. Market and Media Research. Jákvæðni Gagnvart Erlendum Ferðamönnum Eykst [An Increase in Positive Attitudes towards International Tourists]. Available online: https://mmr.is/frettir/birtar-nieurstoeeur/703 (accessed on 10 July 2020).
  70. Bjarnadóttir, E.J. Viðhorf Heimamanna til Ferðamanna og Ferðaþjónustu 2018–Húsavík [Residents’ Attitudes towards Tourists and the Tourism Industry 2018-Húsavík]; Icelandic Tourist Board: Reykjavík, Iceland, 2019. [Google Scholar]
  71. Bjarnadóttir, E.J. Viðhorf Heimamanna til Ferðamanna og Ferðaþjónustu 2018–Stykkishólmur [Residents’ Attitudes towards Tourists and the Tourism Industry 2018-Stykkishólmur]; Icelandic Tourist Board: Reykjavík, Iceland, 2019. [Google Scholar]
  72. Bjarnadóttir, E.J. Viðhorf Heimamanna til Ferðamanna og Ferðaþjónustu 2018–Reykjanesbær [Residents’ Attitudes towards Tourists and the Tourism Industry 2018-Reykjanesbær]; Icelandic Tourist Board: Reykjavík, Iceland, 2019. [Google Scholar]
  73. Bjarnadóttir, E.J.; Jóhannesson, A.Þ.; Gunnarsdóttir, G.Þ. Greining á Áhrifum Ferðaþjónustu og Ferðamennsku í Einstökum Samfélögum: Höfn, Mývatnssveit og Siglufjörður [An Analysis of the Impacts of the Tourism Industry and Tourism on Selected Communities: Höfn, Mývatnssveit and Siglufjörður]; Icelandic Tourism Research Center: Akureyri, Iceland, 2016. [Google Scholar]
  74. Helgadóttir, G.; Einarsdóttir, A.V.; Matthíasdóttir, J.M.E.; Gunnarsdóttir, G.Þ.; Burns, G.L. Félagsleg Áhrif Ferðamennsku og Ferðaþjónustu. [Social Impacts of Tourism and the Tourism Industry]; Icelandic Tourist Board: Reykjavík, Iceland, 2016. [Google Scholar]
  75. Bjarnadóttir, E.J. Viðhorf Heimamanna til Ferðamanna og Ferðaþjónustu 2018–Egilsstaðir [Residents’ Attitudes towards Tourists and the Tourism Industry 2018-Egilsstaðir]; Icelandic Tourist Board: Reykjavík, Iceland, 2019. [Google Scholar]
  76. Bjarnadóttir, E.J. Viðhorf Íbúa á Höfuðborgarsvæðinu til Ferðamanna og Ferðaþjónustu [Residents’ Attitudes towards Tourists and the Tourism Industry—The Capital Area]; Icelandic Tourism Research Center: Akureyri, Iceland, 2018. [Google Scholar]
  77. Sæþórsdóttir, A.D.; Gísladóttir, G.; Ólafsson, A.M.; Sigurjónsson, B.M.; Aradóttir, B. Þolmörk Ferðamennsku í Þjóðgarðinum í Skaftafelli [Tourism Carrying Capacity in Skaftafell National Park]; Ferðamálaráð Íslands; Háskóli Íslands; Háskólinn Á Akureyri: Akureyri, Iceland, 2001; p. 157. [Google Scholar]
  78. Þolmörk Ferðamennsku í Friðlandi á Lónsöræfum [Tourism Carrying Capacity in Lónsöræfi Nature Reserve]; Sæþórsdóttir, A.D. (Ed.) Ferðamálaráð Íslands; Háskóli Íslands; Háskólinn á Akureyri: Akureyri, Iceland, 2003. [Google Scholar]
  79. Aradóttir, B.; Sæþórsdóttir, A.D.; Gísladóttir, G.; Ólafsson, A.M. Þolmörk Ferðamennsku í Landmannalaugum [Tourism Carrying Capacity in Landmannalaugar]; Sæþórsdóttir, A.D., Ed.; Icelandic Tourist Board; University of Iceland; University of Akureyri: Akureyri, Iceland, 2003; p. 105. [Google Scholar]
  80. Sæþórsdóttir, A.D.; Hall, C.M. Visitor satisfaction in wilderness in times of overtourism: A longitudinal study. J. Sustain. Tour. (under revision).
  81. Sæþórsdóttir, A.D.; Ólafsson, R.; Þórhallsdóttir, G. Aðferðir Við að Meta Fjölda og Taka Úrtak Meðal Ferðamanna. Áfangaskýrsla um Verkefnið: Þolmörk Ferðamanna á Átta Vinsælum Ferðamannastöðum á Suður- og Vesturlandi [Methods to Estimate Numbers of Visitors and How to Take a Representative Sample among Visitors. Preliminary Report on Tourist Carrying Capacity at Eight Popular Tourist Destinations in South and West Iceland]; Rannsóknamiðstöð Ferðamála: Reykjavík, Iceland, 2014. [Google Scholar]
  82. Sæþórsdóttir, A.D.; Ólafsson, R. Áhrif Raflínu frá Hólmsárvirkjun að Sigöldulínu 4 á ferðamennsku og Útivist [The Effect of the Proposed Power Line from Hómsárvirkjun to Sigöldulínu 4 on Tourism and Recreation]; Land- og Ferðamálafræðistofa, Líf- og Umhverfisvísindadeild Háskóla Íslands: Reykjavík, Iceland, 2012. [Google Scholar]
  83. Icelandic Tourist Board. Ferðamálastofa-Icelandic Tourist Board: International Visitors in Iceland: Summer 2016; Icelandic Tourist Board: Reykjavík, Iceland, 2016. [Google Scholar]
  84. Sæþórsdóttir, A.D. Wilderness Tourism in Iceland—Land Use and Conflicts with Power Production; Nordia Geographical Publications; The Geographical Society of Northern Finland; Department of Geography, University of Oulu: Oulu, Finland, 2011; Volume 40. [Google Scholar]
  85. Sæþórsdóttir, A.D. Preserving wilderness at an emerging tourist destination. J. Manag. Sustain. 2014, 4, 65–78. [Google Scholar] [CrossRef]
  86. Sæþórsdóttir, A.D.; Einarsdóttir, A.V.; Þórhallsdóttir, G.; Sævarsdóttir, M.; Ólafsson, R.; Stefánsson, Þ. Þolmörk Ferðamanna: Samanburður á Árunum 2000/2001 og 2013 [Tourist Carrying Capacity: Comparison of the Years 2000/2001 and 2013]; Icelandic Tourism Research Centre: Akureyri, Iceland, 2013; p. 93. [Google Scholar]
  87. Sæþórsdóttir, A.D.; Guðmundsdóttir, A.M.; Stefánsson, Þ. Þolmörk Ferðamanna á Átta Vinsælum Ferðamannastöðum á Suður- og Vesturlandi [Visotors Carrying Capacity at Eight Popular Tourist Destinations]; Icelandic Tourist Board: Reykjavík, Iceland, 2016. [Google Scholar]
  88. Icelandic Tourist Board. Ferðamálastofa-Icelandic Tourist Board: International Visitors in Iceland: Winter 2015–2016; Icelandic Tourist Board: Reykjavík, Iceland, 2016. [Google Scholar]
  89. Maskína. Ferðamálastofa-Icelandic Tourist Board: International Visitors in Iceland, Summer 2016; Maskína: Reykjavík, Iceland, 2016; p. 405. [Google Scholar]
  90. Mælaborð Ferðaþjónustunnar. Ánægja Með Íslandsferð [Satisfaction with the Trip to Iceland]. Available online: https://www.maelabordferdathjonustunnar.is/is/ferdamenn-a-islandi/anaegja-med-islandsferd (accessed on 10 July 2020).
  91. Arnalds, A. Ecosystem disturbance in Iceland. Arct. Alp. Res. 1987, 19, 508–513. [Google Scholar] [CrossRef]
  92. Ólafsdóttir, R.; Runnström, M. Impact of Recreational Trampling in Iceland: A Pilot Study Based on Experimental Plots from Þingvellir National Park and Fjallabak Nature Reserve; The Icelandic Tourist Board: Reykjavík, Iceland, 2015. [Google Scholar]
  93. Environment Agency. Ástandsmat Áfangastaða Innan Friðlýstra Svæða [Status Evaluation on Tourist Destinations in Protected Areas]. Available online: https://ust.is/library/Skrar/utgefid-efni/astand-fridlystra-svaeda/%C3%81standsmat%20fer%C3%B0amannasta%C3%B0a%20innan%20fri%C3%B0l%C3%BDstra%20sv%C3%A6%C3%B0a-2018.pdf (accessed on 10 July 2020).
  94. Environment Agency. Svæði í Hættu [Regions in Danger]. Available online: https://www.ust.is/nattura/natturuverndarsvaedi/astand-natturuverndarsvaeda/svaedi-i-haettu/ (accessed on 8 July 2020).
  95. Efla. Álagsmat Umhverfis, Innviða og Samfélags Gagnvart Ferðaþjónustu á Íslandi: 1. Áfangi: Þróun Vísa fyrir Álagsmat. Available online: https://www.stjornarradid.is/library/01--Frettatengt---myndir-og-skrar/ANR/FerdaThjonusta/alagsmat_1._afangi_tholmarkarverkefni-lokaeintak.pdf (accessed on 10 July 2020).
  96. Efla. Jafnvægisás Ferðamála [Balance-Axis for Tourism]. Available online: https://www.saf.is/stefnurammi2030/jafnvaegisas-ferdamala/ (accessed on 10 July 2020).
  97. Ministry of Industry and Innovation; The Icelandic Travel Industry Association. Road Map for Tourism in Iceland; Ministry of Industry and Innovation & The Icelandic Travel Industry Association. Available online: https://www.stjornarradid.is/media/atvinnuvegaraduneyti-media/media/Acrobat/Road-Map-for-Tourism-in-Iceland.pdf (accessed on 10 July 2020).
  98. Icelandic Tourist Board. The Tourist Site Protection Fund. Available online: https://www.ferdamalastofa.is/en/quality-and-environment/the-tourist-site-protection-fund (accessed on 10 July 2020).
  99. Althingi. Act on National Strategy for the Development of Infrastructure to Protect Natural and Cultural Heritage; No. 20/2016; Althingi: Reykjavík, Iceland, 2016. [Google Scholar]
  100. Althingi. Icelandic Nature Conservation Act; No 60/2013; Althingi: Reykjavík, Iceland, 2013. [Google Scholar]
  101. Althingi. Transportation Act; No 41/2017; Althingi: Reykjavík, Iceland, 2017. [Google Scholar]
  102. McKinsey & Company. Coping with Success. Managing Overcrowding in Tourism Destinations; McKinsey & Company; World Travel & Tourism Council: London, UK, 2017. [Google Scholar]
  103. UNWTO. UNWTO & WTM Ministers’ Summit 2017. Available online: https://www.unwto.org/archive/europe/unwto-wtm-ministers-summit-2017 (accessed on 10 July 2020).
  104. Hall, C.M. Tourism and Social Marketing; Routledge: Abingdon, UK, 2014. [Google Scholar]
  105. Gössling, S.; Ring, A.; Dwyer, L.; Andersson, A.-C.; Hall, C.M. Optimizing or maximizing growth? A challenge for sustainable tourism. J. Sustain. Tour. 2016, 24, 527–548. [Google Scholar] [CrossRef]
  106. Higgins-Desbiolles, F.; Carnicelli, S.; Krolikowski, C.; Wijesinghe, G.; Boluk, K. Degrowing tourism: Rethinking tourism. J. Sustain. Tour. 2019, 27, 1926–1944. [Google Scholar] [CrossRef]
  107. Fletcher, R.; Murray Mas, I.; Blanco-Romero, A.; Blázquez-Salom, M. Tourism and degrowth: An emerging agenda for research and praxis. J. Sustain. Tour. 2019, 27, 1745–1763. [Google Scholar] [CrossRef]
  108. Tourtellot, J. Overtourism: Too Much of a Good Thing. Available online: https://www.nationalgeographic.com/travel/features/overtourism-how-to-make-global-tourism-sustainable/ (accessed on 10 July 2020).
  109. Kim, S. Iceland Tourism: How the Country Became Overrun with Tourists. Available online: https://www.traveller.com.au/iceland-tourism-how-the-country-is-became-overrun-with-tourists-h06xnc (accessed on 10 July 2020).
  110. World Economic Forum. The Travel & Tourism Competitiveness Report 2019. Travel and Tourism at a Tipping Point; WEF: Geneva, Switzerland, 2019. [Google Scholar]
  111. Hallsdóttir, B. Eflum Samkeppnishæfni Íslands fyrir Mr. Brown og Frau Müller [Increase Iceland’s competitiveness for Mr. Brown and Frau Müller]. 2019. Available online: https://www.thjodmal.is/2019/11/29/eflum-samkeppnishaefni-islands-fyrir-mr-brown-og-frau-muller/ (accessed on 31 July 2020).
  112. Government of Iceland. Viðspyrna fyrir Ísland. Efnahagsaðgerðir Stjórnvalda Vegna Heimsfaraldurs Kórónuveiru [Reactions for Iceland. The Government’s Economic Actions Due to the Coronavirus Pandemic]. Available online: https://www.stjornarradid.is/lisalib/getfile.aspx?itemid=9ee989c8-6ba2-11ea-9462-005056bc4d74 (accessed on 10 July 2020).
Figure 1. Number of international visitors to Iceland and number of inhabitants in Iceland. Derived from data in: [8,9].
Environments 07 00059 g001
Figure 2. Overnight stays in Iceland 2018. Derived from data in: [58].
Environments 07 00059 g002
Figure 3. Proportion of residents who consider the number of visitors as too many or way too many in 2017. Derived from: [68].
Environments 07 00059 g003
Figure 4. Proportion of summer visitors who consider the number of visitors as many or too many. Red dots destinations in the Highlands. Green dots destinations in the Lowland. Derived from data in: [12,80,84,85,86].
Environments 07 00059 g004
Figure 5. Proportion of visitors in summer and winter who consider the number of visitors as many or too many. Source: [83,87,89].
Environments 07 00059 g005
Table 1. The top 20 countries/special administrative regions with the highest ratio of number of tourists per inhabitant in 2017.
CountryPopulationTourist ArrivalsNumber of Tourists per InhabitantLand Area in Km2Number of Tourists per Km2
1Andorra *77,0012,831,00036.84686049
2Macao SAR (China)622,58517,255,00027.7115150,043
3Northern Mariana Islands56,562656,00011.64641414
4British Virgin Islands29,577335,00011.31532190
5Turks and Caicos Islands37,115416,40011.2616676
6Aruba105,3661,070,50010.21805947
7Sint Maarten (The Dutch part)40,574402,0009.93411,824
8Guam164,2811,544,0009.45402859
9Monaco39,392355,0009.22177,500
10Bahrain1,494,07411,370,0007.678014,577
11Palau17,808123,0006.9459268
12Cayman Islands63,382418,0006.62641583
13Iceland343,4002,225,0006.5103,77521
14Virgin Islands * (U.S.)107,268667,0006.23461928
15Malta467,9992,274,0004.93167196
16Bermuda63,874270,0004.2535094
17Croatia4,124,53115,593,0003.856,594276
18Hong Kong SAR (China)7,391,70027,884,0003.8275510,121
19The Bahamas381,7611,439,0003.813,878104
20Seychelles95,843350,0003.7459763
* Data from 2016, not available from 2017. Derived from data in: [11].

