Abstract
A monoethanolamine (MEA) aerosol growth model was developed to quantify the aerosol growth factor in an amine-based CO2 capture absorber that considers the gas-liquid interactions, and it is empirically validated by measuring the aerosol particle size and concentration. The aerosol growth model, using sucrose as the aerosol nuclei instead of sulfuric acid to prevent the corrosion of the test equipment, accurately predicted that the outlet aerosol size increased to the same level regardless of the sucrose concentration. It also found that particle concentration was the primary factor affecting aerosol growth and amine emissions. We found an inverse relationship between aerosol particle concentration and the aerosol size, while the MEA emissions were proportional to particle concentration.
1. Introduction
The capture of post-combustion CO2 through chemical capture and absorption by chemical solvents, and absorption by amine solutions, are commercialized technologies. However, the scale-up of these technologies has experienced challenges associated with the vaporization of chemical solvents and organic solutions. One example is the amine emissions, which are known to cause harm to humans and the environment. In one example of the capture process, the CO2 in a flue gas is chemically absorbed by the amine solvents. The enriched amine solvent is regenerated in a stripper and is recycled to the absorber [1]. Monoethanolamine (MEA) is an organic solvent commonly used for CO2 capturing in coal-fired power plants to absorb CO2. The absorbent mechanism was based on MEA that reacted with CO2 in the solution to become amine carbamate. However, MEA partially volatilizes and is absorbed into the nuclei of the complex flue gas effluents to form aerosol particles. The particle sizes of these aerosols are too small to be effectively removed through absorbers, water washes, and demisters, resulting in amine solvent loss through emissions.
Thitakamol et al. [2] reported the emission (loss) of monoethanolamine (MEA) as vapor to be 0.11–0.72 kg/tonne CO2 from an absorber with a removal capacity of 1000 tonne CO2/day, using 30 wt% MEA. This significant amount, 110–720 kg/day, of amine emissions increases operating costs. Furthermore, the lost amine reacts with NOx in the flue gas to form nitrosamines [3,4]. Kamijo et al. [5] compared amine emission between MEA and KS−1TM (Mitsubishi Heavy Industries, Ltd., Japan) solvents, reporting that emissions were 0.8–67.5 and 0.4–23.2 ppmv, respectively, based on the fuel gas containing 0–3 ppmv of SO3. Their study also found that the amine was entrained by the aerosols produced from SO3. A pilot plant at Karlsruhe Institute of Technology (Germany) conducted a series of aerosol studies and estimated gas-particle growth mechanisms [6,7,8]. Mertens et al. [8] found that the size of H2SO4 aerosols entering the absorber were smaller than 0.2 , when the particle number concentration (PNC) was 108 #/cm3. The absorber outlet aerosol size grew to 0.5–2 . Brachert et al. [9] used a condensation particle counter and electrical low-pressure impactor (ELPI+) to measure sulfuric acid aerosols and found that the ELPI+ could measure the volatile aerosol size. They also observed that the sulfuric acid concentration increased with increasing aerosol size; however, it did not affect the PNC. It was indicated that the SO3 present in the flue gas rapidly reacted with water vapor to form H2SO4 vapor, which quickly condensed to produce aerosol particles. Khakharia et al. [6] reported that amine solvents could condense on the surface of the aerosol particle nuclei and be carried to the atmosphere. These results showed three factors that affect amine emissions by aerosols during the CO2 capture process: (i) PNC, (ii) supersaturation of amine solvent, and (iii) affinity of amine with aerosols.
It has been observed that when the PNC of H2SO4 aerosol is increased by 1.6 times, the amount of MEA emissions double. Thus, it is inferred that the PNC of H2SO4 aerosol was responsible for the majority of amine emissions. Furthermore, aerosols with diameters larger than 10 µm have been removed by inertial impaction [10,11], while aerosols in the absorber that have diameters smaller than 3 µm remained, due to the limitation of the absorber. Thus, predicting aerosol growth is essential to selecting the technologies for removing aerosols in any CO2 capture process.
To predict aerosol growth, Fulk et al. [12] presented a model combining the Aspen Plus (Aspen Technology, Inc.) absorber model and MATLAB (The MathWorks, Inc.) to describe the amine aerosol growth for CO2 absorption using piperazine solvent. Their results revealed that increasing the vapor pressure of water contributed to the faster growth of the aerosol size. However, they only considered the mass transfer of the gas and aerosol interface; thus, their model was unable to describe the effect of changes in amine in the gas phase. Moreover, this model was not validated using experimental data.
Kang et al. [13] developed a multi-layer model to estimate the concentration gradients of the aerosols and investigated the aerosol growth in the absorber and water wash with the PZ-CO2 system. The results showed that aerosols could be treated as well-mixed particles and the concentration gradient was negligible. Majeed et al. [14] presented a model to observe aerosols in the MEA-CO2 system where the gas phase depletion effect was significantly stronger than that of MEA alone. It was found that the consumption of gas-phase amines had a strong influence on the growth of droplets. Majeed et al. [15] found that aerosol droplets grew from their initial size, regardless of their initial composition and the type of flue gas being processed and the initial composition of the droplets had a significant impact on the discharge. Majeed and Svendsen [16] presented a multi-droplet size model that fitted their data well. This model predicted the effects of water washing and defogging equipment where the water washing system increased the droplet size and reduced the gas and aerosol emissions.
The purpose of this study is to identify the aerosol growth contributing factors using a model developed for the amine aerosol growth in CO2 absorbers using an MEA solvent. The amine aerosol growth and flue gas effects were simultaneously considered and were subsequently validated with in-house experimental data. The purpose of the aerosol growth model was to investigate the final size and MEA emission at the outlet of the absorber by examining various input PNCs and initial sizes.
2. Modeling Approach
2.1. Data Extraction from Absorber Model
This study adopted multi-scale modeling, that is, the meter-scale for absorbers and micron-scale for aerosol droplets, because the difference in scale between the absorber columns and aerosol droplets was higher than six orders of magnitude. When the two models were simulated on the micron-scale, the number of integration steps increased, leading to a significantly higher computation cost. However, when the two models were simulated at the meter-scale, the model of the aerosol droplets could not be integrated because of the long integration steps. Thus, to implement the simulation of the two different scales, Aspen Plus and gPROMS (Process Systems Enterprise Limited) coupling was used to construct the multi-scale model. Aspen Plus was used to simulate the absorber profiles, and gPROMS was used to build an Amine Aerosol growth model. Figure 1 shows the method adopted for connecting Aspen Plus and gPROMS with Microsoft Excel used as the connecting interface. On the Aspen Plus side, Visual Basic for Applications (VBA) was used to transfer the absorber data from Aspen Plus to Excel; the extracted data were gas and liquid temperatures, gas and liquid mole fractions, liquid holdup, gas-liquid interfacial area, and mass transfer coefficients. On the gPROMS side, foreign objects, which are Excel macros provided by gPROMS, exchanged the parameters between Excel and gPROMS. In this study, the Amine Aerosol growth model sent the position of the aerosol in the absorber to receive the corresponding data from the absorber.
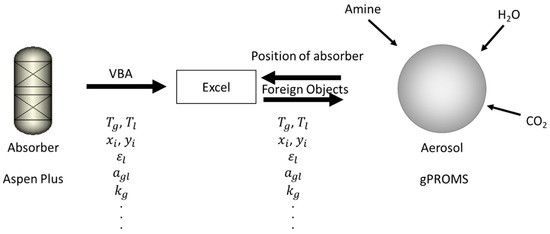
Figure 1.
Schematic of the connections between Aspen Plus and gPROMS.
2.2. Amine Aerosol Growth Modeling
The Amine Aerosol growth model was modified from Kang et al. [13] to make it applicable for CO2 absorption using MEA. Changes in the aerosol growth and amine composition during the gas phase were considered. Mass transfer was established, based on the two-film theory, to predict the aerosol growth, assuming that mass transfer between the aerosol and the gas phases was similar to the mass transfer between the liquid phase and the gas phase.
Four components, H2O, CO2, MEA, and N2, were employed in the model. For aerosol growth, the material and energy balances are expressed as follows:
where i represents the index of the component, represents the position of the aerosol in the absorber, represents the mole number of species i, represents the average velocity of the droplets, which was assumed to be the same as the gas velocity, represents the height of the column, represents the gas-aerosol mass transfer flux of species i, and represents the surface area of a droplet. Furthermore, is the temperature of the aerosol phase, is the heat transfer flux between the gas and aerosol phases, represents the total number of moles of a droplet, and is the heat capacity of the droplet. Since MEA and H2O are the solvent components, the mass transfer flux for H2O and MEA is expressed as follows:
For the hardly soluble gas CO2 in the amine solution, the mass transfer flux should be modified as
where represents the mass transfer coefficients for H2O and MEA; φ is the Fuchs–Sutugin corrective factor; represents the partial pressure of species i obtained from the absorber profile of Aspen Plus, represents the corrected equilibrium partial pressure of species I, represents the temperature of the gas phase, and R represents the ideal gas constant. Furthermore, is the enhanced mass transfer coefficient of CO2, evaluated using the chemical reaction rates, which are defined as follows:
where represents the reaction rate constant of CO2, represents the concentration of free MEA, represents the CO2 diffusivity of the mixture solution during the aerosol phase, and represents the Henry law constant of CO2.
The Fuchs–Sutugin corrective factor was used for the mass transfer rate of the micron-scale aerosol droplet and is expressed as follows:
The Knudsen number is defined as follows:
where is the accommodation coefficient, is the mean free path of the surrounding fluid molecules, and is the diameter of an aerosol droplet.
The correction of vapor pressures for the droplets was also considered in the aerosol growth model because the vapor pressure of the curved surface was higher than the normal vapor pressure. Hence, in the aerosol model, the Kelvin effect was used to correct the equilibrium partial pressure in a droplet. The corrected equilibrium partial pressure is expressed as follows:
where is the equilibrium partial pressure of component i, is the surface tension between the gas and aerosol phases, is the partial molar volume of component i in the aerosol phase, is the Boltzmann constant, is the temperature of the aerosol phase, and is the diameter of the aerosol.
The heat transfer flux is expressed as follows:
where , and are the heat of vaporization for H2O and MEA and the heat of absorption for CO2, respectively; is the heat transfer coefficient; and is the temperature of the gas phase.
The mass transfer coefficients for H2O and MEA and the heat transfer coefficient were calculated using the Sherwood number () and Nusselt number (), assuming that the aerosols were spherical. The Sherwood and Nusselt numbers are expressed as follows:
where is the gas Reynolds number, is the gas Schmidt number for species i, and is the Prandtl number. However, in the absence of convection, the Sherwood and Nusselt numbers can be considered to be 2. Hence, the mass transfer coefficients for H2O and MEA are calculated as follows:
The heat transfer coefficient was calculated as follows:
where is the gas diffusion coefficient of species i, obtained from the absorber profile of Aspen Plus; is the diameter of an aerosol droplet; and is the gas thermal conductivity.
The diameter of the droplets was calculated as follows:
where is the density of the aerosol droplets and is the molecular weight of the aerosol droplets. The equilibrium partial pressures during the aerosol phase are estimated based on the modified Raoult’s law as follows:
where and are the equilibrium and saturated partial pressures of H2O and MEA during the aerosol phase, respectively; is the activity coefficient; and is the mole fraction. The equilibrium partial pressures of CO2 during the aerosol phase were obtained from the correlation [17].
With regard to the change in the gas phase, the change in MEA concentration in the gas phase was considered in the Amine Aerosol growth model because the MEA concentration was significantly lower than that of H2O and CO2. This resulted in the mass transfer of MEA across the gas-aerosol interface, and significantly affected the gas-phase MEA mole fraction. Compared to the other two components, the change in the MEA composition caused by the gas-aerosol phase interaction may have been lower than that caused by the gas–liquid interaction. As a result, the MEA composition was recalculated by considering both the gas-aerosol and gas-liquid interactions. Furthermore, the mole fractions of N2, H2O, and CO2 were obtained from process modeling using Aspen Plus. The MEA material balance can be simplified as a differential equation of the MEA partial pressure,, which is expressed as follows:
where is the mass transfer flux of MEA between the gas and liquid phases, is the gas-liquid contact area, is the number of particle concentration, and is the ideal gas constant.
This equation considers the mass transfers of gas–aerosol and gas–liquid interfaces. In the gas–aerosol mass transfer, a new term affecting PNC was introduced to estimate the total mass transfer flux from gas to aerosol in a column. The gas–liquid mass transfer flux of MEA is expressed as follows:
where is the gas mass transfer coefficient of the MEA for the gas–liquid interface, obtained from the absorber profile of Aspen Plus, is the partial pressure of the MEA, and is the equilibrium partial pressure of the MEA for the liquid phase, obtained from the absorber profile of Aspen Plus.
The reactions in the aerosol phase were assumed as the same as the reaction in the liquid phase [18].
2.3. Physical Properties
The thermodynamic properties and mass transfer parameters of the gas and liquid phases were obtained from the absorber model using the Excel interface. The thermodynamic properties of the aerosol phase, such as the activity coefficients, heat capacity, surface tension, and true composition, were obtained from the Aspen Properties database, using the electrolyte non-random-two-liquid (e-NRTL) model for MEA through the CAPE-OPEN Thermo-interface to connect with gPROMS. A few missing parameters were included based on the literature, such as vapor pressure and diffusion coefficient for the aerosol phase. The origins of these properties are listed in Table 1.

Table 1.
Summaries of the sources of thermodynamic properties and mass transfer parameters.
2.4. Amine Absorber Modeling Using Aspen Plus
The rate-based absorber was modified by [19], employing a rigorous e-NRTL thermodynamic framework and reaction kinetics. Models for the mass transfer and interfacial area were based on Onda et al. [5] and the liquid holdup was based on Stichlmair et al. [20]. The number of stages for the absorber was set to 100 to export smooth profiles.
2.5. Experiments
Figure 2 shows the experimental flow employed in this study. A lab-scale packed-bed absorber [21] was used to carry out the experiment for validating aerosol growth. The equipment contained four removable glass packed sections with their inner diameter and height being 25.4 and 300 mm, respectively, however, in this study only one packed section was used to investigate CO2 removal and aerosol size. The packed section was fully filled with plastic Raschig rings, as described in Table 2, with the porosity and packing surface area being 0.86 and 610 m2/m3, respectively. The liquid solvent flow was set to 0.2 L/min, and 1.5 and 3 L/min of inlet gas flows were evaluated. The inlet flow containing 20% CO2 and 80% N2 passed through a solution and an aerosol generator (Model 3076, TSI) to carry the aerosol into the absorber. The solution was prepared with sucrose instead of sulfuric acid to the nuclei of the aerosol to prevent erosion of the detection equipment. While sulfuric acid reacts with the amine, the amount of sulfuric acid in the aerosol was too few so the reaction between sulfuric acid and MEA can be ignored. Sucrose does not react with MEA solvent. Thus, sucrose can be used to simulate sulfuric acid in order to react with MEA solvent.
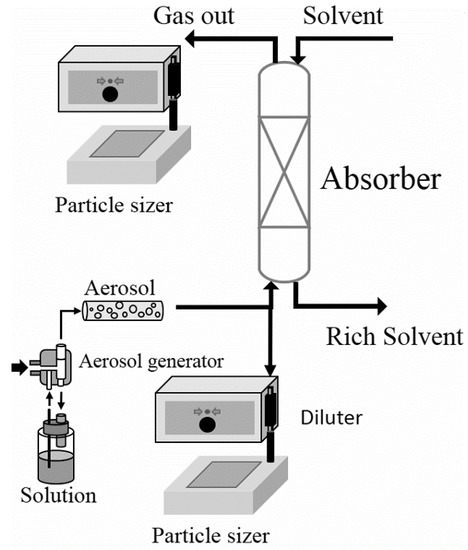
Figure 2.
Schematic diagram of the experimental flow.
Table 2.
Operating conditions of the lab-scale absorber.
Sucrose is a nonvolatile solute that provides a condensed nucleus during the atomization process and produces aerosols with stable size distributions because of its fixed velocity when passing through an atomizer [22,23]. An optical particle sizer (Model 3330, TSI) was used to measure the aerosol particle size distribution (PSD) and PNC at the inlet and outlet of the gas. The particle sizer sizes in the range of 0.3–10 . The PNC range of the particle sizer was 0–3000 #/cm3. To prevent exceeding the PNC count limitation, an aerosol diluter (Model 3332, TSI) was installed between the particle size and gas flows with a dilution ratio of 1/100. The detailed operating conditions are listed in Table 2.
3. Results and Discussion
3.1. Investigation of the Experiment
Figure 3 shows the inlet aerosol PSD at different sucrose concentrations. The PNCs were found to be 73,094, 133,114, and 225,076 #/cm3 for sucrose concentrations of 1000, 3000, and 10,000 ppm, respectively. As shown in Figure 3, most particles were found to be less than 0.3 um in size. Figure 4 shows the distribution of the outlet aerosol particle sizes. Compared to the inlet aerosol particle sizes, the average sizes of the outlet aerosol were found to be 1.43, 1.36, and 1.33, and the PNCs were observed to be approximately and for sucrose concentrations of 1000, 3000, and 10,000 ppm, respectively. The results showed that the sucrose concentration was not affected by the outlet aerosol size.
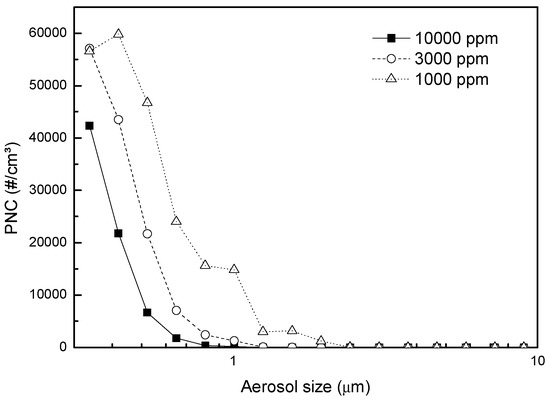
Figure 3.
PSD of the inlet gas flow.
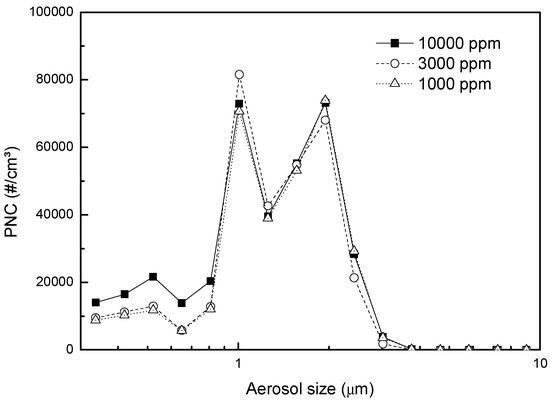
Figure 4.
PSD of the outlet gas flow.
3.2. Validation of Absorber and Aerosol Growth Model
Figure 5 shows that the absorber model could predict the gas outlet CO2 mole fraction of the experimental data at 1.5 and 3 L/min gas flow rates. Results from the absorber model were found to be in good agreement with the experimental data, with an average error of 3.2%. Figure 6 shows that the aerosol growth model could predict the average outlet aerosol size with an average error of 2.6%, after adjusting the accommodation coefficient, to 0.025.
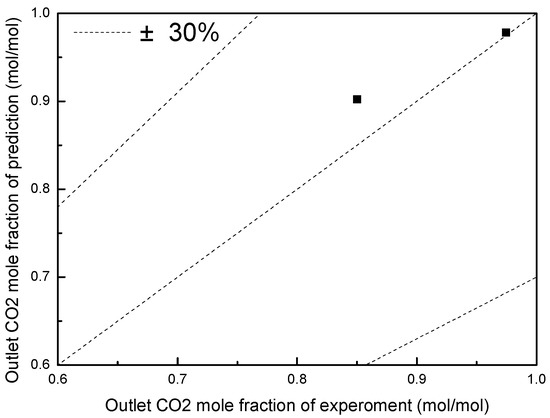
Figure 5.
Agreement of the CO2 outlet mole fraction between the absorber model and experimental data of the absorber.
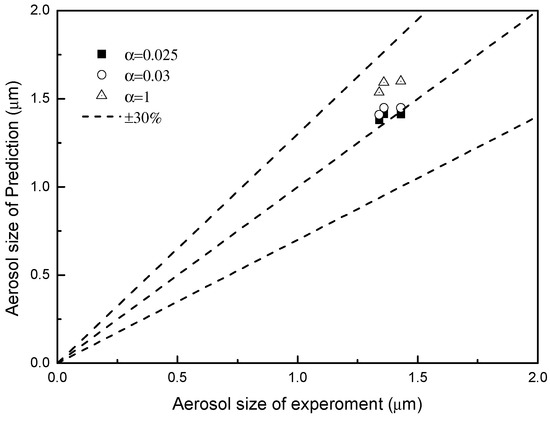
Figure 6.
Agreement of the gas outlet aerosol size between the aerosol growth model and experimental data of the aerosol with different accommodation coefficients .
.
3.3. Effect of PNC on Aerosol Growth
Figure 7 shows the predicted aerosol size growth in the experimental absorber using four select aerosol input PNCs and = 0.025. The Z/Ztot represents the normalized height of the absorber. 0 means the bottom of the column and 1 indicates the top column. Aerosols will continue to grow in the absorber because the MEA solvent is transferred into the aerosol to disrupt the partial pressure equilibrium. CO2 is also absorbed because the concentration of amine increases in the aerosol phase.
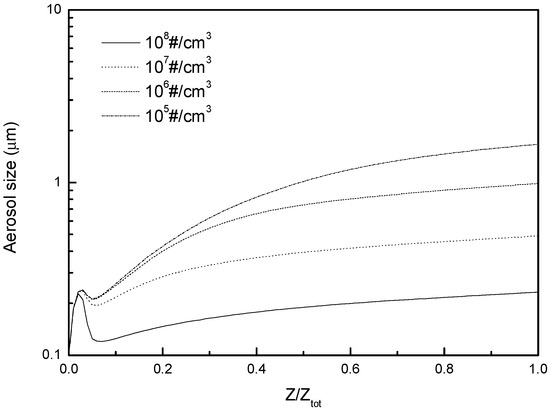
Figure 7.
Aerosol size profile in the absorber with different PNCs observed using the aerosol growth model.
Figure 8 shows the contour lines of the outlet aerosol PSD. PNC was observed to be the main factor affecting aerosol growth because the outlet aerosol size decreased as the PNC increased, whereas the initial aerosol size only slightly affected the growth as the PNC was lower than 106 #/cm3. When the PNC was 105 #/cm3, the outlet aerosol size with 0.25 μm of the initial aerosol size was smaller than other larger initial aerosol sizes because vapor pressures were high due to the high surface tension when the drop diameter was 0.25 μm and the aerosol might easily evaporate to limit growth in the absorber. The outlet aerosol size was only related to PNC because the aerosol growth rate was related to 1/D3. As the aerosol particle size increased, the growth rate decreased. Hence, regardless of the initial sizes used, the aerosol size would grow to a similar size if the resident time of the aerosol in the absorber was sufficiently long.
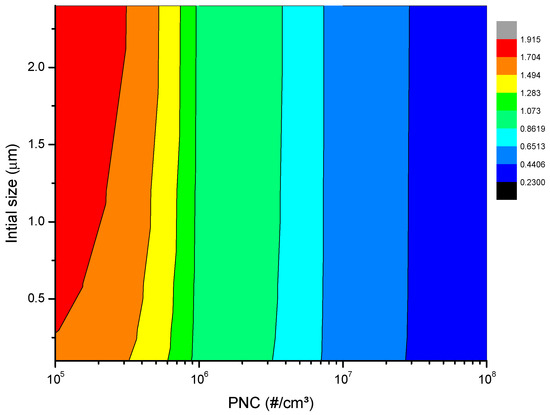
Figure 8.
Contours of the outlet aerosol size lines with different initial aerosol sizes and PNCs.
3.4. Effect of PNC on MEA Emissions
Figure 9 shows the MEA emissions by computing the MEA concentrations of the gas and aerosol phases. The results showed that the MEA emission increased as the PNC increased. An emission of 331 mg/m3 was observed at a PNC of 108 #/cm3, which is tripled in comparison to 155 mg/m3 at a PNC of 105 #/cm3. Figure 10 shows the contours of the MEA emissions, and from them, it can be observed that PNC was the main factor in removing MEA from the absorbers. The initial size of the aerosol was also observed to have an effect on finial aerosol size when the PNC was below 107 #/cm3. No matter what initial aerosol size was used, the outlet aerosol size was similar. With the same aerosol size, the MEA concentration for a single aerosol droplet was also similar. Thus, the initial aerosol size has only a slight effect on MEA emissions. Owing to the fixed MEA concentration for a single aerosol, the amount of MEA emissions increased when the PNC increased.
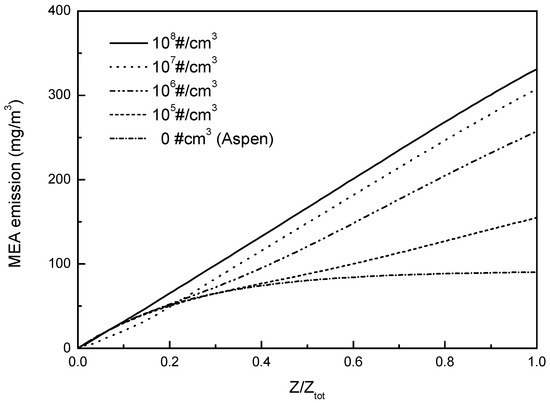
Figure 9.
Total MEA concentration profile of the gas phase in the absorber with different PNCs using the aerosol growth model.
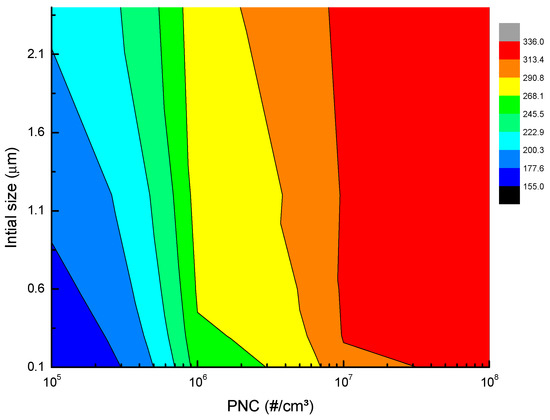
Figure 10.
Contours of MEA emissions with different initial aerosol sizes and PNCs.
4. Conclusions
In this study, we built an MEA aerosol growth model that incorporated the effect of PNC, between the aerosol and gas phases, on aerosol growth. We carried out an experiment to measure the outlet aerosol particle size. In the experiment, sulfuric acid was replaced with sucrose as the nuclei of the aerosol to prevent corrosion of the equipment. Experimental results showed that the inlet aerosol sizes were smaller than 0.3 and the outlet aerosol size increased to 1.38 with a PNC of #/cm3. The aerosol growth model was validated using in-house experimental data. After adjusting the accommodation coefficient to 0.025, the aerosol growth model was able to predict the aerosol size with an accuracy of 2.6%. PNC was observed to be the main factor affecting aerosol growth and MEA emission, because when the PNC increased, the aerosol size was observed to decrease, while the MEA emission was observed to increase.
Author Contributions
Supervision, J.-L.K., D.S.-H.W., S.-S.J., D.-H.T.; Writing—original draft, J.-L.K.; Writing—review & editing, J.-L.K. Analysis: J.-L.K. and K.-T.L. All authors have read and agreed to the published version of the manuscript.
Funding
This research received no external funding.
Acknowledgments
The authors acknowledge the financial support provided by the Ministry of Science and Technology through the grants of MOST 107-3113-E-007-002 and MOST 108-2636-E-224 -001.
Conflicts of Interest
The authors declare no conflict of interest.
References
- Lin, Y.-J.; Chang, C.-C.; Wong, D.S.-H.; Jang, S.-S.; Ou, J.-J. Control Strategies for Flexible Operation of Power Plant Integrated with CO2 Capture Plant, Computer Aided Chemical Engineering. AIChE J. 2012, 58, 2697–2704. [Google Scholar] [CrossRef]
- Thitakamol, B.; Veawab, A.; Aroonwilas, A. Environmental impacts of absorption-based CO 2 capture unit for post-combustion treatment of flue gas from coal-fired power plant. Int. J. Greenh. Gas Control 2007, 1, 318–342. [Google Scholar] [CrossRef]
- Dave, N.; Do, T.; Jackson, P.; Feron, P.; Azzi, M.; Attalla, M. CO2 Capture Mongstad-Project B Theoretical Evaluation of the Potential to Form and Emit Harmful Compounds, Task 1: Process Chemistry; The Commonwealth Scientific and Industrial Research Organisation (CSIRO) Report; CSIRO: Canberra, Australia, 2010.
- Fine, N.A.; Goldman, M.J.; Nielsen, P.T.; Rochelle, G.T. Managing n-nitrosopiperazine and dinitrosopiperazine. Energy Procedia 2013, 37, 273–284. [Google Scholar] [CrossRef]
- Kamijo, T.; Kajiya, Y.; Endo, T.; Nagayasu, H.; Tanaka, H.; Hirata, T.; Yonekawa, T.; Tsujiuchi, T. SO3 impact on amine emission and emission reduction technology. Energy Procedia 2013, 37, 1793–1796. [Google Scholar] [CrossRef]
- Khakharia, P.; Brachert, L.; Mertens, J.; Anderlohr, C.; Huizinga, A.; Fernandez, E.S.; Schallert, B.; Schaber, K.; Vlugt, T.J.; Goetheer, E. Understanding aerosol based emissions in a Post Combustion CO2 Capture process: Parameter testing and mechanisms. Int. J. Greenh. Gas Control 2015, 34, 63–74. [Google Scholar] [CrossRef]
- Mertens, J.; Brachert, L.; Desagher, D.; Thielens, M.; Khakharia, P.; Goetheer, E.; Schaber, K. ELPI+ measurements of aerosol growth in an amine absorption column. Int. J. Greenh. Gas Control 2014, 23, 44–50. [Google Scholar] [CrossRef]
- Onda, K.; Takeuchi, H.; Okumoto, Y. Mass transfer coefficients between gas and liquid phases in packed columns. J. Chem. Eng. Jpn. 1968, 1, 56–62. [Google Scholar] [CrossRef]
- Brachert, L.; Mertens, J.; Khakharia, P.; Schaber, K. The challenge of measuring sulfuric acid aerosols: Number concentration and size evaluation using a condensation particle counter (CPC) and an electrical low pressure impactor (ELPI+). J. Aerosol Sci. 2014, 67, 21–27. [Google Scholar] [CrossRef]
- Bradie, J.; Dickson, A. Removal of Entrained Liquid Droplets by Wire-Mesh Demisters. In Proceedings of the Institution of Mechanical Engineers, Conference Proceedings; SAGE Publications Sage: London, UK, 1969; pp. 195–203. [Google Scholar]
- El-Dessouky, H.T.; Alatiqi, I.M.; Ettouney, H.M.; Al-Deffeeri, N.S. Performance of wire mesh mist eliminator. Chem. Eng. Process. Process Intensif. 2000, 39, 129–139. [Google Scholar] [CrossRef]
- Fulk, S.M.; Chen, E.; Rochelle, G.T. Aerosol Mitigation in Amine-Based CO2 Capture. In Proceedings of the 2nd Post Combustion Capture Conference (PCCC2), Bergen, Norway, 17–20 September 2013. [Google Scholar]
- Kang, J.-L.; Zhang, Y.; Fulk, S.; Rochelle, G.T. Modeling amine aerosol growth in the absorber and water wash. Energy Procedia 2017, 114, 959–976. [Google Scholar] [CrossRef]
- Majeed, H.; Knuutila, H.; Hillestad, M.; Svendsen, H.F. Gas phase amine depletion created by aerosol formation and growth. Int. J. Greenh. Gas Control 2017, 64, 212–222. [Google Scholar] [CrossRef]
- Majeed, H.; Hillestad, M.; Knuutila, H.; Svendsen, H.F. Predicting aerosol size distribution development in absorption columns. Chem. Eng. Sci. 2018, 192, 25–33. [Google Scholar] [CrossRef]
- Majeed, H.; Svendsen, H.F. Characterization of aerosol emissions from CO2 capture plants treating various power plant and industrial flue gases. Int. J. Greenh. Gas Control 2018, 74, 282–295. [Google Scholar] [CrossRef]
- Xu, Q.; Rochelle, G. Total pressure and CO2 solubility at high temperature in aqueous amines. Energy Procedia 2011, 4, 117–124. [Google Scholar] [CrossRef]
- Kang, J.-L.; Sun, K.; Wong, D.S.-H.; Jang, S.-S.; Tan, C.-S. Modeling studies on absorption of CO2 by monoethanolamine in rotating packed bed. Int. J. Greenh. Gas Control 2014, 25, 141–150. [Google Scholar] [CrossRef]
- AspenTech. Rate-Based Model of the CO2 Capture Process by MEA Using Aspen Plus; AspenTech: Bedford, MA, USA, 2013. [Google Scholar]
- Stichlmair, J.; Bravo, J.; Fair, J. General model for prediction of pressure drop and capacity of countercurrent gas/liquid packed columns. Gas Sep. Purif. 1989, 3, 19–28. [Google Scholar] [CrossRef]
- Liu, J.; Gao, H.-C.; Peng, C.-C.; Wong, D.S.-H.; Jang, S.-S.; Shen, J.-F. Aspen Plus rate-based modeling for reconciling laboratory scale and pilot scale CO2 absorption using aqueous ammonia. Int. J. Greenh. Gas Control 2015, 34, 117–128. [Google Scholar] [CrossRef]
- Kaufman, S.L. Electrospray diagnostics performed by using sucrose and proteins in the gas-phase electrophoretic mobility molecular analyzer (GEMMA). Anal. Chim. Acta 2000, 406, 3–10. [Google Scholar] [CrossRef]
- Lee, F.-C.; Lu, Y.-F.; Chou, F.-C.; Cheng, C.-F.; Ho, R.-M.; Tsai, D.-H. Mechanistic study of gas-phase controlled synthesis of copper oxide-based hybrid nanoparticle for CO oxidation. J. Phys. Chem. C 2016, 120, 13638–13648. [Google Scholar] [CrossRef]


© 2020 by the authors. Licensee MDPI, Basel, Switzerland. This article is an open access article distributed under the terms and conditions of the Creative Commons Attribution (CC BY) license (http://creativecommons.org/licenses/by/4.0/).