Comparative Analysis on Urban Flood Countermeasures Based on Life Cycle Thinking: A Comparison between Enhancing of Drainage Capacity Project and Sponge City


Abstract
:1. Introduction
2. Method
2.1. Design and Cost Estimating Basis of This Study
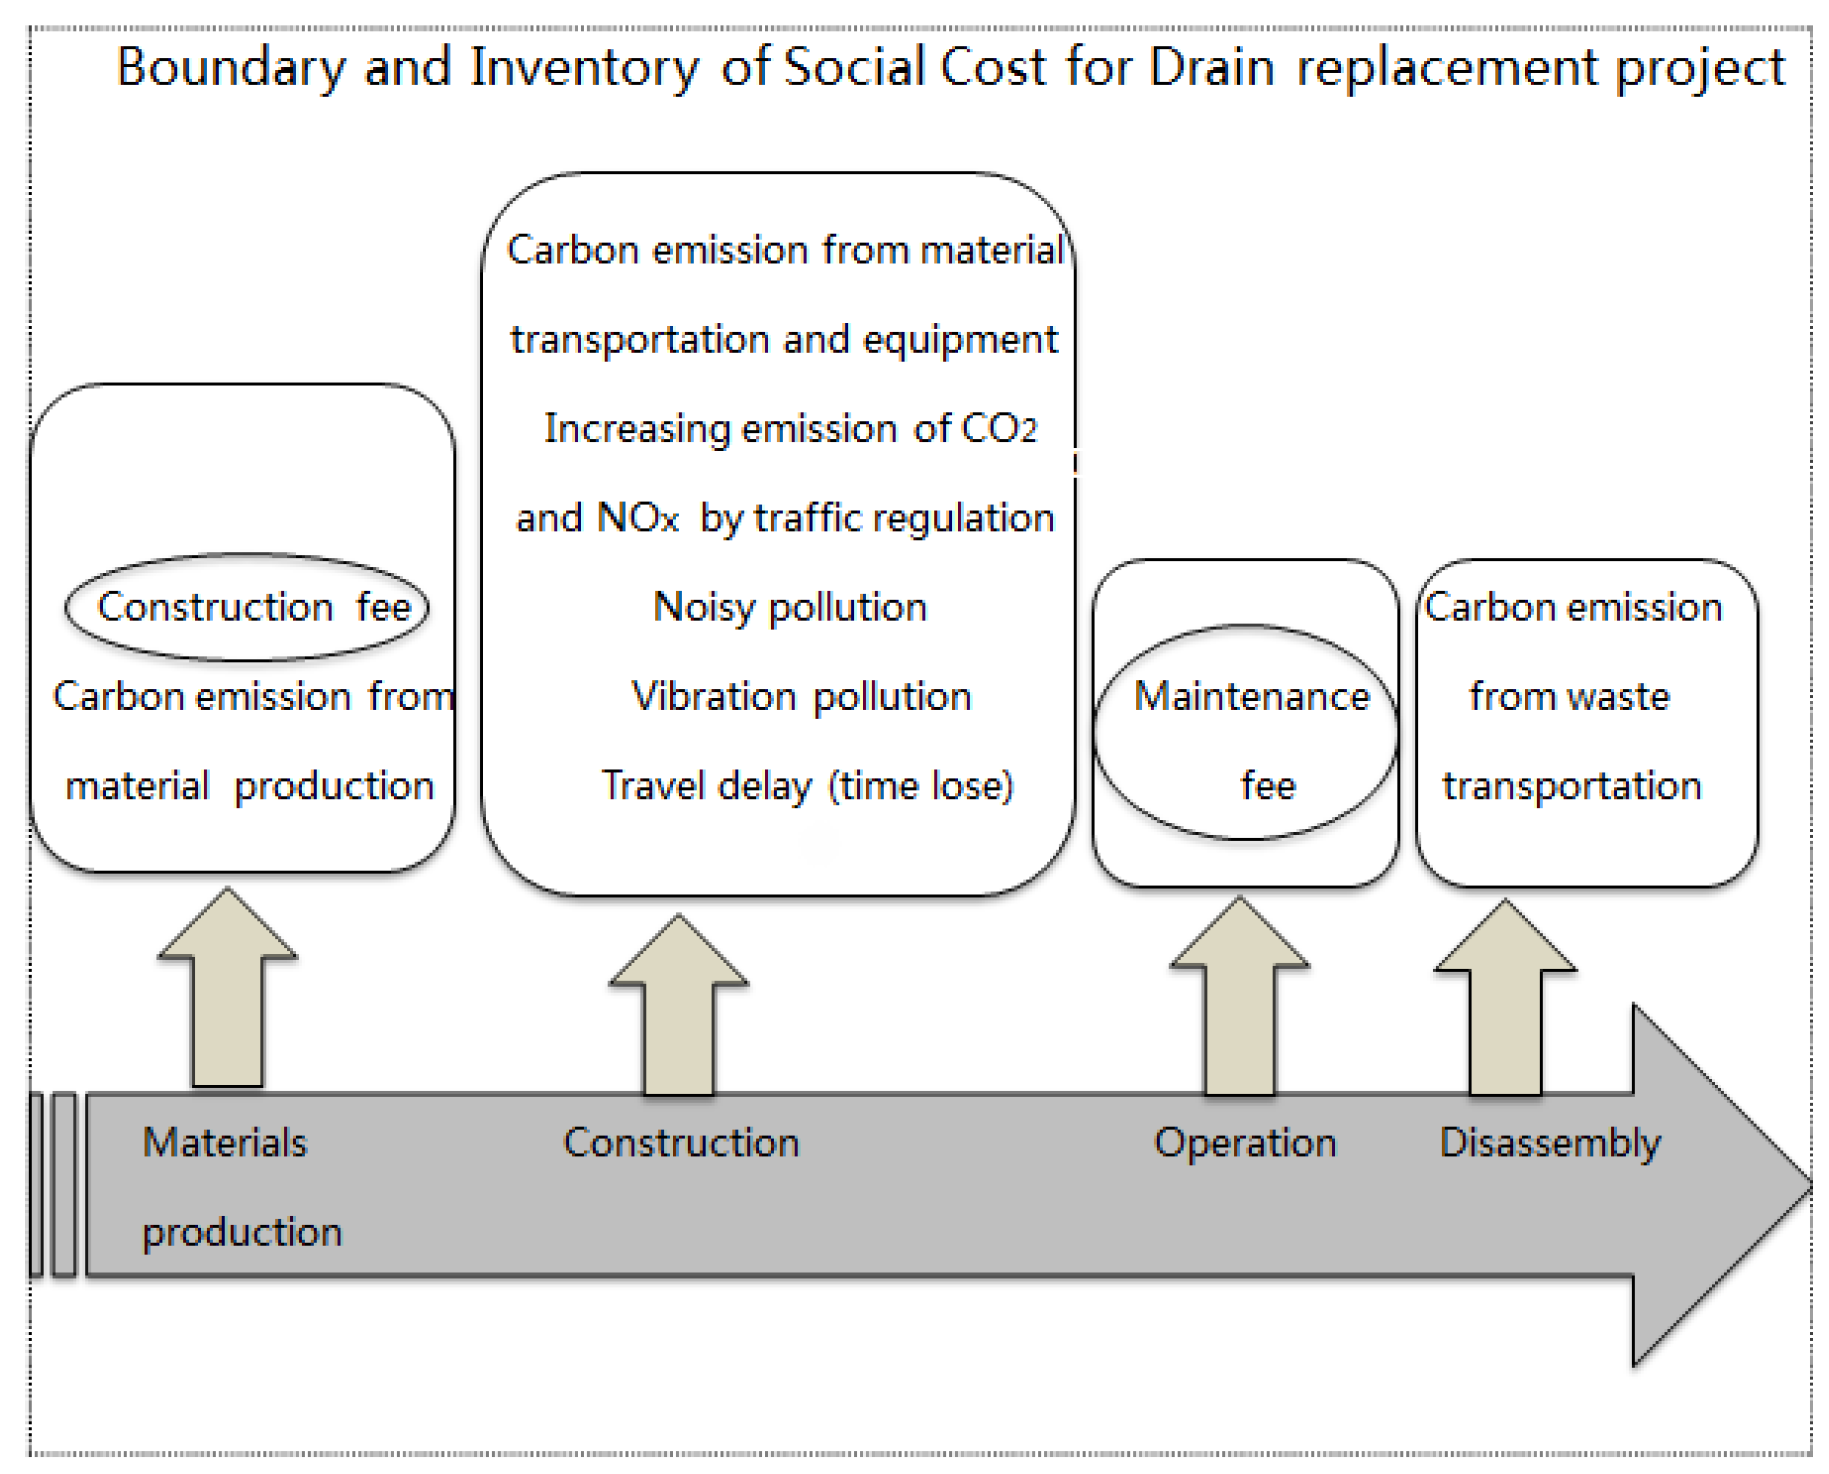
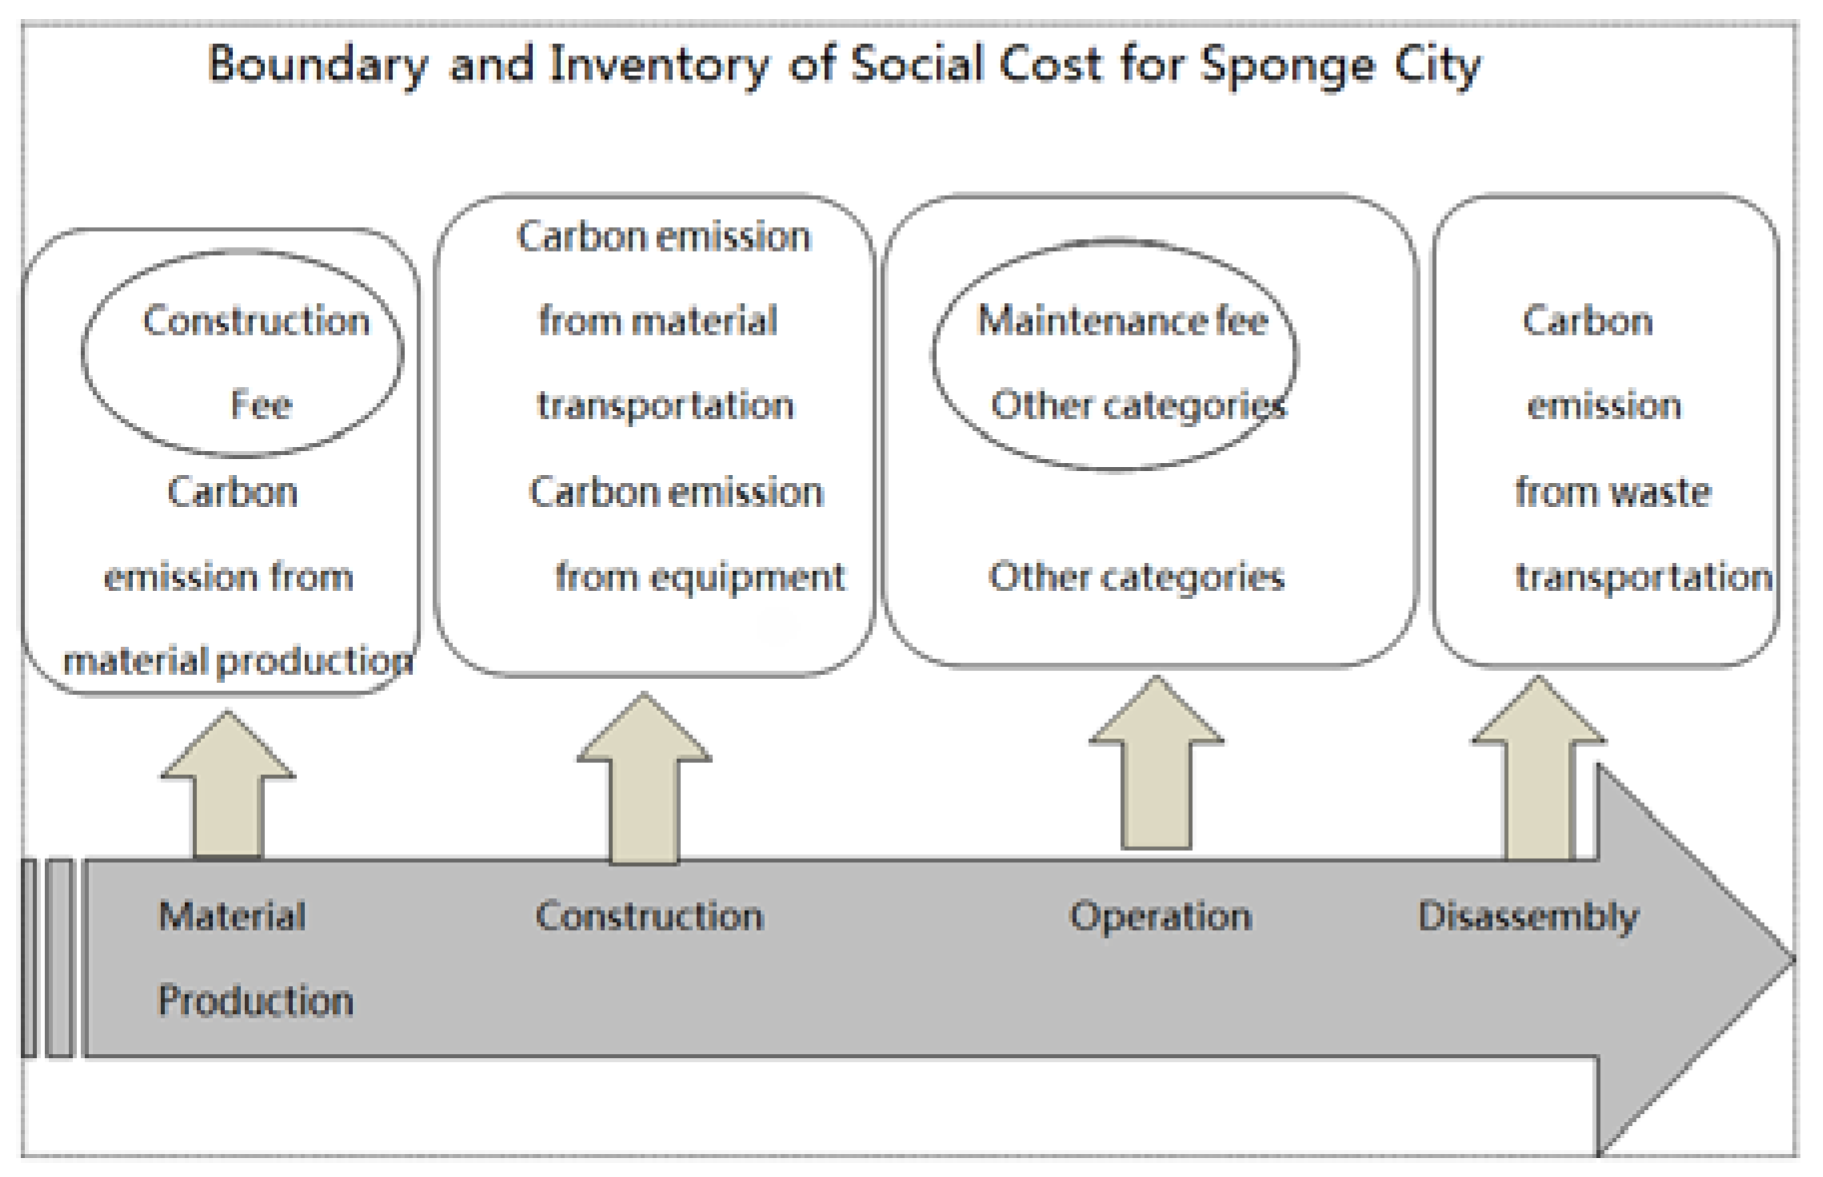
2.2. Boundary and Inventory for the Two Projects
3. Case Study
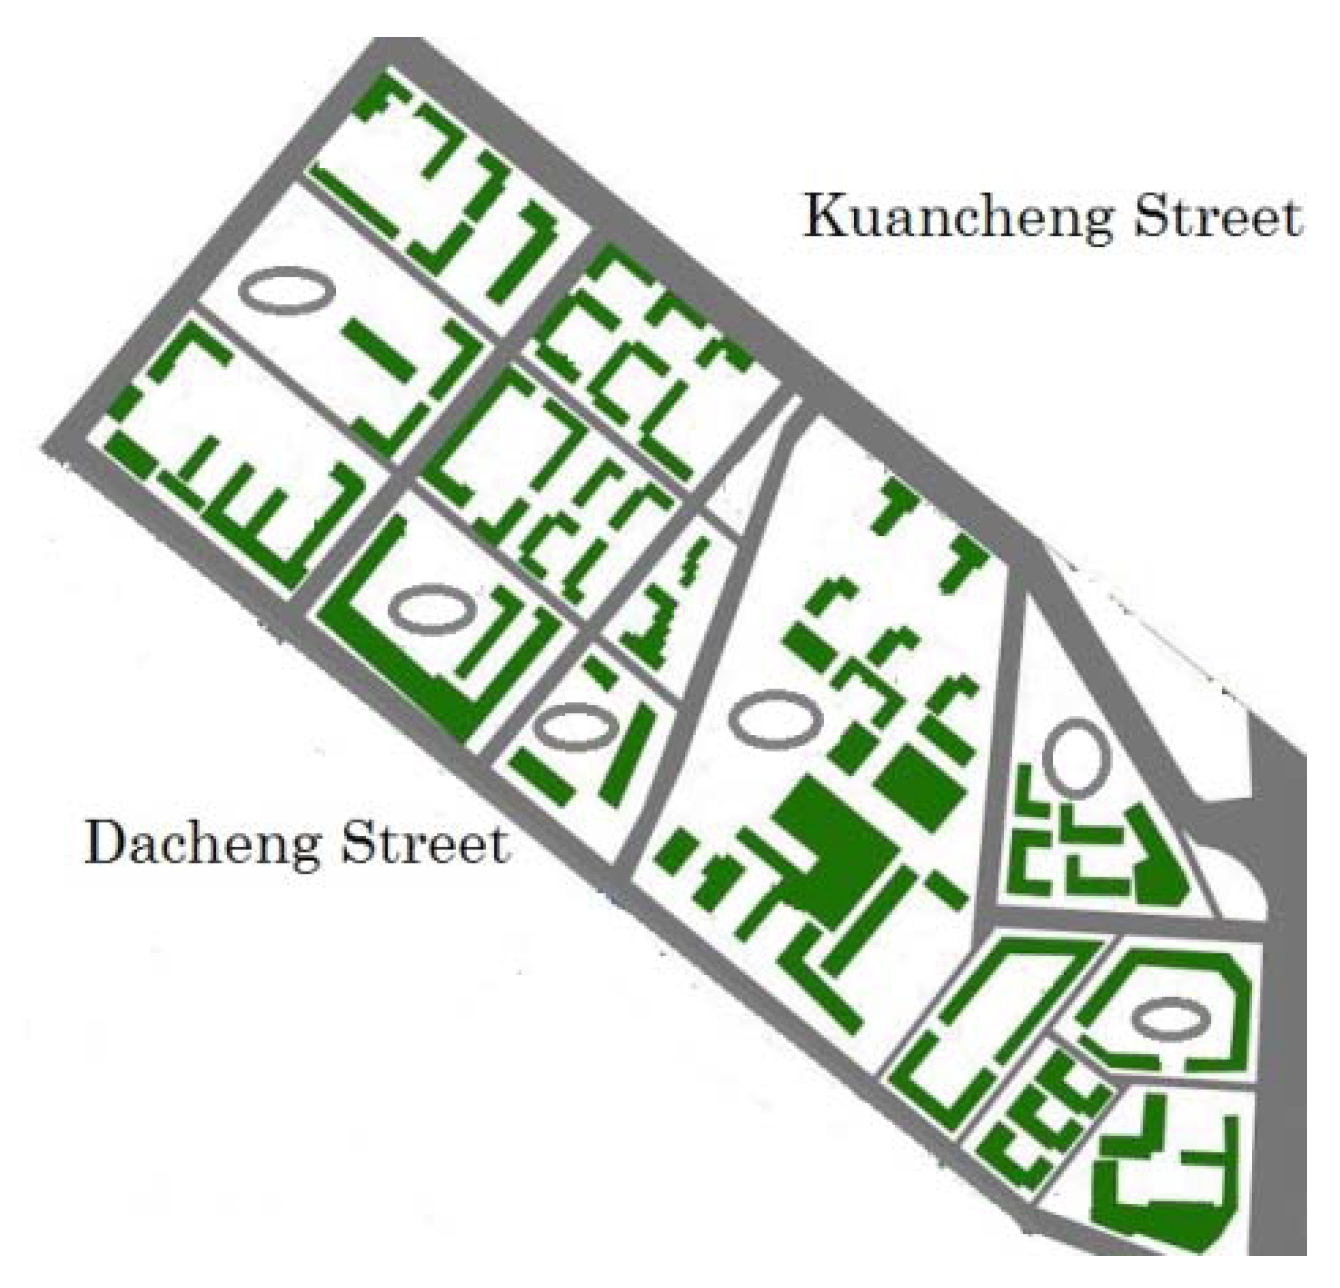
3.1. Study Area
- : Designed rainstorm intensity (L/ (s. hm2))
- : Runoff coefficient, which is introduced as 0.45
- : Catchment area (ha), is estimated as 11.95 ha.
- : (L/(s.hm2)) is calculated by rainstorm intensity formula ‘Code’ (p. 22)
- : Rainfall duration (min)
- : Designed return period (year)
3.2. Initial Costs for Drain Replacement Project and Sponge City Project
3.2.1. Initial Costs for Drain Replacement Project
- Construction feeBased on ‘Quota’ and the existing studies (Wang et al., 2008), unit cost was calculated as 4846 RMB/m (inflation rate was considered as 2.5%/year in 10 years). Project lengths of Kuancheng and Dacheng street are 895 m and 912 m respectively, total project period is 70 days.
- Maintenance feeAccording to Harbin City urban road maintenance standard (Table 1), the unit maintenance fee was obtained as 41.36 RMB/m.
3.2.2. Initial Costs for Sponge City Project
- Construction feeAccording to ‘Indices’, unit container green roofs and sand pond costs are obtained as 39,120 RMB/100 m2 and 28,878 RMB/10 m3, the project period is 90 days.
- Maintenance feeUnit maintenance fee was obtained from completed sponge city sample project (Qunli Healthy Ecological Garden) in Harbin [19]. The maintenance fees for this project were calculated as 702,000 RMB in total.
- Other categoriesIn the Sponge City project, positive environmental impacts are anticipated. According to the ‘manual’, 20% of annual precipitation could be stored (annual average precipitation of Harbin is 569 mm). Therefore, 6885 m3 storm water could be harvested, which can reduce carbon emission from the equivalent tap water production; based on existing study (Bianchini et al., 2012), green roofs can save 4.3 kWh /m2 in cooling energy consumption. Based on top water and electricity emission factors in China being 0.91 and 0.785 kg-CO2/tonne respectively (Lin et al., 2018), reductions of 6.27 and 197 tonne-CO2 emission annually can be calculated, respectively.
3.3. External Costs for Drain Replacement Project and Sponge City Project
3.3.1. External Costs for Drain Replacement Project
- Carbon emissions from material productionMain material in drain replacement project is concrete. According to industries standard in China, concrete carbon emission factor in life cycle is calculated as 1.33 tonne-CO2/m (Lin et al., 2018), which had considered the production, transportation, and disposal processes.
- Carbon emissions from equipmentBased on ‘Quota’ and electricity emission factor in China, unit data was calculated as 0.107 tonne-CO2/ m.
- Increasing emissions of CO and NOx by traffic regulationIn transport assignment models the common way to describe the relationship between travel time and traffic flows is the BPR function [20], as
- : the total travel time on link r
- : the free travel time on link r
- : refers to the traffic volume and is introduced as 2200/h for one lane
- : the travel capacity of link r, , and are the traffic/delay parameters. It was assumed that left and right of Equation (3) were divided by travel length, and another equation was obtained.
- The link from Wenhua to Nanli was set as link A (Kuancheng), and its length is 0.895 km; the link from Zhang kou to Daoli was set as link B (Dacheng), and its length is 0.912 km. Link A and B was simulated as a target link.
- Calculation of , . In order to calculate conveniently, here set as 1, according to the measured traffic volume and travel speed, was calculated (see Table 2).
- In a three-lane street, one lane was blocked, travel capacity from morning 7:00 to 19:00 was decreased from 79,200/day to 52,800/day. We assumed that the traffic volume would not change with or without street blocks. Therefore, the travel speeds with a blocked lane were calculated by BPR function.
- Based on vehicle emission coefficient from Japan National Institute for Land and Infrastructure Management (NILIM) (we did not find Chinese emission coefficient standard) [21] (p5–43 and p5–50), extraordinary emission of CO, and NO2 per vehicle per day due to the decrease of vehicle average speed was calculated.
- Multiplied by traffic amount in target time zone (from morning 7:00 to 19:00) and project duration (70 days), the increasing emission of CO and NOx are calculated.
- Noise and vibration pollution costsA basic construction area noise and vibration levels are 85 dB and 75 dB, the comfortable noise maximum value and natural vibration level are 55 dB and 65 dB. Difference can be calculated. Numbers of people affected can be calculated by population density (315/ha) and affected area (20 m away from the streets, 40 m both sides). Unit monetary costs of noise and vibration pollution are 0.75 and 0.56 (RMB/dB, people, day) respectively, excavation time is 10 days.
- Travel delay (time loss)In traffic simulation section, delay time for one vehicle could be calculated. Multiplied with traffic amount and time value 20 RBM/h (adjustment index by 2.5% based on Chinese study in Table 3), time loss could be calculated as 26,631,990 RMB.
3.3.2. External Costs for Sponge City Project
- Carbon emission from materials productionMaterial utilized in the project mainly includes sand, concrete, and steel, and the volumes are calculated as 4709 m3, 456 m3, and 38.991 tonnes respectively by ‘Indices’. Their life cycle emission factors were obtained from industries standard as 5.97 kg-CO2/m3, 1.33 tonne-CO2/ m3, and 2.62 tonne-CO2/ tonne respectively.
- Carbon emission from equipmentBased on ‘Indices’ and electricity emission factor, unit data was calculated as 0.138 tonne-CO2/m2.
- Other categoriesIn the Sponge City project, external positive environmental impacts are also anticipated. Unit carbon reduction data for Sedum lineare average carbon absorbing capacity was derived from previous researches, emission volume was estimated as 17.7 tonne-CO2/ha; air quality improvement is related to the mitigation of nitrogen oxide (NOx). Unit data was derived from previous studies as 0.326 tonne-NOx/ ha.
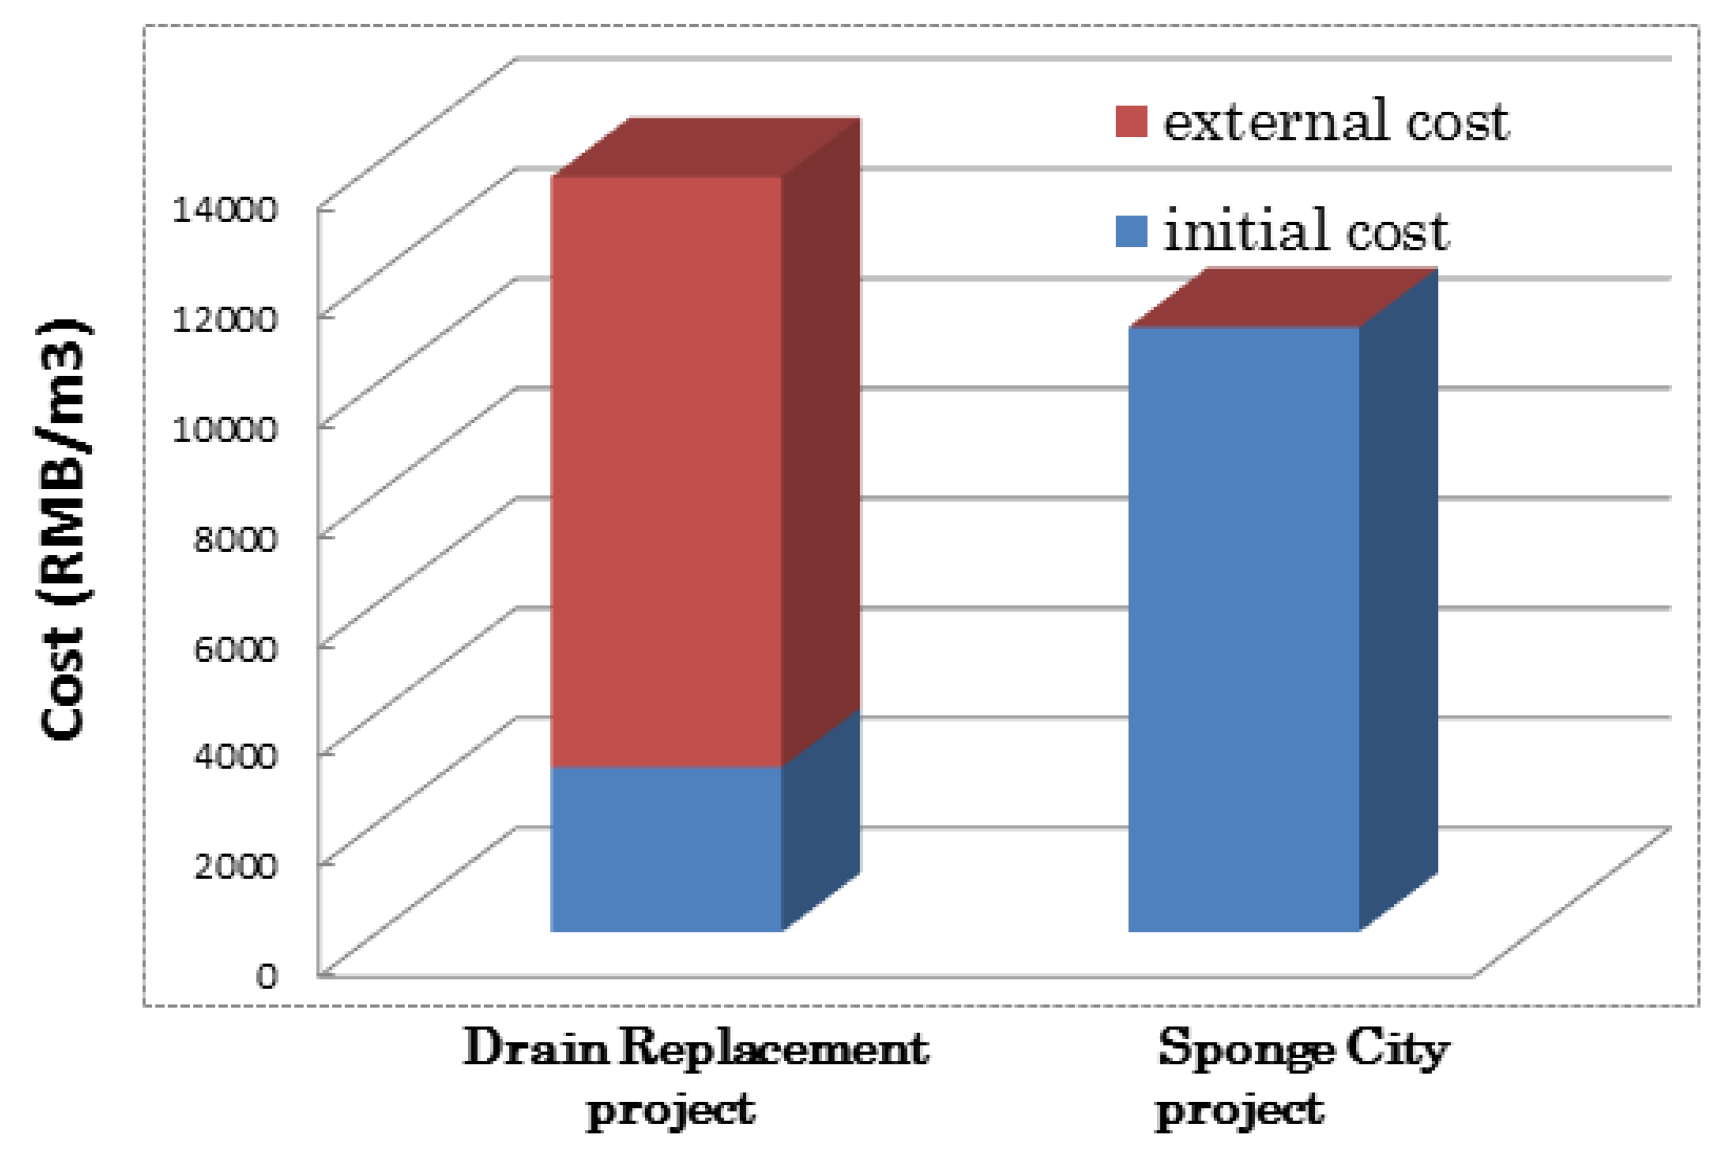
3.4. Results
4. Discussion
5. Conclusions
Author Contributions
Funding
Acknowledgments
Conflicts of Interest
Abbreviations
| IUWM | Integrated Urban Water Management |
| LID | Low Impact Development |
| SUDS | Sustainable Urban Drainage Systems |
| WSUD | Water Sensitive Urban Design |
References
- Chan, F.; James, A.G. “Sponge City” in China—A breakthrough of planning and flood risk management in the urban context, China. Land Use Policy 2018, 76, 772–778. [Google Scholar] [CrossRef]
- Shi, P.J.; Yuan, Y. The effect of land use/cover change on surface runoff in Shenzhen region, China. CATENA 2007, 69, 31–35. [Google Scholar] [CrossRef]
- Zhang, S.H.; Pan, B.Z. An urban storm-inundation simulation method based on GIS. J. Hydrol. 2014, 517, 260–268. [Google Scholar] [CrossRef]
- Huang, H.; Chen, X.; Zhu, Z.; Xie, Y.; Liu, L.; Wang, X.; Wang, X.; Liu, K. The changing pattern of urban flooding in Guangzhou, China. Sci. Total Environ. 2018, 622, 394–401. [Google Scholar] [CrossRef] [PubMed]
- Wu, H.L.; Cheng, W.C.; Shen, S.L.; Lin, M.Y.; Arulrajah, A. Variation of hydro-environment during past four decades with underground sponge city planning to control flash flood in Wuhan, China: An overview. Undergr. Space 2019, 5, 184–198. [Google Scholar] [CrossRef]
- Rawshan, A.; Alban, K.; Ozgur, K. Human-Environment Natural Disasters Interconnection in China: A Review. Climate 2020, 8, 48. [Google Scholar]
- Tim, D.F.; William, S.; William, F.H.; Richard, A.; David, B.; Scott, A.; Sam, T.; Sylvie, B.; Annette, S.; Jean-luc, B.; et al. SUDS, LID, BMPs, WSUD and more- The evolution and application of terminology surrounding urban drainage. J. Urban. Water 2015, 12, 525–542. [Google Scholar]
- Wang, H.; Mei, C. A new strategy for integrated uban water management in China: Sponge City. J. Technol. Sci. 2018, 61, 317–329. [Google Scholar]
- Matthews, J.C.; Allouche, E.N. Social cost impact assessment of pipeline infrastructure projects. Environ. Impact Assess. Rev. 2015, 50, 196–202. [Google Scholar] [CrossRef]
- Iwashita, T.; Sewaki, Y. Estimate methodology of the Optimal Renewal Period of Infrastructure Stock Considering Breakage Risk and Social Costs: A Case Study of Sewer Pipes. J. Life Cycle Assess. Jpn. 2011, 7, 339–350. [Google Scholar] [CrossRef] [Green Version]
- Wang, Z.Z.; Li, T. Comprehensive costs analysis of conventional and trenchless technology for the rehabilitation of urban sewer systems. J. Water Supply Drain. 2008, 34, 95–99. [Google Scholar]
- Bianchini, F.; Hewage, K. Probabilistic Social Cost-benefits analysis for Green roofs: A Life Cycle Approach. J. Build. Environ. 2012, 58, 152–162. [Google Scholar] [CrossRef]
- Lin, X.; Ren, J. Pridiction of life cycle carbon emissions of Sponge city projects: A case study in Shanghai, China. Sustainability 2018, 10, 3978. [Google Scholar] [CrossRef] [Green Version]
- Fan, X.Z.; Matsumoto, T. GIS-based Social Cost-Benefit Analysis on Integrated Urban Water Management in China: A Case Study of Spong City in Harbin. Sustainability 2019, 11, 5527. [Google Scholar] [CrossRef] [Green Version]
- Code for Design of Outdoor Wastewater Engineering. 2006. Available online: http://www.doc88.com/p-6817808949628.html (accessed on 1 January 2020).
- Quota for National Unified Municipal Engineering Budget, Book 6. 1999. Available online: http://www.doc88.com/p-7186271472902.html (accessed on 1 January 2020).
- Sponge City Construction Technical Manual. 2014. Available online: https://wenku.baidu.com/view/4722aecd2e3f5727a5e96293.html (accessed on 1 January 2020).
- Indices for Investment Estimate of Sponge City Construction. 2018. Available online: https://max.book118.com/html/2018/0426/163208837.shtm (accessed on 1 January 2020).
- Bid Winning Announcement of Qunli Healthy Ecological Garden. Available online: http://www.ccgp.gov.cn/cggg/dfgg/zbgg/201601/t20160108_6439674.htm (accessed on 1 January 2020).
- Bureau of Public Roads. Traffic Assignment Manual. U.S. Department of Commerce; Urban Planning Division: Washington, DC, USA, 1964. [Google Scholar]
- Japan National Institute for Land and Infrastructure Management (NILIM). Available online: http://www.nilim.go.jp/lab/bcg/siryou/tnn/tnn0671pdf/ks0671.pdf#search=co2+%E6%8E%92%E5%87%BA%E4%BF%82%E6%95%B0+Japan+National+Institute+for+Land+and+Infrastructure+Management (accessed on 1 January 2020).
- Elizabeth, E.; Simcock, R.; Fassman-Beck, E. Moisture Measurements as Performance Criteria for Extensive Living Roof Substrates. J. Environ. Eng. 2012, 138, 841–851. [Google Scholar]
- Mentens, J.; Raes, D.; Hermy, M. Green roofs as a tool for solving the rainwater runoff problem in the urbanized 21st century? Landsc. Urban Plan. 2006, 77, 217–226. [Google Scholar] [CrossRef]


| Specification (mm) | Amount | Unit |
|---|---|---|
| DNΦ < 600 | 20.54 | RMB/m·year |
| 600 ≤ DNΦ < 1000 | 21.83 | RMB/m·year |
| 1000 ≤ DNΦ < 1500 | 41.36 | RMB/m·year |
| DNΦ ≥ 1500 | 38.91 | RMB/m·year |
| Subjects | Link Kuancheng (α = 4.48, β = 1) | Link Dacheng (α = 3.92, β = 1) |
|---|---|---|
| Travel delay distance | 0.895 km | 0.912 km |
| Amount of traffic | 51,199 | 39,512 |
| Measured average speed | 15.4 km/h | 20.3 km/h |
| Predicted average speedby BPR function mentioned above [20] | 11.2 km/h | 15.3 km/h |
| Matthews | Iwashita | Wang |
|---|---|---|
| 2015, US | 2011, Japan | 2008, China |
| 80 RBM/h | 150 RMB/h | 15.6 RBM/h |
© 2020 by the authors. Licensee MDPI, Basel, Switzerland. This article is an open access article distributed under the terms and conditions of the Creative Commons Attribution (CC BY) license (http://creativecommons.org/licenses/by/4.0/).
Share and Cite
Fan, X.; Matsumoto, T. Comparative Analysis on Urban Flood Countermeasures Based on Life Cycle Thinking: A Comparison between Enhancing of Drainage Capacity Project and Sponge City. Environments 2020, 7, 51. https://doi.org/10.3390/environments7070051
Fan X, Matsumoto T. Comparative Analysis on Urban Flood Countermeasures Based on Life Cycle Thinking: A Comparison between Enhancing of Drainage Capacity Project and Sponge City. Environments. 2020; 7(7):51. https://doi.org/10.3390/environments7070051
Chicago/Turabian StyleFan, Xuezhou, and Toru Matsumoto. 2020. "Comparative Analysis on Urban Flood Countermeasures Based on Life Cycle Thinking: A Comparison between Enhancing of Drainage Capacity Project and Sponge City" Environments 7, no. 7: 51. https://doi.org/10.3390/environments7070051