1. Introduction
Water and/or soils pollution are extensively discussed in the literature, as well as the biodegradation of anthropogenic pollutants and their effects on the environment. In the specific case of fluorinated aliphatic molecules present as surfactants in many industrial contexts [
1], the bibliography is limited for surfactants used as fire-fighting foams [
2,
3,
4,
5,
6,
7,
8,
9]. These chemical compounds are considered as toxic [
10,
11]. This raised concerns about their particular environmental impact [
12]. Indeed, these chemicals are known to be persistent in the environment, to present a toxicity to living organisms, and to be bioaccumulated. On airport platforms, fire-fighting fluids are added to water to generate solutions in the form of foams to ease the water spreadability in order to smother the fire, and its extinguishment, especially for fuel fires, using the low surface tension characteristics of the foam due to the presence of fluorinated molecules. These fire-fighting foams must comply with the specifications related to the equipment to fight fire on/in aircrafts, and their conformity for their use on French airports is certified by the French Civil Aviation Department [
13]. Therefore, fire-fighting foams are subject to specific rules [
14]. Because of these environmental rising concerns, the French Civil Aviation Department initiated an investigation on methods of the detection and quantification of such chemicals in aqueous solutions, included at low concentration, their fate in soils and vegetation, and their impact on the environment through the determination of their biodegradation and toxicity.
The objective of this article is to focus on the spectroscopic monitoring of the biodegradation process of a polyfluoroalkyl ether present in Tridol S3B, a commercial fire-fighting foam. The product is characterized using a conventional OECD 301 F protocol. In parallel, it is characterized by Raman spectroscopy to establish its limit of detection in an aqueous solution. A spectroscopic monitoring of the biodegradation process is then implemented, with a chemometric approach developed for the investigation of the kinetics reactions associated with the biodegradation process for this polyfluoroalkyl ether. Indeed, environmental matrices are complex to analyze in Raman spectroscopy. This technique relies on the presence of strongly polarized chemical bonds from specific spectral signatures, e.g., 2H-polyfluorocarboxylates for our surfactants [
6]. Nevertheless, undesirable ‘effects’ could appear on the Raman signal due to the complexity of the analyzed environmental matrices (e.g., spectral overlap). That is why the proposed solution is to use chemometric methods to extract the most relevant information from the Raman spectra. Chemometrics has already shown that it is possible to overcome these drawbacks, but also to push back the resolution limits of any conventional instrument [
15]. Although infrared spectroscopy constitutes a good approach to monitor a biodegradation process [
16,
17], it is nevertheless not appropriate for field operation without sample preparation, as to be aimed at in a future evaluation. We demonstrate a robust approach to monitor the biodegradation of a surfactant by Raman spectroscopy with a chemometrics approach.
2. Materials and Methods
2.1. Presentation of the Polyfluoroalkyl Ether
Fire-fighting chemicals are aqueous solutions allowing the generation of foam to extinguish fire, in particular fuel ones. Commercial products used on airport platforms are industrially synthetized, and are employed at a volume percentage ranging from 3% to 6%. One polyfluoroalkyl ether was tested in this study, and was compliant with specifications given by the French Civil Aviation Department, concerning the compliance with the International Civil Aviation Organization (ICAO) requirements. Tested product is an aqueous film forming foam (AFFF), containing fluorinated surfactants, and its general characteristics are summarized in
Table 1, according to its safety data sheets. Based on provided information, the presence of polyfluoroalkyl ethers was not obvious. But the biodegradation rate presented is extremely compliant with environmental requirements.
To both confirm the presence of fluorine and to obtain a more accurate insight on the composition of these fluids, its Raman signature is established as our reference. Raman spectroscopy is a non-destructive and cost-effective technique to analyze materials and aqueous solutions [
18,
19]. The reference spectrum was obtained using an RXN-2 Raman spectrometer from Kaiser Optics, operating with a 785 nm laser source (red) with a 400 mW output, and a spectral resolution of 1 cm
−1. Such a wavelength was chosen to avoid the spectral signature of water, as it would be the case with a laser at 532 nm. The Raman spectrum (
Figure 1) was measured with a sample of 5 mL of the fluid placed into a quartz cell, with an integration time of 30 s. The spectral ranges of interest are between 600 and 1400 cm
−1 for the chemical bonds involving fluorine, and in the 1000–1500 cm
−1 and the 2800–3000 cm
−1 for the ones involving ether covalent bonds [
20] (
Table 2).
2.2. Appreciation of the Biodegradation Based on OECD 301 F Protocol
The monitoring of the biodegradability consists in characterizing the way micro-organisms degrade a given substance, in an aerobic or in an anaerobic environmental matrix. This monitoring is used to evaluate the persistence of an anthropogenic substance into the environment, in parallel to the collection of chemical and ecotoxicological data.
The determination of the biodegradability can be established through several methods given by an OECD guide [
21], and providing six methods to characterize a chemical product as a function of its biodegradability.
The method selected in this study is related to the standard referenced as NF EN ISO 9888, which evaluates the ultimate aerobic biodegradability of organic compounds in aqueous medium and in static conditions (the Zahn–Wellens method) [
22]. It is similar to the measurement of dissolved organic carbon in a static aerobic environment with constant air flow, temperature, stirring and light, through the appreciation of the chemical oxygen demand instead of the one of dissolved organic molecules. This process describes the degradation of the whole organic carbon present in an environmental matrix.
Therefore, to evaluate the environmental fate of a polyfluoroalkyl ether contained within a fire-fighting foam, a given amount of this foam, the only source of dissolved organic carbon besides the inoculum, is introduced into a 1 L-reactor containing a static aerobic media with some nutriments (
Figure 2). This inoculum is a sample of micro-organisms collected in an aeration basin for only domestic waste waters.
Dissolved organic carbon is measured with a chemical method during the experiment on homogeneous samples. In parallel to the test with a polyfluoroalkyl ether, a second test was conducted as a blank with only the inoculum and the nutriments. The ratio of biodegradation at a date t of the polyfluoroalkyl ether is calculated as follows:
DCO
tl and DCO
t respectively are the oxygen chemical demand 3 h ± ½ h after the beginning of the biodegradation test, and at a given time t. The tested product is considered to be easily degradable if, after achieving a biodegradation ratio of 10%, the ratio changes to a 70% ratio within the following ten days. The test is considered as finished when the degradation rate remains constant as a function of time. The DCO thus obtained is called the refractory one. The maximum duration of the test is 28 days. It is advised to start with a DCO of 100 mgO
2/L, with a maximum of 1000 mgO
2/L.
2.3. Spectroscopic Monitoring and Chemometrics to Identify the Biodegradation Process
As discussed above, the evaluation of the environmental fate of a polyfluoroalkyl ether contained in a fire-fighting foam relied on the fact that this foam was the only source of dissolved organic carbon besides the inoculum.
Table 1 with the composition of the fire-fighting foam considered in this research article did show that the fluid obviously contained other dissolved organic carbon besides the ones related to polyfluoroalkyl ether. Therefore, the sole OECD protocol is not appropriate to identify to what extent the degradation of the polyfluoroalkyl ether is taking place along with other organic chemicals.
It has been demonstrated how Raman spectroscopy was able to specifically identify the presence of C–F chemical bonds despite the fact the amount of polyfluoroalkyl ether present in a fire-fighting foam is low (
Table 1). Considering both the volume of the reactor and this amount, the question of the spectroscopic detection limit was raised. Several diluted solutions of the selected commercial fire-fighting foam were then prepared with a volume ratio ranging from 4.10
−3% to 80%. Each solution was analyzed by Raman spectroscopy during 8 min, with a 30 s integration time, and a 45 s-time interval between each spectrum. Ten spectra for each dilution were then obtained, and a database of over eighty spectra was then generated when including the spectral signature of pure commercial fluid. As a consequence, two chemometric methodologies were applied in order to determine the spectroscopic detection limit of polyfluoroalkyl. The first one is based on the Principal Components Analysis (PCA), and the second one on Partial Least-Square regression (PLS) [
23,
24]. These analytical methods are widely used on spectroscopic measurements for data “mining”, dimension reduction and/or principal components analysis for characterizing several sets of measured physicochemical variables.
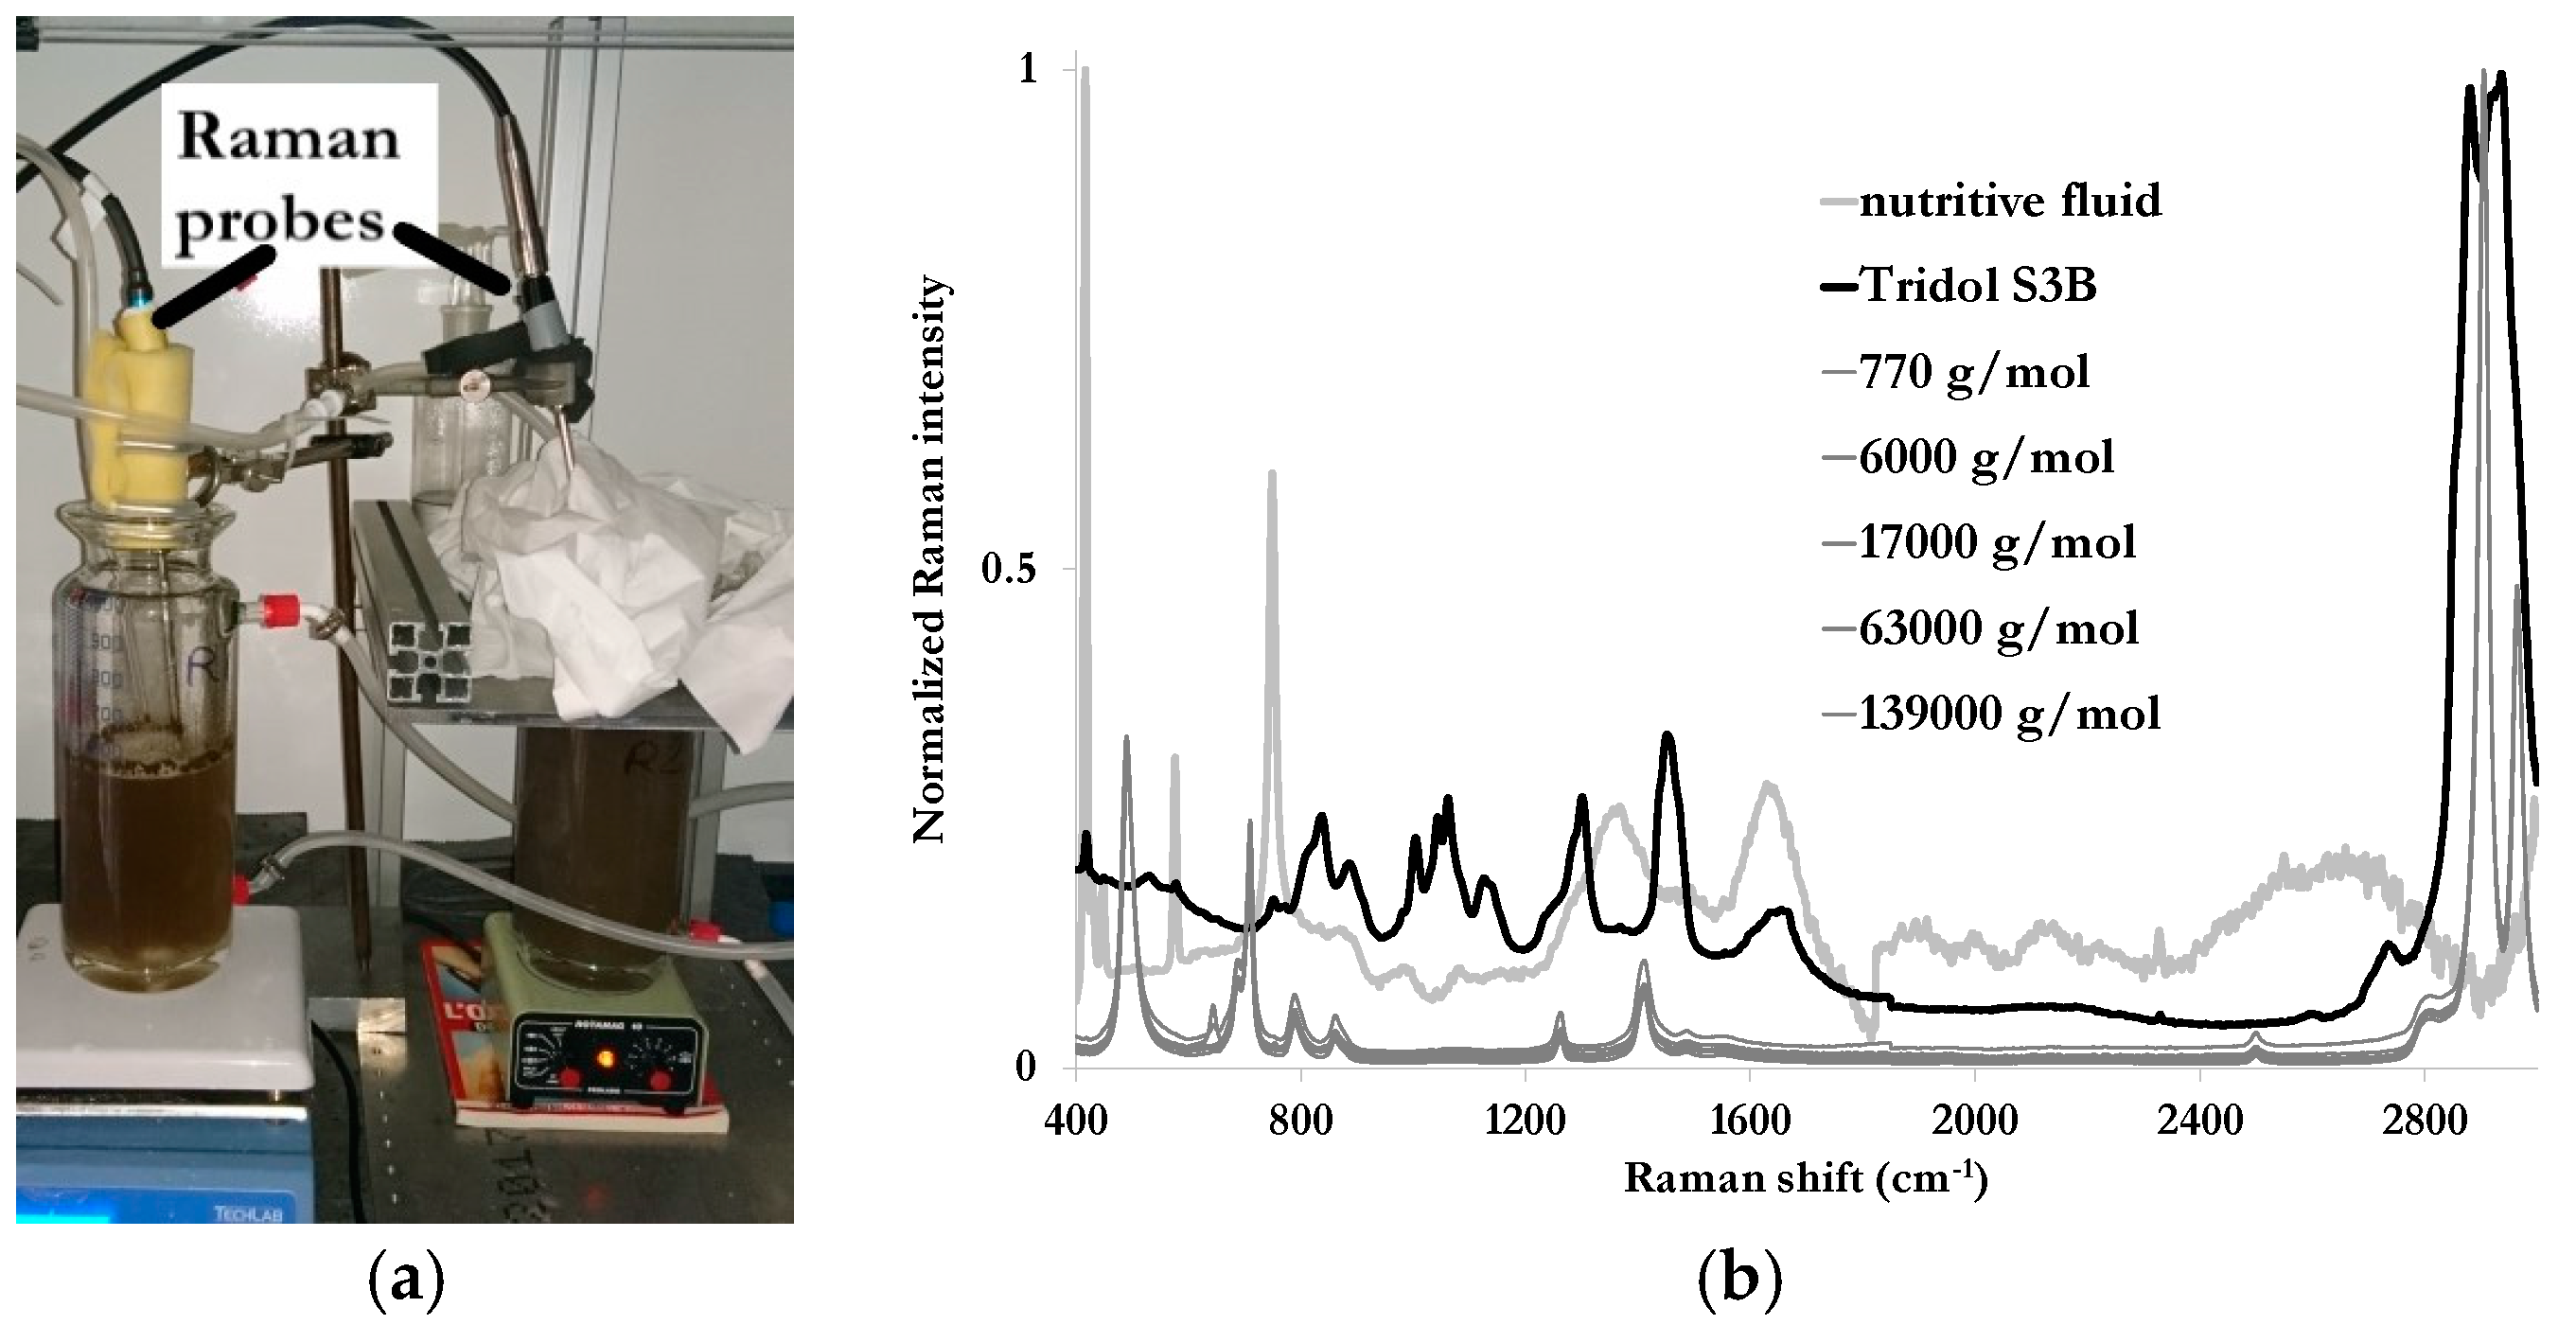
Once the limit of detection is established, a similar experimental setup to the one for the determination of the biodegradation based on the OECD 301 F protocol was developed. A spectroscopic monitoring was then implemented to specifically determine the environmental fate of one fire-fighting foam containing a polyfluoroalkyl ether. Two 1 L-reactors containing a static aerobic media with some nutriments and an inoculum were then prepared. One was used as a reference, while 10 mL of pure Triodol S3B were added into the second one. A Raman immersion probe was placed into each reactor (
Figure 3a), and was connected to the Kaiser RXN-2 Raman spectrometer to a continuous monitoring over 28 consecutive days. Each probe made a measurement for 30 s, with a 15 min-interval between each Raman spectrum. Some foam is naturally generated while stirring the mixture (nutritive fluid and inoculum) containing a fire-fighting foam, and some paper cloth was placed around the reactors to prevent any eventual overflow. To reduce the risk of foam occurrence, five specific trimethylsiloxy-terminated polydimethylsiloxanes were added, with molar mass ranging from 770 g/mol to 139,000 g/mol, these chemicals making the foam unstable and are widely used in food industry. Normalized Raman spectra of the fluids present in the environmental matrix are provided in
Figure 3b.
As observed, two peaks of the nutritive fluid (after baseline correction), below 800 cm−1, are located near some of the ones observed in Tridol S3B, while siloxane spectral signatures are not interfering with the ones of fire-fighting foams, especially in the 400–1800 cm−1 range. Considering the volume of both fire-fighting foam and of static aerobic media involved, the concentration in fire-fighting foam is of 1% v/v.
On complex samples, such as environmental matrices, the use of chemometric tools could overcome several drawbacks from a classical approach in Raman spectroscopy. First, it is necessary to know a priori all pure components in the sample. If this hypothesis is not true, it could be possible to select a non-selective spectral wavelength and thus, overestimate the concentrations of a component. Moreover, when there is a strong spectral overlap (e.g., wide bandwidth, fluorescence effect and/or sample complexity), it is impossible to identify a truly selective wavelength. That is why the use of chemometric tools could overcome all these drawbacks in order to give a better estimate of the true concentration.
2.4. Principal Components Analysis (PCA) and Partial Least-Squares Regression (PLS)
Among data analysis techniques, PCA is the most commonly used methodology in order to understand datasets [
25,
26]. Indeed, PCA explains the structure of descriptive variables based on data matrix using a small number of variables defined as linear combinations of the original variables (i.e., raw data). This approach decomposes a data matrix D (m × n) into a product of two variables, a matrix of scores denoted T (m × k) and a matrix of loadings denoted P (k × n), which is added to a residual matrix EPCA (m × n):
The dimension of the new space defined by k is determined with the rank of the raw data matrix D. The number of original variables n from m observations are too complex for direct interpretation from D, which explains why it is necessary to “reduce” the space dimension using k Principal Components (PCs) that explain the maximum amount of information. The scores represent the coordinates of the observations (or samples) on the axes of the selected PCs. The loadings denote the contributions of the original variables on the same selected PCs. In other words, since the scores are representations of observations in the space formed by the new axes defined by the PCs, loadings are a representation of the variables on this axis. Geometrically, this change of variables by linear combinations results is a set of new variables called PCs. The direction of each newly created axis describes a part of the global information from the original variables contained in the matrix D. The variance explained by each PCs is sorted in decreasing order.
The proportion of variance explained by the first PC, which represents the main part of information, is higher than the second PC, which represents a smaller amount of information, and so on. The same information cannot be shared between two PCs, because PCA requires that the PCs are orthogonal to each other.
In our case, the PCA is used directly on the Raman spectra in order to find out when the degradation of the polyfluoroalkyl ethers occurs, but especially if there is degradation. One of the drawbacks of this approach is the direct interpretation of the chemical information of the loadings. Indeed, when you analyze spectra, loadings can be negative, while it is not chemically possible to obtain a negative spectrum. As a consequence, some other chemometric methodologies e.g., the Multivariate Curve Resolution using a constrained Alternating Least Squares algorithm (MCR-ALS) [
27,
28] or PARAFAC (Parallel Factor Analysis) [
29] will be needed to reach a more realistic chemical information.
PLS is a supervised statistical method to predict quantitative information or a given state of a system with both spectra and measurements. It consisted in generating a calibration on the basis of a training set of Raman spectra and of corresponding concentrations. It contributes to the elaboration of a statistical forecast model of the concentration with the Raman spectra. Since all data used do contain noise, this calibration generates a calibration matrix P and a minimized error matrix EPLS. It allows us here to simultaneously generate models on the variability of concentration in the polyfluoroalkyl ether of aqueous solutions and the matrix of their Raman spectra, and so maximize the correlation between latent variables.
Basis vectors are searched for concentrations and another one for Raman spectra, and the understanding of the way these sets are related is mandatory. The eigenvectors for each space are calculated to reach the best congruence between each variable factor and its corresponding Raman spectrum in the least-squares sense. Noise being present in both variables and measurements, eigenvectors for both spaces are shifted by different amounts in different directions, due to the independence of noises in corresponding spaces, conducting to an imperfect congruence between variables and data points. PLS will try to restore this optimum congruence, defined as a linear relationship between the scores of the variables and Raman data.
3. Results
3.1. Discrimination of Fire-Fighting Foams and Detection Threshold
PCA and PLS results for Raman spectra of the fire-fighting foam are respectively presented in
Figure 4a,b. Results were obtained with Unscrambler X 10.1, using the NIPALS (Non-linear Iterative Partial Least Squares) algorithm, after a baseline and offset correction on Raman spectra, followed by a normalization with respect to the spectra area over the 400–2800 cm
−1 spectral range. PCA is able to discriminate fire-fighting foam-diluted solutions from each other, as illustrated by the spreading of data points on the scores plot (
Figure 4a) of the first two principal components. The discrimination and hence the detection limit can be obtained with volume amounts as low as 0.08% of commercial fire-fighting foam in water, corresponding to nearly 10 ppm, based on information provided by the manufacturers (
Table 1). A PLS model was also elaborated (
Figure 4b) and provided the percentage of fire-fighting foam in an aqueous solution on the sole basis of its Raman spectral response. RMSEC (root mean square errors of calibration) of the PLS model was of at least 0.023%. A linear regression in a log–log scale indicated an R² of 0.998, for a slope of 0.9993 and an offset of 0.022% for the prediction of a fire-fighting foam in an aqueous solution. The application of the model to unknown solutions indicated the ability to reach a detection threshold of 140 ppm. This value was obtained considering data from the safety data sheet indicated in
Table 1, the molecular mass of the solvents and assuming a percentage of polyfluoroalkyl ether of 1% in the commercial solution, with an approximate chemical structure deduced from Raman peaks indexation (
Table 2).
3.2. Conventional Monitoring of the Biodegradation Process
Biodegradability results are presented in
Table 3. According to these test results, the product is easily degradable. Evolutions as a function of time of the degradation of this fire-fighting foam is in
Figure 5. No significant difference was observed between it and two other tested fire-fighting foams. They all presented a pause between the 48th and 72nd h depending on the product after the beginning of the degradation process. Nevertheless, and as indicated before, this process describes the degradation of the whole organic carbon present in the environmental matrix. In the case of Tridol S3B, it includes at least ethylene glycol, 2-(2-butoxyethoxy)ethanol, alkyl sulfate, ethanol and polyethylene glycol 400, besides polyfluoroalkyl ethers. Therefore, this test did not indicate to what extent fluorinated organic molecules, considered as persistent into the environment, were really degraded, or not.
3.3. Chemometrics-Assisted Spectroscopic Monitoring of the Tridol S3B Biodegradation
Raman spectroscopy was implemented on one additional test specifically conducted on Tridol S3B. This choice was necessitated by the absence of any significant difference between the fire-fighting foams when submitted to the conventional OECD protocol as described in the previous paragraph.
Raman spectra from both reactors are illustrated in
Figure 6a,b for the case of Tridol S3B, at the beginning of the test (dark solid line) and after 288 h (12 days) of biodegradation (gray, solid line). The first element to notice is the strong fluorescence due to the light diffusion already present in the nutritive fluid and enhanced by the solid particles in suspension and causing the turbidity of the studied media. The second one is the presence of peaks at 580 cm
−1 and 750 cm
−1 in the Raman spectra of the fluid containing the fire-fighting foam. These peaks can be attributed to CFx bonds (x = 1, 2 or 3) [
20]. The peak near 580 cm
−1 was barely visible in the case of pristine fire-fighting foam. Thus, the presence of such a peak could be the evidence that the fluorinated molecules are still present while the degradation process is supposed to be almost over, as indicated in
Figure 5 when evaluating it conventionally. Since these peaks are also present in the nutritive fluid, additional investigations are needed.
4. Discussion
Raman spectra collected with a probe immersed in each reactor were then first analyzed by means of a PCA using Chemflow, a chemometrics online software [
30]. The objective was then to focus on the specific evolution of polyfluoroalkyl ethers. To ease the analysis, some pre-treatments processing was conducted.
Indeed, collected Raman spectra have intense and irregularity-shaped changing baselines (
Figure 6a,b). This intense background associated with fluorescence contributions is a common problem in Raman spectroscopy. The raw spectra were then corrected to extract unbiased and effective chemical information. For this purpose, Weighted Least-Square (WLS), also called Asymmetric Weighted Least-Square (AsLS), removes the fluorescent contributions [
31]. Originally, this pre-process algorithm was used to subtract baseline shifts in chromatography [
32]. This approach is based on a recursive local fitting of the entire spectrum with a baseline obtaining by using a Whittaker smoother [
32], which uses two basic setting parameters λ and P, respectively equal to 100 and 0.01. The first one controls the amount of curvature for the baseline. The second one governs the extent of asymmetry required for the fit and must be in the range 0 to 1, limits excluded. A WLS correction acts as a filter for the fluorescence, which has an intensity much greater than the Raman signal of a peak itself. Therefore, once the correction is completed, the relevant signal is very close to the noise. In addition to the baseline correction, the Singular Normal Variate (SNV) was applied for normalization. The SNV calculates the standard deviation of all variables for the given sample [
33] which is then normalized with respect to this value. Thus, the sample has a unit standard deviation. Results of these pre-processes are illustrated in
Figure 6c,d.
PCA was first conducted on the data set constituted of spectra from both reactors, with a calculation based on 15 principal components on the 400–1200 cm
−1 spectral range. The first principal component explained nearly 49% of the variance, and the second close to 9%, the total explained variance by the 15 principal components being over 99% (
Figure 7a). The scores plot generated by these first two principal components is illustrated in
Figure 7b. One can observe that the data points from each reactor are separated by the first principal component. Data from reactor 1 only containing the environmental matrix was gathered, indicating a system almost unchanged along the selected duration of the test. Data points from reactor 2 (in green in
Figure 7b and containing the fire-fighting foam) are globally spread along this first principal component, and converge towards the ones of reactor 1 without reaching it. The first loadings (
Figure 7c) were plotted along with the Raman spectra of Tridol S3B, siloxanes and nutritive fluid. Peaks related to nutritive fluid at 580 cm
−1 and 750 cm
−1 were clearly identified. This component has a loading profile similar to the reference spectrum of the nutritive fluid, which is common to the two reactors (cf.
Table 2). In the scores plot, the two data sets are nevertheless separated by this principal component. Therefore, data analysis indicated a difference which occurred in the nutritive fluid. A selectivity issue is then raised, and these peaks could both be attributed to nutritive fluid and Tridol S3B.
To overcome this selectivity issue, a new PCA was then conducted on the data set constituted of spectra from both reactors and the ones of a pure fire-fighting foam, with the same data pre-processing and the same spectral range as before for consistency’s sake. A new scores plot was then generated with the first two principal components (
Figure 8) respectively explaining 48% and 8.5% of the variance. Here again the whole data set is organized into two groups, with data points from reactor 1 still separately grouped, while points relating to pure Tridol S3B are mixed with the points of reactor 2. The ones of reactor 2 are still dispersed and converging towards the ones of reactor 1. Therefore, peaks at 580 cm
−1 and 750 cm
−1 in the first principal component are related to Tridol S3B, and not exclusively to the nutritive fluid. This indicates that the biodegradation of this fire-fighting foam is incomplete.
5. Conclusions
Fire-fighting foams are used on airport platforms to prevent the spread of airplane fires when they unfortunately occur. Some of these foams do contain surfactants based on polyfluoroalky ethers, and are therefore considered as anthropogenic pollutants. As so, some abnormal amounts were measured both in ground and surface water, raising concerns on their persistence into the environment, their toxicity, their bioaccumulation and hence about their environmental fate.
To evaluate their biodegradation, a fire-fighting foam was selected and submitted to an OECD method from a guide dedicated to biodegradability, and related to protocol dedicated to the estimation of its biodegradability in compliance with NF EN ISO 9888 for the ultimate aerobic biodegradability of organic compounds in aqueous medium and in static conditions. In parallel, a Raman spectroscopy monitoring of the biodegradation process was implemented, coupled with a data analysis based on principal components analysis (PCA) to first identify a structure in the data, if any, along with the identification of chemical species related to polyfluoroalkyl ethers chemical bonds, easily detected because of the high polarizability of C–F bonds.
Results from OECD 301 F protocol indicated that over 97% of the organic charge in the environmental matrix was consumed roughly after 12 days, justifying to put an end to the test. This process describes the degradation of the whole organic carbon present in the environmental matrix, without any distinction between anthropogenic chemicals compounds such as ethylene glycol, 2-(2-butoxyethoxy)ethanol, alkyl sulfate, ethanol and polyethylene glycol 400 also present besides polyfluoroalkyl ethers. The analysis of Raman spectra obtained from the spectroscopic monitoring did indicate a different environmental fate, in particular in the case of fluorinated molecules. The environmental matrix containing fluorinated molecules did have a significant different behavior than the one without them, and although it evolved towards an uncontaminated system, it never reached it, including after the 12 days of the OECD tests which indicated an almost total degradation. Investigations on eigenvectors issued from PCA calculations did reveal the presence of specific peaks (530 cm−1, 765 cm−1, 890 cm−1, 980 cm−1) consistent with chemical bonds in fluorinated molecules, which indicated their persistence in the environmental matrix. The OECD protocol can be considered as adapted to globally identify the biodegradation of an organic compound, but as not properly adapted to precisely identify to what extent some chemicals are persistent in the environment. Raman spectroscopy could then be considered as a relevant complement to the specific implemented protocol.
As a perspective, some additional biodegradation tests will be implemented, including a spectroscopic monitoring. The tests will include fire-fighting foams and other chemicals used on airports. Besides the identification of any other partial biodegradation with respect to results obtained with a conventional OECD 301 F protocol, the objective will be to describe the kinetics of the biodegradation process along with the spectroscopic signatures and the concentration profiles of the chemicals present during the process. Such an analysis will also rely on chemometrics methods, including principal components analysis (PCA) and multivariate curve resolution (MCR), where each spectrum can be described as a linear combination of the signal of the chemical compound or a part of a sample (i.e., mixture) with a proper spectral signature.
Author Contributions
Conceptualization, M.M., F.A. and M.O.; Methodology, M.M., M.O., F.A., P.B. (Philippe Branchu) and J.-F.D.; Software, M.M., M.O. and F.A.; Validation, M.O., P.B. (Philippe Branchu) and P.B. (Patrice Bourson); Formal analysis, M.M., M.O. and F.A.; Investigation, M.M., F.A., C.J. and J.-F.D.; Resources, F.A., C.J. and J.-F.D.; Data curation, M.M., J.-F.D.; Writing—original draft preparation, M.M., M.O. and F.A.; Writing—review and editing, M.M., M.O., F.A., P.B. (Philippe Branchu), P.B. (Patrice Bourson), C.J., J.-F.D. and G.C.; Visualization, M.M., M.O. and F.A.; Supervision, M.M., M.O. and F.A.; Project administration, M.M., G.C. All authors have read and agreed to the published version of the manuscript.
Funding
This research received no external funding.
Acknowledgments
Authors are grateful to French Civil Aviation Department for supporting this research.
Conflicts of Interest
The authors declare no conflict of interest.
References
- Gomis, M.I.; Wang, Z.; Scheringer, M.; Cousins, I.T. A modeling assessment of the physicochemical properties and environmental fate of emerging and novel per- and polyfluoroalkyl substances. Sci. Total Environ. 2015, 505, 981–991. [Google Scholar] [CrossRef] [PubMed]
- Remde, A.; Debus, R. Biodegradability of fluorinated surfactants under aerobic and anaerobic conditions. Chemosphere 1996, 32, 1563–1574. [Google Scholar] [CrossRef]
- Schröder, H.F.; Meesters, R.J.W. Stability of fluorinated surfactants in advanced oxidation processes-A follow up of degradation products using flow injection–mass spectrometry, liquid chromatography–mass spectrometry and liquid chromatography–multiple stage mass spectrometry. J. Chromatogr. A 2005, 1082, 110–119. [Google Scholar] [CrossRef] [PubMed]
- Place, B.J.; Field, J.A. Identification of novel fluorochemicals in aqueous film-forming foams used by the US military. Environ. Sci. Technol. 2012, 46, 7120–7127. [Google Scholar] [CrossRef]
- Liu, J.; Avendaño, S.M. Microbial degradation of polyfluoroalkyl chemicals in the environment: A review. Environ. Int. 2013, 61, 98–114. [Google Scholar] [CrossRef]
- Ruan, T.; Lin, Y.; Wang, T.; Jiang, G.; Wang, N. Methodology for studying biotransformation of polyfluoroalkyl precursors in the environment. Trends Anal. Chem. 2015, 67, 167–178. [Google Scholar] [CrossRef]
- Krafft, M.P.; Riess, J.G. Per-and polyfluorinated substances (PFASs): Environmental challenges. Curr. Opin. Colloid Interface Sci. 2015, 20, 192–212. [Google Scholar] [CrossRef]
- Montagnolli, R.N.; Lopes, P.R.M.; Cruz, J.M.; Claro, M.T.; Quiterio, G.M.; Bidoia, E.D. Metabolical shifts towards alternative BTEX biodegradation intermediates induced by perfluorinated compounds in firefighting foams. Chemosphere 2017, 173, 49–60. [Google Scholar] [CrossRef]
- Montagnolli, R.N.; Lopes, P.R.M.; Cruz, J.M.; Claro, M.T.; Quiterio, G.M.; Bidoia, E.D. The effects of fluoride based fire-fighting foams on soil microbiota activity and plant growth during natural attenuation of perfluorinated compounds. Environ. Toxicol. Pharmacol. 2017, 50, 119–127. [Google Scholar] [CrossRef]
- Kennedy, G.L.; Butenhoff, J.L.; Olsen, G.W.; O′Connor, J.C.; Seacat, A.M.; Perkins, R.G.; Biegel, L.B.; Murphy, S.R.; Farrar, D.G. The toxicology of perfluorooctanoate. Crit. Rev. Toxicol. 2004, 34, 351–384. [Google Scholar] [CrossRef]
- Borg, D.; Lund, B.-O.; Lindquist, N.-G.; Håkansson, H. Cumulative health risk assessment of 17 perfluoroalkylated and polyfluoroalkylated substances (PFASs) in the Swedish population. Environ. Int. 2013, 59, 112–123. [Google Scholar] [CrossRef] [PubMed]
- Lehmeler, H.-J. Synthesis of environmentally relevant fluorinated surfactants-a review. Chemosphere 2005, 58, 1471–1496. [Google Scholar] [CrossRef] [PubMed]
- Emulseurs, STAC. Available online: http://www.stac.aviation-civile.gouv.fr/fr/securite-aerodromes/sauvetage-lutte-contre-lincendie-aeronefs/emulseurs (accessed on 20 March 2019). (In French).
- Sauvetage et Lutte Contre l’Incendie Des Aéronefs STAC. Available online: http://www.stac.aviation-civile.gouv.fr/en/securite/sauvetage-lutte-contre-lincendie-aeronefs (accessed on 20 March 2019). (In French).
- Offroy, M.; Moreau, M.; Sobanska, S.; Milanfar, P.; Duponchel, L. Pushing back the limits of Raman imaging by coupling super-resolution and chemometrics for aerosols characterization. Sci. Rep. 2015, 5, 12303. [Google Scholar] [CrossRef] [PubMed]
- Apolonski, A.; Roy, S.; Lampe, R.; Maiti, K.S. Application of Vibrational Spectroscopy in Biology and Medicine. Breath Analysis. Proceedings 2019, 27, 26. [Google Scholar] [CrossRef]
- Maiti, K.S.; Lewton, M.; Fill, E.; Apolonski, A. Sensitive spectroscopic breath analysis by water condensation. J. Breath Res. 2018, 12, 1–11. [Google Scholar] [CrossRef]
- Colomban, P. Imagerie Raman de matériaux et dispositifs nano/micro hétérogènes. Tech. de l′Ingénieur 2013, TIB186DUO, 1–28. [Google Scholar]
- Fontana, M.D.; Mabrouk, K.B.; Kauffmann, T.H. Raman spectroscopic sensors for inorganic salts. Spectroscopic Properties of Inorganic and Organometallic Compounds: Techniques. Mater. Appl. 2013, 44, 40–67. [Google Scholar]
- Socrates, G. Infrared and Raman Characteristic Group Frequencies. Tables and Charts; John Wiley & Sons, Ltd.: Chichester, UK, 2001. [Google Scholar]
- OECD Guidelines for the Testing of Chemicals, Section 3: Environmental Fate and Behaviour. Available online: https://www.oecd-ilibrary.org/environment/oecd-guidelines-for-the-testing-of-chemicals-section-3-degradation-and-accumulation_2074577x (accessed on 26 March 2019).
- NF EN ISO 9888:1999. Water Quality–Evaluation in an Aqueous Media of the Aerobic Biodegradability of Organic Compounds-Static test (Zahn-Wellens Method); International Organization for Standardization: Geneva, Switzerland, 1999. [Google Scholar]
- Jackson, J.E. A User′s Guide to Principal Components; John Wiley & Sons: New York, NY, USA, 2003. [Google Scholar]
- Kramer, K. Chemiometric Techniques for Quantitative Analysis; CRC Press: New York, NY, USA, 1988. [Google Scholar]
- Golub, G.H.; Kahan, W.M. Calculating the Singular Values and Pseudo-Inverse of a Matrix. J. Soc. Ind. Appl. Math. 1965, 2, 205–224. [Google Scholar] [CrossRef]
- Massart, D.L.; Vandeginste, B.G.M.; Buydens, L.M.C.; De Jong, S.; Lewi, P.J.; Smeyers-Verbeke, J. Handbook of Chemometrics and Qualimetrics, 1st ed.; Part B; Elsevier Science: Amsterdam, The Netherlands, 1997; Volume 20, ISBN 9780444828538. [Google Scholar]
- De Juan, A.; Tauler, R. Multivariate curve resolution (MCR) from 2000: Progress in concepts and applications. Crit. Rev. Anal. Chem. 2011, 36, 163–176. [Google Scholar] [CrossRef]
- De Juan, A.; Maeder, M.; Hancewicz, T.; Duponchel, L.; Tauler, R. Chemometric Tools for Image Analysis. In Infrared and Raman. Spectroscopic Imaging, in Infrared and Raman Spectroscopic Imaging; Salzer, R., Siesler, H.W., Eds.; Wiley-VCH: Weinheim, Germany, 2009; pp. 65–106. [Google Scholar]
- Bro, R. PARAFAC tutorial and applications. Chemom. Intell. Lab. Syst. 1997, 38, 149–171. [Google Scholar] [CrossRef]
- Chemflow. Available online: https://chemproject.org/wakka.php?wiki=ChemFlow (accessed on 18 September 2019).
- Piqueras, S.; Duponchel, L.; Tauler, R.; De Juan, A. Resolution and segmentation of hyperspectral biomedical images by multivariate curve resolution-alternating least squares. Anal. Chim. Acta 2011, 705, 182–192. [Google Scholar] [CrossRef] [PubMed]
- Eilers, P. A perfect smoother. Anal. Chem. 2003, 75, 3631–3636. [Google Scholar] [CrossRef] [PubMed]
- Barnes, R.J.; Dhanoa, M.S.; Lister, S.J. Standard Normal Variate Transformation and De-Trending of Near-Infrared Diffuse Reflectance Spectra. Appl. Spectrosc. 1989, 43, 772–777. [Google Scholar] [CrossRef]
Figure 1.
The reference Raman spectrum of the fire-fighting foam Tridol S3B obtained with a Kaiser Optics Raman spectrometer operating with a 785 nm laser (400 mW, 30 s integration time).
Figure 1.
The reference Raman spectrum of the fire-fighting foam Tridol S3B obtained with a Kaiser Optics Raman spectrometer operating with a 785 nm laser (400 mW, 30 s integration time).
Figure 2.
Organization for Economic Co-operation and Development (OECD) test for the biodegradation of a fire-fighting foam containing a polyfluoroalkyl ether.
Figure 2.
Organization for Economic Co-operation and Development (OECD) test for the biodegradation of a fire-fighting foam containing a polyfluoroalkyl ether.
Figure 3.
Experimental setup with Raman immersion probes into two identical environmental matrices (one reactor without polyfluoroalkyl ether on the left, and with polyfluoroalkyl ether on the right of the picture) (a), and Raman spectra of each fluid constituting the environmental matrix before addition of the inoculum (b).
Figure 4.
Principle component analysis (PCA) applied to Raman spectra of diluted aqueous solutions of a fire-fighting foam (a) and Partial Least Squares (PLS) model to predict the amount of fire-fighting foam Tridol S3B containing a polyfluoroalkyl ether (b).
Figure 4.
Principle component analysis (PCA) applied to Raman spectra of diluted aqueous solutions of a fire-fighting foam (a) and Partial Least Squares (PLS) model to predict the amount of fire-fighting foam Tridol S3B containing a polyfluoroalkyl ether (b).
Figure 5.
Degradation rate of the fire-fighting foam Tridol S3B as a function of time according to the OECD 301 F protocol.
Figure 5.
Degradation rate of the fire-fighting foam Tridol S3B as a function of time according to the OECD 301 F protocol.
Figure 6.
Raman spectra in their pristine form obtained at the beginning of the test and after 12 days from immersion probes in reactors without fire-fighting foam (a) and with 10 mL of fire-fighting foam Tridol S3B (b), and the same respective Raman spectra after Singular Normal Variate (SNV) and baseline corrections (Whittaker filter) (c,d).
Figure 7.
Explained variance (a), scores plot for the first two principal components (b) and loadings (c) for a PCA conducted on Raman spectra (after baseline correction and Singular Normal Variate (SNV)) obtained from measurements in reactors 1 and 2 during the biodegradation process of Tridol S3B.
Figure 8.
Scores plot for the first two principal components for a PCA conducted on Raman spectra (after baseline correction and SNV) obtained from measurements in reactors 1 and 2 during the biodegradation process of Tridol S3B, and Raman spectra of pure Tridol S3B.
Figure 8.
Scores plot for the first two principal components for a PCA conducted on Raman spectra (after baseline correction and SNV) obtained from measurements in reactors 1 and 2 during the biodegradation process of Tridol S3B, and Raman spectra of pure Tridol S3B.
Table 1.
General characteristics of a commercially-available fire-fighting foam according to its safety data sheet.
Table 1.
General characteristics of a commercially-available fire-fighting foam according to its safety data sheet.
| Product Name | Manufacturer | Volume Mass (kg/L) | Global Composition | Presence of Fluorine | Biodegradation Percentage |
|---|
| Tridol S3B | Eau et Feu S.A. | 1.01 | Ethylene glycol 2-(2-butoxyethoxy)ethanol | Presence indicated without any detail | 97% (number of days not specified) |
Table 2.
Raman shift of chemical bonds of a polyfluoroalkyl ether present in fire-fighting fluid.
Table 2.
Raman shift of chemical bonds of a polyfluoroalkyl ether present in fire-fighting fluid.
| Raman Shift (cm−1) | Chemical Bond of Interest with the Corresponding Vibration Type |
|---|
| 530 | C–F deformation |
| 765 | C–F deformation vibration in aliphatic monofluorinated compounds, C–F scissor |
| 830 | symmetric stretch C–O–C |
| C–F deformation |
| 990–800 | CH2 rocking |
| 1110–990 | C–F stretch in CH2F |
| 1110–1000 | aliphatic monofluorinated compound |
| CH2F with C–F stretch and CH2 rocking |
| 1040–1060 | C–F stretch on aliphatic difluorinated compound |
| 1250–1050 | aliphatic difluorinated compounds C–F stretch |
| 1130 | asymmetric stretch C–O–C |
| 1300 | C–F stretch |
| CF3 attached to an alkyl group |
| CF3 attached to an aromatic group |
| 1450 | CH2 vibration of deformation |
Table 3.
Results of aerobic biodegradation tests on the three fire-fighting foams.
Table 3.
Results of aerobic biodegradation tests on the three fire-fighting foams.
| Fire-Fighting Foam | Theoretical Rate (%) of Degradation (According to Products SDS) | Biodegradability Rate (%) after 5 Days | Time (h) Necessary to Reach a Biodegradation Rate of 90% |
|---|
| Tridol S3B | 97 | 89 | 121.5 |
© 2020 by the authors. Licensee MDPI, Basel, Switzerland. This article is an open access article distributed under the terms and conditions of the Creative Commons Attribution (CC BY) license (http://creativecommons.org/licenses/by/4.0/).


 ,
, 


