Diatom Deformities and Tolerance to Cadmium Contamination in Four Species
Abstract
1. Introduction
2. Materials and Methods
2.1. Algal Cultures
2.2. Dose-Response Approach
2.3. Chronic Cd Exposure Experiment
2.4. Cadmium Measurements
2.5. In Vivo Fluorescence Measurements
2.6. Morphological Analysis
2.7. Statistical Analysis
3. Results and Discussion
3.1. Dose-Response Curves
3.2. Chronic Cd Exposure Experiment
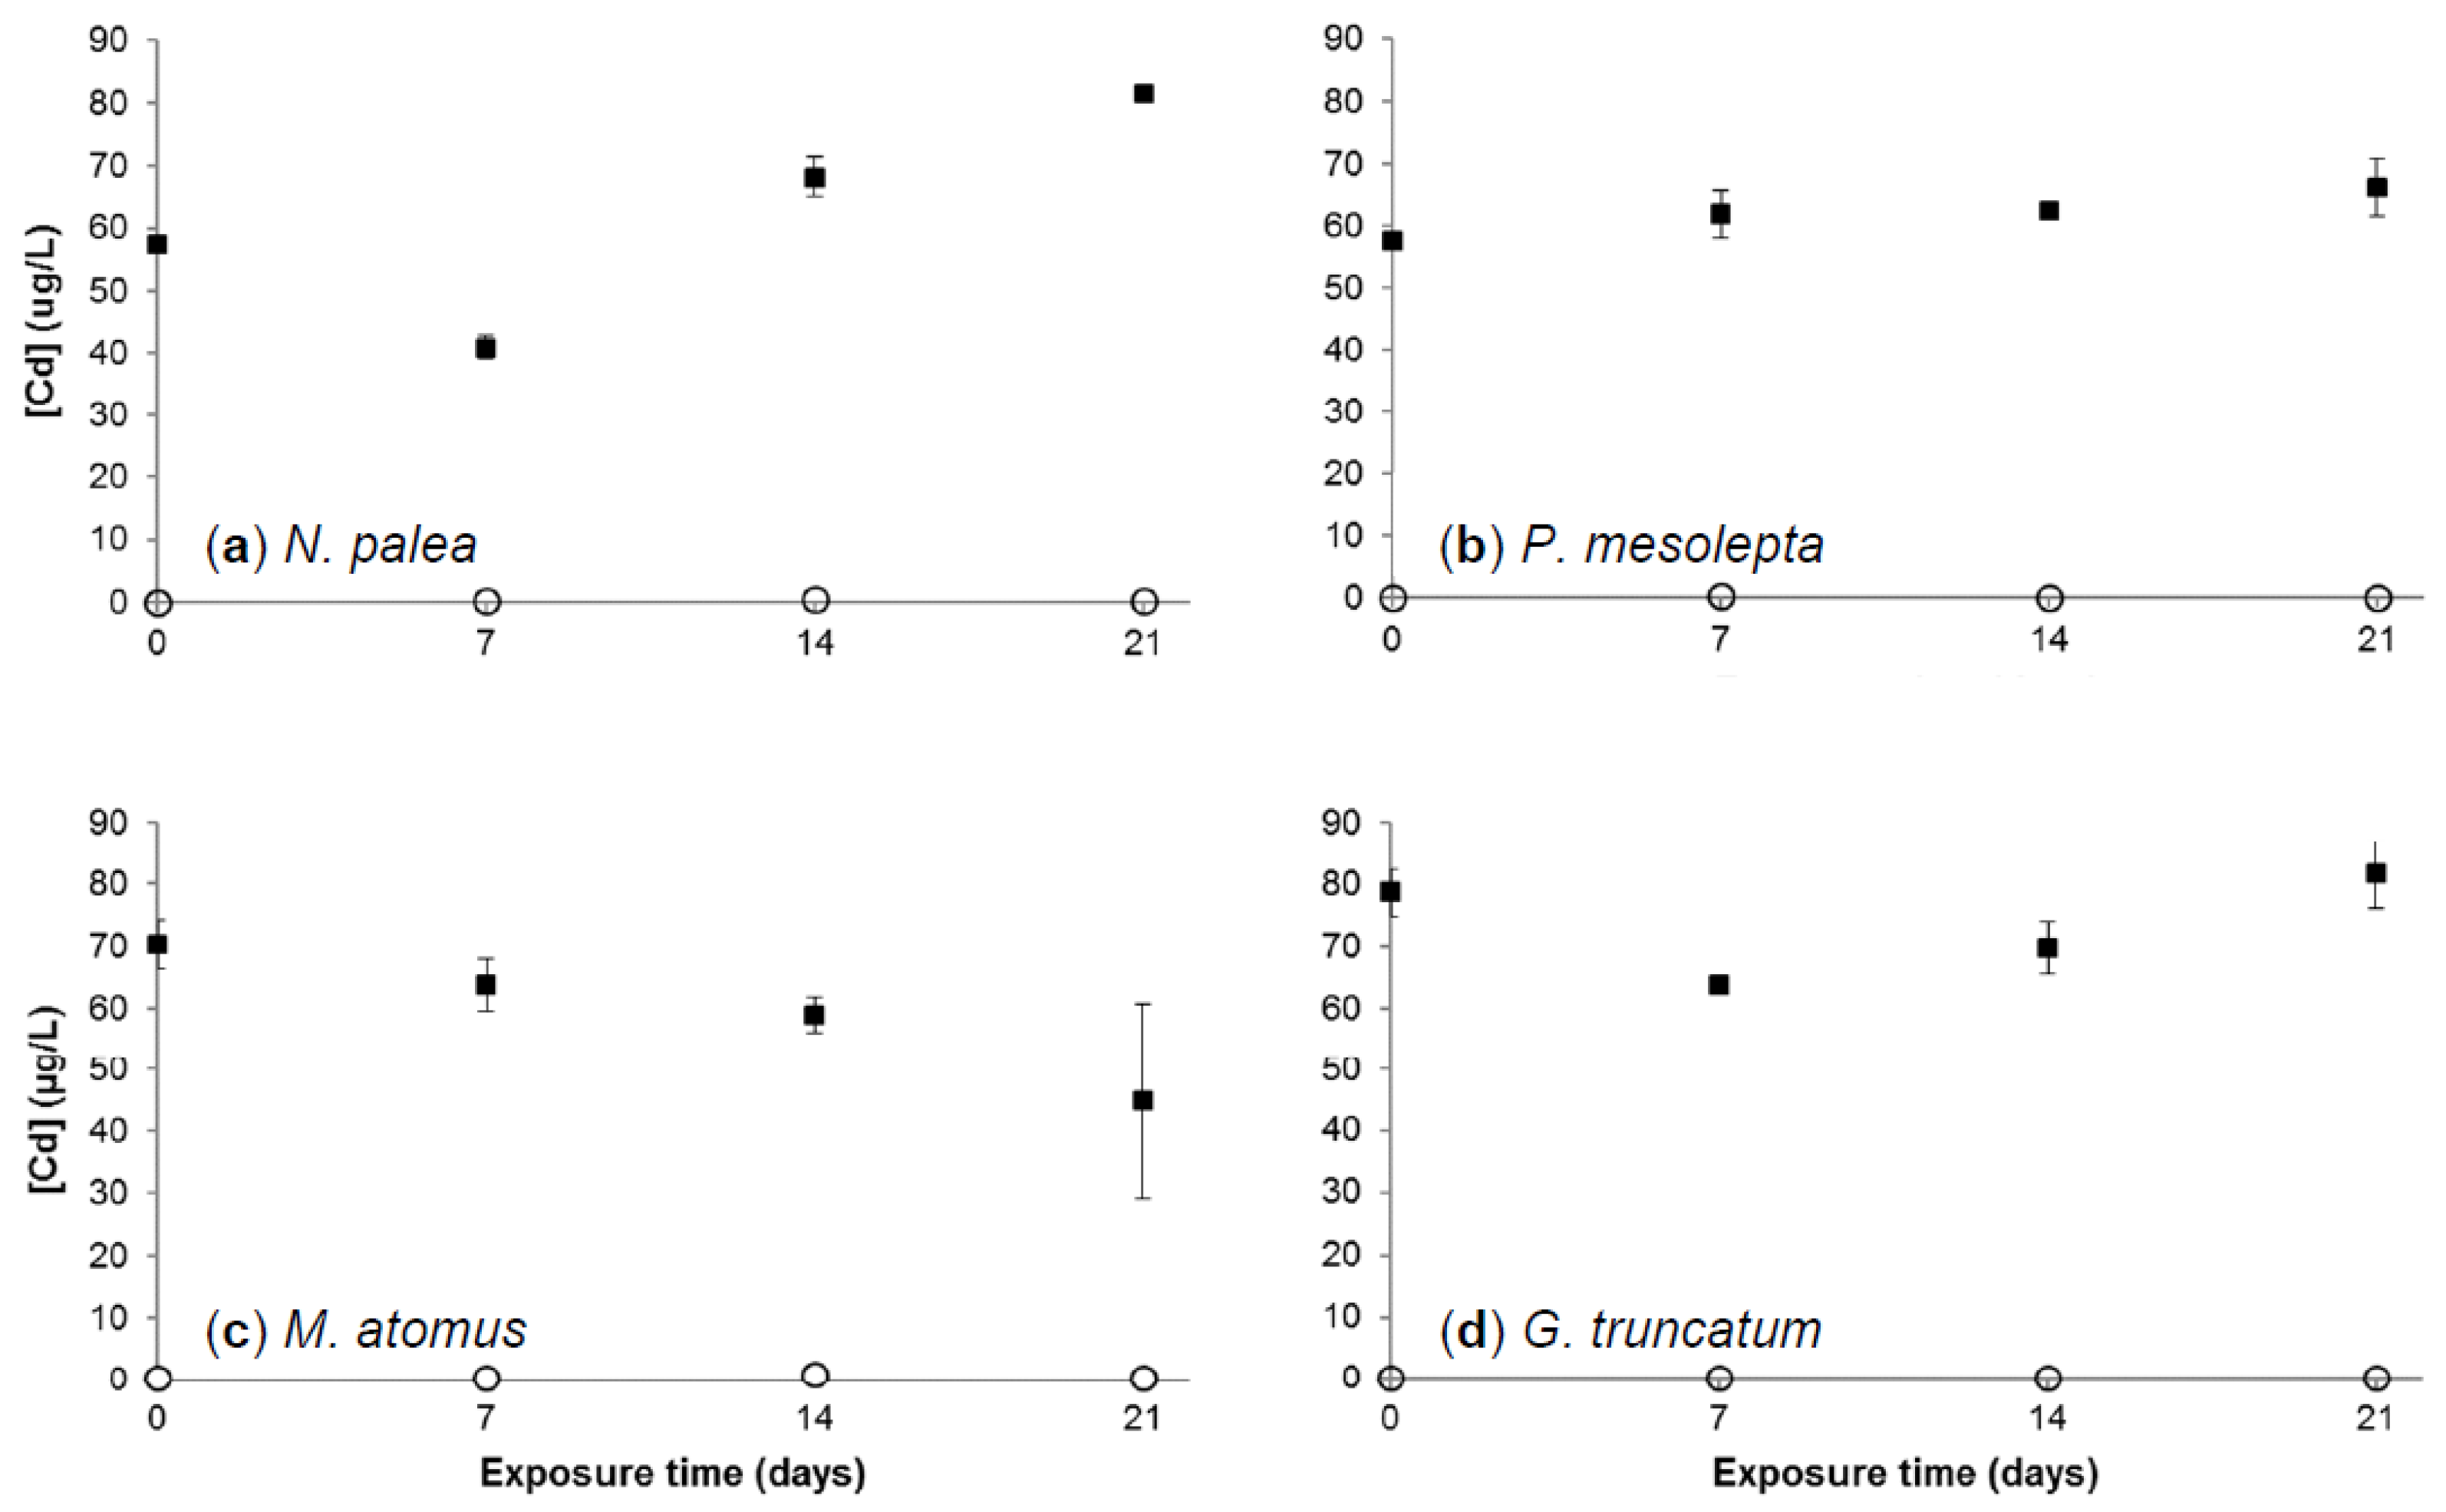
3.2.1. Cadmium Concentration in Growth Medium
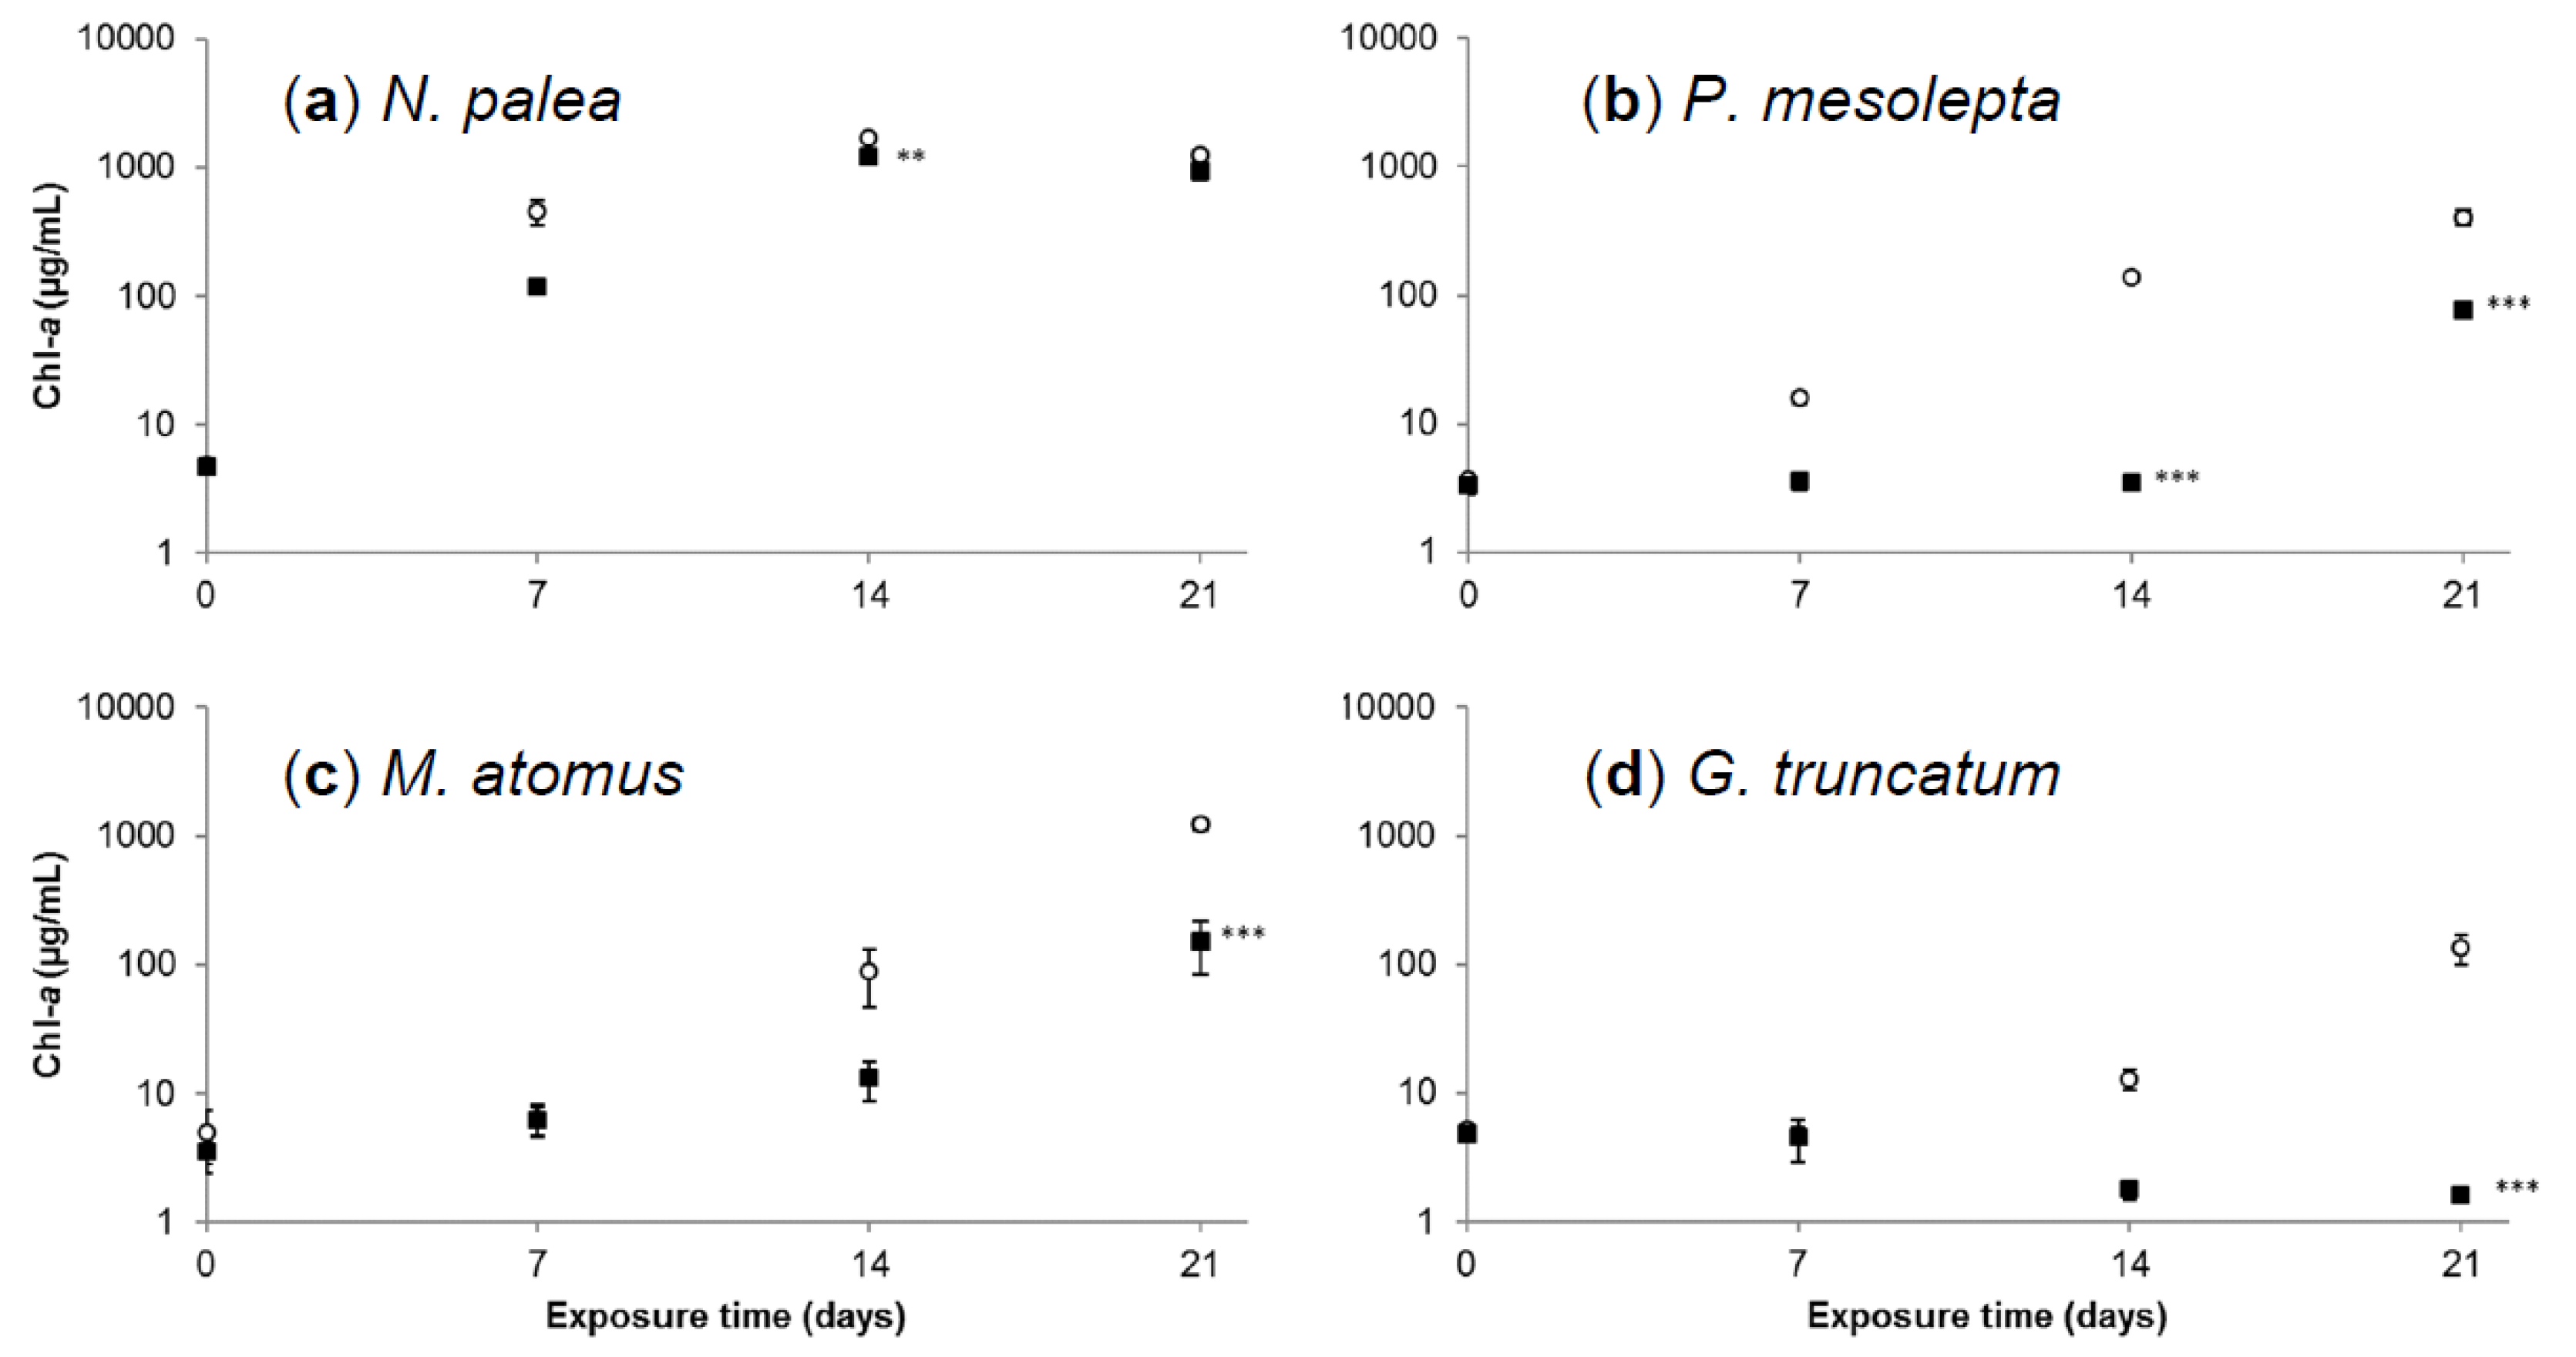
3.2.2. Effects of Cadmium on Diatoms’ Growth Kinetics
3.2.3. Cadmium Bioaccumulation in Diatoms
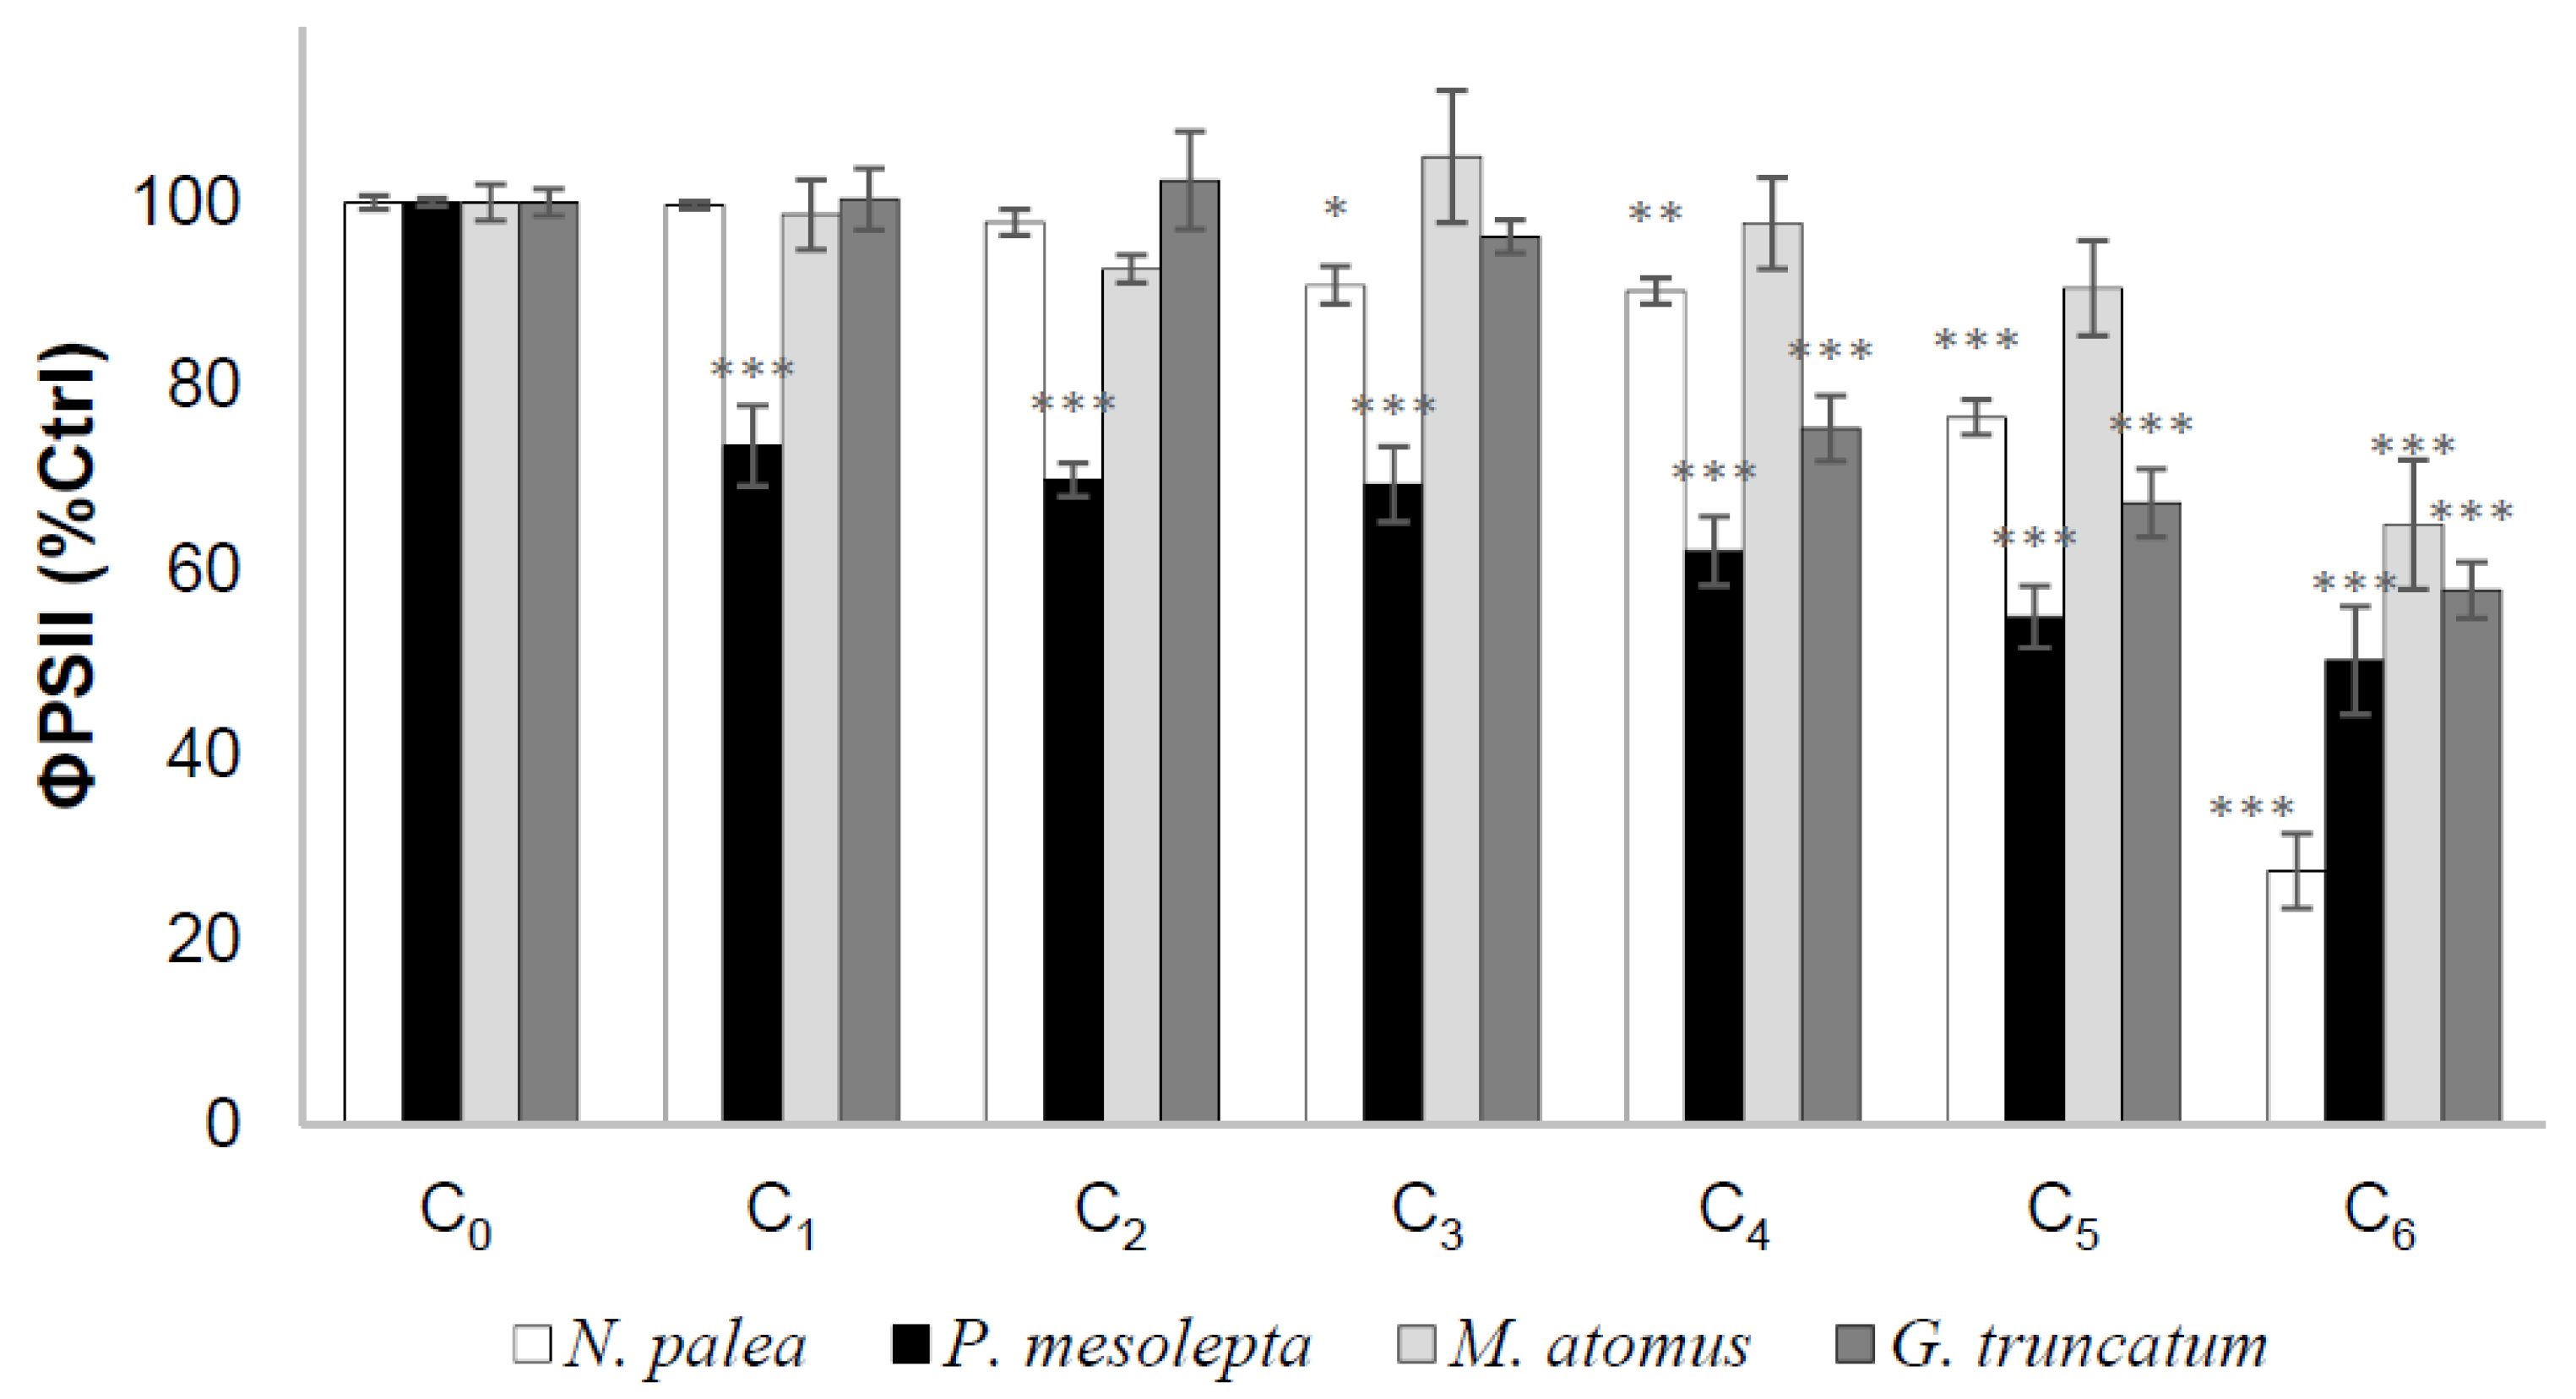
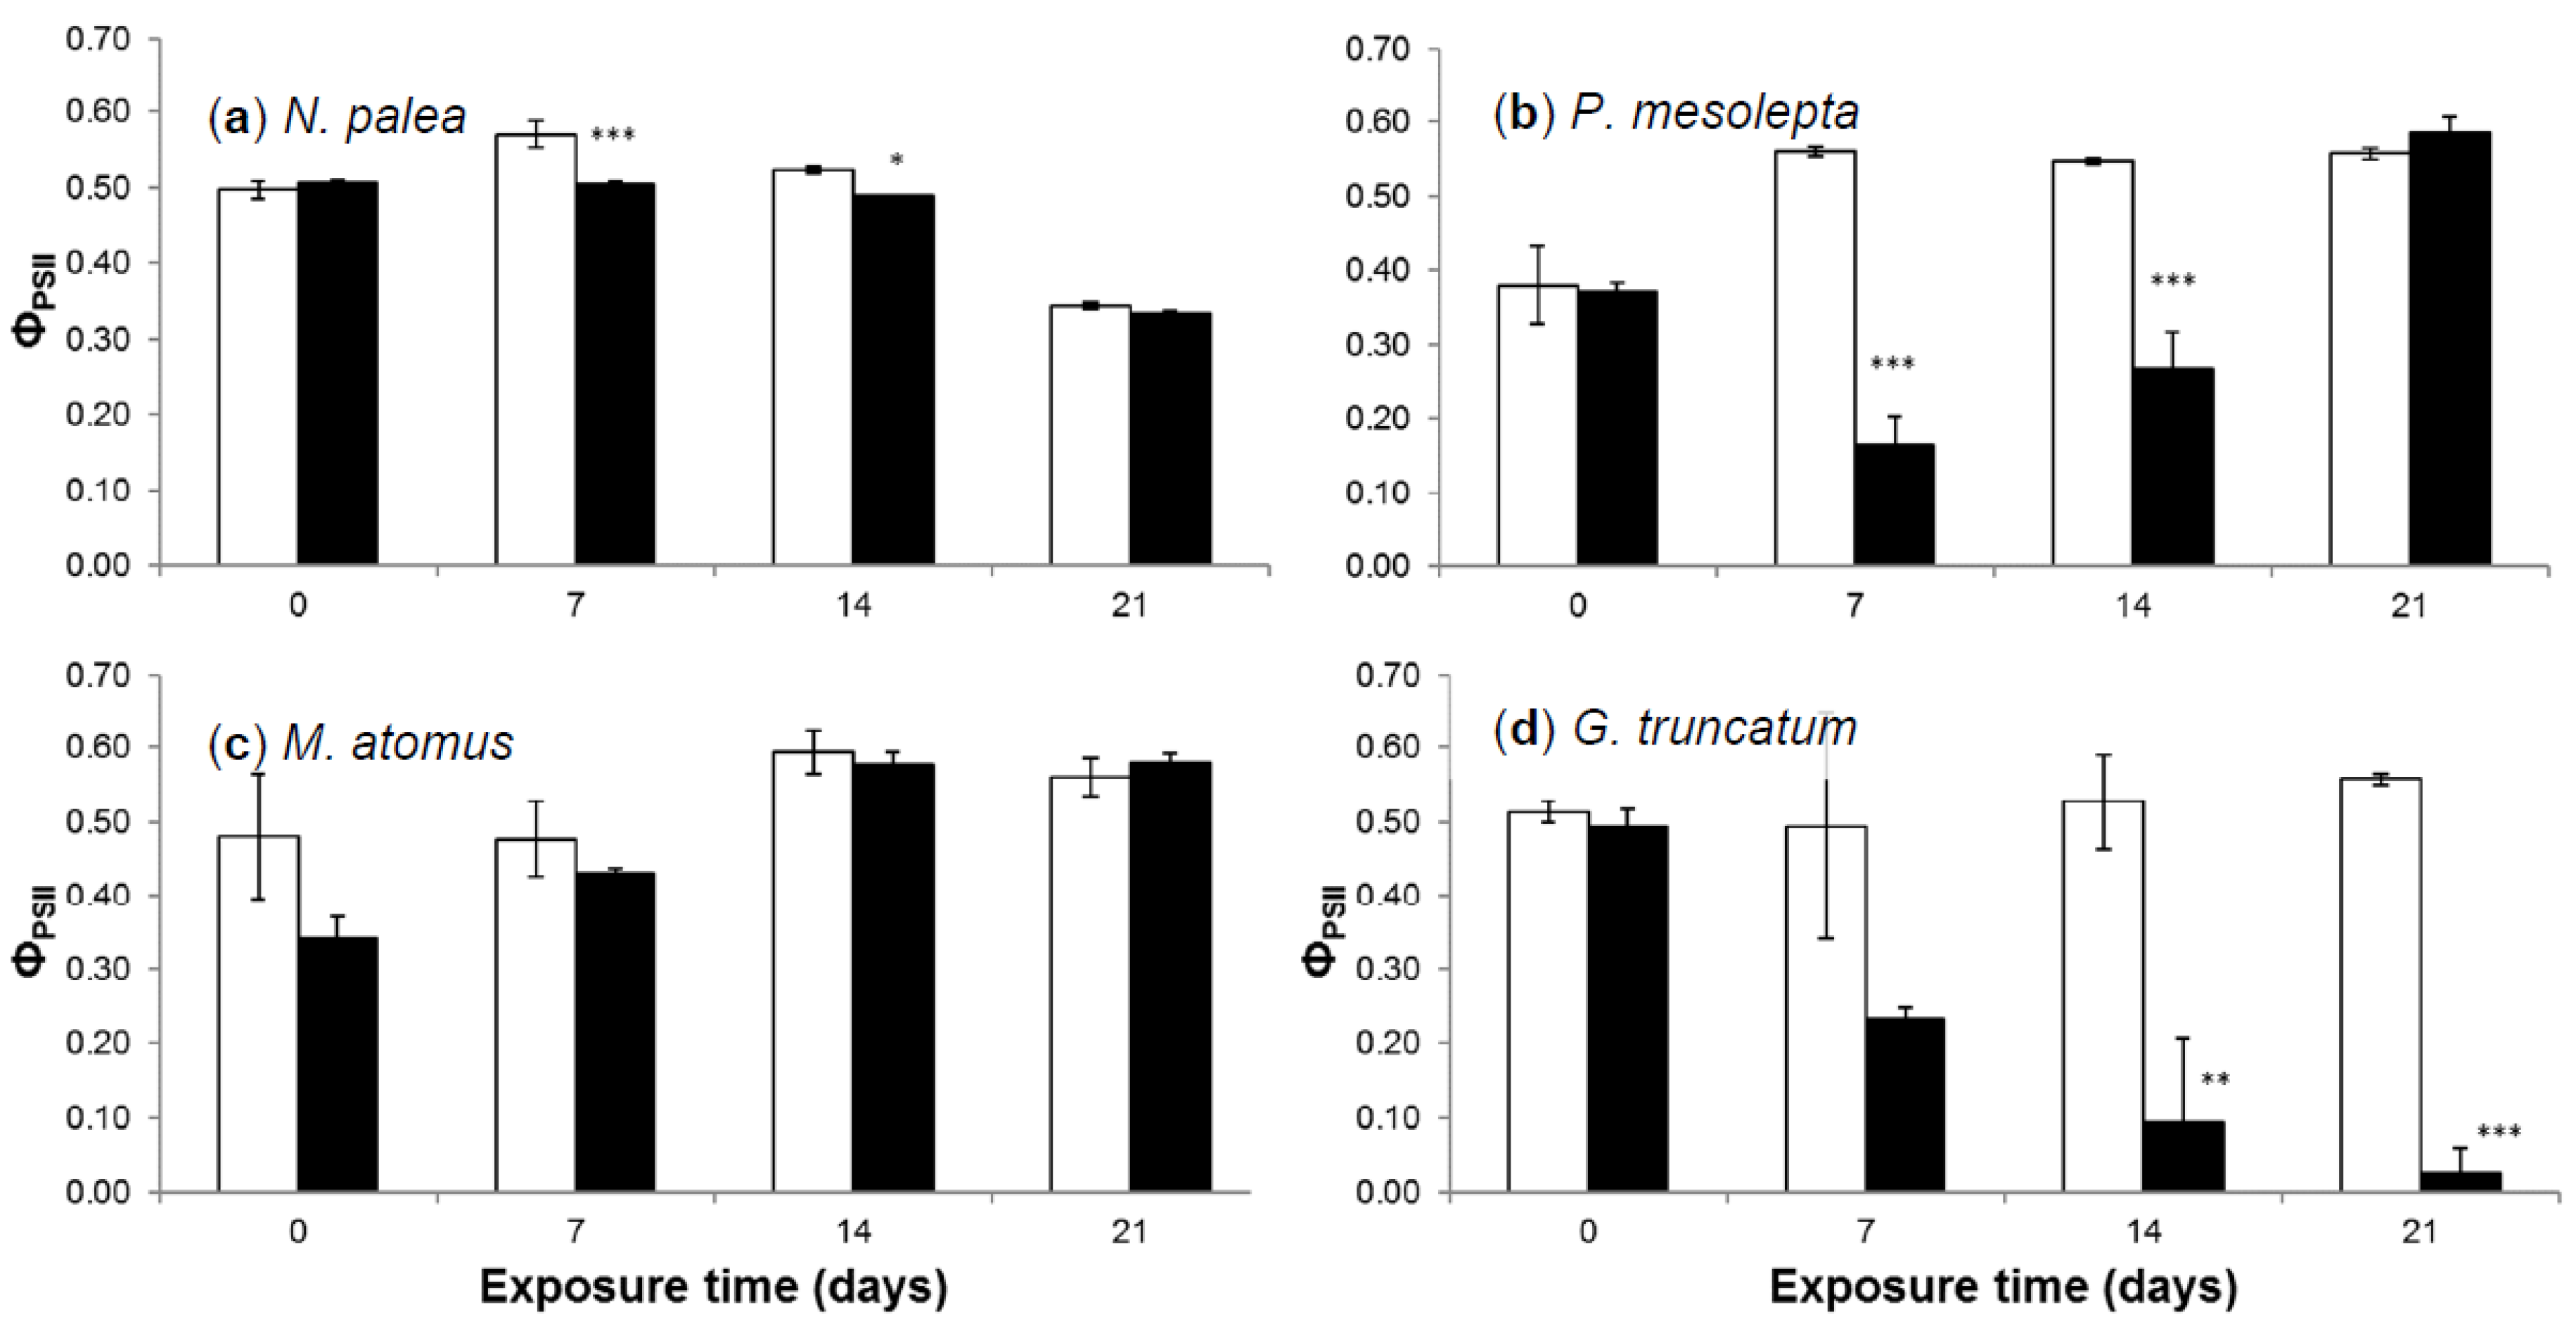
3.2.4. Effective Quantum Yield
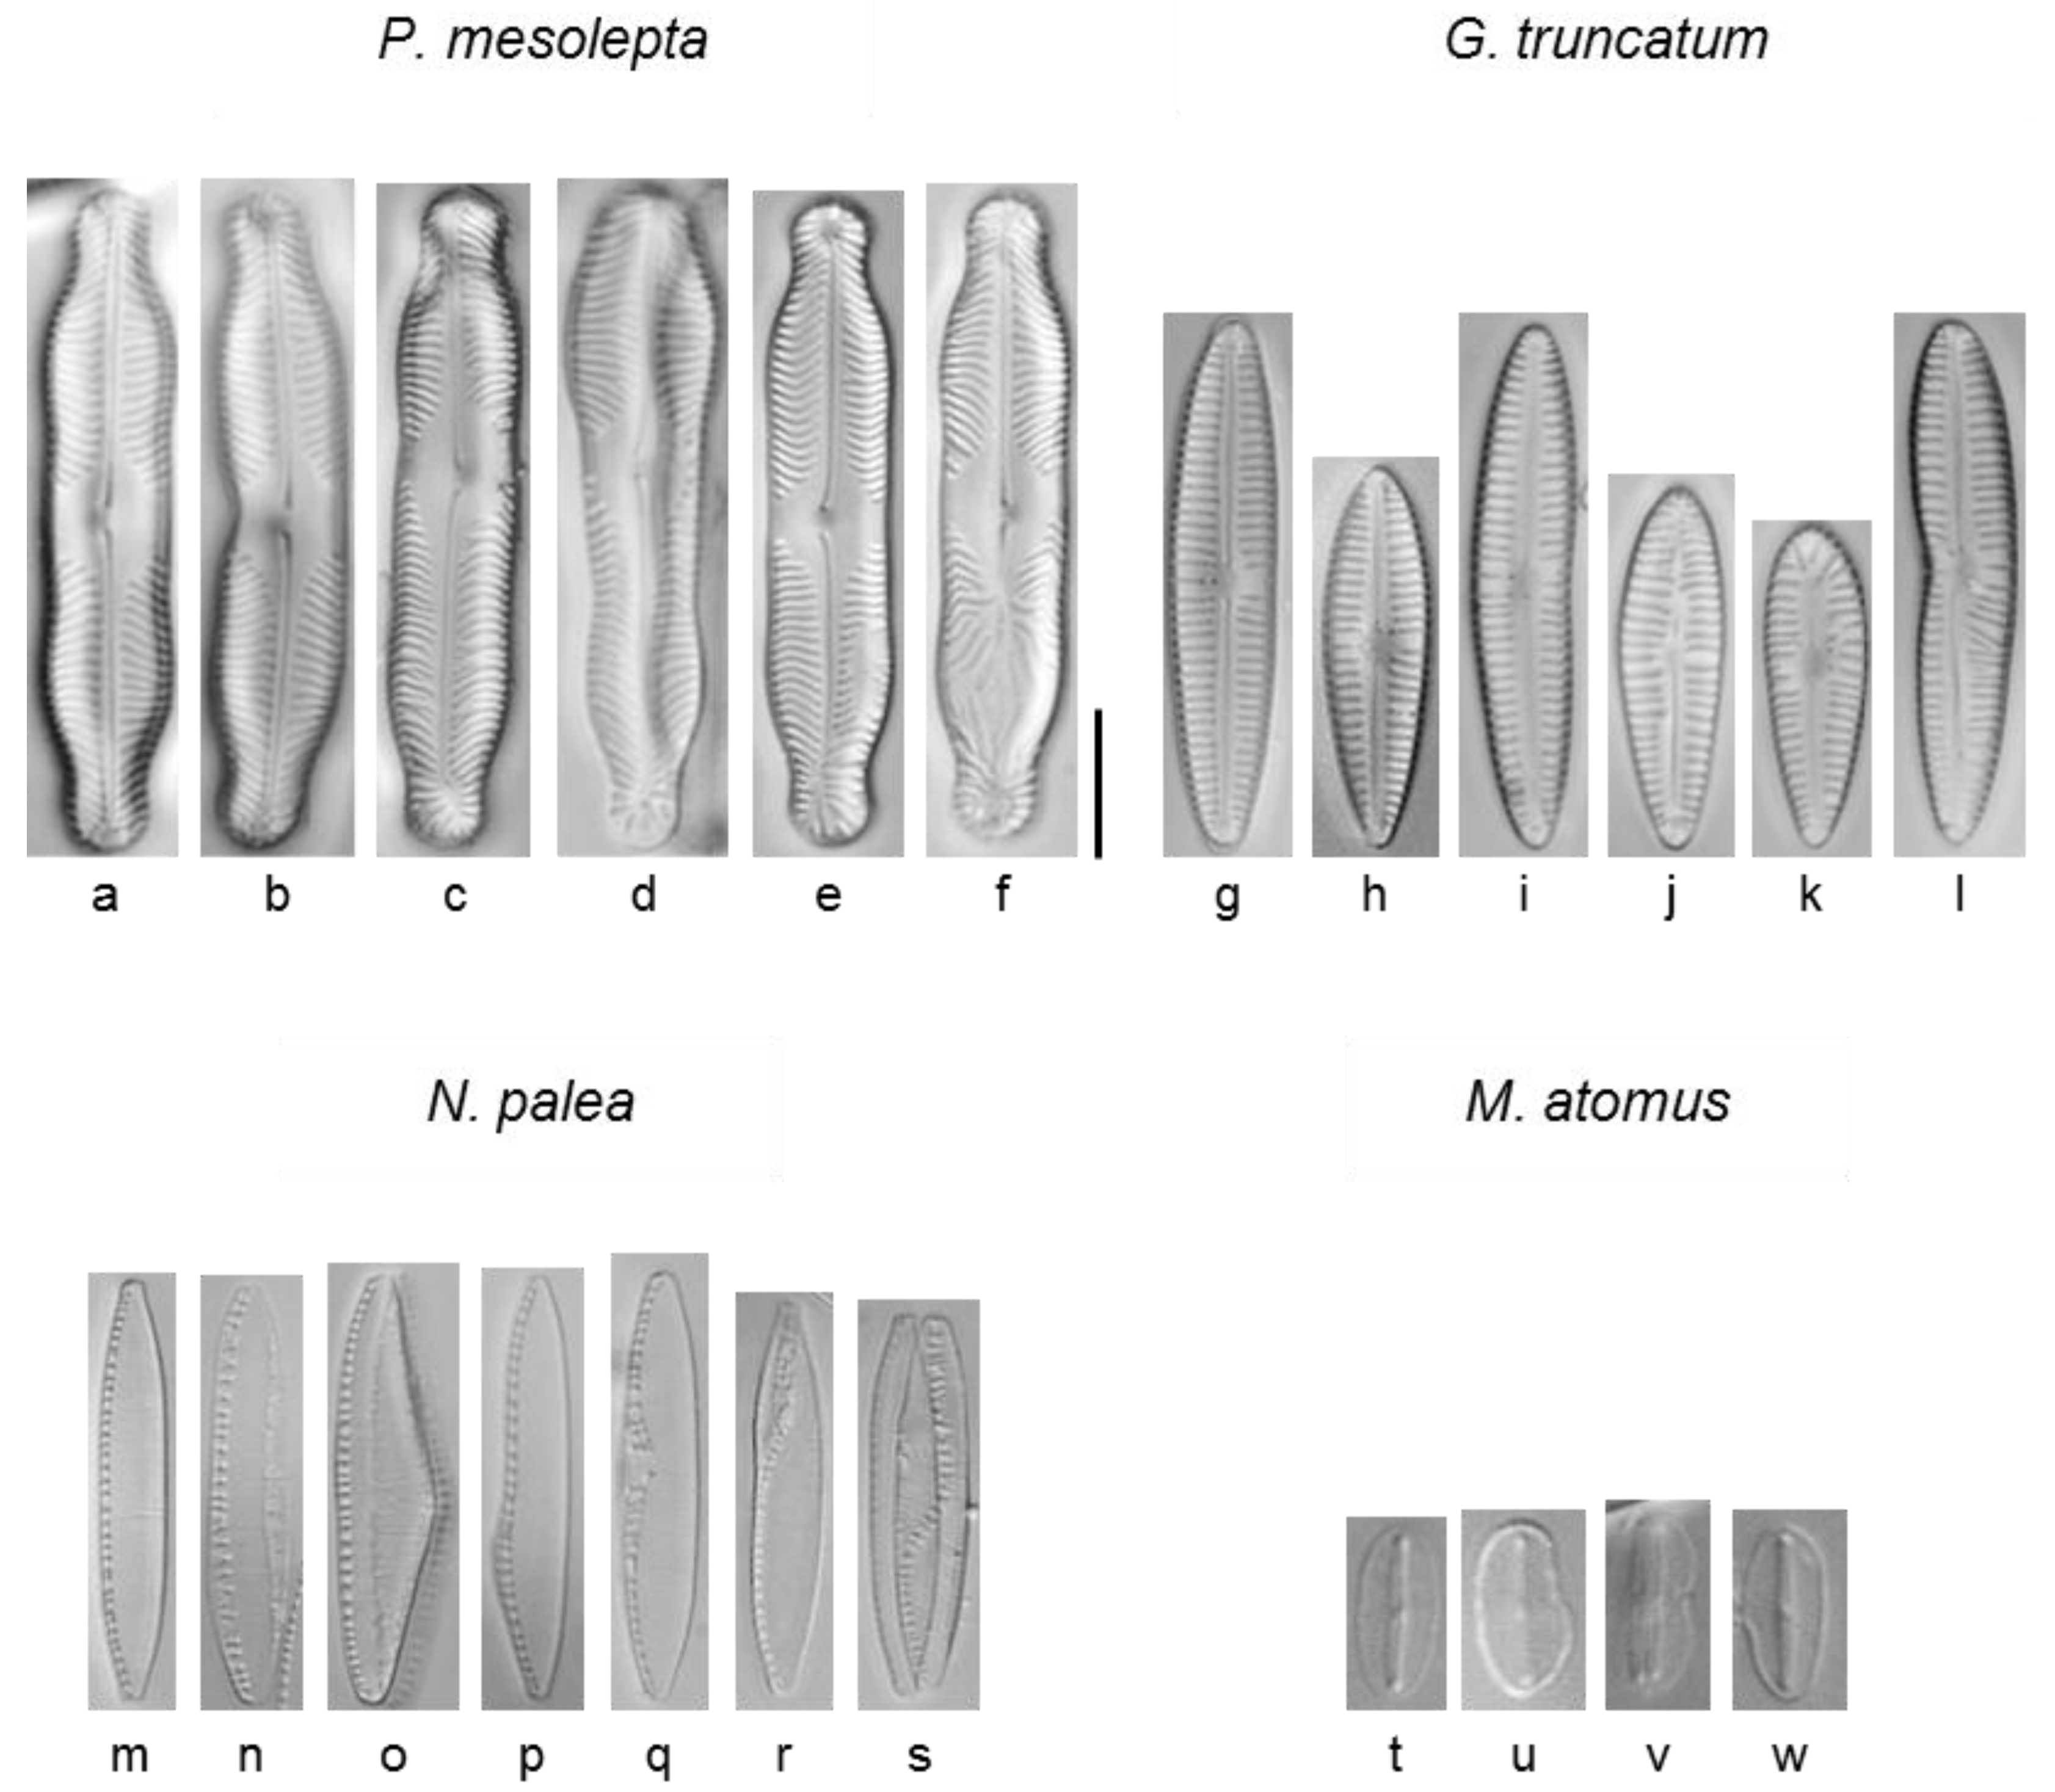
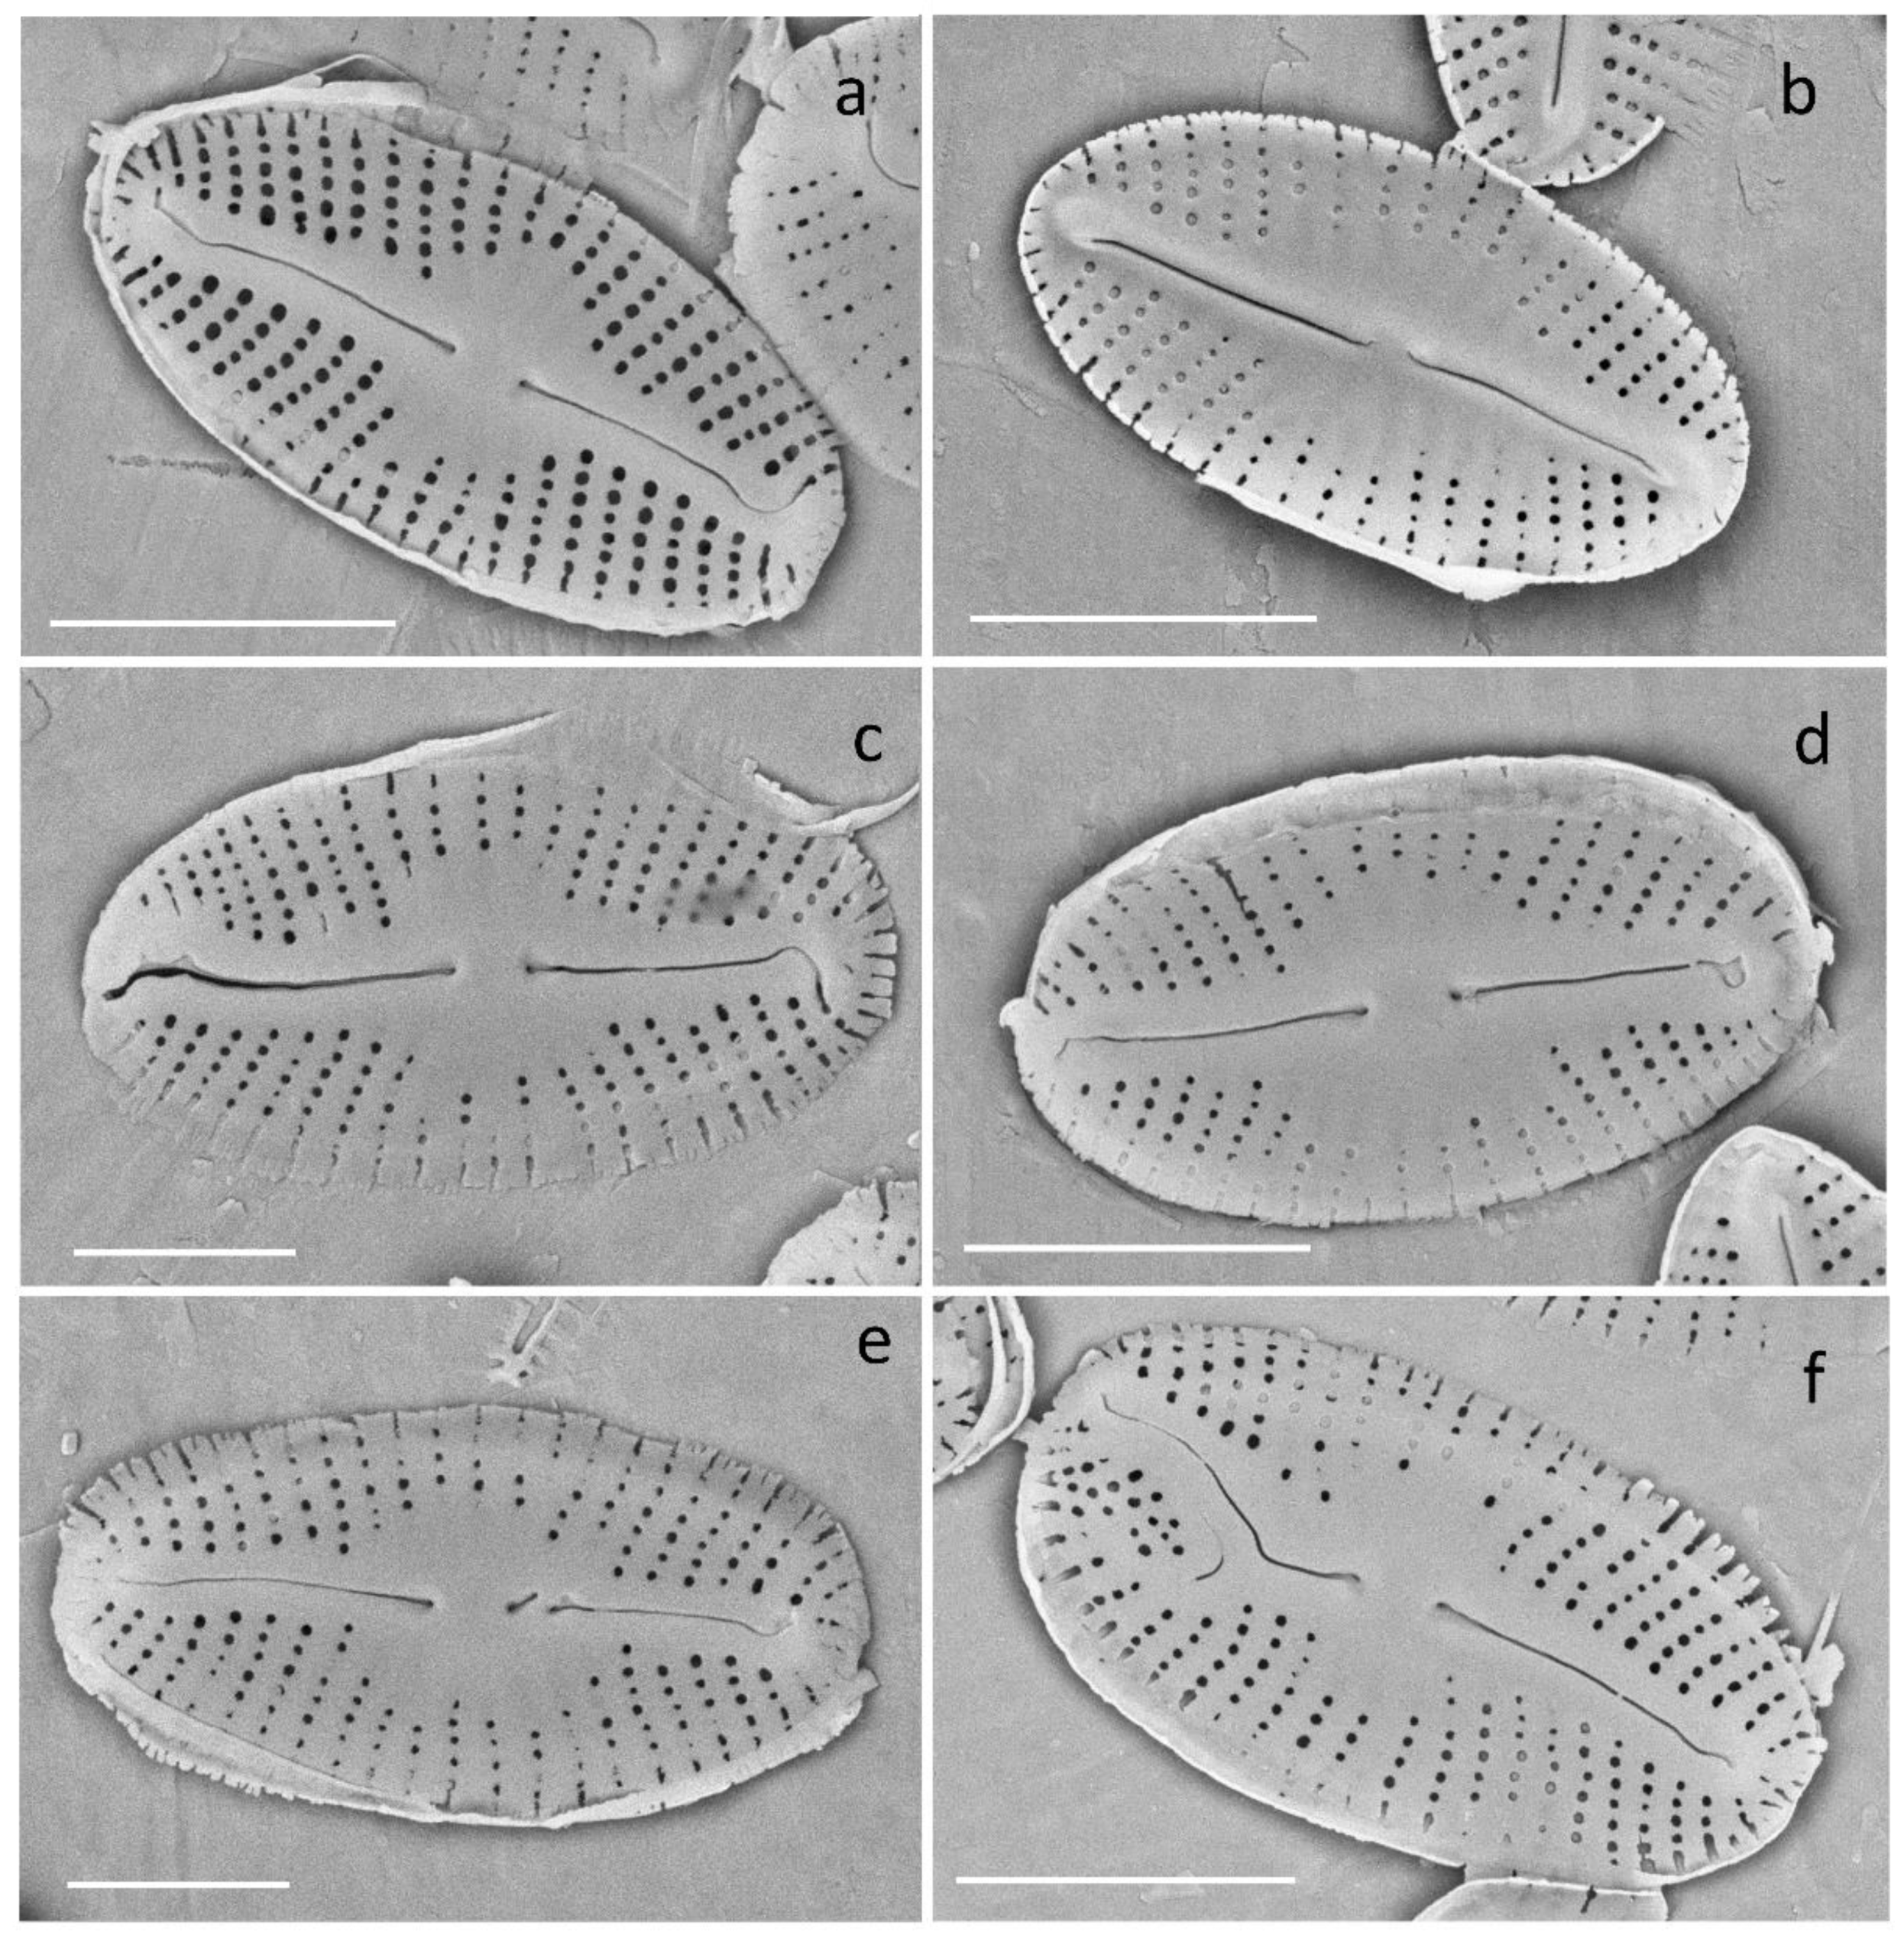
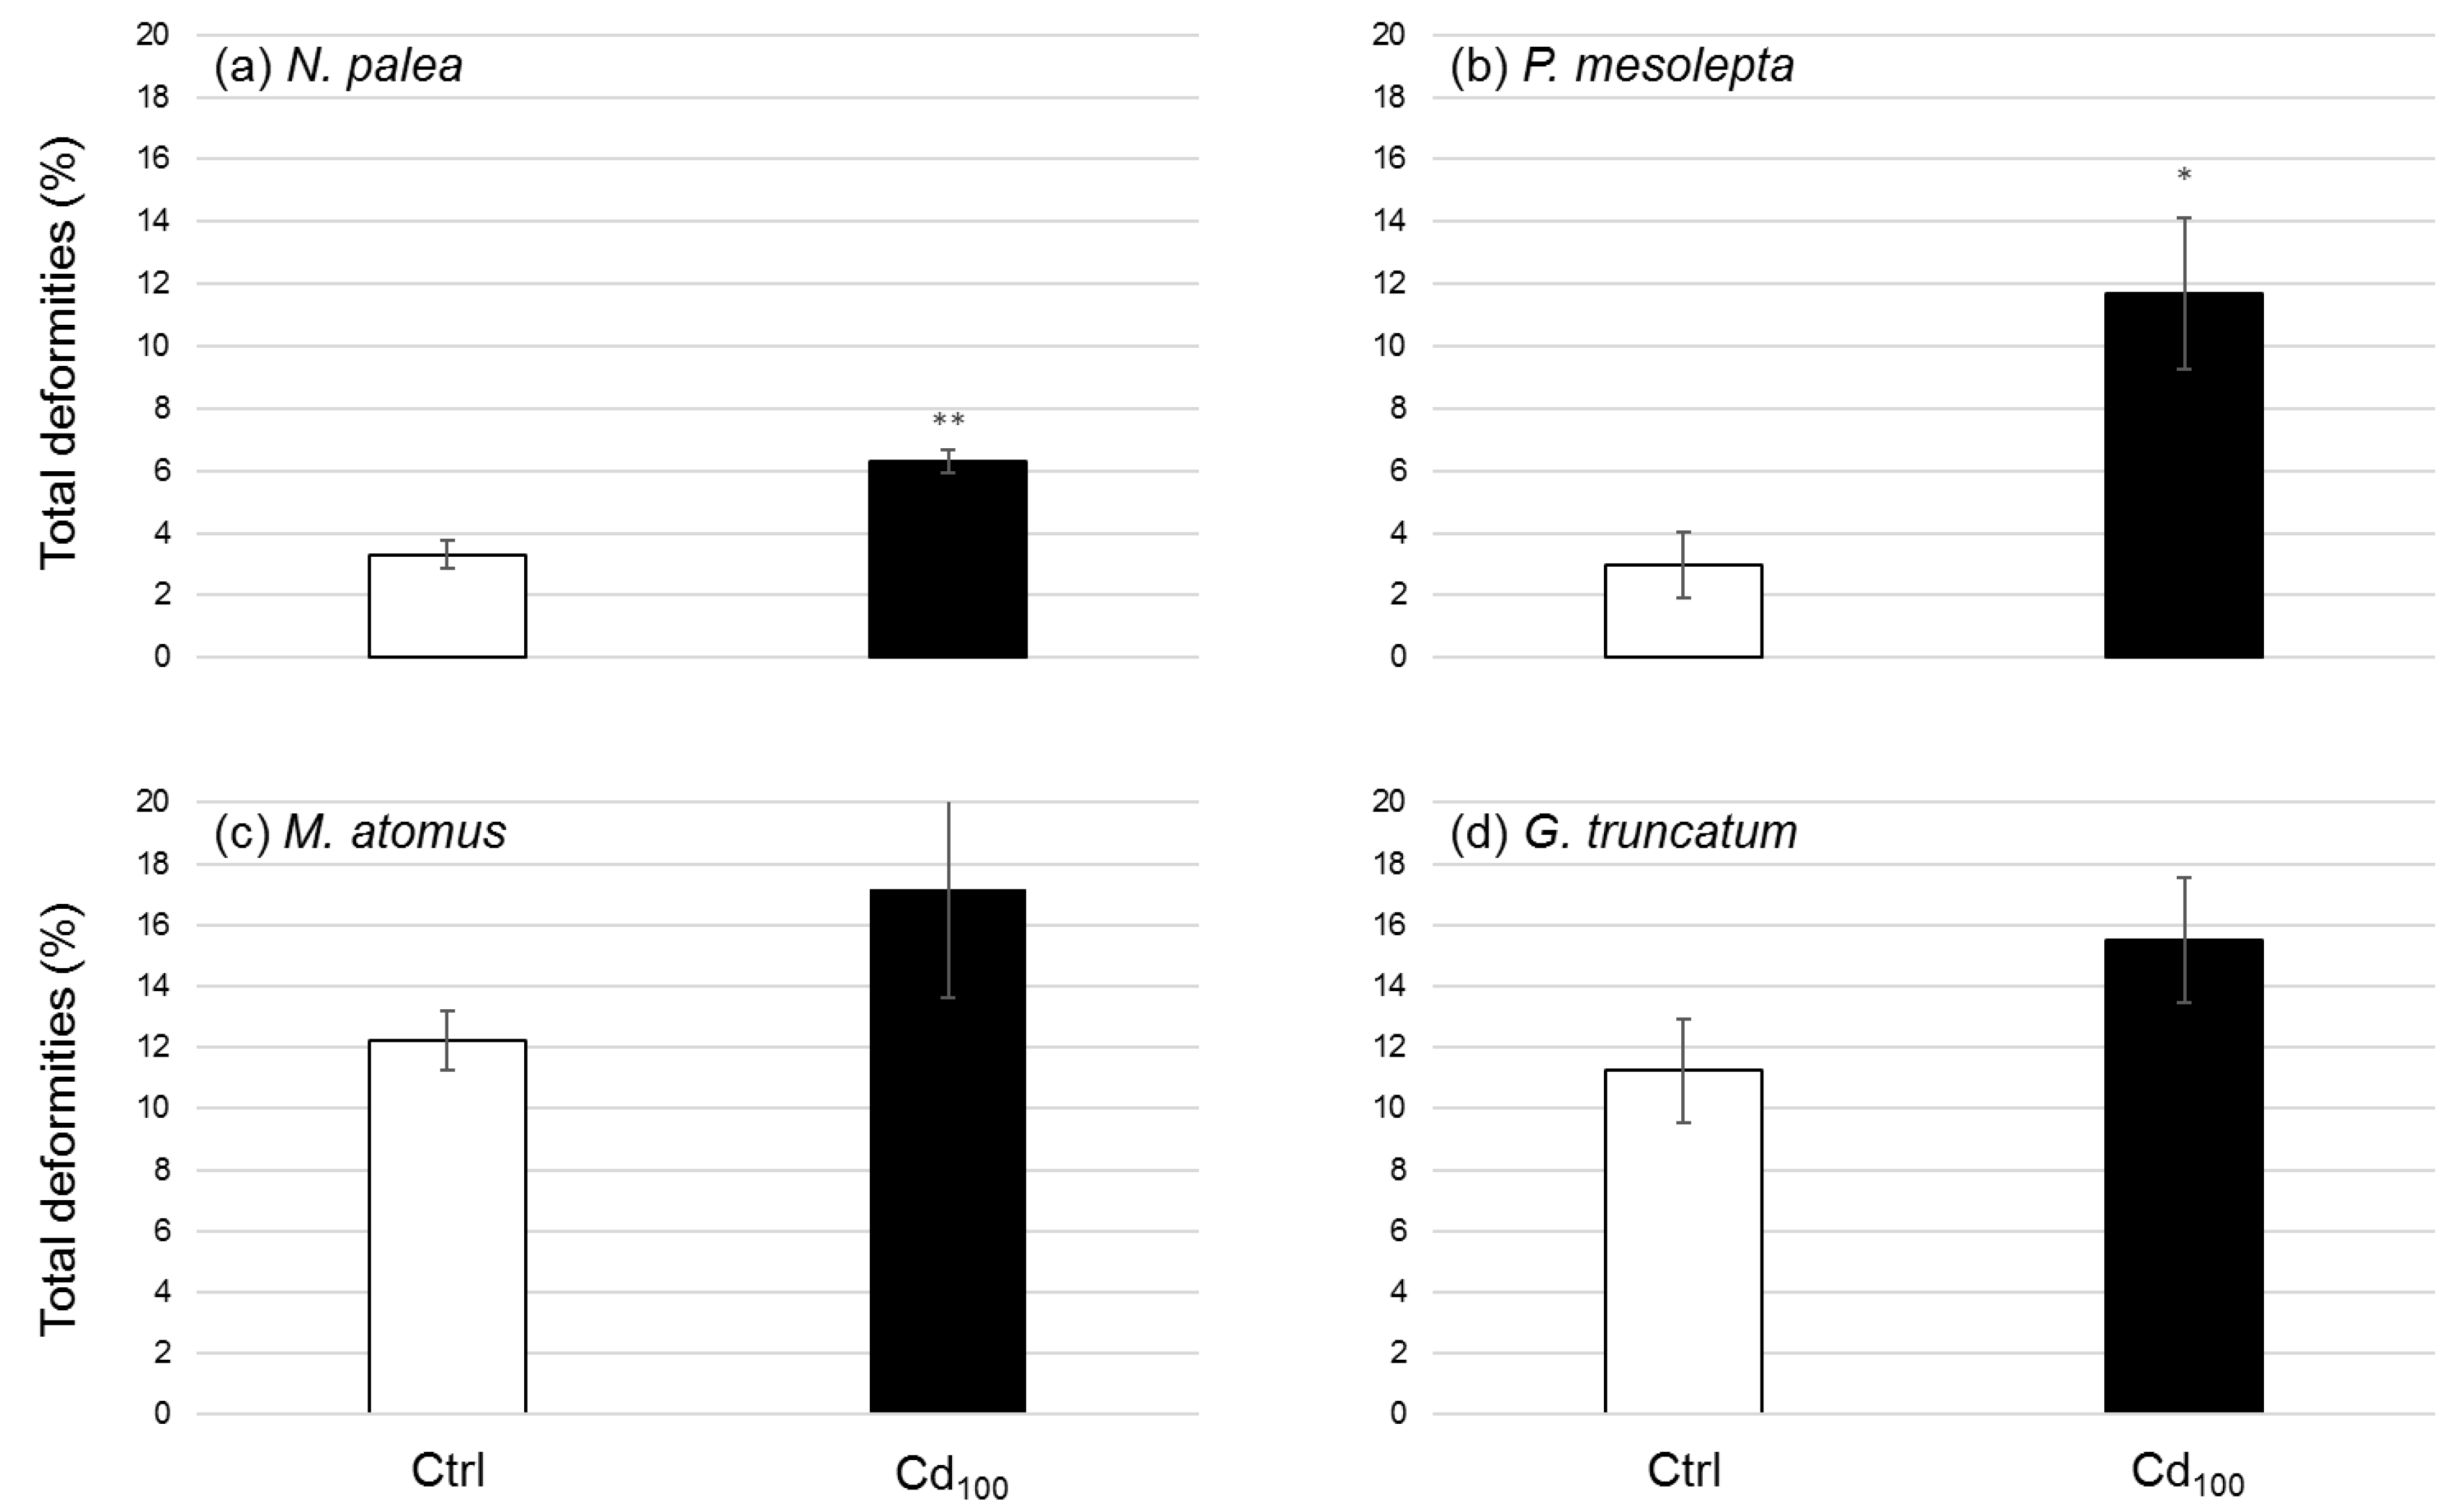
3.2.5. Deformities
4. Conclusions
Supplementary Materials
Author Contributions
Funding
Conflicts of Interest
References
- Coste, M.; Boutry, S.; Tison-Rosebery, J.; Delmas, F. Improvements of the Biological Diatom Index (BDI): Description and efficiency of the new version (BDI-2006). Ecol. Indic. 2009, 9, 621–650. [Google Scholar] [CrossRef]
- Kelly, M.; Whitton, B.A. The trophic diatom index: A new index for monitoring eutrophication in rivers. J. Appl. Phycol. 1995, 7, 433–444. [Google Scholar] [CrossRef]
- Lavoie, I.; Campeau, S.; Zugic-Drakulic, N.; Winter, J.G.; Fortin, C. Using diatoms to monitor stream biological integrity in Eastern Canada: An overview of 10 years of index development and ongoing challenges. Sci. Total Environ. 2014, 475, 187–200. [Google Scholar] [CrossRef] [PubMed]
- Lavoie, I.; Hamilton, P.B.; Morin, S.; Kim Tiam, S.; Kahlert, M.; Gonçalves, S.; Falasco, E.; Fortin, C.; Gontero, B.; Heudre, D.; et al. Diatom teratologies as biomarkers of contamination: Are all deformities ecologically meaningful? Ecol. Indic. 2017, 82, 539–550. [Google Scholar] [CrossRef]
- Stoermer, E.F.; Smol, J.P. Applications and uses of diatoms: Prologue. Diatoms Appl. Environ. Earth Sci. 1999, 2, 3–10. [Google Scholar]
- Arini, A.; Feurtet-Mazel, A.; Maury-Brachet, R.; Pokrovsky, O.S.; Coste, M.; Delmas, F. Recovery potential of periphytic biofilms translocated in artificial streams after industrial contamination (Cd and Zn). Ecotoxicology 2012, 21, 1403–1414. [Google Scholar] [CrossRef]
- Bere, T.; Tundisi, J.G. Cadmium and lead toxicity on tropical freshwater periphyton communities under laboratory-based mesocosm experiments. Hydrobiologia 2012, 680, 187–197. [Google Scholar] [CrossRef]
- Duong, T.T.; Morin, S.; Herlory, O.; Feurtet-Mazel, A.; Coste, M.; Boudou, A. Seasonal effects of cadmium accumulation in periphytic diatom communities of freshwater biofilms. Aquat. Toxicol. 2008, 90, 19–28. [Google Scholar] [CrossRef]
- Morin, S.; Cordonier, A.; Lavoie, I.; Arini, A.; Blanco, S.; Duong, T.T.; Tornés, E.; Bonet, B.; Corcoll, N.; Faggiano, L.; et al. Consistency in diatom response to metal-contaminated environments. In Emerging and Priority Pollutants in Rivers; Springer: Berlin/Heidelberg, Germany, 2012; pp. 117–146. [Google Scholar]
- Corcoll, N.; Bonet, B.; Morin, S.; Tlili, A.; Leira, M.; Guasch, H. The effect of metals on photosynthesis processes and diatom metrics of biofilm from a metal-contaminated river: A translocation experiment. Ecol. Indic. 2012, 18, 620–631. [Google Scholar] [CrossRef]
- Falasco, E.; Bona, F.; Badino, G.; Hoffmann, L.; Ector, L. Diatom teratological forms and environmental alterations: A review. Hydrobiologia 2009, 623, 1–35. [Google Scholar] [CrossRef]
- Fernández, M.; Martín, G.; Corzo, J.; de la Linde, A.; García, E.; López, M.; Sousa, M. Design and testing of a new diatom-based index for heavy metal pollution. Arch. Environ. Contam. Toxicol. 2018, 74, 170–192. [Google Scholar] [CrossRef] [PubMed]
- Dauta Conditions de développement du phytopancton. Etude comparative du comportement de huit espèces en culture. I. Détermination des paramètres de croissance en fonction de la lumière et de la température. Ann. Limnol. 1982, 18, 217–262. [Google Scholar] [CrossRef]
- Trobajo, R.; Clavero, E.; Chepurnov, V.A.; Sabbe, K.; Mann, D.G.; Ishihara, S.; Cox, E.J. Morphological, genetic and mating diversity within the widespread bioindicator Nitzschia palea (Bacillariophyceae). Phycologia 2009, 48, 443–459. [Google Scholar] [CrossRef]
- Morin, S.; Vivas-Nogues, M.; Duong, T.T.; Boudou, A.; Coste, M.; Delmas, F. Dynamics of benthic diatom colonization in a cadmium/zinc-polluted river (Riou-Mort, France). Fundam. Appl. Limnol. Arch. Hydrobiol. 2007, 168, 179–187. [Google Scholar] [CrossRef]
- Kim Tiam, S.; Morin, S.; Pesce, S.; Feurtet-Mazel, A.; Moreira, A.; Gonzalez, P.; Mazzella, N. Environmental effects of realistic pesticide mixtures on natural biofilm communities with different exposure histories. Sci. Total Environ. 2014, 473, 496–506. [Google Scholar] [CrossRef] [PubMed]
- Larras, F.; Bouchez, A.; Rimet, F.; Montuelle, B. Using bioassays and Species Sensitivity Distributions to assess herbicide toxicity towards benthic diatoms. PLoS ONE 2012, 7, e44458. [Google Scholar] [CrossRef] [PubMed]
- Moisset, S.; Kim Tiam, S.; Feurtet-Mazel, A.; Morin, S.; Delmas, F.; Mazzella, N.; Gonzalez, P. Genetic and physiological responses of three freshwater diatoms to realistic diuron exposures. Environ. Sci. Pollut. Res. 2015, 22, 4046–4055. [Google Scholar] [CrossRef]
- Lange-Bertalot, H. Navicula sensu stricto, 10 genera separated from Navicula sensu lato, Frustulia. In Diatoms of Europe—Diatoms of European Inland Waters and Comparable Habitats; Lange-Bertalot, H., Ed.; Gantner: Ruggell, Liechtenstein, 2001; Volume 2, p. 526. [Google Scholar]
- Reichardt, E. Revision der Arten um Gomphonema truncatum und G. capitatum. Lange Bertalot Festschr 2001, 187–224. [Google Scholar]
- Peres-Weerts, F. Mise en évidence des Effets Toxiques des Métaux Lourds sur les Diatomées par L’étude des Formes Tératogenes; Agence L Eau Artois Picardie Douai: Douai, France, 2000; 24p. [Google Scholar]
- Leguay, S.; Lavoie, I.; Levy, J.L.; Fortin, C. Using biofilms for monitoring metal contamination in lotic ecosystems: The protective effects of hardness and pH on metal bioaccumulation. Environ. Toxicol. Chem. 2016, 35, 1489–1501. [Google Scholar] [CrossRef]
- Feurtet-Mazel, A.; Gold, C.; Coste, M.; Boudou, A. Study of periphytic diatoms communities exposed to metallic contamination through complementary field and laboratory experiments. J. Phys. 2003, 107, 467–470. [Google Scholar] [CrossRef]
- Ivorra, N.; Hettelaar, J.; Tubbing, G.M.J.; Kraak, M.H.S.; Sabater, S.; Admiraal, W. Translocation of microbenthic algal assemblages used for in situ analysis of metal pollution in rivers. Arch. Environ. Contam. Toxicol. 1999, 37, 19–28. [Google Scholar] [CrossRef] [PubMed]
- Campbell, P.G.; Errécalde, O.; Fortin, C.; Hiriart-Baer, V.P.; Vigneault, B. Metal bioavailability to phytoplankton—Applicability of the biotic ligand model. Comp. Biochem. Physiol. Part C Toxicol. Pharmacol. 2002, 133, 189–206. [Google Scholar] [CrossRef]
- Hassler, C.S.; Slaveykova, V.I.; Wilkinson, K.J. Discriminating between intra-and extracellular metals using chemical extractions. Limnol. Oceanogr. Methods 2004, 2, 237–247. [Google Scholar] [CrossRef]
- Twiss, M.R.; Errécalde, O.; Fortin, C.; Campbell, P.G.; Jumarie, C.; Denizeau, F.; Berkelaar, E.; Hale, B.; van Rees, K. Coupling the use of computer chemical speciation models and culture techniques in laboratory investigations of trace metal toxicity. Chem. Speciat. Bioavailab. 2001, 13, 9–24. [Google Scholar] [CrossRef]
- Schreiber, U. Chlorophyll fluorescence: New instruments for special applications. In Photosynthesis: Mechanisms and Effects; Springer: Dordrecht, The Netherlands, 1998; pp. 4253–4258. [Google Scholar]
- Kim Tiam, S.; Lavoie, I.; Doose, C.; Hamilton, P.B.; Fortin, C. Morphological, physiological and molecular responses of Nitzschia palea under cadmium stress. Ecotoxicology 2018, 27, 675–688. [Google Scholar] [CrossRef] [PubMed]
- Corcoll, N.; Ricart, M.; Franz, S.; Sans-Piché, F.; Schmitt-Jansen, M.; Guasch, H. The use of photosynthetic fluorescence parameters from autotrophic biofilms for monitoring the effect of chemicals in river ecosystems. In Handbook of Environmental Chemistry; Guasch, H., Ginebreda, A., Geiszinger, A., Eds.; Springer: Heidelberg, Germany, 2012; Volume 19, pp. 86–114. [Google Scholar]
- Genty, B.; Briantais, J.M.; Baker, N.R. The relationship between the quantum yield of photosynthetic electron transport and quenching of chlorophyll fluorescence. Biochim. Biophys. Acta 1989, 990, 87–92. [Google Scholar] [CrossRef]
- R Development Core Team. R: A Language and Environment for Statistical Computing; R Foundation for Statistical Computing: Vienna, Austria, 2008. [Google Scholar]
- Vindimian, E. REGTOX: Macro Excel™ for Dose-Response Modelling 2003. Available online: http://www.normalesup.org/~vindimian/en_index.html (accessed on 9 July 2019).
- Lavoie, I.; Lavoie, M.; Fortin, C. A mine of information: Benthic algal communities as biomonitors of metal contamination from abandoned tailings. Sci. Total Environ. 2012, 425, 231–241. [Google Scholar] [CrossRef]
- Morin, S.; Duong, T.T.; Dabrin, A.; Coynel, A.; Herlory, O.; Baudrimont, M.; Delmas, F.; Durrieu, G.; Schäfer, J.; Winterton, P.; et al. Long-term survey of heavy-metal pollution, biofilm contamination and diatom community structure in the Riou Mort watershed, South-West France. Environ. Pollut. 2008, 151, 532–542. [Google Scholar] [CrossRef]
- Morin, S.; Coste, M.; Delmas, F. A comparison of specific growth rates of periphytic diatoms of varying cell size under laboratory and field conditions. Hydrobiologia 2008, 614, 285–297. [Google Scholar] [CrossRef][Green Version]
- Lee, J.G.; Ahner, B.A.; Morel, F.M. Export of cadmium and phytochelatin by the marine diatom Thalassiosira weissflogii. Environ. Sci. Technol. 1996, 30, 1814–1821. [Google Scholar] [CrossRef]
- Teitzel, G.M.; Parsek, M.R. Heavy metal resistance of biofilm and planktonic Pseudomonas aeruginosa. Appl. Environ. Microbiol. 2003, 69, 2313–2320. [Google Scholar] [CrossRef] [PubMed]
- Paquet, N.; Lavoie, M.; Maloney, F.; Duval, J.F.L.; Campbell, P.G.C.; Fortin, C. Cadmium accumulation and toxicity in the unicellular alga Pseudokirchneriella subcapitata: Influence of metal-binding exudates and exposure time. Environ. Toxicol. Chem. 2015, 34, 1524–1532. [Google Scholar] [CrossRef]
- Kim Tiam, S.; Feurtet-Mazel, A.; Delmas, F.; Mazzella, N.; Morin, S.; Daffe, G.; Gonzalez, P. Development of q-PCR approaches to assess water quality: Effects of cadmium on gene expression of the diatom Eolimna minima. Water Res. 2012, 46, 934–942. [Google Scholar] [CrossRef] [PubMed]
- Arini, A.; Durant, F.; Coste, M.; Delmas, F.; Feurtet-Mazel, A. Cadmium decontamination and reversal potential of teratological forms of the diatom Planothidium frequentissimum (Bacillariophyceae) after experimental contamination. J. Phycol. 2013, 49, 361–370. [Google Scholar] [CrossRef] [PubMed]
- Rijstenbil, J.W.; Sandee, A.; Van Drie, J.; Wijnholds, J.A. Interaction of toxic trace metals and mechanisms of detoxification in the planktonic diatoms Ditylum brightwellii and Thalassiosira pseudonana. FEMS Microbiol. Rev. 1994, 14, 387–396. [Google Scholar] [CrossRef] [PubMed]
- Lavoie, M.; Le Faucheur, S.; Fortin, C.; Campbell, P.G.C. Cadmium detoxification strategies in two phytoplankton species: Metal binding by newly synthesized thiolated peptides and metal sequestration in granules. Aquat. Toxicol. 2009, 92, 65–75. [Google Scholar] [CrossRef]
- Le Faucheur, S.; Behra, R.; Sigg, L. Phytochelatin induction, cadmium accumulation, and algal sensitivity to free cadmium ion in Scenedesmus vacuolatus. Environ. Toxicol. Chem. 2005, 24, 1731–1737. [Google Scholar] [CrossRef]
- Le Faucheur, S.; Schildknecht, F.; Behra, R.; Sigg, L. Thiols in Scenedesmus vacuolatus upon exposure to metals and metalloids. Aquat. Toxicol. 2006, 80, 355–361. [Google Scholar] [CrossRef]
- Le Faucheur, S.; Behra, R.; Sigg, L. Thiol and metal contents in periphyton exposed to elevated copper and zinc concentrations: A field and microcosm study. Environ. Sci. Technol. 2005, 39, 8099–8107. [Google Scholar] [CrossRef]
- Kim Tiam, S.; Laviale, M.; Feurtet-Mazel, A.; Jan, G.; Gonzalez, P.; Mazzella, N.; Morin, S. Herbicide toxicity on river biofilms assessed by pulse amplitude modulated (PAM) fluorometry. Aquat. Toxicol. 2015, 165, 160–171. [Google Scholar] [CrossRef] [PubMed]
- Laviale, M.; Prygiel, J.; Créach, A. Light modulated toxicity of isoproturon toward natural stream periphyton photosynthesis: A comparison between constant and dynamic light conditions. Aquat. Toxicol. 2010, 97, 334–342. [Google Scholar] [CrossRef] [PubMed]
- Pesce, S.; Margoum, C.; Montuelle, B. In situ relationships between spatio-temporal variations in diuron concentrations and phototrophic biofilm tolerance in a contaminated river. Water Res. 2010, 44, 1941–1949. [Google Scholar] [CrossRef] [PubMed]
- Qiang, H.; Guterman, H.; Richmond, A. Physiological characteristics of Spirulina platensis (cyanobacteria) cultured at ultrahigh cell densities. J. Phycol. 1996, 32, 1066–1073. [Google Scholar] [CrossRef]
- Falasco, E.; Bona, F.; Ginepro, M.; Hlúbiková, D.; Hoffmann, L.; Ector, L. Morphological abnormalities of diatom silica walls in relation to heavy metal contamination and artificial growth conditions. Water SA 2009, 35, 595–606. [Google Scholar] [CrossRef][Green Version]
| EC25 (µg/L); α5% | |
|---|---|
| N. palea | 1179 (1015, 1349) |
| P. mesolepta | 9 (3, 23) |
| M. atomus | 2394 (1890, 2896) |
| G. truncatum | 606 (348, 926) |
| Cadmium Bioaccumulation for Cd100 Treatment (ng Cd/mg Chl-a) | ||||
|---|---|---|---|---|
| T0 | T7 | T14 | T21 | |
| N. palea | <q.l. | 25.9 ± 3.1 | 5.29 ± 0.92 | 8.74 ± 0.77 |
| P. mesolepta | <q.l. | <d.l. | <d.l. | 12.36 ± 0.87 |
| M. atomus | <q.l. | <q.l. | 201 ± 32 | 73 ± 14 |
| G. truncatum | <q.l. | <d.l. | <d.l. | <d.l. |
| Species/Type of Deformity | Ctrl | Cd100 | ||||
|---|---|---|---|---|---|---|
| Ctrl-R1 | Ctrl-R2 | Ctrl-R3 | Cd100-R1 | Cd100-R2 | Cd100-R3 | |
| Nitzchia palea | ||||||
| Shape *** | 2 | 2 | 2 | 2 | 4 | 5 |
| minor deviation of the raphe canal * | 3 | 2 | 6 | 6 | 12 | 1 |
| moderate deviation of the raphe canal * | 2 | 2 | 4 | 3 | 9 | |
| major deviation of the raphe canal * | 1 | 5 | ||||
| fibule/canal interruption * | 1 | 2 | 2 | 2 | ||
| irregular fibulae * | 4 | 5 | 4 | 4 | 3 | 6 |
| irregula striation pattern ** | 1 | 1 | 3 | 1 | 1 | |
| mixed (deviation of the raphe canal + shape) **** | 1 | 1 | 1 | |||
| (valves counted) | (401) | (406) | (403) | (401) | (405) | (400) |
| Pinnularia mesolepta | ||||||
| Shape *** | 3 | 1 | 5 | 1 | 2 | 2 |
| striation pattern ** | 3 | 7 | 7 | 13 | 8 | |
| wide central area or lack of central area * | 1 | 2 | 1 | 3 | ||
| Asymmetry * | 4 | 2 | ||||
| Raphe * | 3 | 1 | 8 | 3 | 4 | |
| raphe and stria *,** | 2 | 3 | 4 | 8 | 6 | 3 |
| mixed (shape/asymetry + raphe + stria) **** | 1 | 5 | 5 | 2 | ||
| (valves counted) | (400) | (407) | (406) | (244) | (238) | (273) |
| Mayamaea atomus | ||||||
| Shape *** | 1 | 2 | 1 | 1 | 1 | |
| striation pattern ** | 6 | 1 | 2 | 3 | 1 | |
| raphe + stria *,** | 2 | 4 | 3 | 4 | ||
| raphe * | 9 | 9 | 18 | 27 | 16 | 24 |
| mixed (shape + raphe + stria) **** | 3 | 1 | 1 | |||
| (valves counted) | (159) | (159) | (164) | (148) | (182) | (153) |
| Gomphonema truncatum | ||||||
| Shape *** | 15 | 13 | 25 | 5 | 9 | 4 |
| striation pattern ** | 22 | 21 | 17 | 12 | 13 | 5 |
| Raphe * | 10 | 2 | 7 | 7 | 11 | 7 |
| mixed (shape + raphe + stria) **** | 24 | 18 | 14 | 16 | 21 | 12 |
| (valves counted) | (401) | (400) | (401) | (229) | (243) | (189) |
© 2019 by the authors. Licensee MDPI, Basel, Switzerland. This article is an open access article distributed under the terms and conditions of the Creative Commons Attribution (CC BY) license (http://creativecommons.org/licenses/by/4.0/).
Share and Cite
Kim Tiam, S.; Lavoie, I.; Liu, F.; Hamilton, P.B.; Fortin, C. Diatom Deformities and Tolerance to Cadmium Contamination in Four Species. Environments 2019, 6, 102. https://doi.org/10.3390/environments6090102
Kim Tiam S, Lavoie I, Liu F, Hamilton PB, Fortin C. Diatom Deformities and Tolerance to Cadmium Contamination in Four Species. Environments. 2019; 6(9):102. https://doi.org/10.3390/environments6090102
Chicago/Turabian StyleKim Tiam, Sandra, Isabelle Lavoie, Fengjie Liu, Paul B. Hamilton, and Claude Fortin. 2019. "Diatom Deformities and Tolerance to Cadmium Contamination in Four Species" Environments 6, no. 9: 102. https://doi.org/10.3390/environments6090102
APA StyleKim Tiam, S., Lavoie, I., Liu, F., Hamilton, P. B., & Fortin, C. (2019). Diatom Deformities and Tolerance to Cadmium Contamination in Four Species. Environments, 6(9), 102. https://doi.org/10.3390/environments6090102


