Changing Climatic Factors Favor Dengue Transmission in Lahore, Pakistan

 ,
, 
 and
and
Abstract
:1. Introduction
Statement of the Problem
2. Materials and Methods
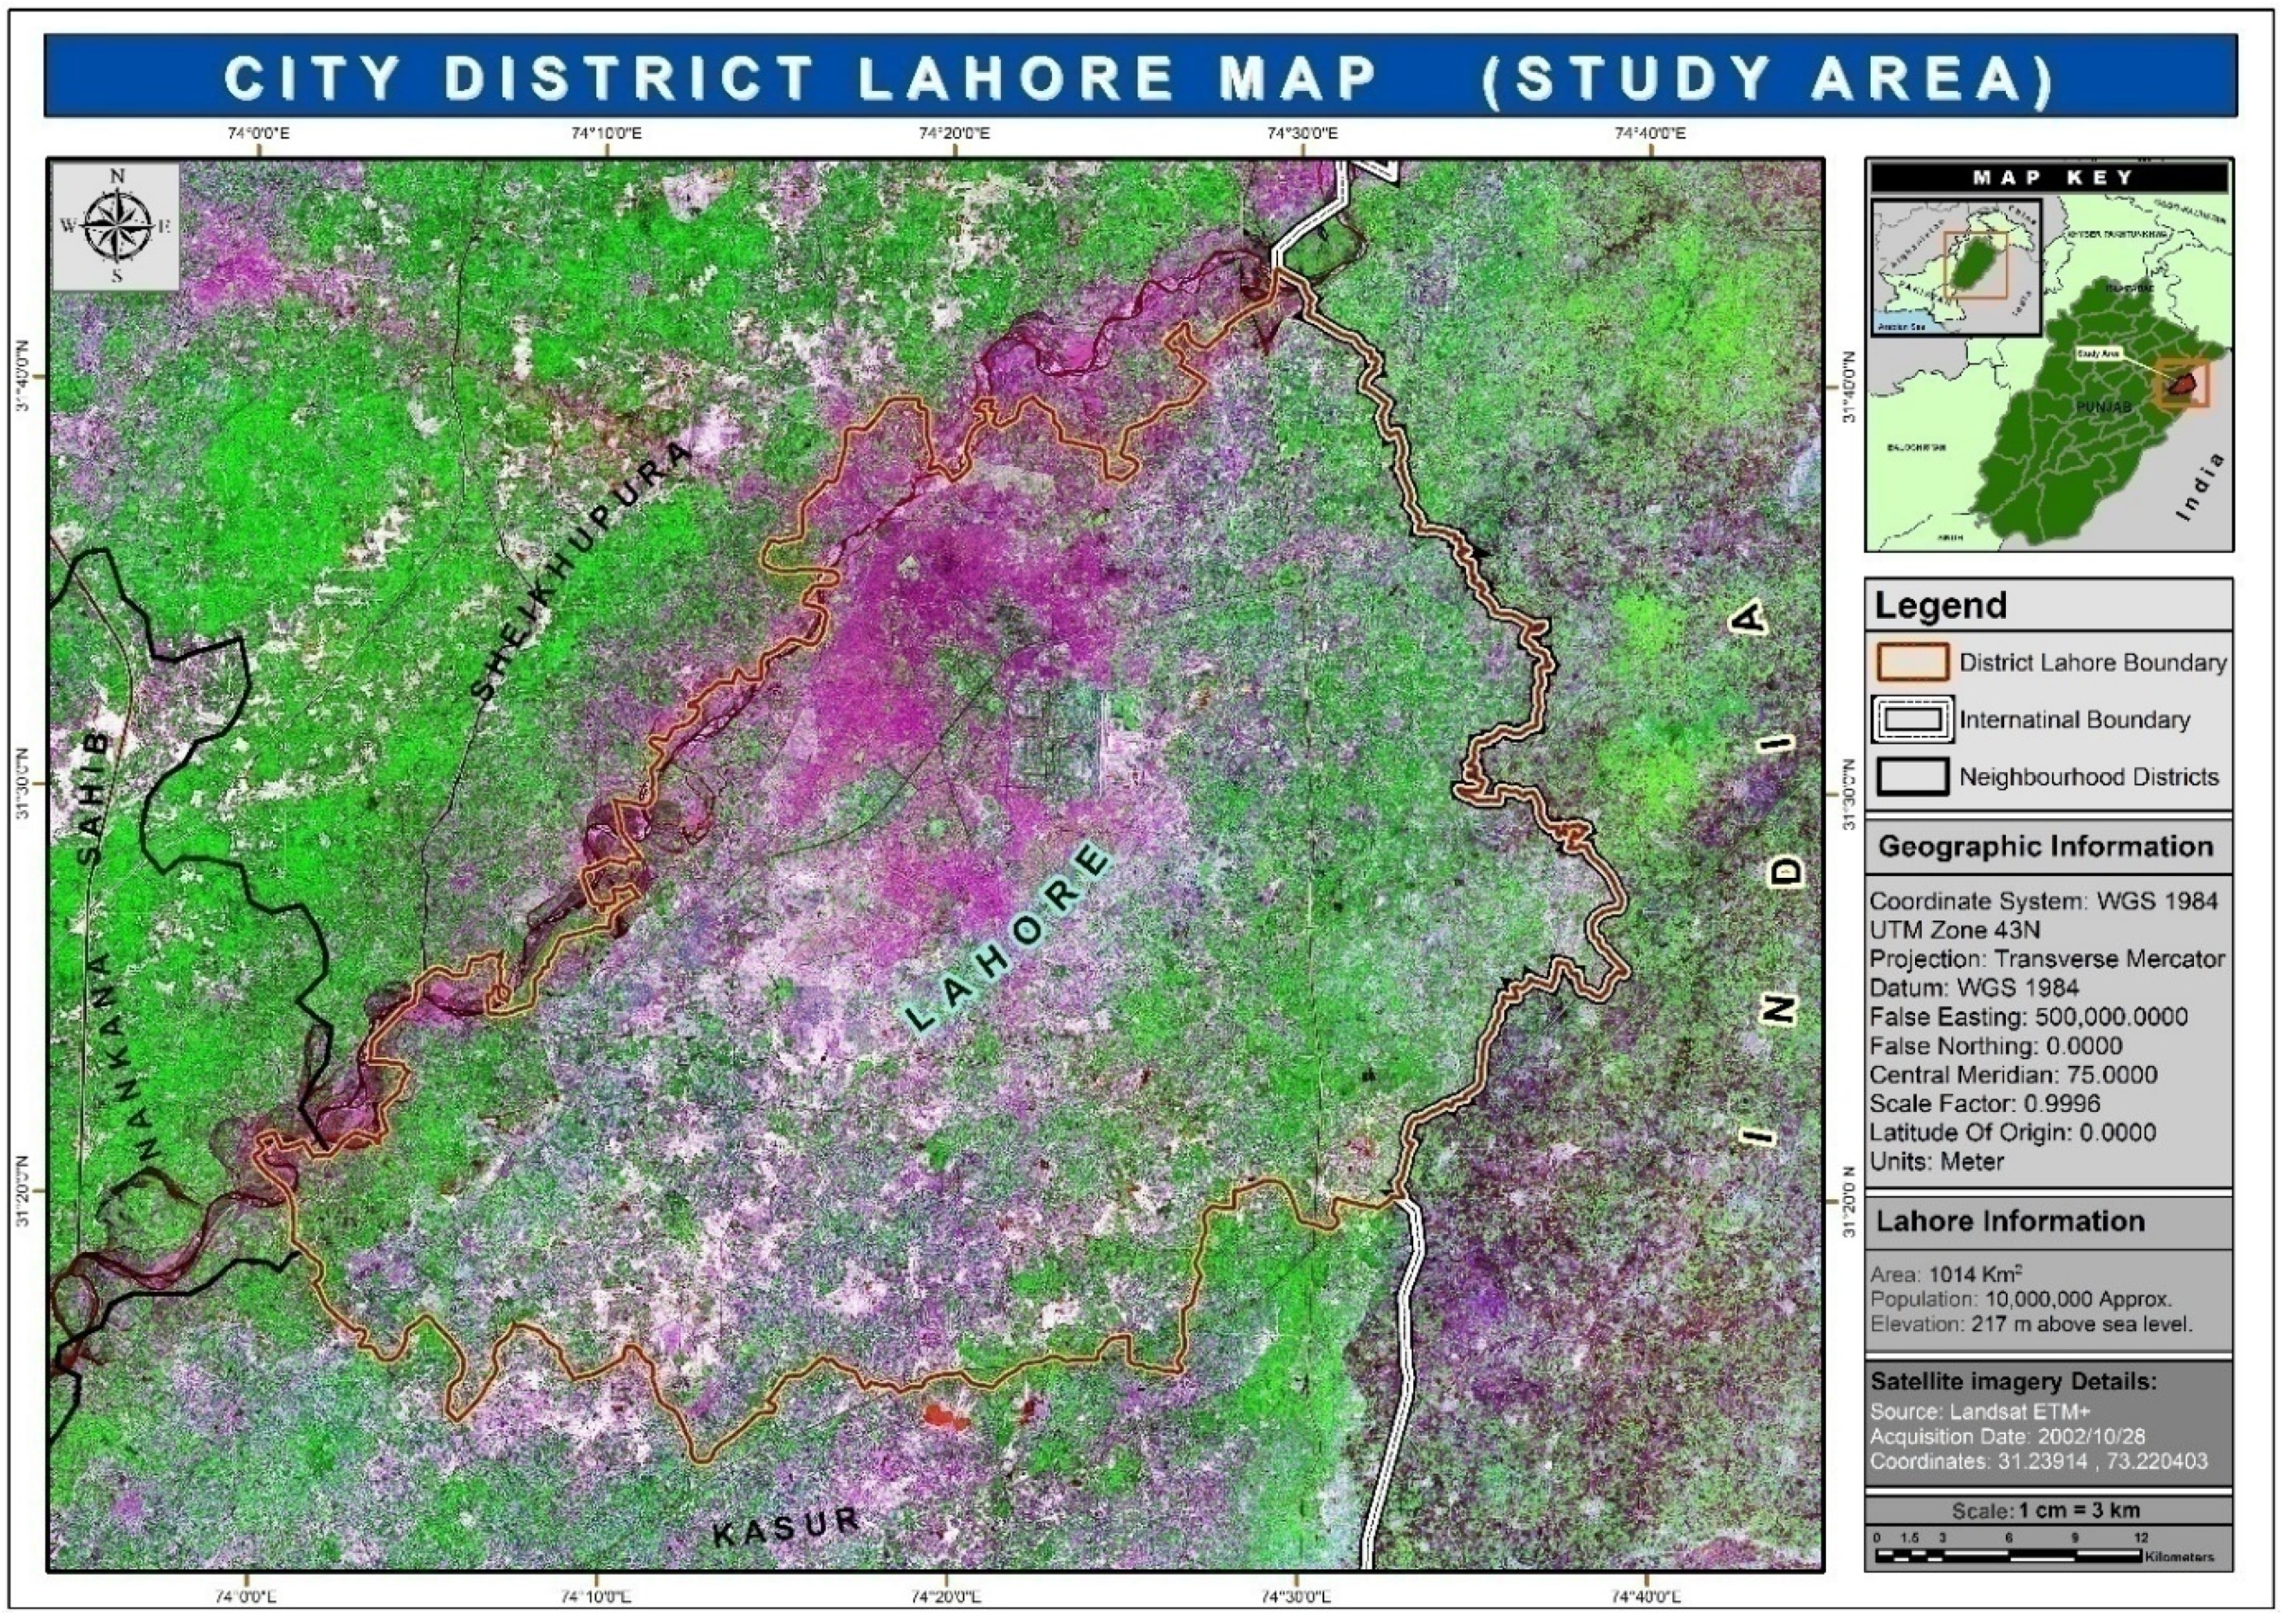
2.1. Study Area
2.2. Data and Statistical Approaches
3. Results
3.1. Climate Change in Lahore (1970–2012)
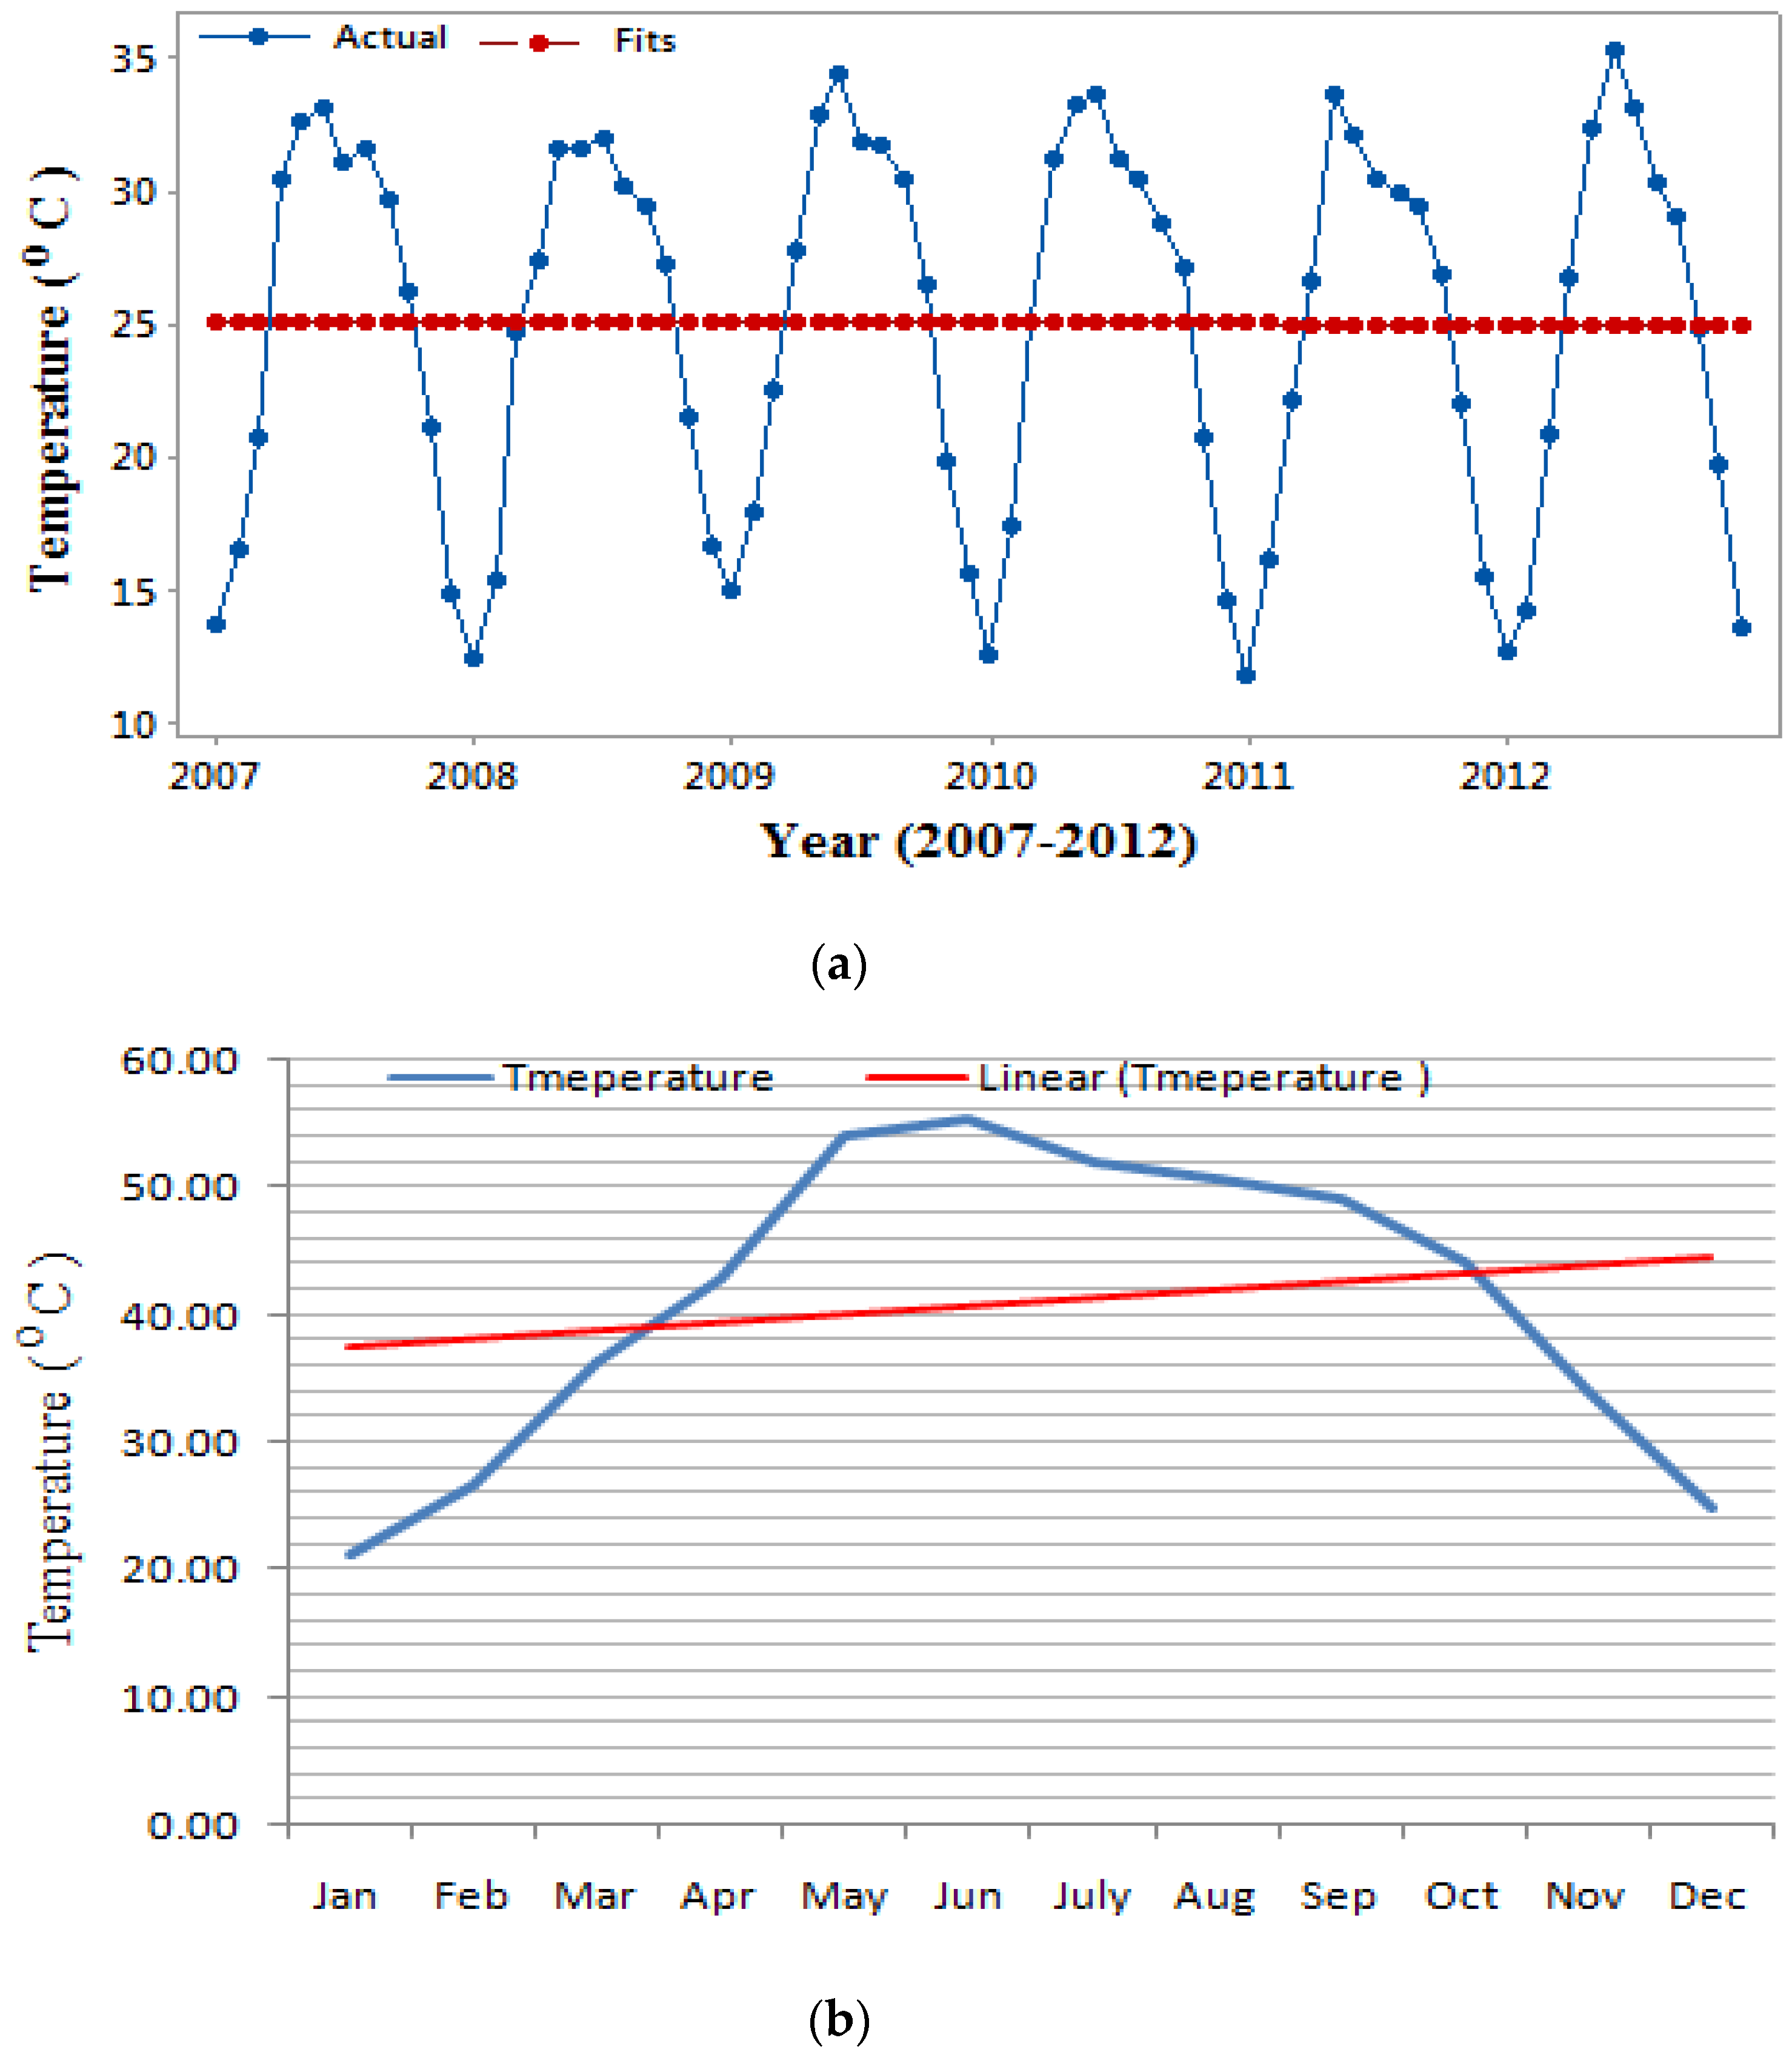
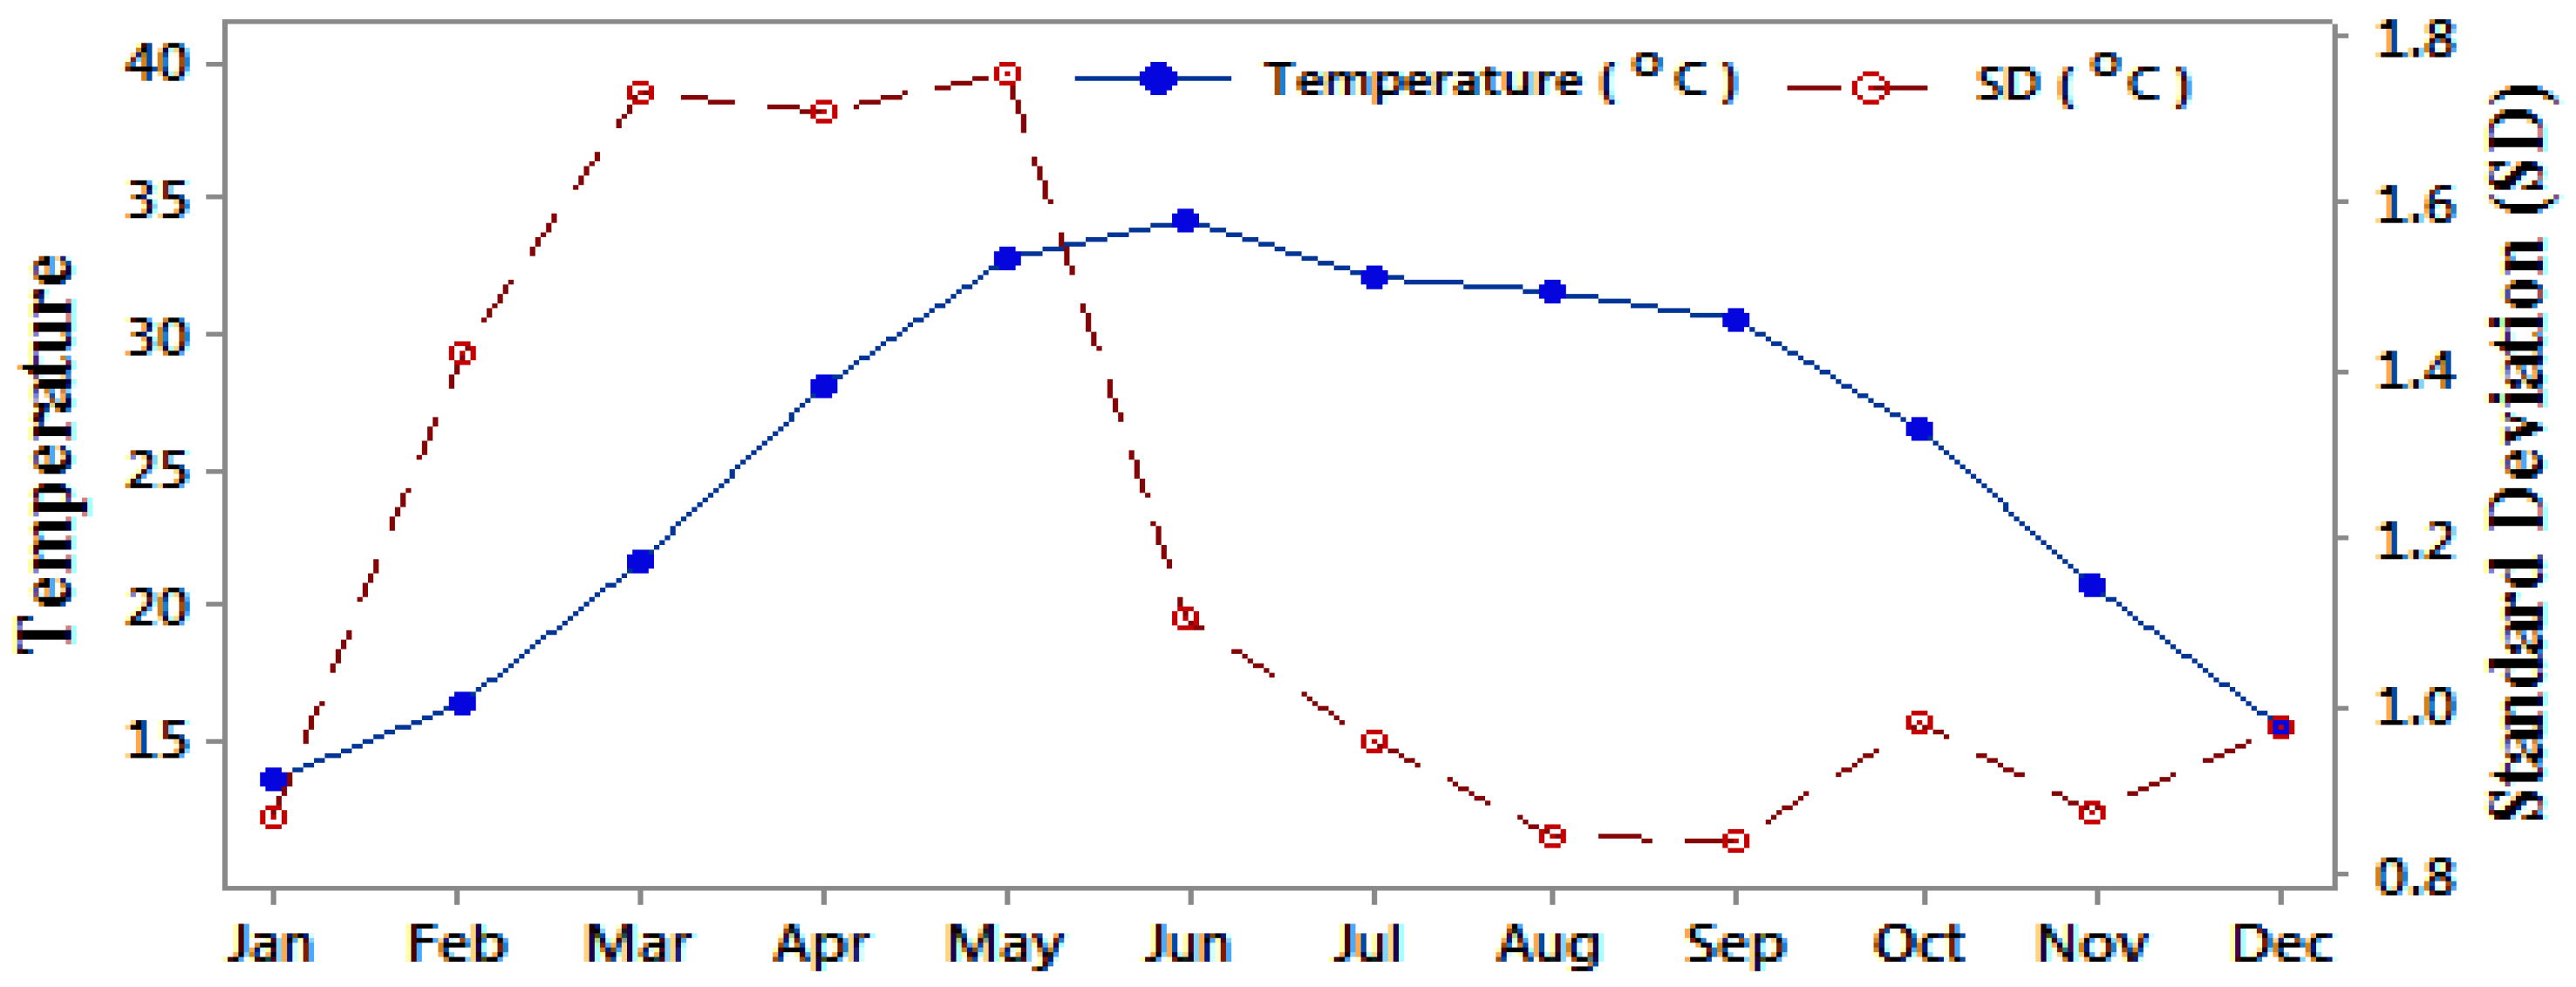
3.1.1. Temperature
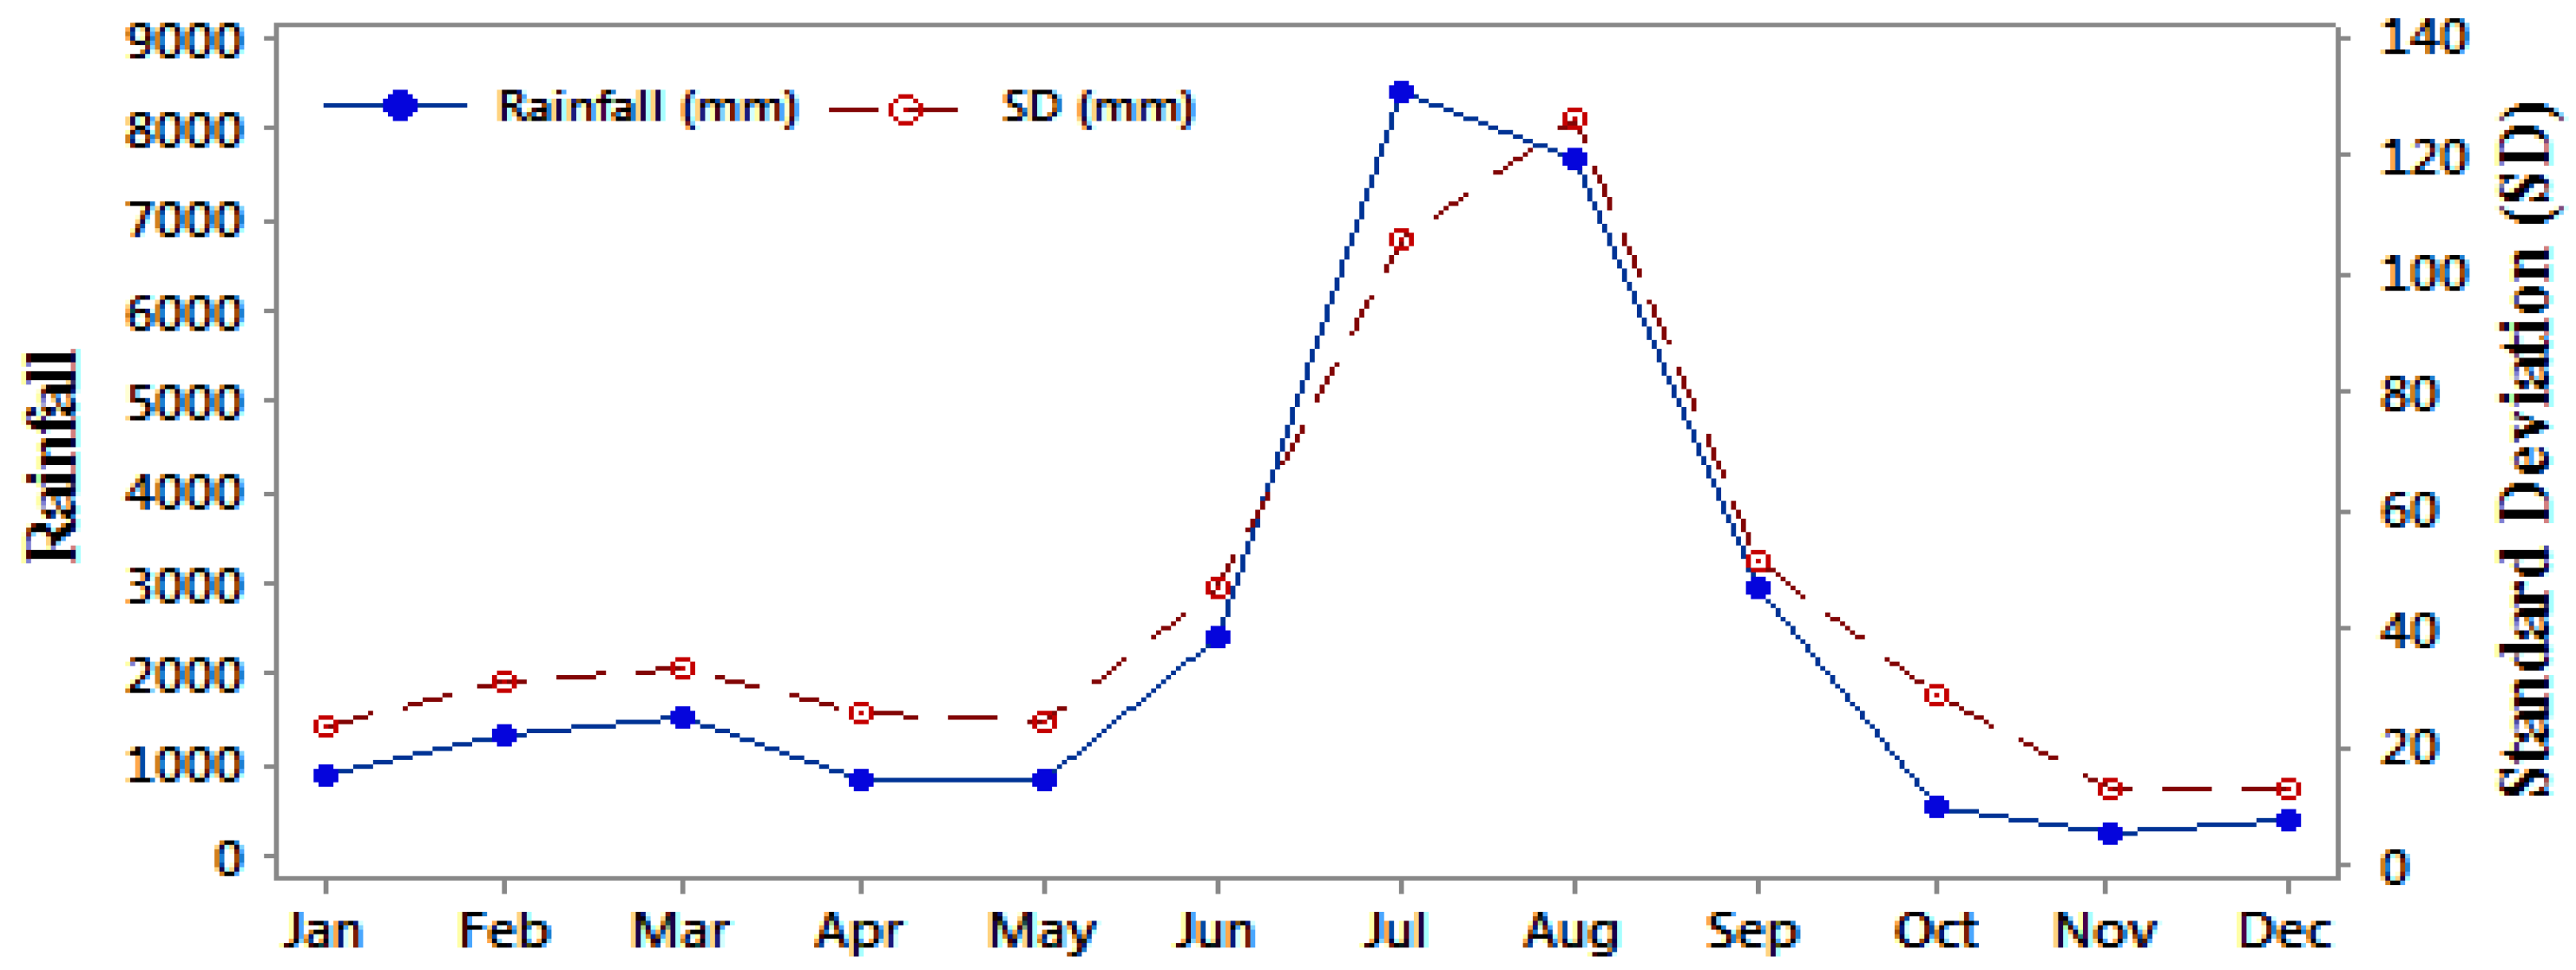
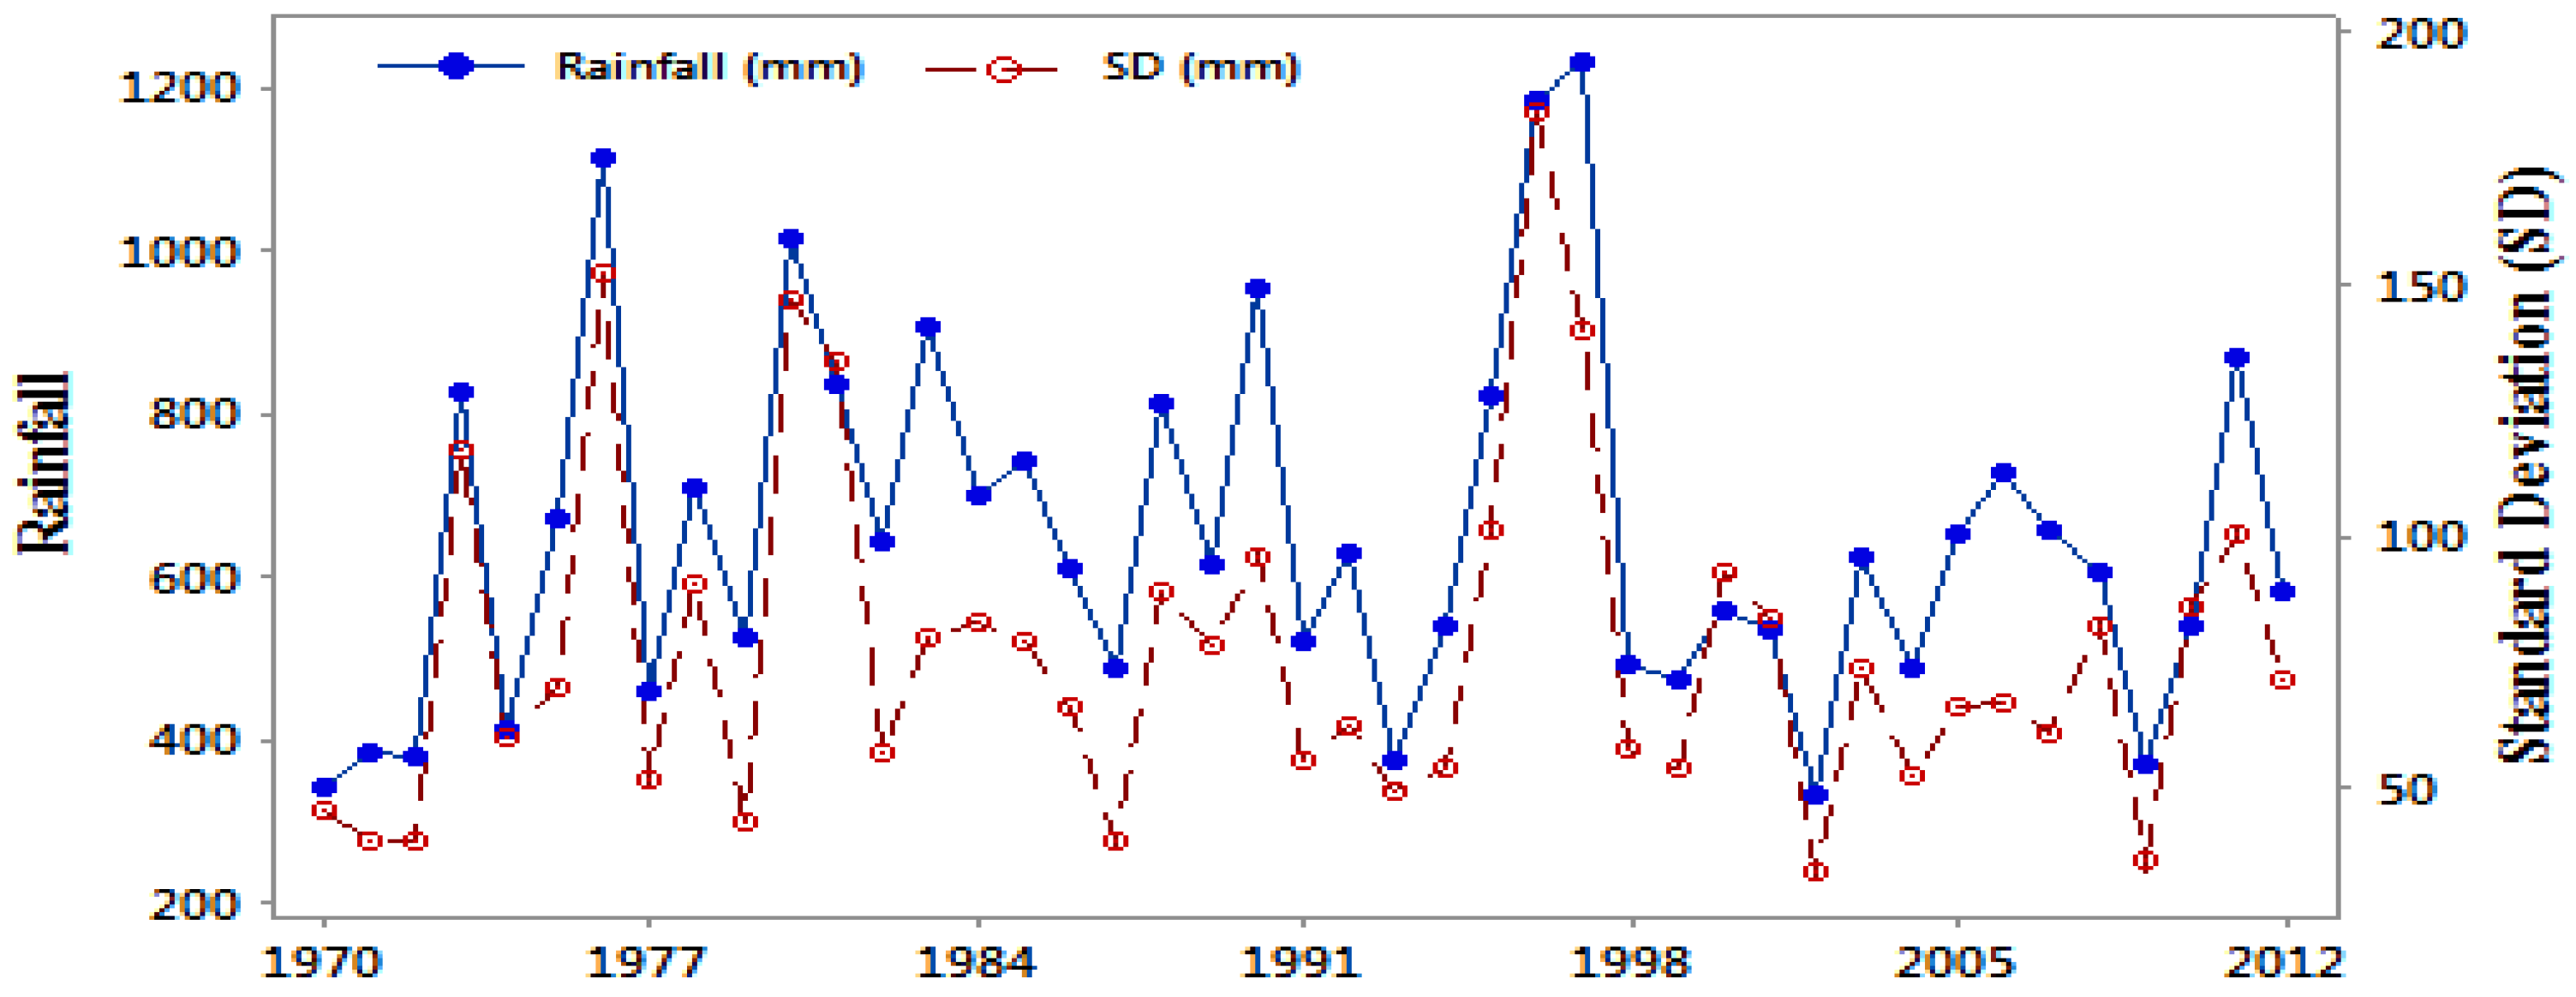
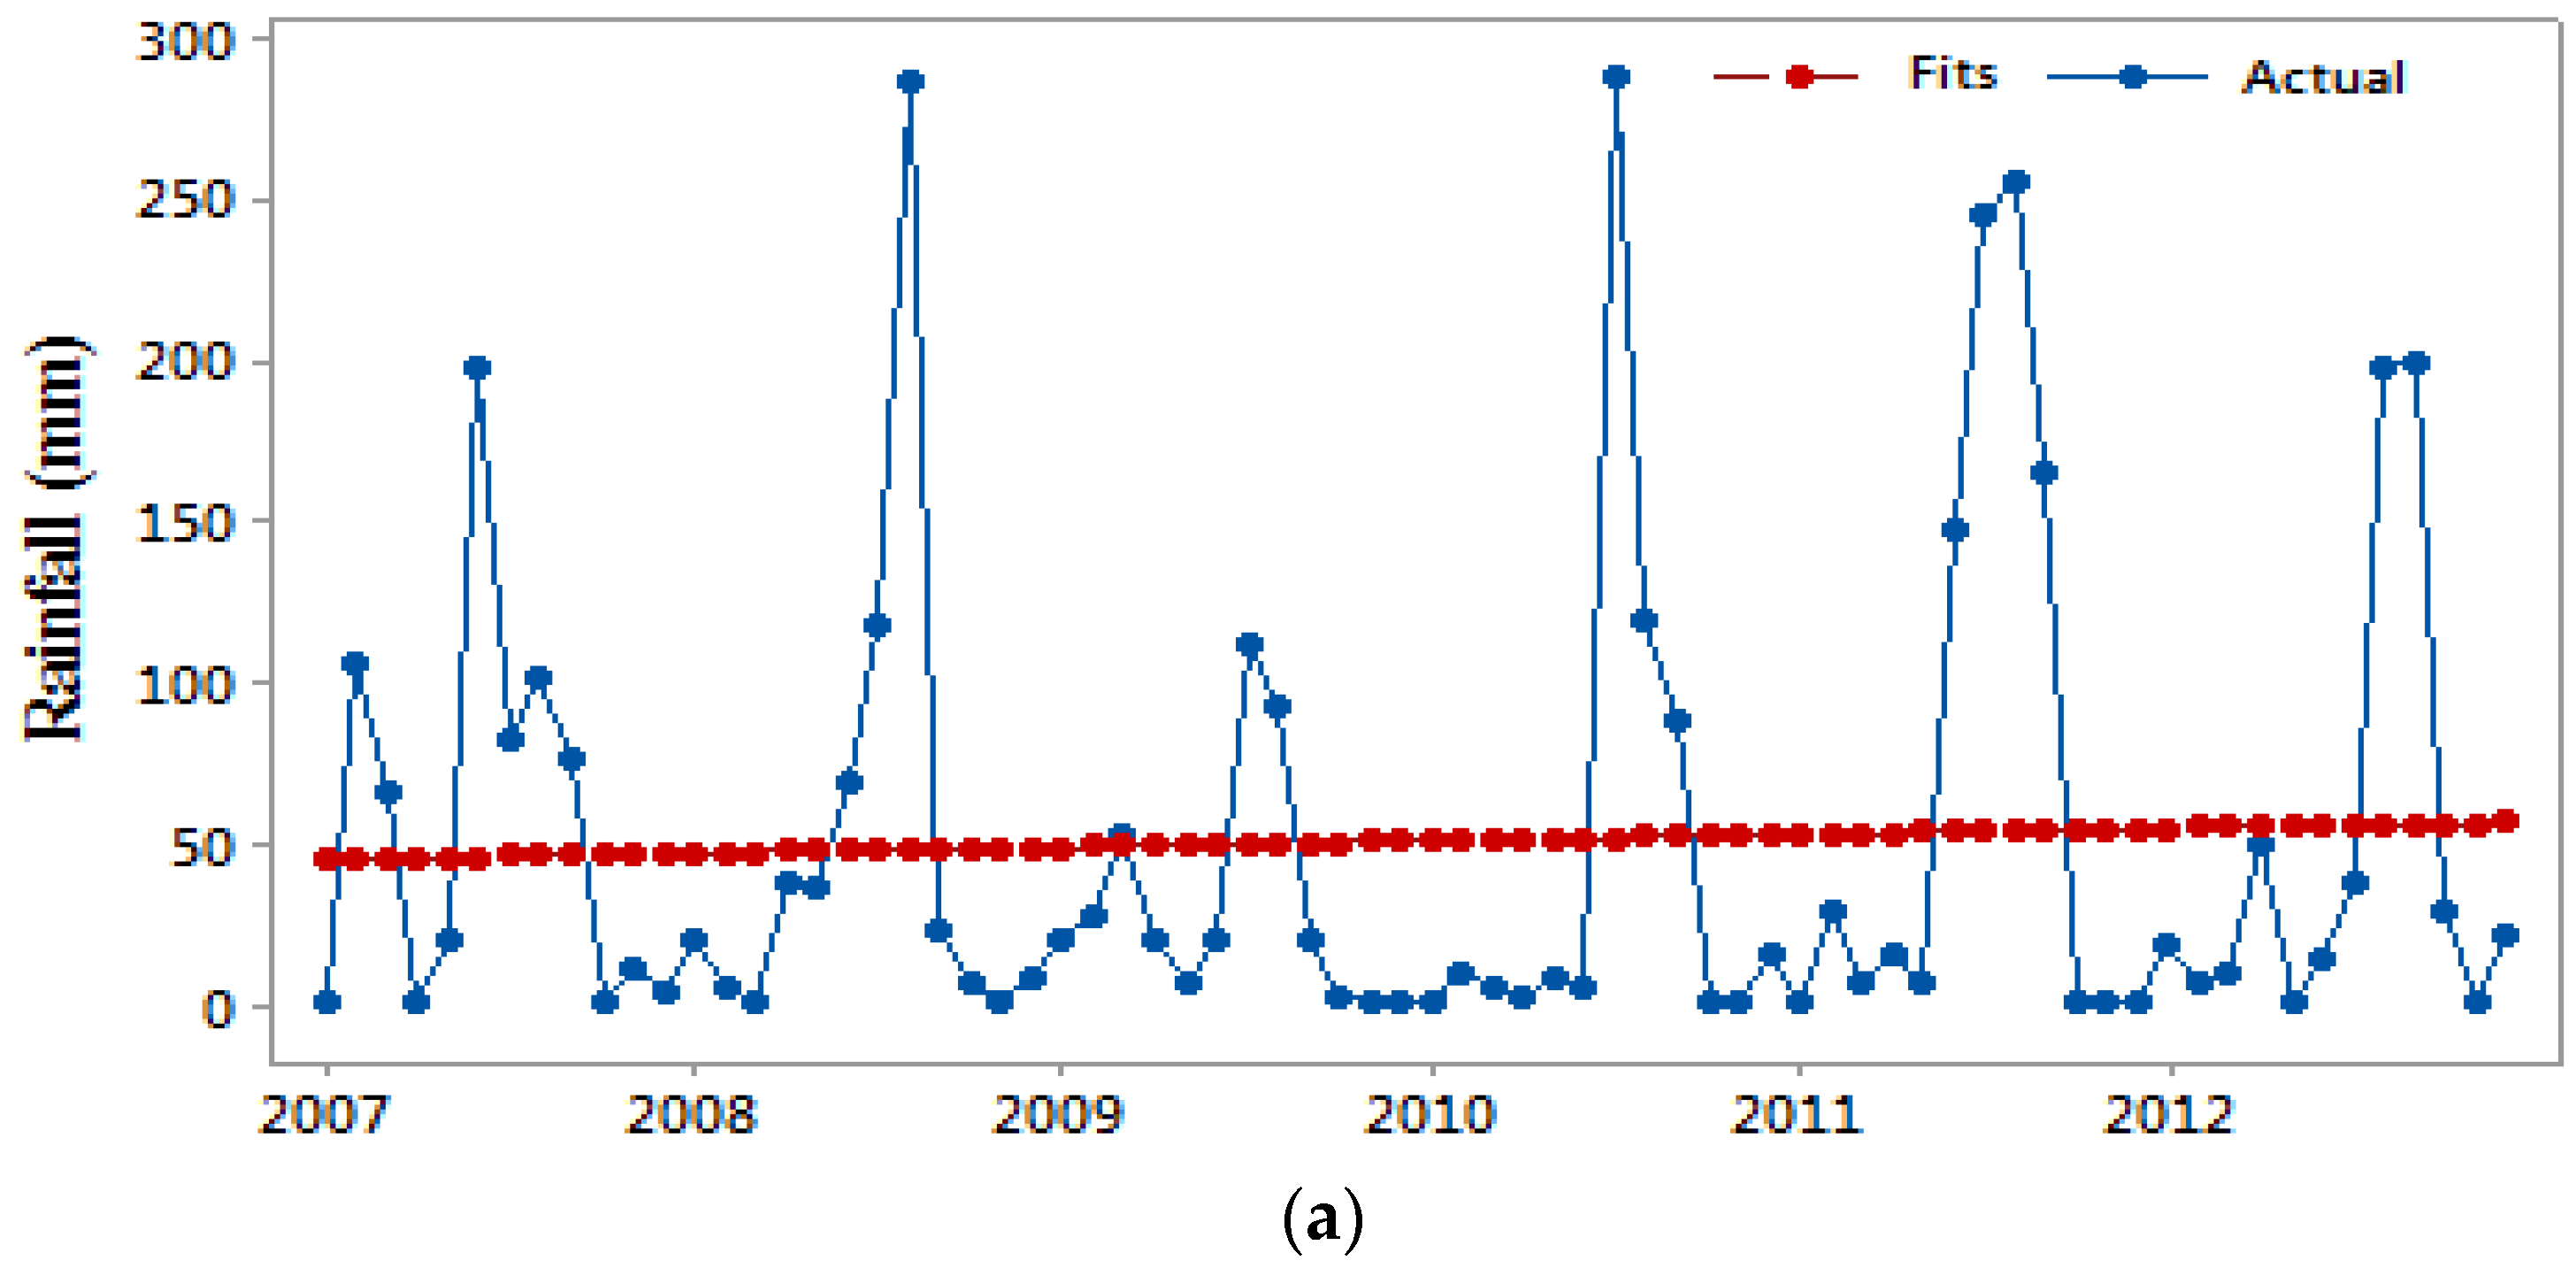
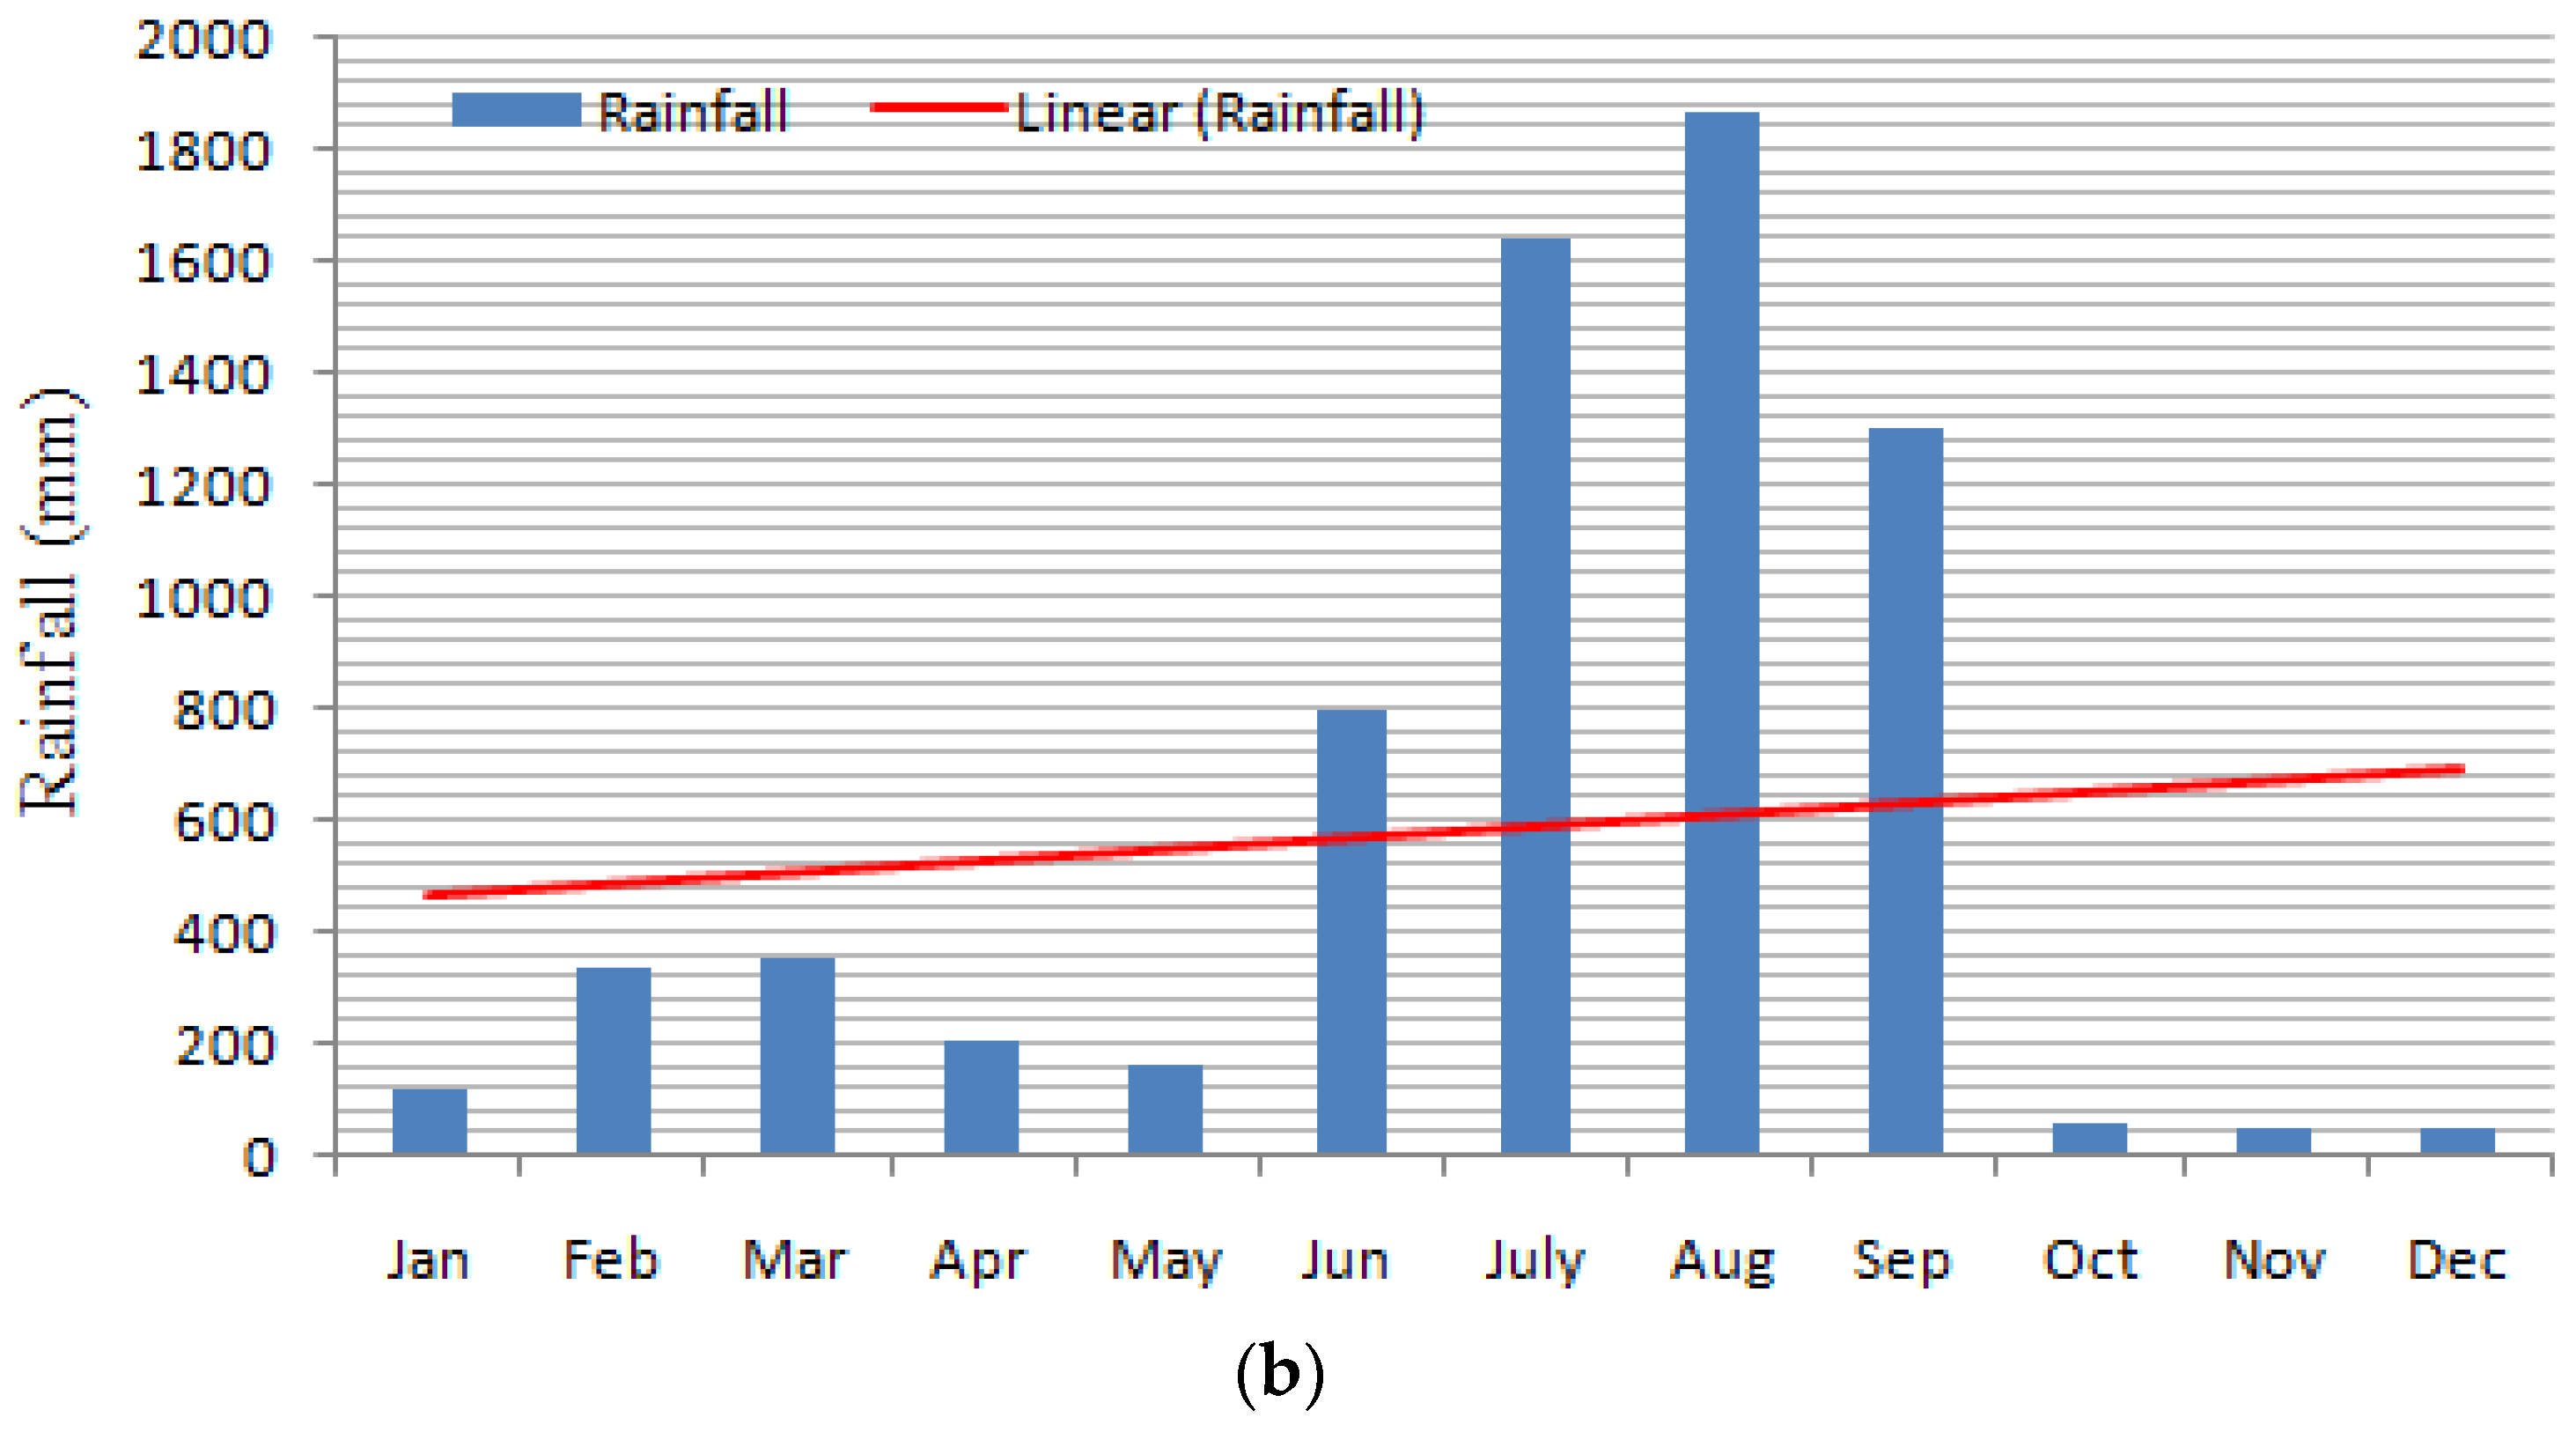
3.1.2. Rainfall
3.2. Climatic Factors vs. DF; Time Series Analysis
3.3. Impact of Climate Variables on DF
4. Discussion
5. Conclusions
- The annual and monthly mean temperatures increased to 25.07 °C with a standard deviation of 7.074. The rainfall also increased annually but decreased monthly from 1970–2012.
- During 2007–2012, the monthly total rainfall increased, while means of the monthly temperature decreased and dengue cases increased, respectively.
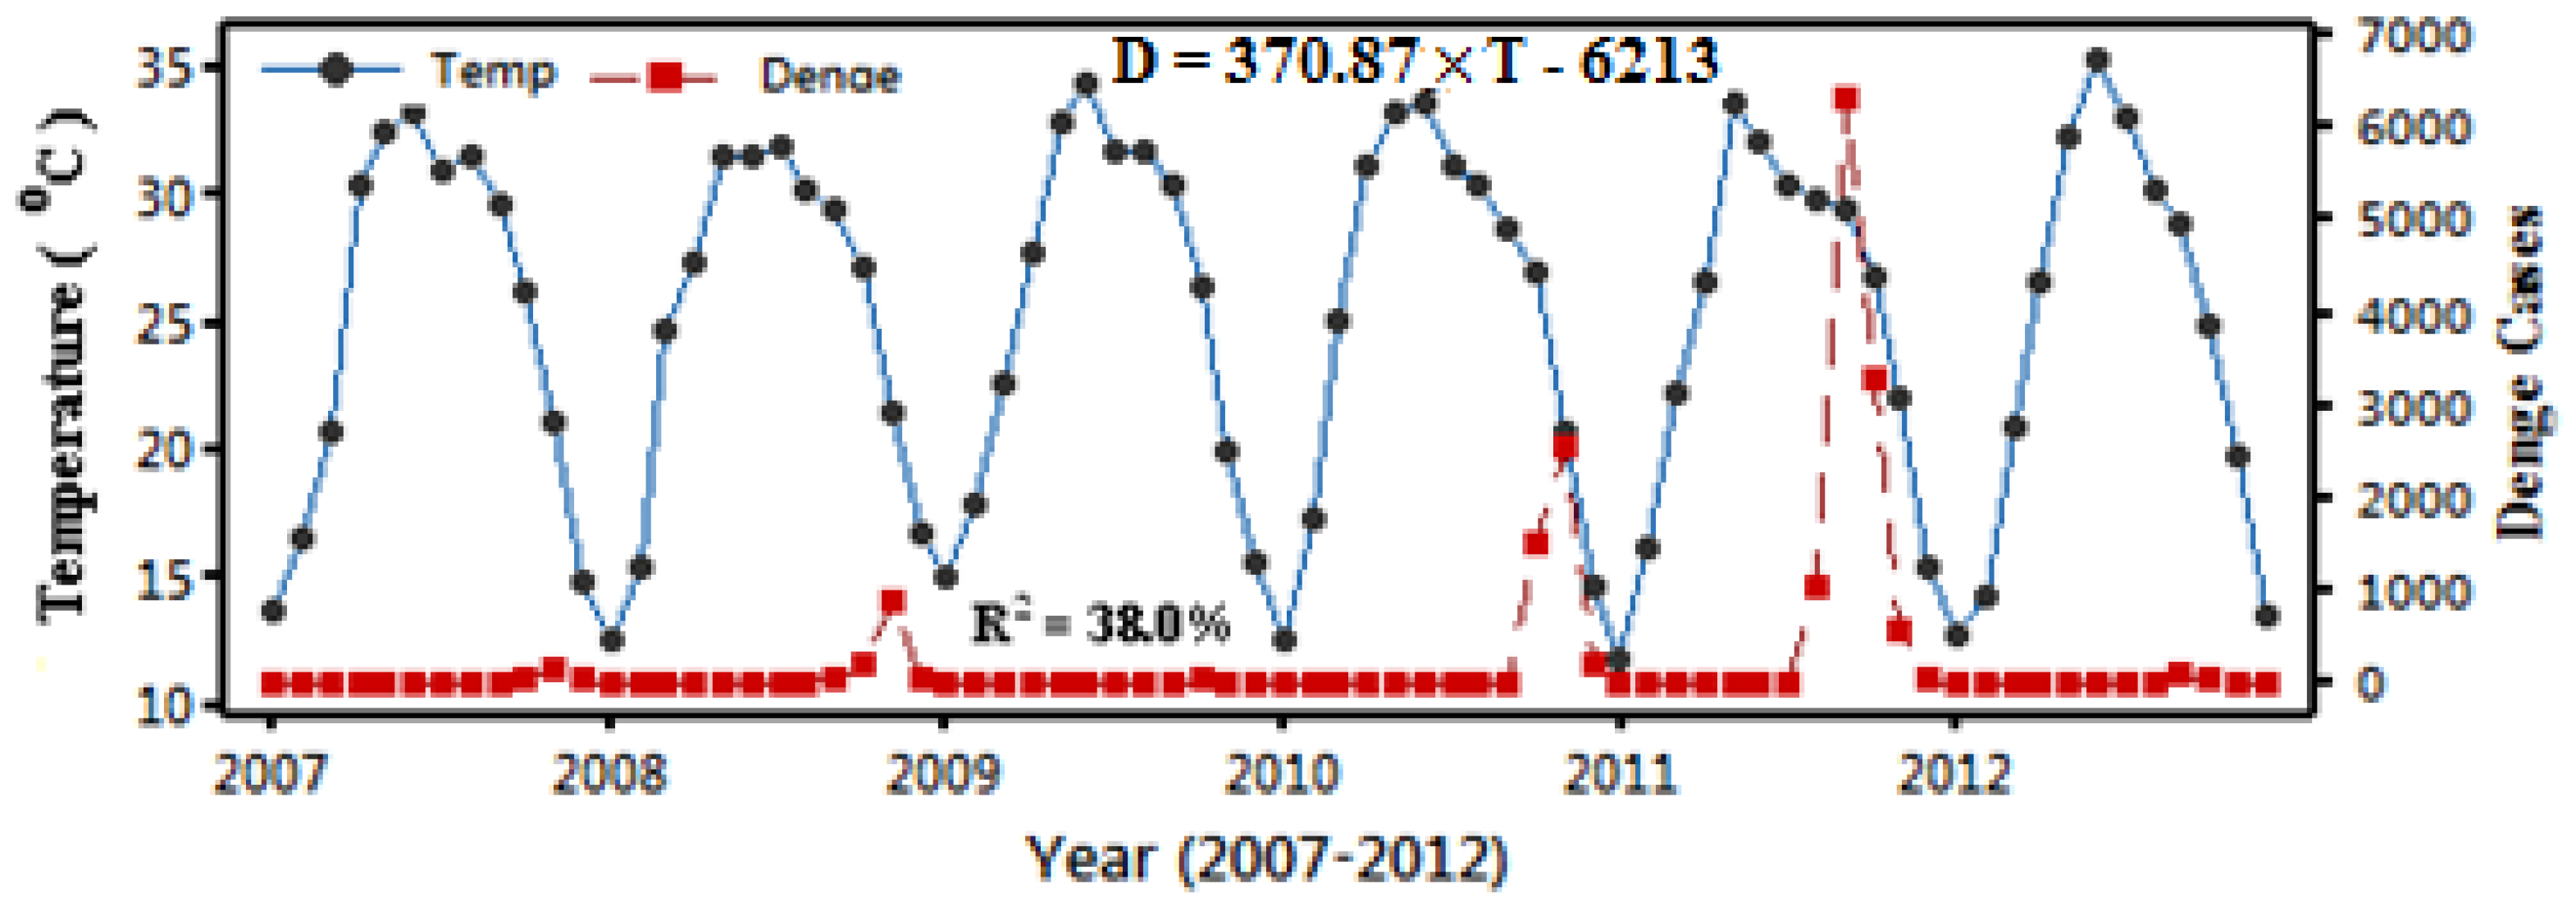
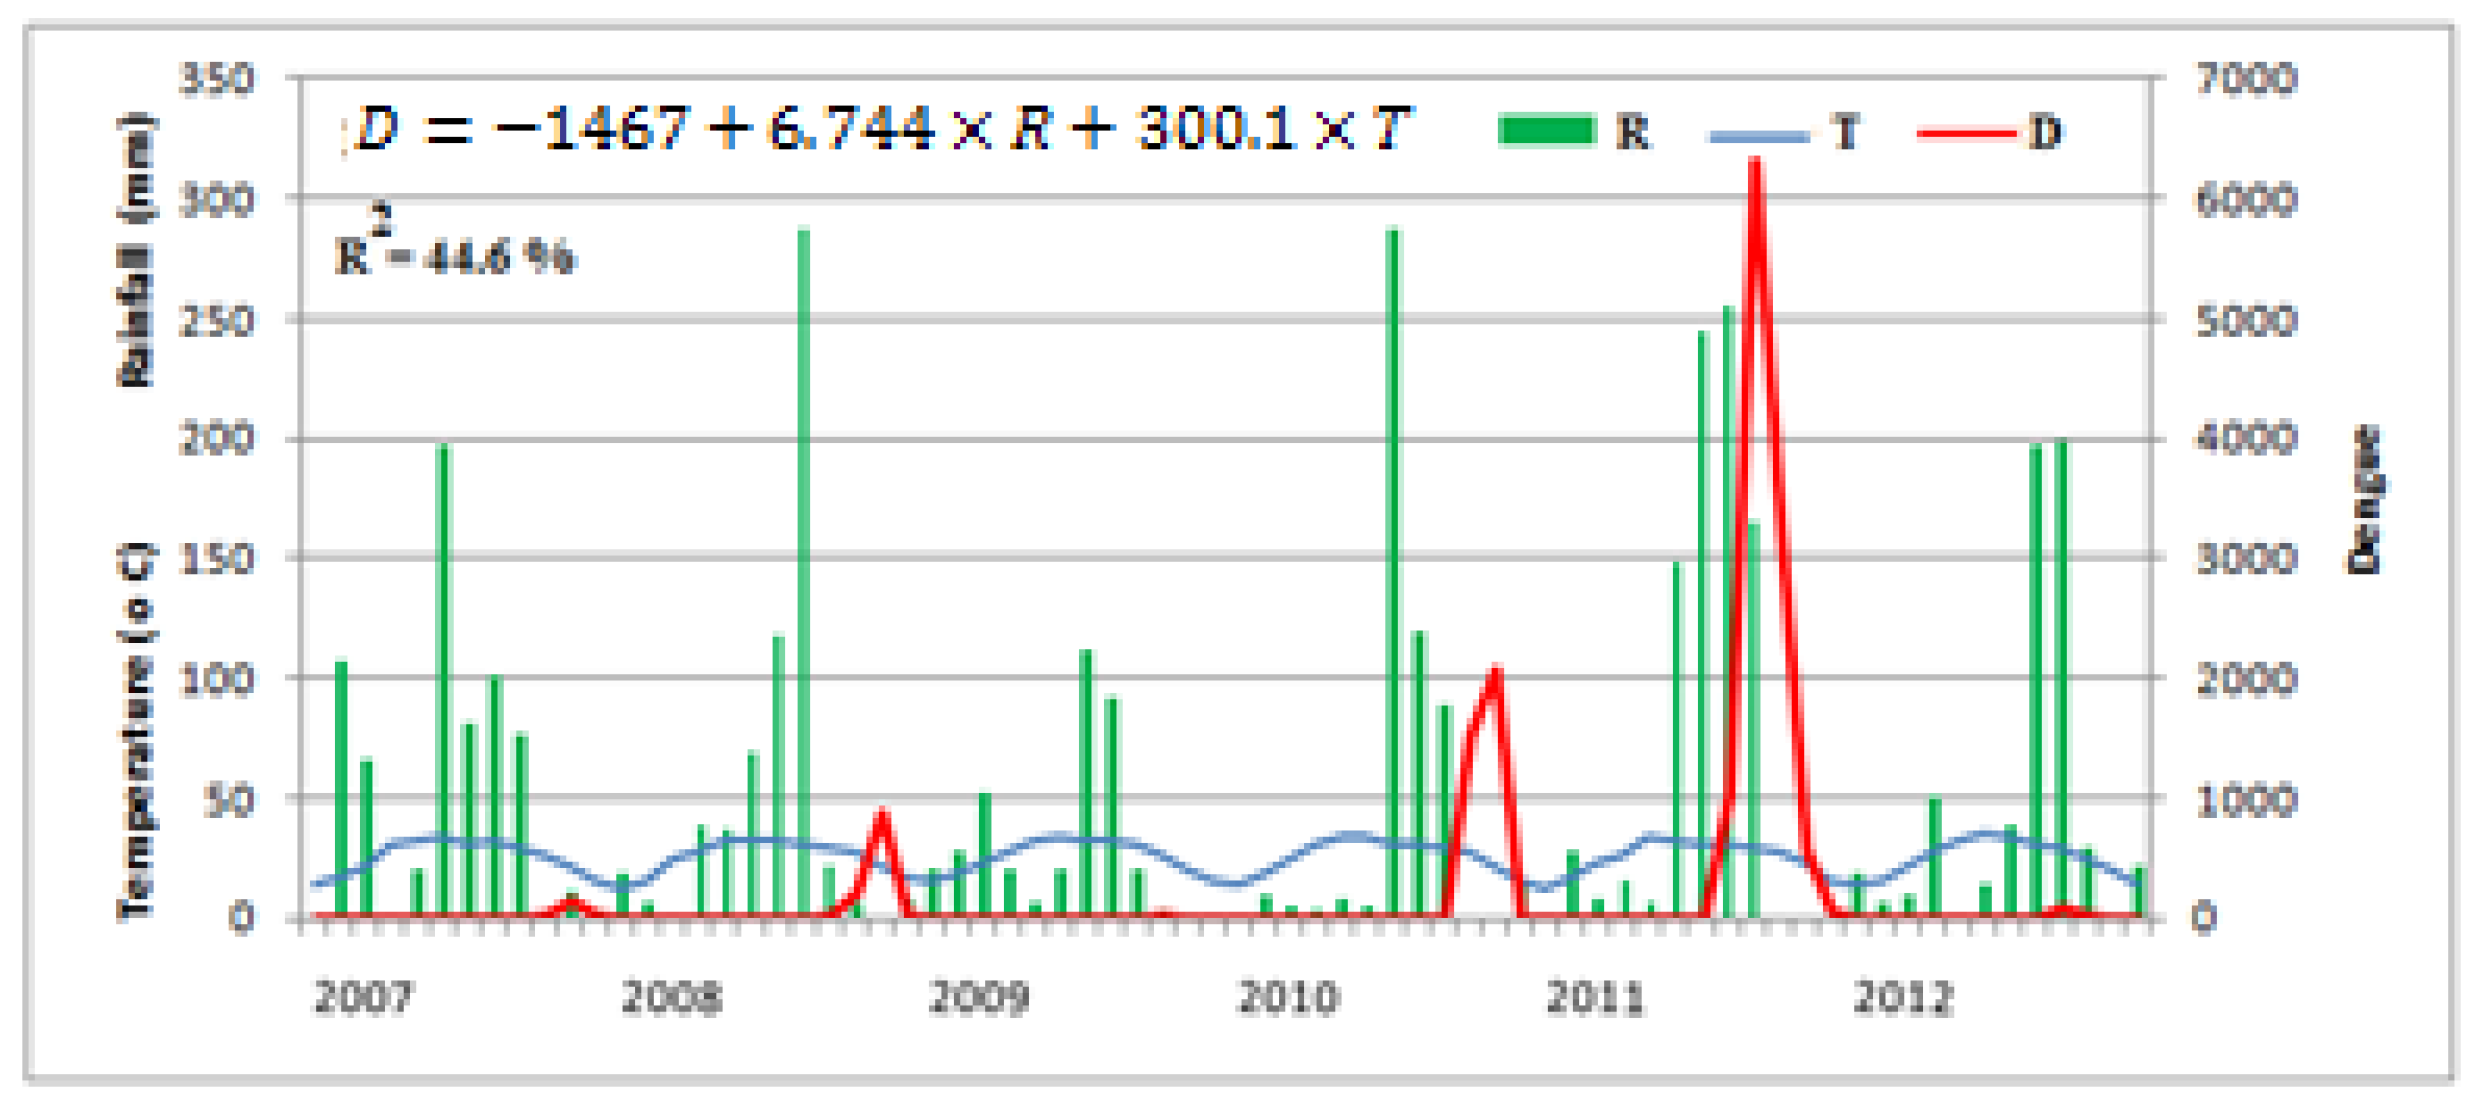
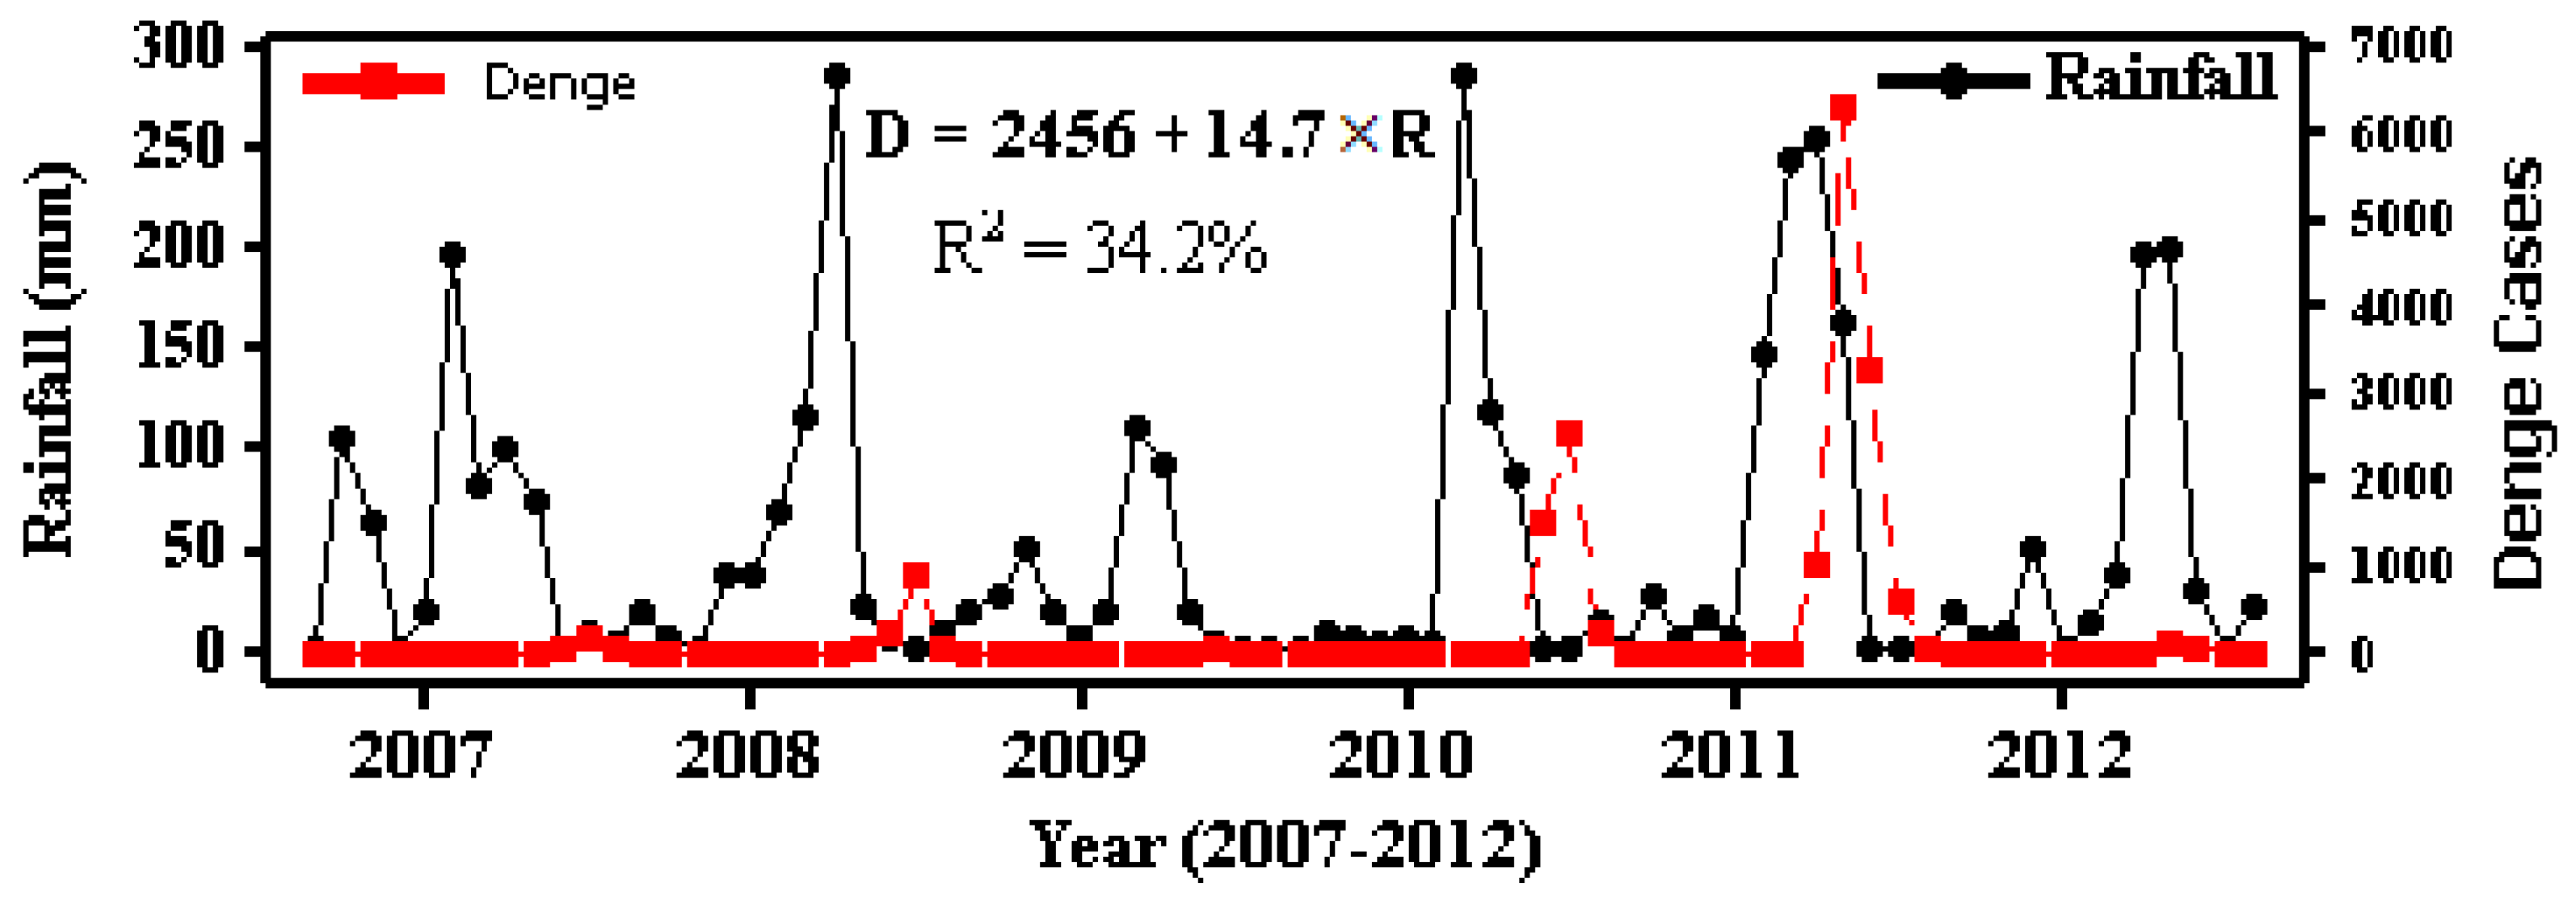
- Events of maximum total rainfall were recorded (2007–2012) during 2008, 2010, 2011, and the maximum dengue cases occurred during the years 2010 and 2011, as shown in Figure 8a,b. The climatic factors, especially temperature and rainfall, affect several regions of the world, i.e., the environmental as well as the health sector. It is also known that rainfall provides a medium for the aquatic stages of the dengue mosquito’s life cycle, while, in addition, the temperature provides optimum conditions for mosquitos to breed and multiply. The significance of analysis revealed that the incidence of the high peaks of dengue case was after the monsoon season in every year, and the climatic event, i.e., rainfall, occurred earlier than dengue incidence, as shown in Figure 8c.
- The results of ordinary linear and multiple regression analyses reveal a good relationship between dengue cases and climate variables; if rainfall increased then dengue cases also increased with a model accuracy of 34.2%. Dengue incidence also increased when the mean monthly temperature increased. Moreover, multiple regression also indicated a positive relationship between climatic factors and dengue cases, i.e., 44.6%. This model showed a significant increase in dengue when the temperature and rainfall increased.
- If we further increase the number of climatic factors, i.e., humidity, sunshine, and emissions (environmental factors), then the model will be improved.
Author Contributions
Funding
Acknowledgments
Conflicts of Interest
References
- Shrivastava, S.R.; Shrivastava, P.S.; Ramasamy, J. Taking major strides in dengue vaccine research: World health organization. Ann. Trop. Med. Public Health 2017, 10, 743. [Google Scholar] [CrossRef]
- Khormi, H.M.; Kumar, L. Modeling dengue fever risk based on socioeconomic parameters, nationality and age groups: GIS and remote sensing based case study. Sci. Total Environ. 2011, 409, 4713–4719. [Google Scholar] [CrossRef] [PubMed]
- Sam, J.E.; Gee, T.S.; Wahab, N.A. Fatal intracranial hemorrhage in a patient with severe dengue fever. Asian J. Neurosurg. 2018, 13, 56. [Google Scholar] [CrossRef] [PubMed]
- Bhatt, S.; Gething, P.W.; Brady, O.J.; Messina, J.P.; Farlow, A.W.; Moyes, C.L.; Drake, J.M.; Brownstein, J.S.; Hoen, A.G.; Sankoh, O. The global distribution and burden of dengue. Nature 2013, 496, 504. [Google Scholar] [CrossRef] [PubMed]
- WHO. Technical Handbook for Dengue Surveillance, Outbreak Prediction/Detection and Outbreak Response; World Health Organization: Geneva, Switzerland, 2016. [Google Scholar]
- Halstead, S.B. Dengue. Lancet 2007, 370, 1644–1652. [Google Scholar] [CrossRef]
- Li, S.; Fang, M.; Zhou, B.; Ni, H.; Shen, Q.; Zhang, H.; Han, Y.; Yin, J.; Chang, W.; Xu, G. Simultaneous detection and differentiation of dengue virus serotypes 1–4, Japanese encephalitis virus, and West Nile virus by a combined reverse-transcription loop-mediated isothermal amplification assay. Virol. J. 2011, 8, 360. [Google Scholar] [CrossRef] [PubMed]
- Pasteur, S. Dengue Vaccine Registered in 19 Countries. Available online: http://dengue.info/dengue-vaccine-registered-in-19-countries/ (accessed on 2 March 2018).
- WHO. WHO Advises Dengvaxia be used only in People Previously Infected with Dengue. Available online: http://www.who.int/medicines/news/2017/WHO-advises-dengvaxia-used-only-in-people-previously-infected/en/ (accessed on 5 February 2019).
- Olliaro, P.; Fouque, F.; Kroeger, A.; Bowman, L.; Velayudhan, R.; Santelli, A.C.; Garcia, D.; Ramm, R.S.; Sulaiman, L.H.; Tejeda, G.S. Improved tools and strategies for the prevention and control of arboviral diseases: A research-to-policy forum. PLoS Negl. Trop. Dis. 2018, 12, e0005967. [Google Scholar] [CrossRef] [PubMed]
- Knapp, A.K.; Ciais, P.; Smith, M.D. Reconciling inconsistencies in precipitation–productivity relationships: Implications for climate change. New Phytol. 2017, 214, 41–47. [Google Scholar] [CrossRef]
- Banwell, N.; Rutherford, S.; Mackey, B.; Street, R.; Chu, C. Commonalities between disaster and climate change risks for health: A theoretical framework. Int. J. Environ. Res. Public Health 2018, 15, 538. [Google Scholar] [CrossRef]
- Li, C.; Lu, Y.; Liu, J.; Wu, X. Climate change and dengue fever transmission in China: Evidences and challenges. Sci. Total Environ. 2018, 622, 493–501. [Google Scholar] [CrossRef]
- Duarte, J.L.; Diaz-Quijano, F.A.; Batista, A.C.; Giatti, L.L. Climatic variables associated with dengue incidence in a city of the Western Brazilian Amazon region. Rev. Soc. Bras. Med. Trop. 2019, 52. [Google Scholar] [CrossRef] [PubMed]
- Choi, Y.; Tang, C.S.; McIver, L.; Hashizume, M.; Chan, V.; Abeyasinghe, R.R.; Iddings, S.; Huy, R. Effects of weather factors on dengue fever incidence and implications for interventions in Cambodia. BMC Public Health 2016, 16, 241. [Google Scholar] [CrossRef] [PubMed]
- Zameer, M.; Ashraf, A.; Mukhtar, N.; Ahmad, B.M. Knowledge, attitudes and practices study of dengue viral infection and its association with environmental factors and health issues, Lahore Pakistan. Afr. J. Environ. Sci. Tech. 2013, 7, 711–717. [Google Scholar]
- Gatrell, A.C.; Elliott, S.J. Geographies of Health: An Introduction, 2nd ed.; Wiley-Blackwell: Hoboken, NJ, USA, 2009. [Google Scholar]
- Hii, Y.L.; Rocklöv, J.; Ng, N.; Tang, C.S.; Pang, F.Y.; Sauerborn, R. Climate variability and increase in intensity and magnitude of dengue incidence in Singapore. Glob. Health Action 2009, 2, 2036. [Google Scholar] [CrossRef] [PubMed]
- Jury, M.R. Climate influence on dengue epidemics in Puerto Rico. Int. J. Environ. Health Res. 2008, 18, 323–334. [Google Scholar] [CrossRef] [PubMed]
- Ahmad, T.; Khan, N.A.; Rehman, M.M.U.; Jadoon, M.A. A story of the disease free area to high endemic. Bull. Environ. Pharmacol. Life Sci. 2014, 3, 1–4. [Google Scholar]
- Chan, Y.; Salahuddin, N.; Khan, J.; Tan, H.; Seah, C.; Li, J.; Chow, V. Dengue haemorrhagic fever outbreak in Karachi, Pakistan, 1994. Trans. R. Soc. Trop. Med. Hyg. 1995, 89, 619–620. [Google Scholar] [CrossRef]
- Jamil, B.; Hasan, R.; Zafar, A.; Bewley, K.; Chamberlain, J.; Mioulet, V.; Rowlands, M.; Hewson, R. Dengue virus serotype 3, Karachi, Pakistan. Emerg. Infect. Dis. 2007, 13, 182. [Google Scholar] [CrossRef]
- Mukhtar, F.; Salim, M.; Farooq, A. Outbreak of dengue fever in Lahore: study of risk factors. J. Ayub Med. Coll. Abbottabad 2012, 24, 99–101. [Google Scholar]
- WHO. Weekly Epidemiological Monitor. In Current Major Event: Dengue in Pakistan; World Health Organization: Cairo, Egypt, 2012; Volume 5. [Google Scholar]
- Khanani, M.R.; Arif, A.; Shaikh, R. Dengue in Pakistan: Journey from a disease free to a hyper endemic nation. Ed. Board 2011, 5, 81. [Google Scholar]
- WHO. Weekly Epidemiological Bulletin. In Disease Early Warning System and Response in Pakistan; World Health Organization: Islamabad, Pakistan, 2013; Volume 4. [Google Scholar]
- Sajjad, S.; Shirazi, S.A.; Ahmed Khan, M.; Raza, A. Urbanization effects on temperature trends of Lahore during 1950–2007. Int. J. Clim. Chang. Strategies Manag. 2009, 1, 274–281. [Google Scholar] [CrossRef]
- Brady, O.J.; Golding, N.; Pigott, D.M.; Kraemer, M.U.G.; Messina, J.P.; Reiner, R.C., Jr.; Scott, T.W.; Smith, D.L.; Gething, P.W.; Hay, S.I. Global temperature constraints on Aedes aegypti and Ae. albopictus persistence and competence for dengue virus transmission. Parasit. Vectors 2014, 7, 338. [Google Scholar] [CrossRef] [PubMed]
- Muhammad, A.M.; Zhonghua, T.; Dawood, A.S.; Earl, B. Evaluation of local groundwater vulnerability based on DRASTIC index method in Lahore, Pakistan. Geofís. Intl. 2015, 54, 67–81. [Google Scholar] [CrossRef] [Green Version]
- Karim, M.N.; Munshi, S.U.; Anwar, N.; Alam, M.S. Climatic factors influencing dengue cases in Dhaka city: a model for dengue prediction. Indian J. Med. Res. 2012, 136, 32. [Google Scholar] [PubMed]
- Lai, Y.-H. The climatic factors affecting dengue fever outbreaks in southern Taiwan: an application of symbolic data analysis. Biomed. Eng. Online 2018, 17, 148. [Google Scholar] [CrossRef] [PubMed] [Green Version]
- Colón-González, F.J.; Lake, I.R.; Bentham, G. Climate variability and dengue fever in warm and humid Mexico. American J. Trop. Med. Hyg. 2011, 84, 757–763. [Google Scholar] [CrossRef] [PubMed]
- Pineda-Cortel, M.R.B.; Clemente, B.M.; Nga, P.T.T. Modeling and predicting dengue fever cases in key regions of the Philippines using remote sensing data. Asian Pac. J. Trop. Med. 2019, 12, 60. [Google Scholar] [CrossRef]
- Mirza, A.; Mayo, S.; Aziz, A.; Sharif, M. Spatial-Temporal Variations of Nitrogen Dioxidein And Around Lahore Metropolitan Areas Using" GIS" Techniques. Pak. J. Sci. 2013, 65, 371. [Google Scholar]
- Qureshi, J.; Mahmood, S.A.; Almas, A.S.; Rafique, H.M.; Irshad, R. Monitoring Spatiotemporal and Micro-Level Climatic Variations in Lahore And Subrubs Using Satellite Imagery and Multi-Source Data. J. Fac. Eng. Technol. 2012, 19, 51–65. [Google Scholar]
- Naqvi, S.A.A. Measuring the Risk of Dengue Prevalence in Lahore Through Geo-Spatial Techniques. Ph.D. Thesis, University of Karachi (UOK), Karachi, Pakistan, 2015. [Google Scholar]
- Azam, M.N.; Yeasmin, M.; Ahmed, N.U.; Chakraborty, H. Modeling Occurrence of Dengue Cases in Malaysia. Iran. J. Public Health 2016, 45, 1511. [Google Scholar]
- Afsar, S.; Abbas, N.; Jan, B. Comparative study of temperature and rainfall fluctuation in Hunza-nagar District. J. Basic Appl. Sci. 2013, 9, 151. [Google Scholar] [CrossRef]
- Jan, B.; Zai, M.A.K.Y.; Abbas, S.; Hussain, S.; Ali, M.; Ansari, M.R.K. Study of probabilistic modeling of stratospheric ozone fluctuations over Pakistan and China regions. J. Atmos. Sol. Terr. Phys. 2014, 109, 43–47. [Google Scholar] [CrossRef]
- Wilks, D.S. Statistical Methods in the Atmospheric Sciences: An Introduction; Library of Cataloging-in-publication; Academic Press: San Diego, CA, USA, 1995. [Google Scholar]
- Vanzie, E. Assessment of the impact of climate change on Belize’s health sector: Dengue and dengue hemorrhagic fever. In Proceedings of the Belize Second National Communications Projects (SNC), Belmopan, Belize, 17 November 2008; pp. 9–11. [Google Scholar]
- Hales, S.; De Wet, N.; Maindonald, J.; Woodward, A. Potential effect of population and climate changes on global distribution of dengue fever: an empirical model. Lancet 2002, 360, 830–834. [Google Scholar] [CrossRef]
- Li, R.; Xu, L.; Bjørnstad, O.N.; Liu, K.; Song, T.; Chen, A.; Xu, B.; Liu, Q.; Stenseth, N.C. Climate-driven variation in mosquito density predicts the spatiotemporal dynamics of dengue. Proc. Natl. Acad. Sci. USA 2019, 116, 3624–3629. [Google Scholar] [CrossRef] [Green Version]
- Langkulsen, U.; Promsakha Na Sakolnakhon, K.; James, N. Climate change and dengue risk in central region of Thailand. Int. J. Environ. Health Res. 2019, 1–9. [Google Scholar] [CrossRef] [PubMed]
- Azman, N.N.B.; Karim, S.A.B.A. Assessing Climate Factors on Dengue Spreading in State of Perak. In Proceedings of the Journal of Physics: Conference Series, Kuala Lumpur, Malaysia, 13–15 August 2018; p. 012026. [Google Scholar]
- Tarmana, D. Potential Impact of Climate Change on Dengue Hermologic Fever (DHF) Disease in Indonesia; APCC Annual Report: Jeju, Korea, 2012. [Google Scholar]
- Tarmana, D. Environment assessment base on temperature and rainfall related dhf cases in jakarta. In Proceedings of the Isqae 20165 International Seminar on Quality & Affordable, Johor, Malaysia, 7–10 October 2013; p. 125. [Google Scholar]
- Morin, C.; Ebi, K.; Sellers, S. Use of Seasonal Climate Forecasts to Develop an Early Warning System for Dengue Fever Risk in Central America and the Caribbean. In Proceedings of the AGU Fall Meeting, Washington, DC, USA, 10–14 December 2018. [Google Scholar]
- Islam, M.Z.; Rutherford, S.; Dung Phung, M.; Uzzaman, N.; Baum, S.; Huda, M.M.; Asaduzzaman, M.; Talukder, M.R.R.; Chu, C. Correlates of Climate Variability and Dengue Fever in Two Metropolitan Cities in Bangladesh. Cureus 2018, 10. [Google Scholar] [CrossRef]
- Lowe, R.; Gasparrini, A.; Van Meerbeeck, C.J.; Lippi, C.A.; Mahon, R.; Trotman, A.R.; Rollock, L.; Hinds, A.Q.; Ryan, S.J.; Stewart-Ibarra, A.M. Nonlinear and delayed impacts of climate on dengue risk in Barbados: A modelling study. PLoS Med. 2018, 15, e1002613. [Google Scholar] [CrossRef]
- Colón-González, F.J.; Fezzi, C.; Lake, I.R.; Hunter, P.R. The effects of weather and climate change on dengue. PLoS Negl. Trop. Dis. 2013, 7, e2503. [Google Scholar] [CrossRef]
- Hii, Y.L.; Zhu, H.; Ng, N.; Ng, L.C.; Rocklöv, J. Forecast of dengue incidence using temperature and rainfall. PLoS Negl. Trop. Dis. 2012, 6, e1908. [Google Scholar] [CrossRef]
- Suleman, M.; Faryal, R.; Aamir, U.B.; Alam, M.M.; Nisar, N.; Sharif, S.; Shaukat, S.; Khurshid, A.; Angez, M.; Umair, M. Dengue outbreak in Swat and Mansehra, Pakistan 2013: An epidemiological and diagnostic perspective. Asian Pac. J. Trop. Med. 2016, 9, 380–384. [Google Scholar] [CrossRef] [Green Version]
- Yousaf, M.Z.; Siddique, A.; Ashfaq, U.A.; Ali, M. Scenario of dengue infection & its control in Pakistan: An up—date and way forward. Asian Pac. J. Trop. Med. 2018, 11, 15. [Google Scholar] [CrossRef]
- UN. Living with Risk: A Global Review of Disaster Reduction Initiatives; United Nations Publications: New York, NY, USA, 2004; Volume 1. [Google Scholar]
- Edison, H.J. Do indicators of financial crises work? An evaluation of an early warning system. Int. J. Financ. Econ. 2003, 8, 11–53. [Google Scholar] [CrossRef]


| Variables | N | Mean | SE Mean | SD | Min | Median | Max |
|---|---|---|---|---|---|---|---|
| Temperature | 72 | 25.07 | 0.834 | 7.074 | 11.20 | 27.00 | 35.300 |
| Rainfall | 72 | 50.49 | 8.47 | 74.12 | 0.00 | 18.85 | 288 |
| Dengue | 72 | 239 | 106 | 901 | 0.00 | 3.00 | 6314 |
| Variables | Jan | Feb | Mar | Apr | May | Jun | July | Aug | Sep | Oct | Nov | Dec |
|---|---|---|---|---|---|---|---|---|---|---|---|---|
| Avg. Temp. | 11.2 | 13.94 | 19.47 | 24.31 | 28.07 | 28.6 | 27.1 | 26.30 | 25.2 | 22.7 | 17.87 | 13.0 |
| Total Rainfall | 57.8 | 183.2 | 139.9 | 126.4 | 75.6 | 451.1 | 881.4 | 1052.5 | 570.5 | 37.8 | 11.5 | 47.2 |
| Dengue cases | 14 | 4 | 13 | 16 | 27 | 10 | 19 | 1044 | 6433 | 5042 | 4187 | 327 |
| Predictor | Coef | SE Coef | T | p | |
| Constant | 2455.8 | 364.1 | 6.75 | 0.00 | |
| Rainfall | 14.659 | 3.066 | 4.78 | 0.00 | |
| S = 36132.9 | R2 = 34.2% | ||||
| Analysis of Variance: | |||||
| Source | DF | SS | MS | F | p |
| Regression | 1 | 29,837,486,298 | 29,837,486,298 | 22.85 | 0.00 |
| Residual | 44 | 57,445,902,491 | 1,305,588,693 | ||
| Total | 45 | 87,283,388,789 | |||
| Predictor | Coef | SE Coef | T | p | |
| Constant | −6213 | 1909 | −3.26 | 0.002 | |
| Temperature | 370.87 | 71.48 | 5.19 | 0.000 | |
| S = 35081.0 | R2 = 38.0% | ||||
| Analysis of Variance: | |||||
| Source | DF | SS | MS | F | p |
| Regression | 1 | 33,133,717,525 | 33,133,717,525 | 25.79 | 0.013 |
| Residual | 44 | 54,149,671,264 | 1,230,674,347 | ||
| Total | 45 | 87,283,388,789 | |||
| Dengue | Coef. | SE Coef | T | p | |
| Constant | −4967 | 2763 | −1.80 | 0.079 | |
| Temperature | 300.1 | 111.7 | 2.69 | 0.010 | |
| Rainfall | 6.744 | 4.240 | 1.59 | 0.019 * | |
| S = 33,857.2 | R2 = 44.6% | ||||
| Analysis of Variance | |||||
| Source | SS | df | MS | F | p |
| Model | 38,695,350,650 | 2 | 19,347,675,325 | 16.88 | 0.000 |
| Residual | 48,145,018,459 | 69 | 1,146,309,963 | ||
| Total | 86,840,369,109 | 71 | |||
© 2019 by the authors. Licensee MDPI, Basel, Switzerland. This article is an open access article distributed under the terms and conditions of the Creative Commons Attribution (CC BY) license (http://creativecommons.org/licenses/by/4.0/).
Share and Cite
Naqvi, S.A.A.; Jan, B.; Shaikh, S.; Kazmi, S.J.H.; Waseem, L.A.; Nasar-u-minAllah, M.; Abbas, N. Changing Climatic Factors Favor Dengue Transmission in Lahore, Pakistan. Environments 2019, 6, 71. https://doi.org/10.3390/environments6060071
Naqvi SAA, Jan B, Shaikh S, Kazmi SJH, Waseem LA, Nasar-u-minAllah M, Abbas N. Changing Climatic Factors Favor Dengue Transmission in Lahore, Pakistan. Environments. 2019; 6(6):71. https://doi.org/10.3390/environments6060071
Chicago/Turabian StyleNaqvi, Syed Ali Asad, Bulbul Jan, Saima Shaikh, Syed Jamil Hasan Kazmi, Liaqat Ali Waseem, Muhammad Nasar-u-minAllah, and Nasir Abbas. 2019. "Changing Climatic Factors Favor Dengue Transmission in Lahore, Pakistan" Environments 6, no. 6: 71. https://doi.org/10.3390/environments6060071