Article

Effect of the Type of Gas-Permeable Membrane in Ammonia Recovery from Air

by
María Soto-Herranz
1,*,
Mercedes Sánchez-Báscones
1,
Juan Manuel Antolín-Rodríguez
1,
Diego Conde-Cid
1 and
Matias B. Vanotti
2
1
Department of Agroforestry Sciences, ETSIIAA, University of Valladolid, Avenida de Madrid 44, 34004 Palencia, Spain
2
United States Department of Agriculture (USDA), Agricultural Research Service, Coastal Plains Soil, Water and Plant Research Center, 2611 W. Lucas St., Florence, SC 29501, USA
*
Author to whom correspondence should be addressed.
Environments 2019, 6(6), 70; https://doi.org/10.3390/environments6060070
Submission received: 7 May 2019 / Revised: 5 June 2019 / Accepted: 14 June 2019 / Published: 16 June 2019

Abstract

:
Animal production is one of the largest contributors to ammonia emissions. A project, “Ammonia Trapping”, was designed to recover gaseous ammonia from animal barns in Spain. Laboratory experiments were conducted to select a type of membrane most suitable for gaseous ammonia trapping. Three types of gas-permeable membranes (GPM), all made of expanded polytetrafluoroethylene (ePTFE), but with different diameter (3.0 to 8.6 mm), polymer density (0.45 to 1.09), air permeability (2 to 40 L·min−1·cm2), and porosity (5.6 to 21.8%) were evaluated for their effectiveness to recover gas phase ammonia. The ammonia evolved from a synthetic solution (NH4Cl + NaHCO3 + allylthiourea), and an acidic solution (1 N H2SO4) was used as the ammonia trapping solution. Replicated tests were performed simultaneously during a period of 7 days with a constant flow of acidic solution circulating through the lumen of the tubular membrane. The ammonia recovery yields were higher with the use of membranes of greater diameter and corresponding surface area, but they were not affected by the large differences in material density, porosity, air permeability, and wall thickness in the range evaluated. A higher fluid velocity of the acidic solution significantly increased—approximately 3 times—the mass NH3–N recovered per unit of membrane surface area and time (N-flux), from 1.7 to 5.8 mg N·cm−2·d−1. Therefore, to optimize the effectiveness of GPM system to capture gaseous ammonia, the appropriate velocity of the circulating acidic solution should be an important design consideration.

1. Introduction

Animal production is one of the largest contributors to ammonia emissions (NH3) [1] due to poor waste management. Ammonia is implicated in particulate formation (PM 2.5) with adverse effects on human health [2]. Ammonia also contributes to ecosystem degradation when it is deposited on land or water [3] with corresponding soil acidification and eutrophication of surface water bodies [4].
In 2016, the agricultural sector of the EU-28 was responsible for 92% of the total ammonia emissions in the region because of the volatilization of livestock excreta [5]. In Spain, according to the National Emissions Inventory (1990–2015), agricultural activities produced 96% of the ammonia emissions. In 2014 and 2015, the National Emission Ceilings for the NH3 (353 kt·year−1) were exceeded by 7% [6]. According to EU Directive 2016/2284/EU [7], Spain must reduce the NH3 emission ceiling by 3% during the period 2020–2029 and by 16% by the year 2030.
Mechanical ventilation is considered a basic control method to eliminate gaseous ammonia from the inside of livestock production barns [8] to ensure the health of workers and animals [9] and the animal production performance [10].
The application of gas-permeable membranes (GPM) for capturing ammonia has been tested, especially in liquid [11,12]. Methods designed for the capture and recovery of N as a resource are the most optimal [13,14,15]. Conservation and recovery of N are important in agriculture due to the high cost of commercial ammonia fertilizers [16]. In this way, it would contribute positively from both an environmental point of view (decreased ammonia emissions to the atmosphere) and an economic point of view (recovered ammonium to replace commercial fertilizers of nitrogen source). Furthermore, the advantages of gas-permeable membrane technology over other N recovery technologies are, among others, that it does not require the use of additives [17], and it has low energy consumption in relation to other methods of ammonia recovery [18].
The GPM process consists in the flux of ammonia gas through the microporous hydrophobic membrane by diffusion. This ammonia is captured in an acidic solution circulating inside the membrane. As shown in Equation (1), once in contact with the acidic solution, the NH3 gas combines with the free protons of the acid to form non-volatile ammonium ions (NH4+). When sulfuric acid is used in the process, the product is ammonium sulfate. Sulfuric acid is generally used as a source of acid to capture ammonia because of its lowest cost among inorganic acids. However, the process is also effective using other inorganic acids (nitric, phosphoric), organic acids (citric, lactic), and their precursors [19]. Additionally, ammonium sulfate (AS) may have some potential agronomic and environmental benefits compared with ammonium nitrate (AN) by creating a more acidic root rhizosphere that increases the availability of soil P, and by reducing denitrification in soil and N2O greenhouse gas emissions [20]. Therefore, it can be an adequate substitute of mineral fertilizers as a nitrogen source and valuable fertilizer.
2NH3 + H2SO4 → (NH4)2SO4
For gas separation and recovery, organic hydrophobic gas-permeable membranes (GPM), especially expanded polytetrafluoroethylene (ePTFE), are preferred due to lower transference resistance, hydrophobic characteristics, organic resistance, and chemical stability with acidic solutions [21,22].
The final mass of NH3 captured in the acidic solution depends on the concentration of NH3 gas in the atmosphere, which depends on the pH and the TAN (total ammonia nitrogen, NH3 + NH4+) concentration of the emitting solution [23], pH of the acidic solution [24], and acidic solution flow rate [25].
In animal manures, NH3 and NH4+ are in equilibrium depending on the pH and the temperature. The ammonia dissolves at the source and/or is emitted. At pH below 7, little of the ammonia is undissociated and present as dissolved gas in liquid mixtures [26], for example, only 0.36% at pH 6.8 and temperature 25 °C [27]. At higher pH, a higher concentration of the undissociated, free NH3 is instantly produced (i.e., 26.4, 78.2, and 97.3% at pH 8.8, 9.8, and 10.8, respectively). These conditions favor NH3 permeation through the membrane where an acidic solution circulates [28,29]. With a pH < 2, the acidic solution dissolves the NH3, transforming it into an ammonium salt [11].
Most ammonia capture applications with gas-permeable tubular membranes have been performed in the liquid state (effluents). An EU project, “Ammonia Trapping (AT)”, was designed to recover gaseous ammonia from animal barns in Spain. The main objective of the AT project was to reduce NH3 gas emissions from the atmosphere of swine and poultry farms by using gas-permeable ePTFE membranes and capturing the N directly from the air. Targets in AT project were a reduction in the NH3 concentration > 70%, and flux rates of ammonia trapping of 1.3 g N m−2 d−1. The goal of this study was to determine the efficiency of the different gas-permeable tubular membranes to capture ammonia from the air. The results of this laboratory study helped in selection of the materials before a larger on-farm pilot evaluation, especially given the difference in costs of these membranes. To avoid variations in ammonia emissions, among treatments each experiment used the same synthetic N emitting solution. In addition, the pH of the acidic solution used for ammonia capture was kept below 2.

2. Materials and Methods

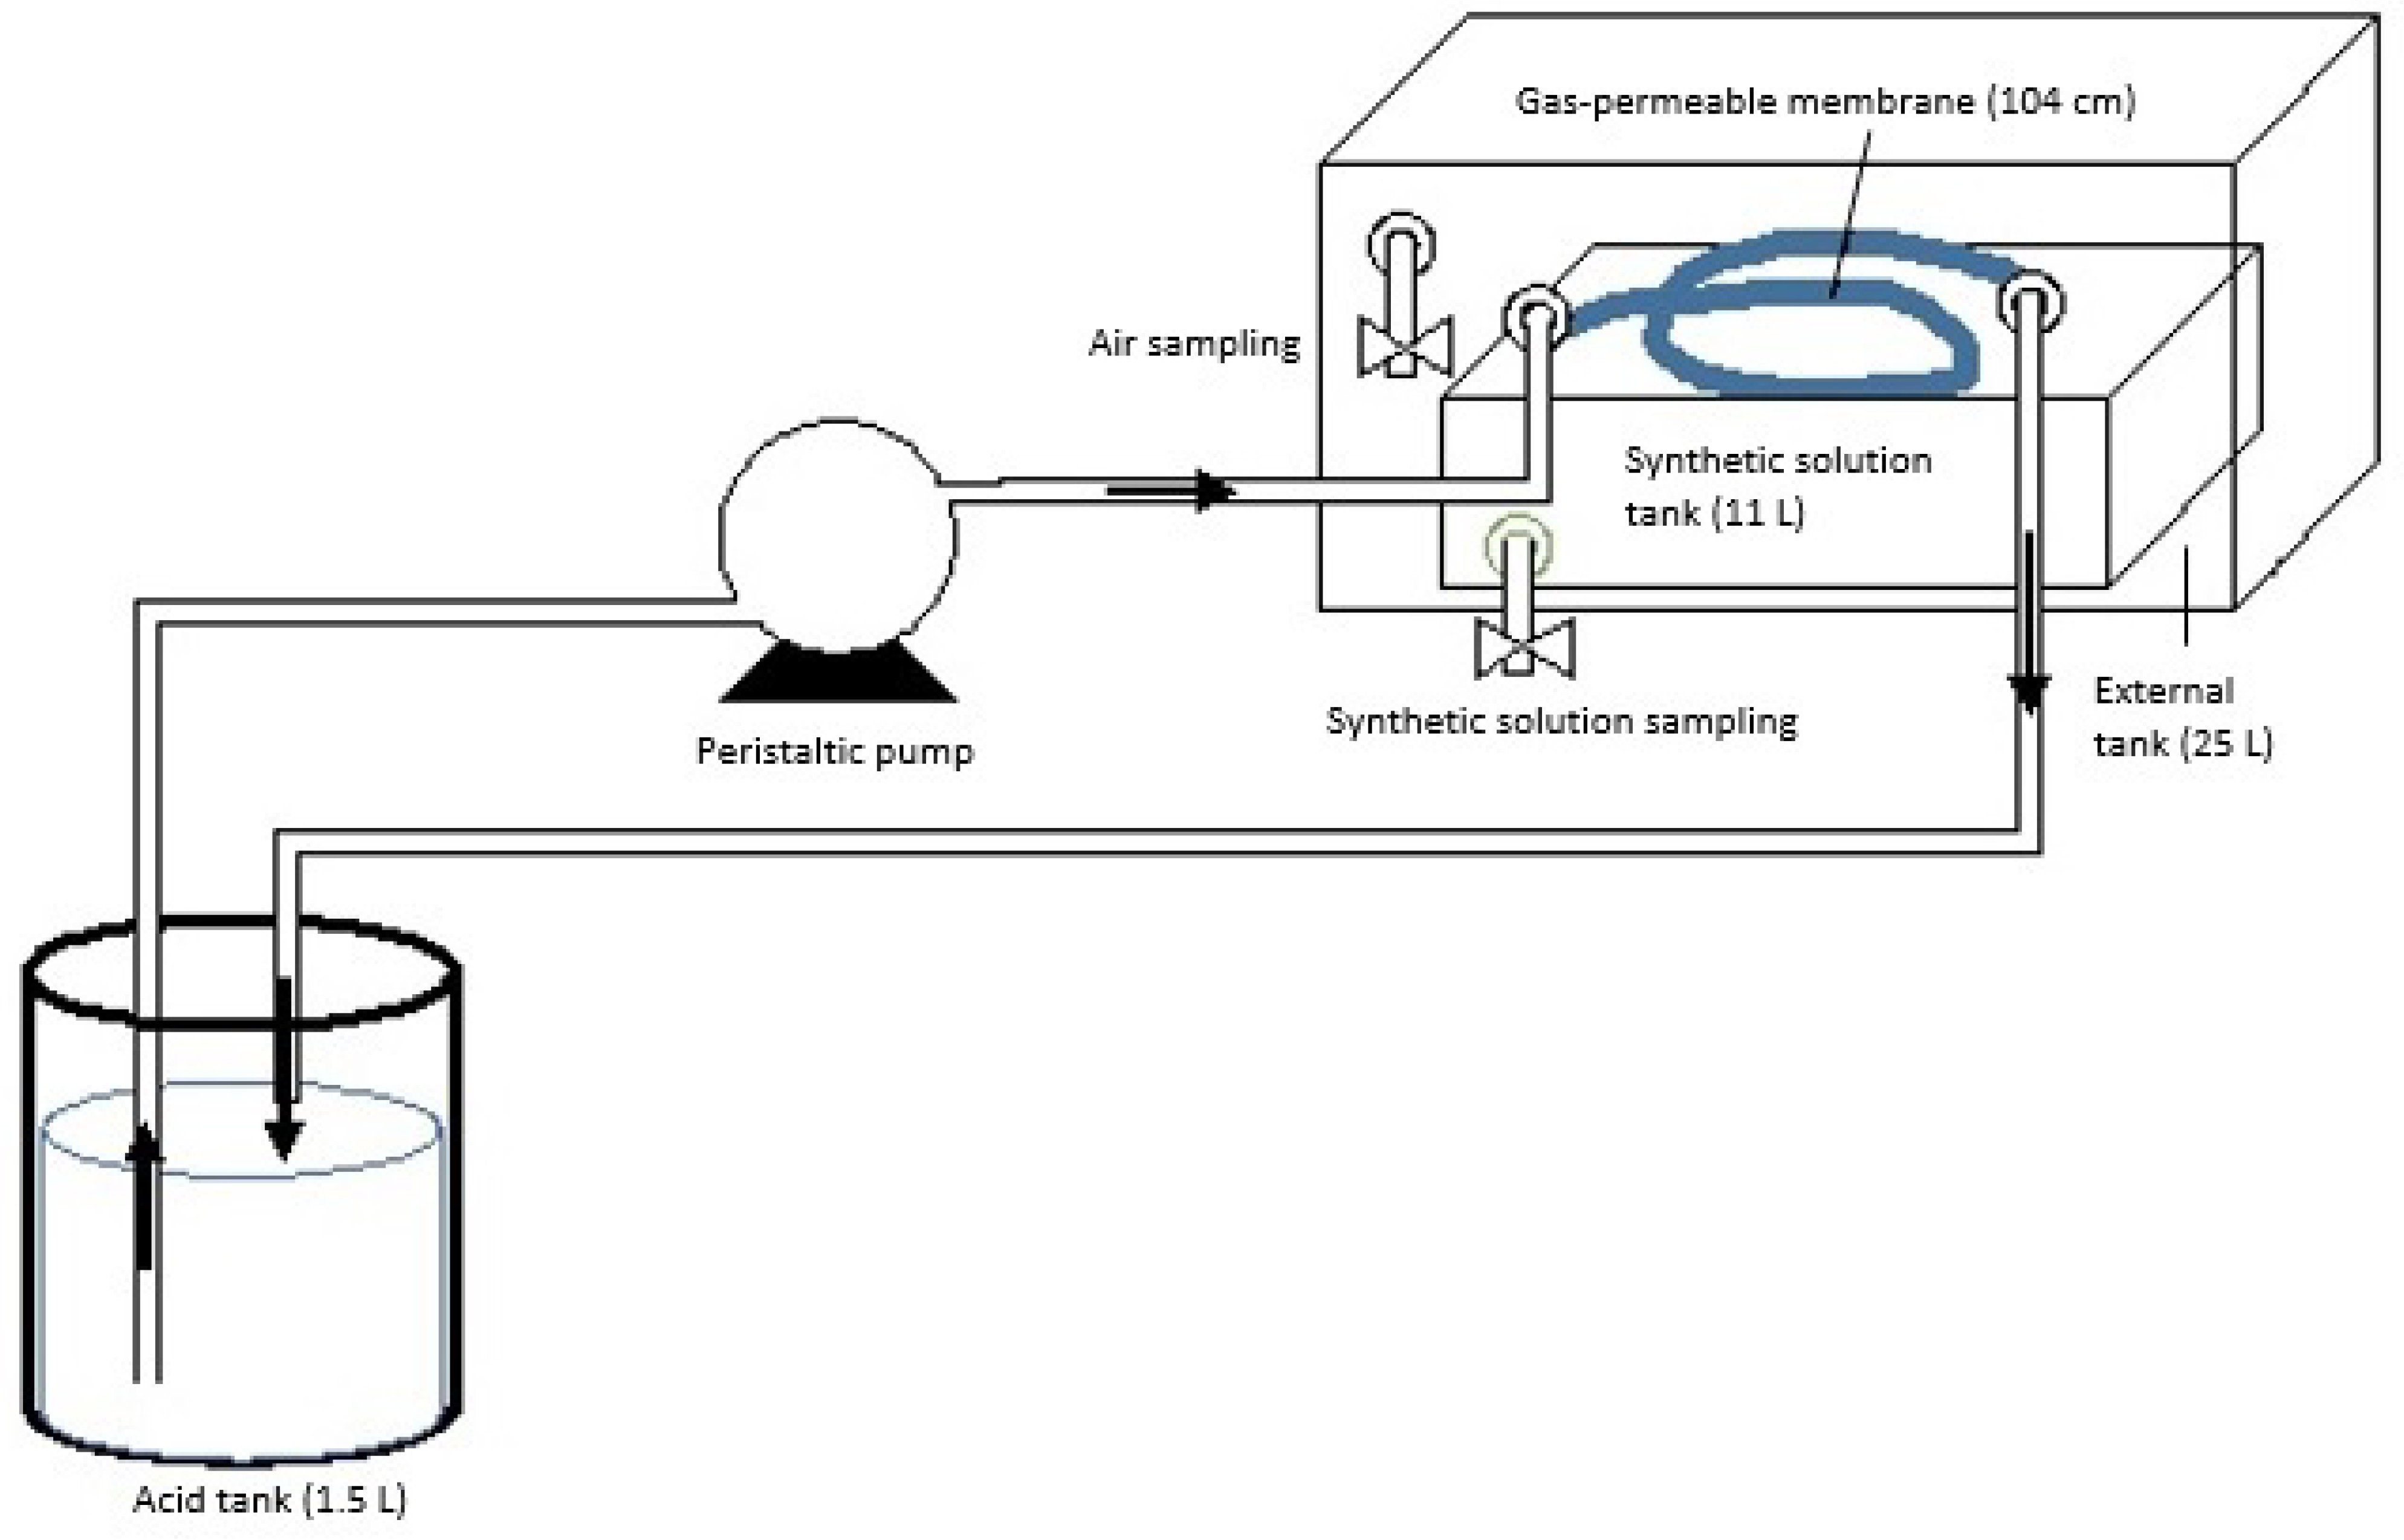
2.1. Experimental Design

Airtight chambers were used to recover gaseous ammonia using the method of Szogi et al. [19]. The experiment used three chambers (volume = 25 L), one for testing each type of gas-permeable membrane (Figure 1). The lids of the chambers were sealed. A tank (volume = 11 L) containing 1 L of a synthetic N emitting solution was placed inside of each chamber. Tubular gas-permeable membranes were suspended in the air in the chambers. The membranes were connected to an acidic solution reservoir that contained 1 L of an acidic N capturing solution (1 N H2SO4). Peristaltic pumps (Minipuls 2, Gylson, USA or Perimax 12, Spetec, Germany) recirculated the acidic solution in a closed loop [16] between the inside of the tubular membranes and the acidic solution reservoir.
The membranes were made of expanded polytetrafluoroethylene (ePTFE), but with different characteristics: ZM, ZM4, FZM (ZEUS Industrial Products Inc., Orangeburg, SC, USA), and PM (PRODYSOL Company) (Table 1).
Two experiments were conducted. In experiment 1, three conditions were evaluated. The same flow rate of the acidic solution (1.25 L h−1) was applied to the three treatments. Two treatments used membranes with contrasting characteristics (ZM and PM) and with equal surface area (282.3 cm2). The third treatment used a membrane (FZM) with smaller diameter and lower surface area (66 cm2) (Table 1).
Experiment 2 was conducted to verify the effect of the fluid velocity on ammonia flux. Four conditions were evaluated. The four treatments used the same membrane surface (125.7 cm2).
Two membrane types with different diameter were tested (PM and ZM4), and each membrane type received two acid flow rates (0.83 and 1.5 L h−1).
A synthetic solution was used in both experiments as the source of NH3 emission (instead of organic waste). In the first experiment, the N emitting solution contained 59.4 g L−1 NH4Cl, 108.5 g L−1 NaHCO3, and 10 mg·L−1 N-allylthiourea, and in the second experiment, the N emitting solution contained 24.6 g L−1 NH4Cl, 43.2 g L−1 NaHCO3, and 10 mg·L−1 N-allylthiourea. N-allylthiourea (98%) was added as a nitrification inhibitor, following the strategies presented in other assays [22,30].
Two repetitions were made with each treatment tested. Samples (7.5 mL) of the N emitting synthetic solution were collected every two days and samples (5 mL) of the N trapping acidic solution were collected every day. The room temperature was constant (20.0 ± 1.0 °C).

2.2. Methodology for Analyses

Temperature (°C), pH, and TAN concentration (mg·L−1) were monitored in the acidic solutions and the N emitting solution. The weight variations were controlled in the acidic solution reservoir, taking into account the 5 mL of sample extracted.
The control of pH was realized in the N trapping acidic solution and the N emitting synthetic solutions: pH of the acidic solution was maintained at < 2 and the pH of the synthetic solution at > 8 [11,12,30]. pH modifications were not required because these conditions were not reached.
The pH was measured with a Crison GLP22 pH meter (Crison Instruments S.A., Barcelona, Spain). The ammonium analysis was performed with distillation (UDK 140 automatic steam distillation unit, Velp scientific), capture of distillate in borate buffer, and subsequent titration with 0.2 N HCl [31].
The internal surface morphology of the membranes (Figure 2) was analyzed by scanning electron microscopy (SEM) in the Advanced Microscopy Unit of the University of Valladolid. The SEM images were obtained using a FEI QUANTA 200F device (FEI Co, USA). The pore size distribution (pores/m2), porosity, and water and air permeability were measured using porosimetry equipment (Coulter Porometer II) [32]. The surface sizes of the FPM and ZM4 membranes were not suitable for porosimetry and permeability analyses, so these measurements were obtained for ZM and PM membranes only.
Data were analyzed by means and standard deviation. Linear regression analyses were used to quantify changes of weight of the acidic solution and N capture rates. Data related to N mass removed, N mass recovered, and N flux were subjected to ANOVA (SAS Institute, 2008) [33].

2.3. Mass Flow Calculation

Mass flow (J) of NH3–N or N flux (mg N·cm−2·d−1) from the air into the acidic solution was calculated based on the N mass captured per day and the surface area of the GPM tubing using Equation (2), where C is the concentration of NH4–N in the acidic solution (mg·L−1), V is the volume of the acidic solution (L), S the contact surface of the membrane (cm2), and t the time (d).
J = (C × V)/(S × t)

3. Results and Discussion

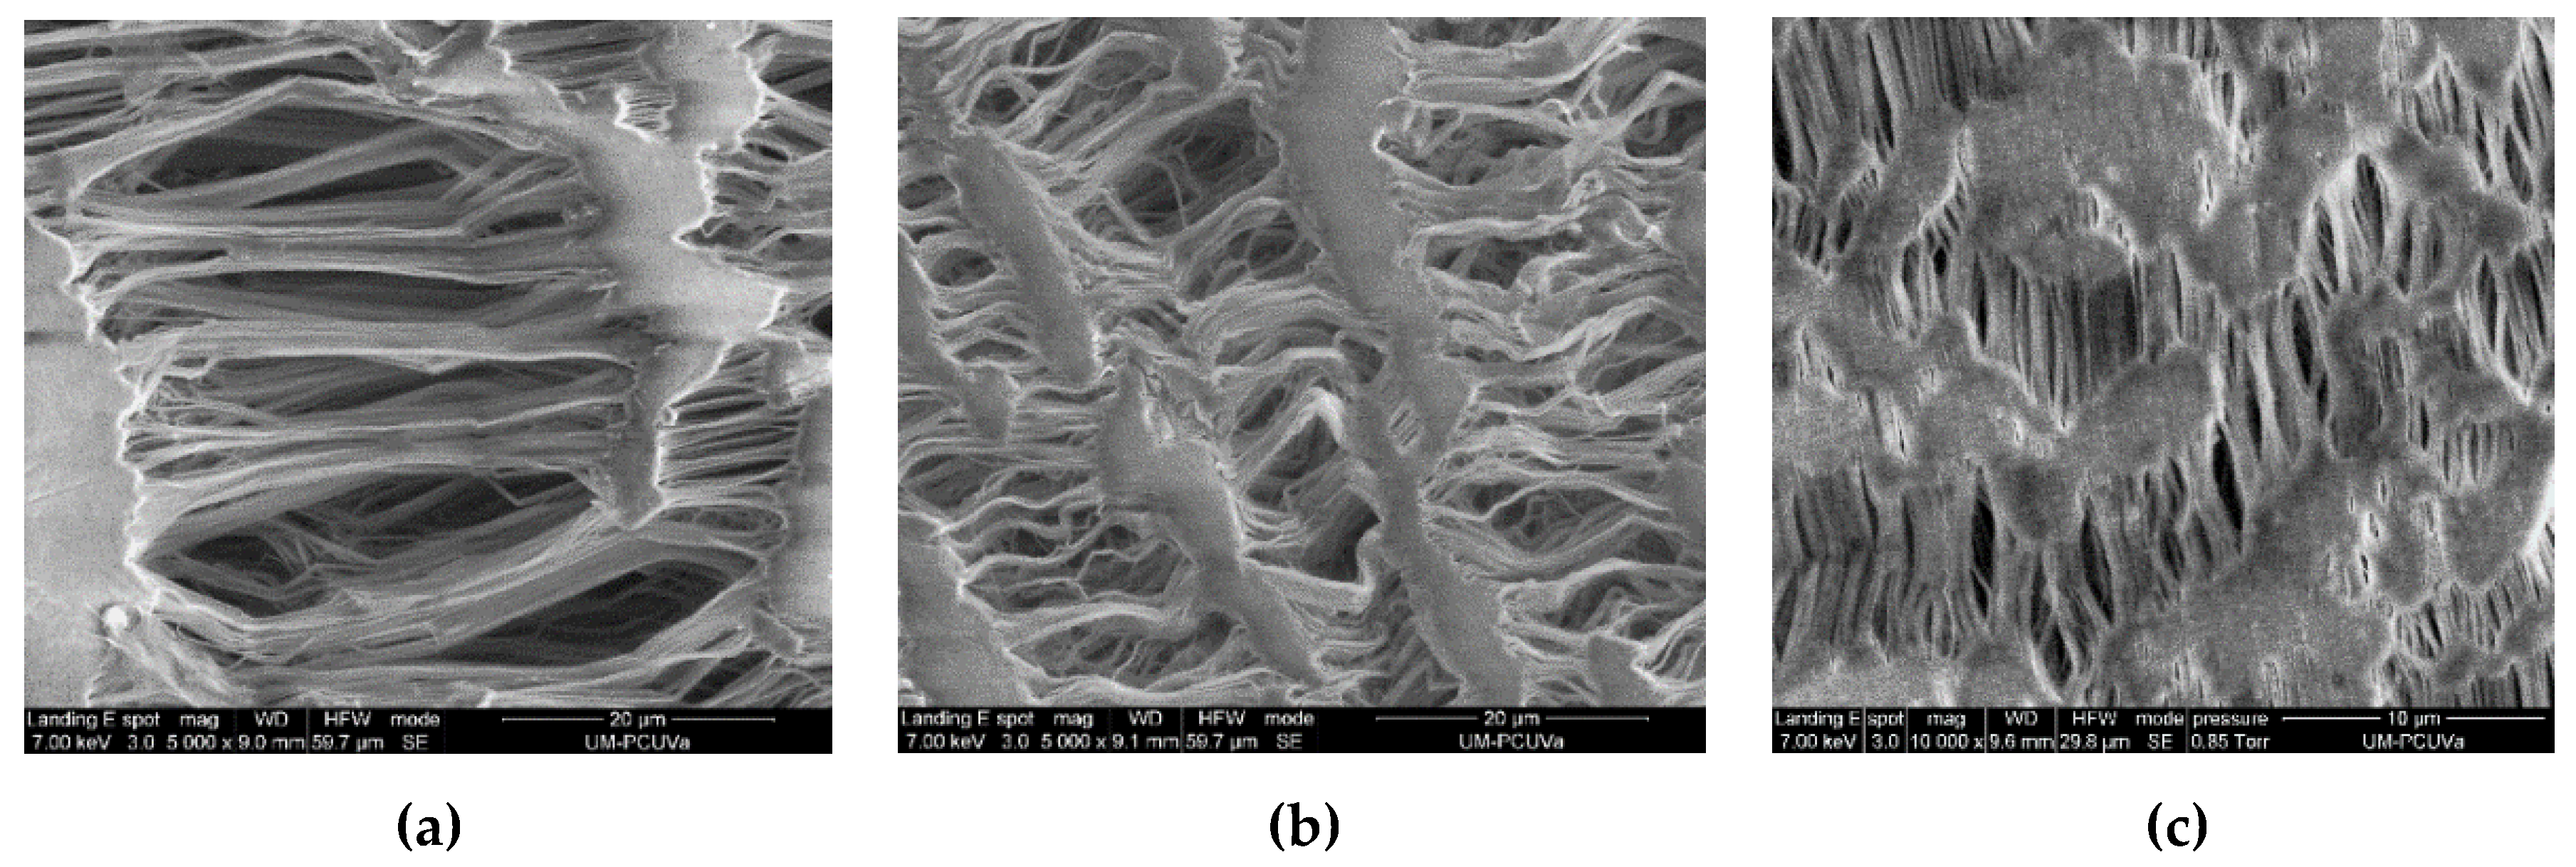
3.1. Characterization of Membranes

Measurements of the number of pores, porosity, water and air permeability, and MFP (mean flow pore) for the membranes ZM and PM are shown in Table 2.
Compared with the PM membrane, the ZM membrane had a lower density (0.45), a higher number and size of pores, and a higher porosity and permeability (Table 2). This result can also be verified by the SEM images in Figure 2, which indicate that the pore size was greater in ZM, followed by PM, and finally FZM.

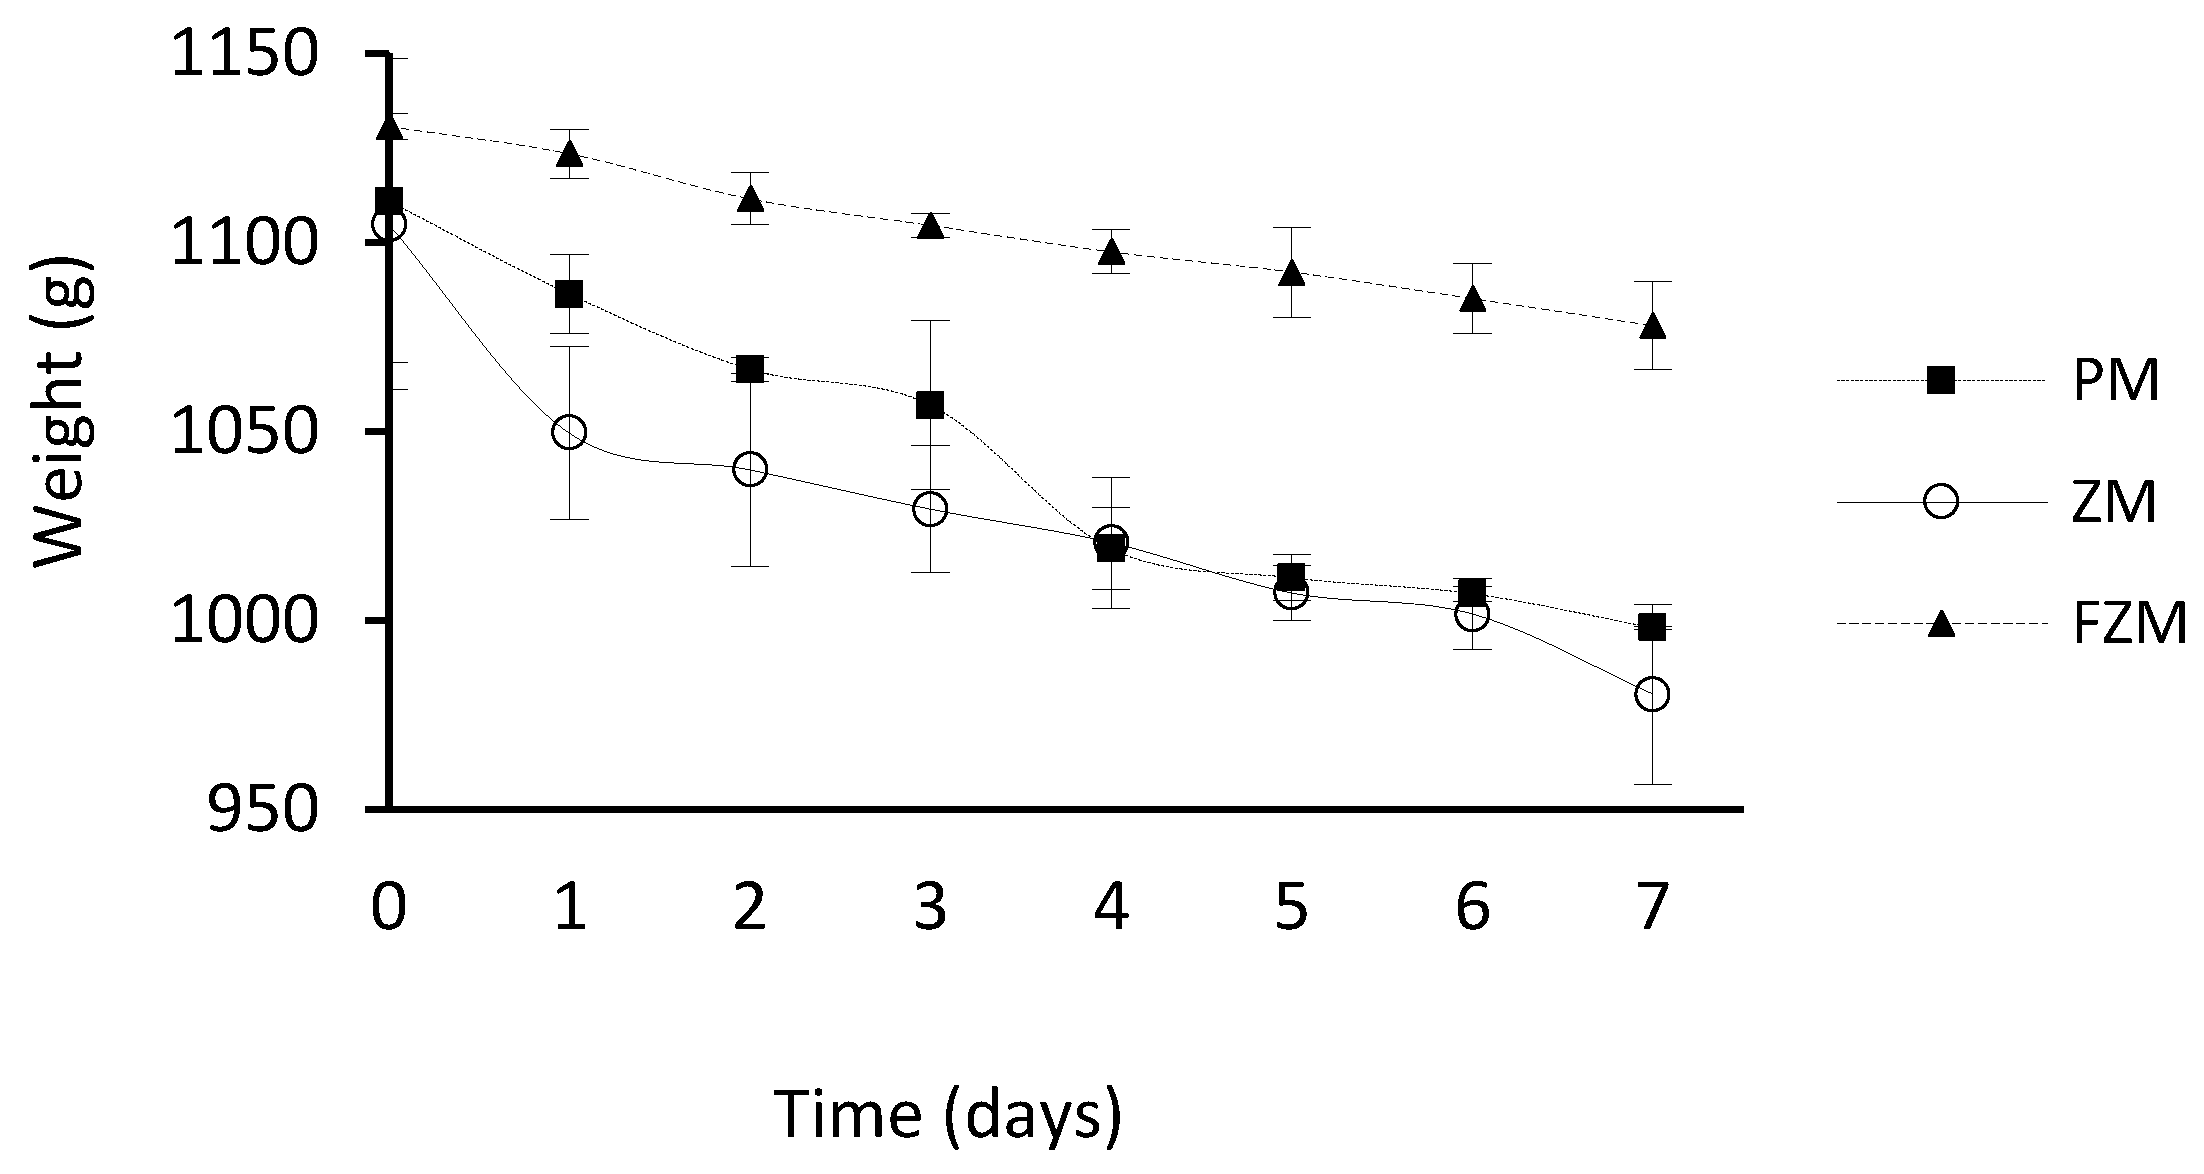
3.2. Variation of the Weight of the Acidic Solution

The acidic solution decreased in weight in the three GPM systems (Figure 3). Total weight losses of the acidic solution at the end of the experiment were 11 ± 2% for ZM (R2 = 0.89), 10 ± 4% for PM (R2 = 0.95), and 5 ± 1% for FZM (R2 = 0.99). Weight losses in all cases were related with an evaporation process as leaks were not observed. The rate of water weight loss (g·d−1) for each type of membrane was: 16.1 ± 6.1 g·d−1 for PM, 17.8 ± 2.9 g·d−1 for ZM, and 7.5 ± 1.2 g·d−1 for FZM. The hydrophobic nature of the membrane prevents the penetration of the acidic solution into the membrane pores, creating a liquid/vapor interface at each pore entrance. If a vapor partial pressure difference across the membrane is established, vapor transport across the membrane takes place [34].
Majd et al. [23] also observed volume losses in acid traps due to evaporation, with values between 1 to 2 mL·d−1 in suspended systems, with an acid volume of 190 mL and a flow rate 3 times lower than that used in this experiment.
The rate of weight loss of the acid was not affected by membrane density, porosity, and permeability; however, it was affected by surface area. Weight loss was higher in the two membranes (ZM and PM) with the larger diameter and surface area, even though they had different porosity and density, and the weight loss was lower in the FZM membrane with smaller diameter and surface area. Therefore, the greater surface area resulted in higher vapor transport across the membranes and acid weight loss.

3.3. Process pH in the N Capturing Acidic Solution and N Emitting Synthetic Solution

The pH values reached in the acidic solution for each type of membrane were 0.4 ± 0.1 for PM, 0.4 ± 0.1 for ZM, and 0.4 ± 0.1 for FZM. In all cases, the pH values reached in the acidic solution remained below 2, indicating that enough H+ ions were available to react continuously with NH3 [25], forming an ammonium salt.
The initial pH values in the N-emitting synthetic solution for each type of membrane were 8.74 ± 0.06 for PM, 8.76 ± 0.01 for ZM, and 8.78 ± 0.13 for FZM. Corresponding final pH values at day 7 were 8.27 ± 0.04, 8.45 ± 0.01, and 8.63 ± 0.06. In all cases, the pH of the synthetic solution was maintained above 8, which favored the emission of free NH3 [30].

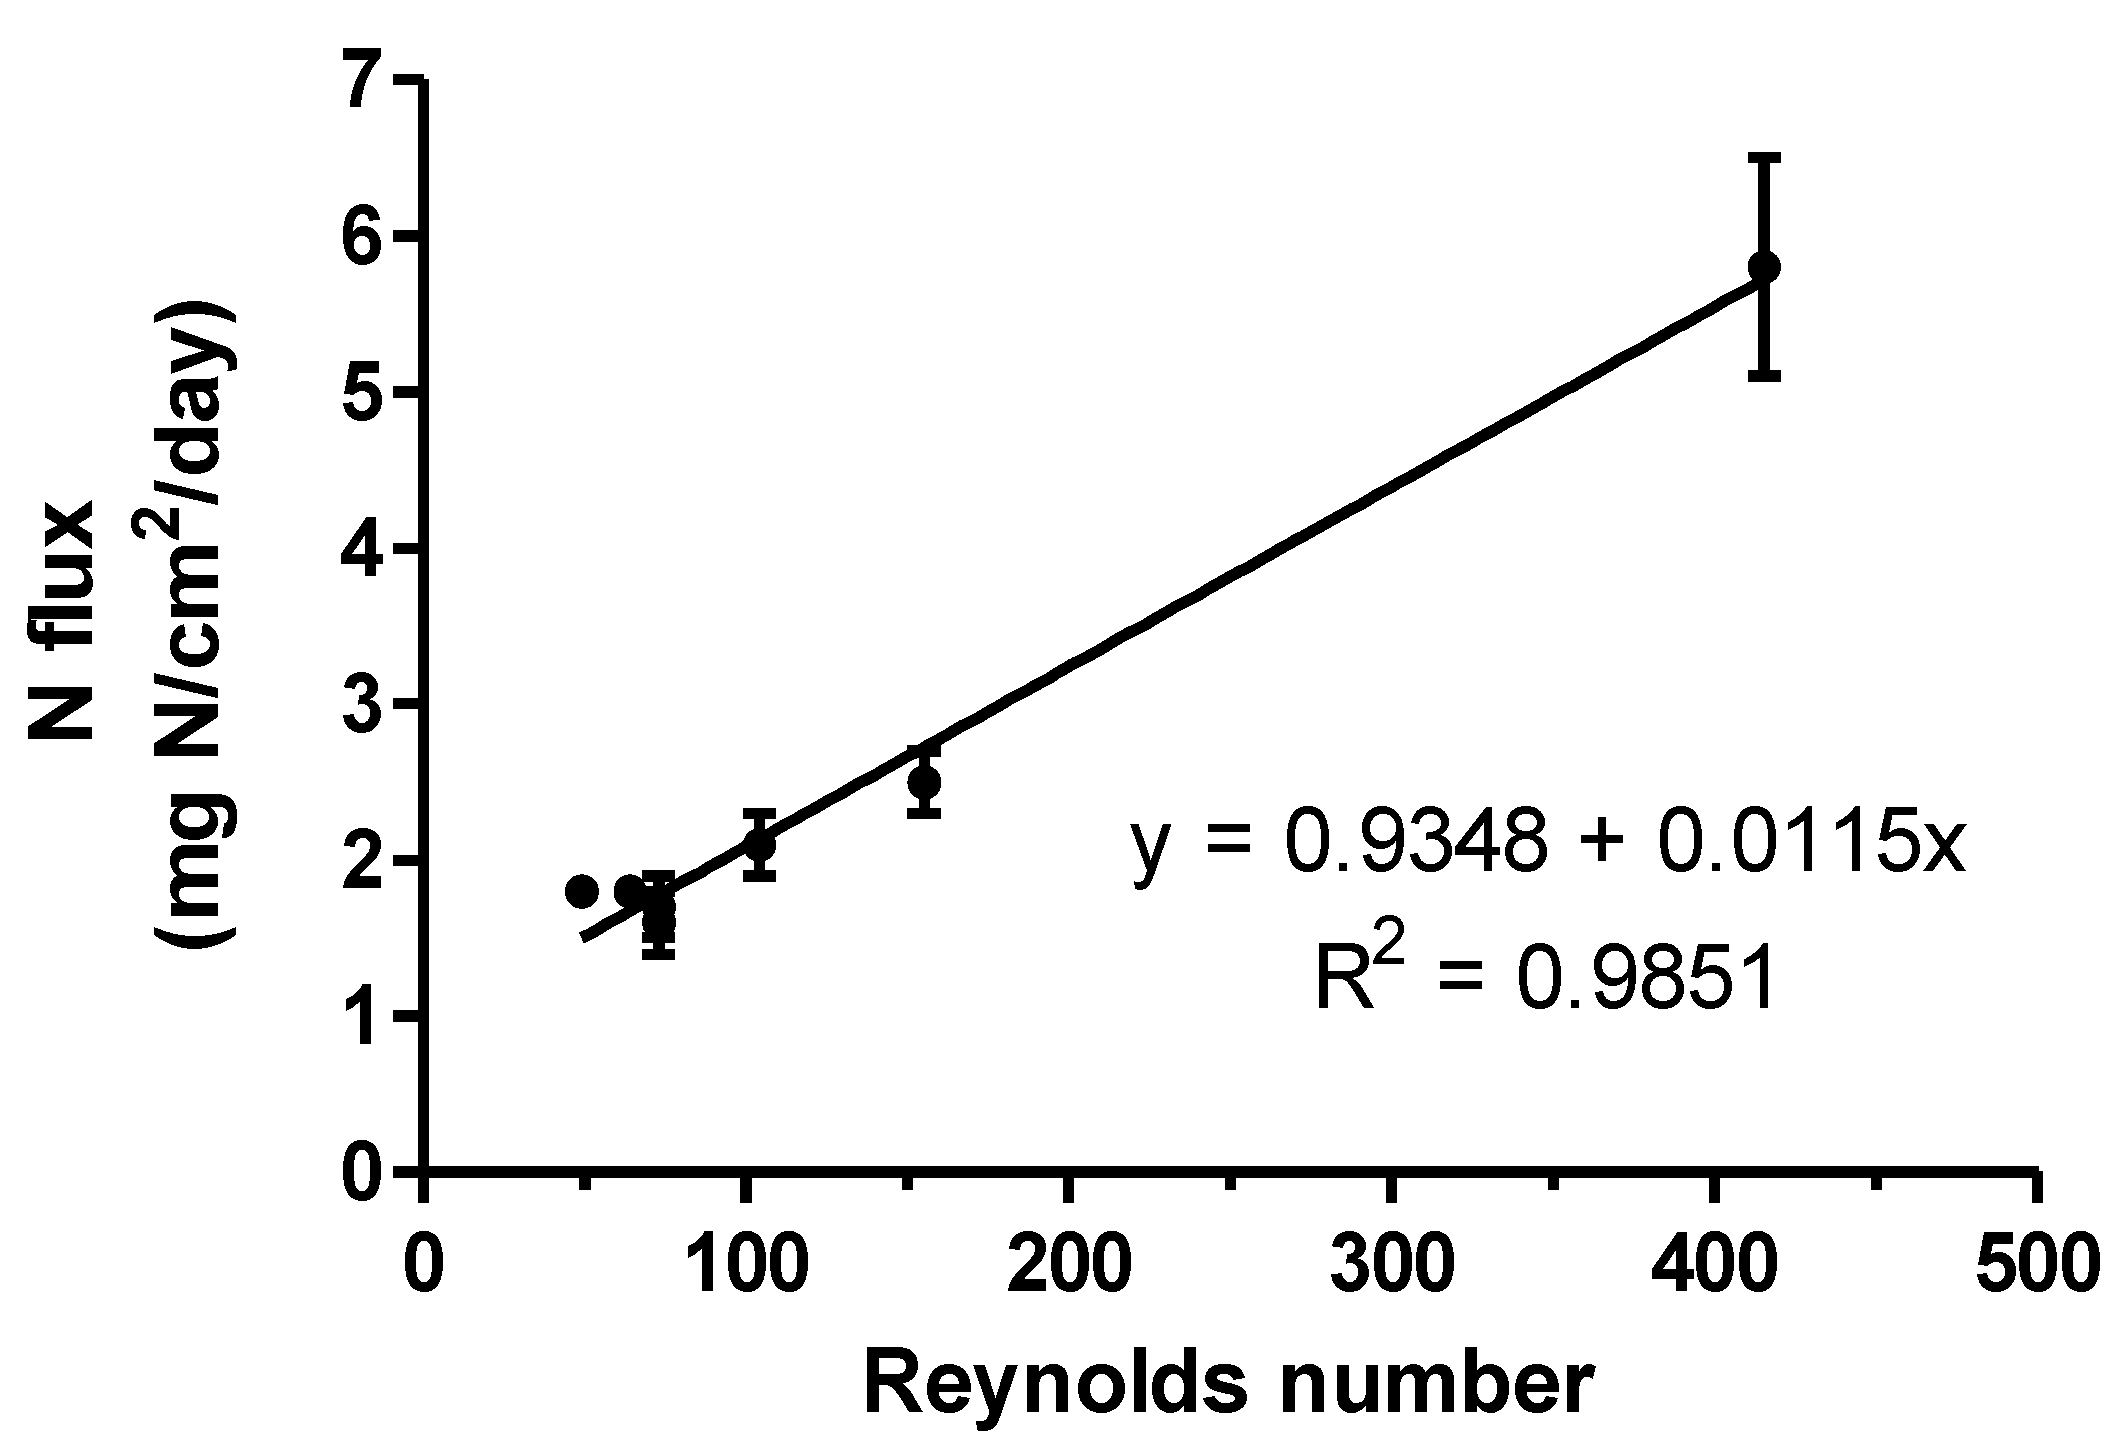
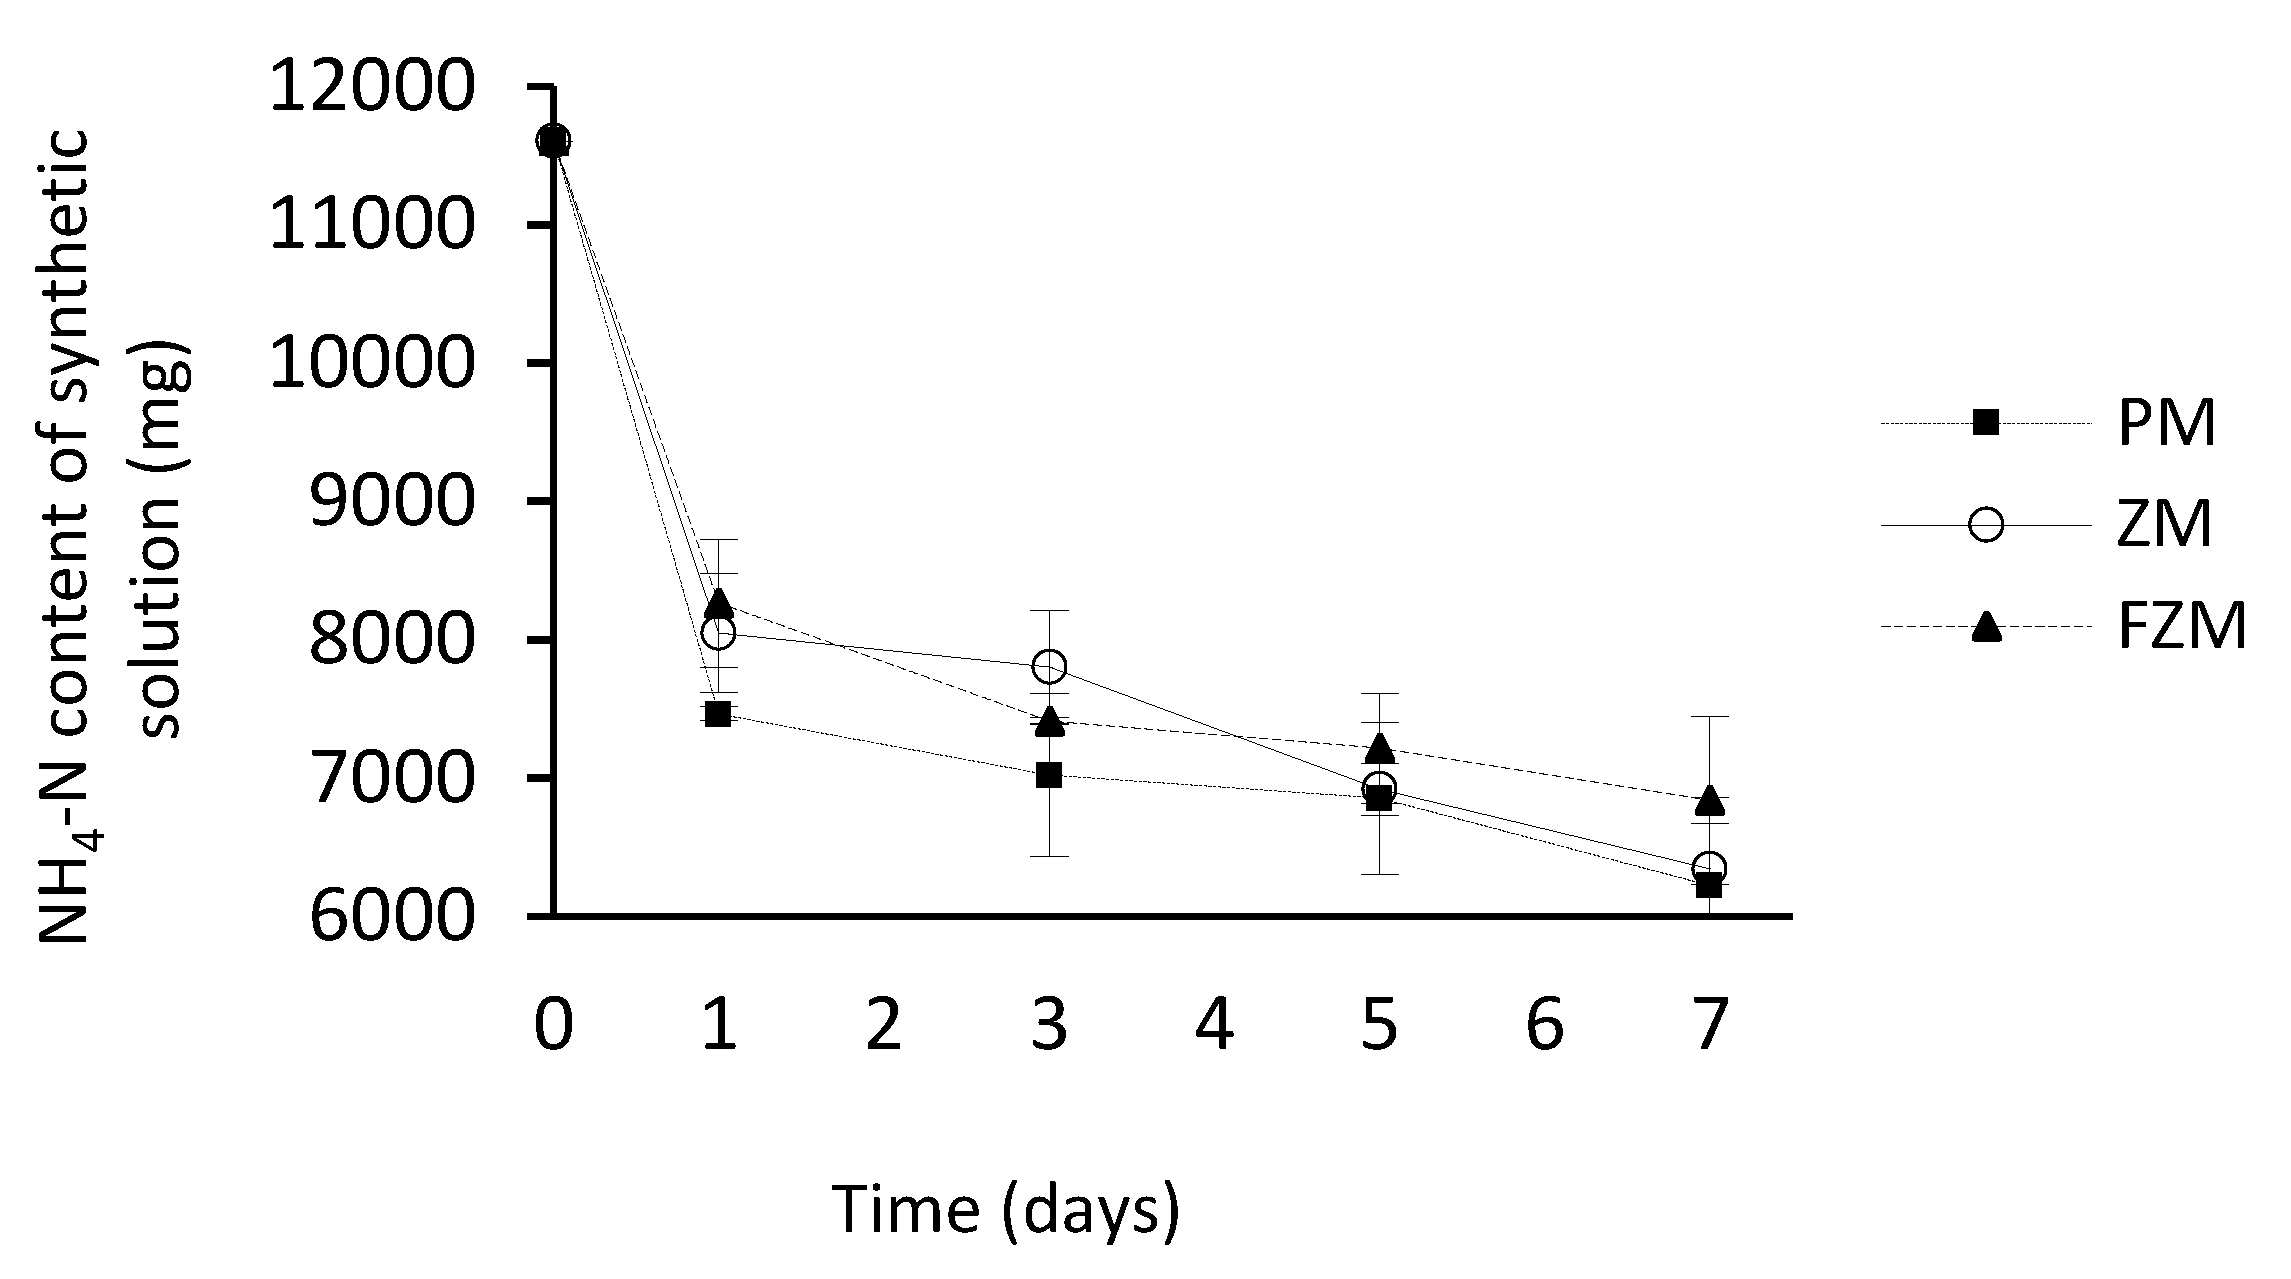
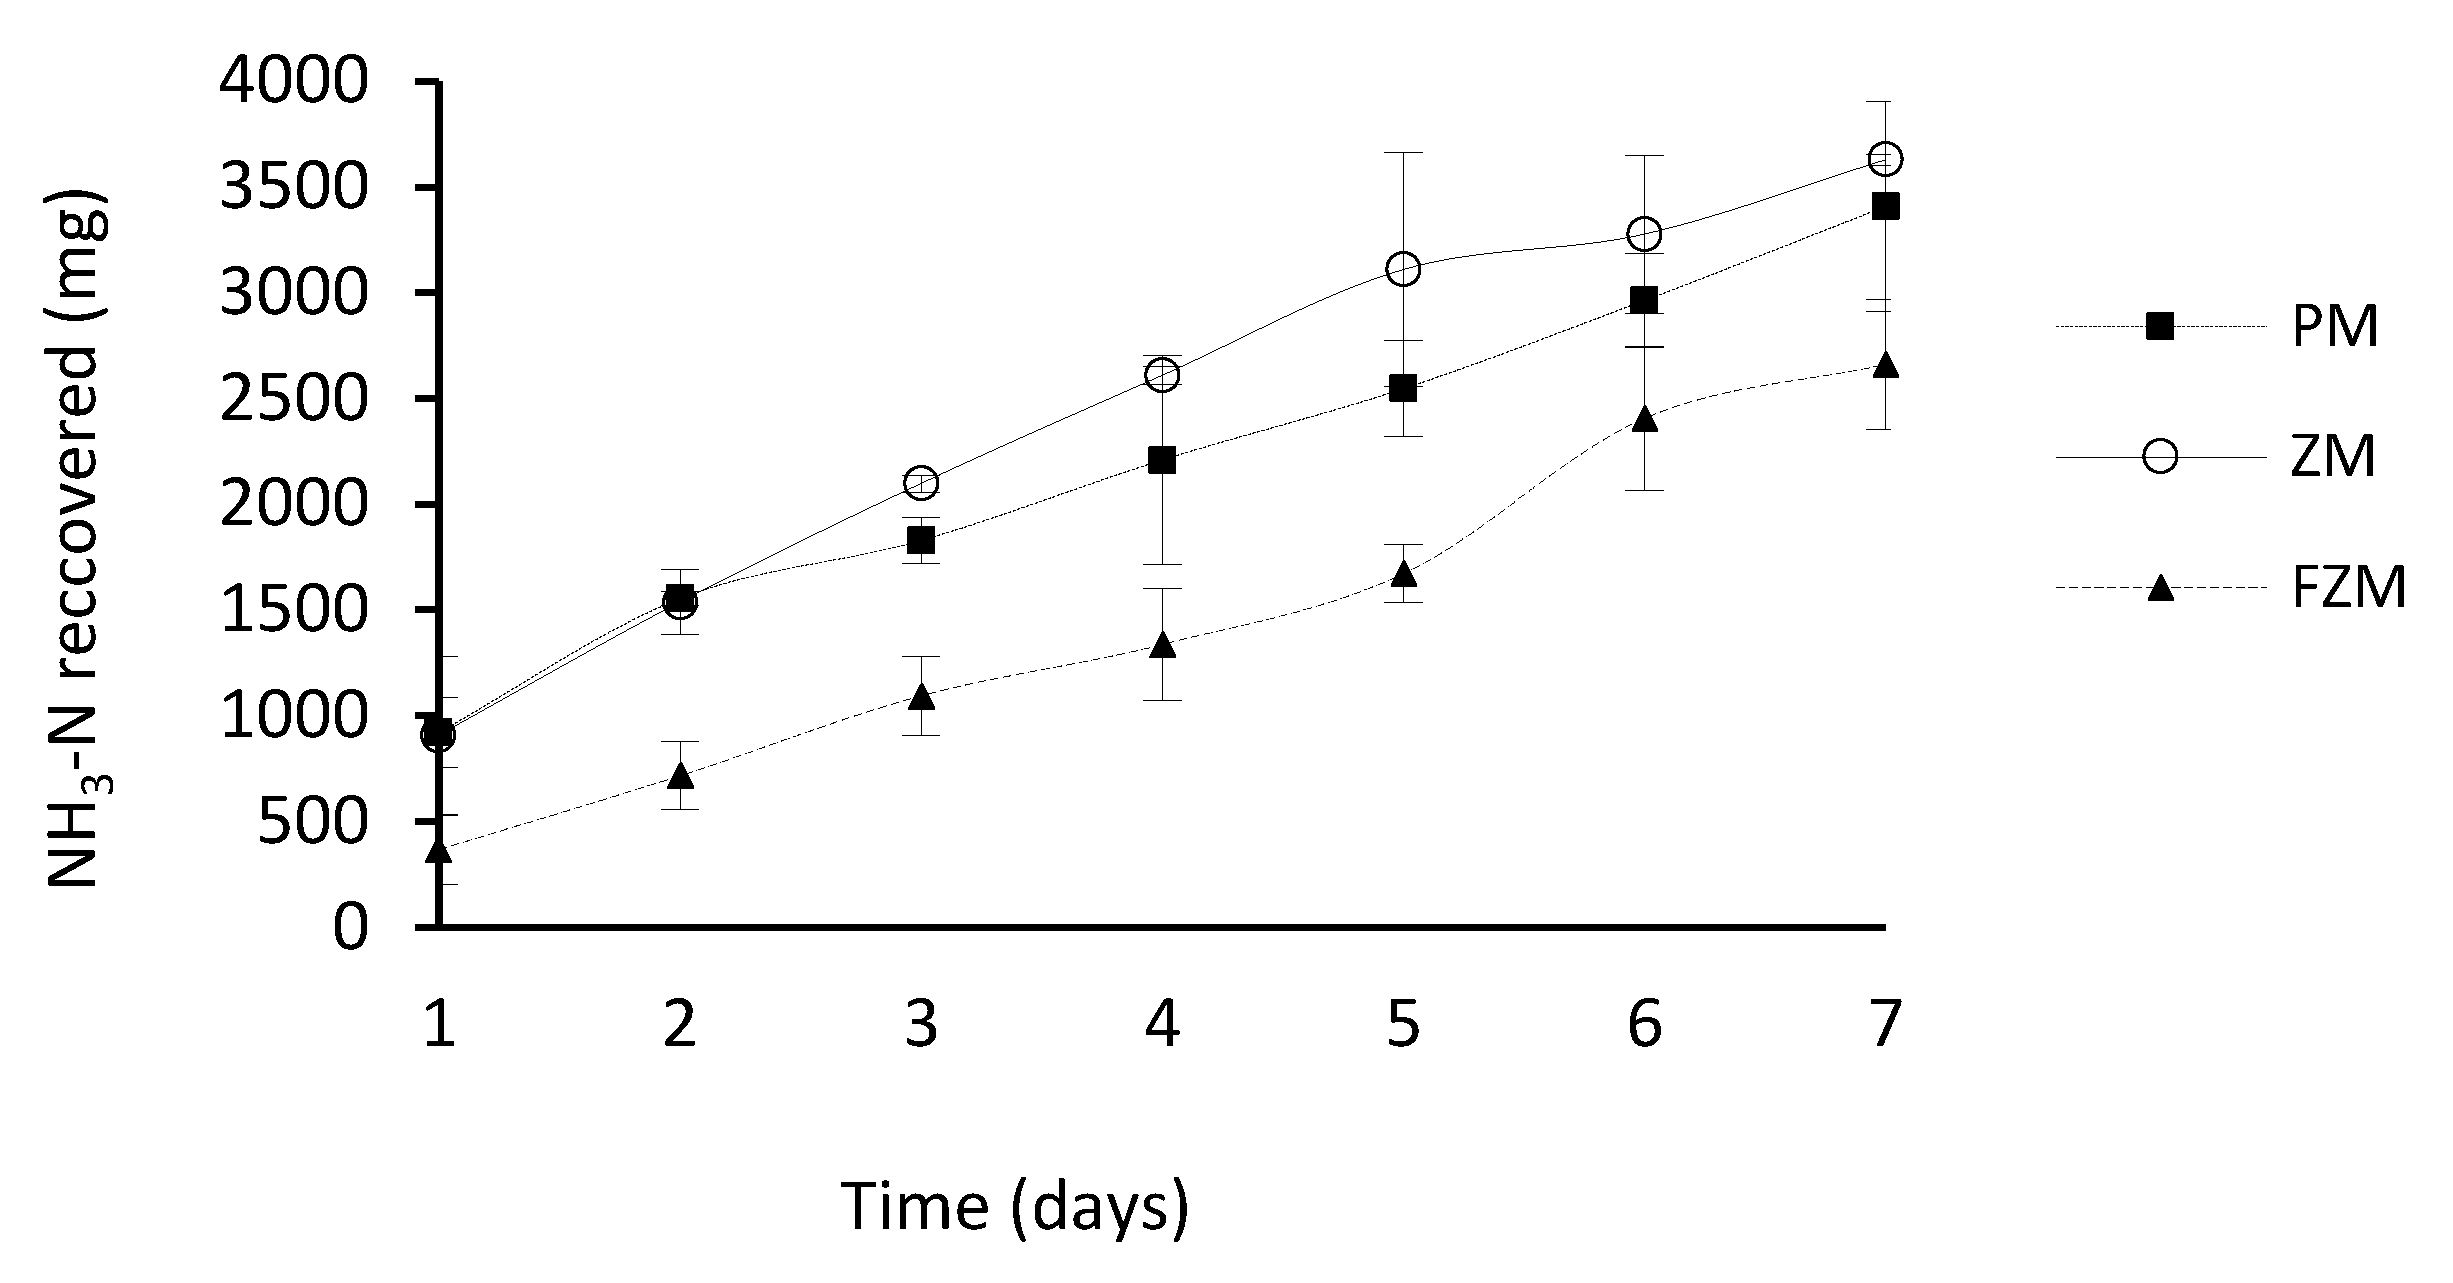
3.4. Effect of the Type of Membrane on Ammonia Capture

The total NH3–N mass emitted by the synthetic solution was similar in the three membrane systems: 5381 ± 451 mg N for PM membrane, 5260 ± 514 mg N for ZM, and 4764 ± 606 mg N for FZM (Table 3).
Corresponding percent N removals were 46 ± 4%, 45 ± 4%, and 41 ± 5%. Similarly, no differences were observed in the total mass of NH3–N present in the synthetic solutions at the end of the experiment (Figure 4).
The ammonia emission rate of the synthetic solution varied with time. There was a higher emission rate on the first day and a lower and almost constant emission rate in later days. For example, rates of emission the first day were 4138 ± 47 mg NH3–N·d−1 for PM, 3555 ± 433 mg NH3–N·d−1 for ZM, and 3342 ± 463 mg NH3–N·d−1 for FZM, and afterwards the rates of emission were 207 ± 83 for PM, 284 ± 158 for ZM, and 237 ± 24 mg NH3–N·d−1 for FZM. This emission behavior was also observed by Rothrock et al. [23] who noted that in the first 7 days, the concentration of NH4–N present in the synthetic source solution decreased faster, from 500 mg to 300 mg approximately. In contrast, from days 7 to 21, the concentration only decreased from 300 mg to 200 mg. The high recovery observed on the first day could be due to the high concentration of ammonium in the synthetic solutions. This generates a high concentration of ammonia in the gas phase. After the first day, a significant percentage of ammonium had been eliminated and, therefore, the driving force for transport decreased.
The masses of NH3–N recovered in the acidic N trapping solution were 3628 ± 27 mg, 3407 ± 49 mg, and 2661 ± 307 mg for ZM, PM, and FZM, respectively. At similar emission and capture conditions, the NH3–N mass recovered by FZM was lower due to a lower surface area compared to the membranes ZM and PM. The surface area was 4.2 times higher for PM and ZM compared to FZM. Surprisingly, the mass of NH3–N recovered was not affected by large differences in material density (0.45 to 0.95 g/cm3) between PM and ZM (Table 3), or by differences in porosity (5.6 to 21.8%), air permeability (2 to 10 L·min−1 cm−1 at 1 bar pressure), and wall thickness (0.8 to 1.2 mm). This was surprising because it is logical to think that higher NH3 capture should be obtained with higher membrane porosity and air permeability, and with smaller wall thickness [35]. However, in the range tested in the experiment, these characteristics did not affect mass of NH3 recovered by the membranes.
In all membrane systems, NH3–N accumulation in the acidic solution during the 7-day experimental period was linear (Figure 5). Capture rates (mg NH3–N d−1) were calculated based on the slope of the linear regressions; they were higher with PM and ZM (487 ± 71 and 518 ± 4 mg NH3–N d−1, respectively) with larger diameter and surface area, compared to FZM (380 ± 44 mg NH3–N d−1) with smallest diameter and surface area. The acidic solution had a similar composition of 0.3 ± 0.1% of nitrogen and 0.4 ± 0.1% of sulphur.
The NH3 recovery (%) for each type of membrane was calculated based on the relationship between the NH3–N mass recovered (final content of NH3–N in the trapping solution) and the NH3–N mass removed (difference between the initial and final content of NH3–N in synthetic solution). Percent recoveries were not different (p ≤ 0.05): PM = 63%, ZM membrane = 69%, and FZM = 57%. The percent recoveries were not quantitative (100%) probably because the rapid release of NH3 in the first day of the experiment exceeded the capacity of the membrane. Other authors such as Rothrock et al. [23] obtained similar results than under conditions of an NH3 emission flush. They achieved recoveries of NH3–N of 67.7%, 73.6%, and 76.2% with hydrated lime addition treatments of 0.4 w/v, 2 w/v, and 4 w/v to 300 g of poultry litter. Therefore, design of the membrane manifolds should consider possible situations of rapid release that may occur in filed situations such as disinfection of manure with alkali compounds.
On the other hand, when the NH3–N capture is expressed on a surface area basis (N-flux, Table 3), the results show additional insight on the best operating conditions for the membranes. The N-flux obtained in the membrane FZM with the smaller diameter (5.8 ± 0.7 mg N·cm−2·d−1) was significantly higher—approximately 3 times higher—compared with the N-flux obtained with the larger diameter membranes (1.8 ± 0.0 and 1.7 ± 0.2 mg N·cm−2·d−1 with ZM and PM, respectively). Rothrock et al. [23] also observed higher N-fluxes in membranes with a smaller diameter (1.37 g·m−2·d−1 N-flux for a membrane i.d. of 4.0 mm and acid flow 70–80 mL d−1 and 0.7 g·m−2·d−1 N-flux 0.70 for a membrane i.d. of 8.8 mm and same flow). Majd and Mukhtar [25] observed an N-flux of 0.2 g·m−2·d−1 in a suspended membrane system. However, higher ammonia fluxes have been obtained when the membranes were directly submerged in the liquid (liquid–liquid) instead of being suspended in the air (air–liquid). For example, Daguerre et al. [36] obtained N-fluxes of 7.1 to 8.9 g·m−2·d−1 placing the membrane manifold in liquid swine manure (4940 mg NH4–N L−1), and Fillingham et al. [37] obtained N-fluxes up to 51.0 g·m−2·d−1 using synthetic wastewaters containing 6130 NH4–N L−1 and NaOH to pH 8.5.
In this study (experiment 1), the same recirculation flow of the acidic solution (1.25 L h−1) was used with the three membranes with outside diameters ranging from 3 to 8.6 mm (inner diameters 1 to 7). As a result, the smaller diameter resulted in a higher fluid velocity inside the membrane (2653.9 cm min−1) compared to the higher diameter membranes (54.2 to 69.0 cm min−1) (Table 3) and a more frequent renovation of the acidic solution in the submerged membrane manifold.
The Reynolds number (Re) is used in fluid dynamics to describe the character of the flow (flow is laminar when Re < 2300 and viscous forces are dominant characterized by smooth fluid motion, and flow is turbulent when Re > 3000 and it is dominated by inertial forces and vortices). Although the fluid flow was laminar in all three cases (Re 64 to 415, Table 3), the higher fluid velocity and Re in FZM resulted in a higher N-flux. Therefore, to optimize the effectiveness of the ePTFE membranes to capture gaseous ammonia, the fluid velocity should be an important design consideration because this study showed that the efficiency can be increased 3 times with changes in acidic solution velocity.
A second experiment was done to further evaluate the positive effect of fluid velocity on N-flux. The study used two recirculation rates (0.83 and 1.5 L h−1), and two membrane types with different diameters (id 2.9 and 6.2 mm) but the same surface area (125.5 cm2) (Table 4). As a result, the fluid velocity inside the membranes gradually increased in the range of 49 to 315 cm min−1 and Re varied from 49 to 155. These modest differences in fluid velocity and Re (within laminar flow) significantly affected both the mass of NH3–N recovered in the acidic N trapping solution, and the N-flux (recovery per surface area). Figure 6 shows the relationship between N flux vs Re obtained using combined data from all seven treatments in experiments 1 and 2. It confirms that velocity of the circulating acidic solution should be an important design consideration to optimize the effectiveness of GPM system to capture gaseous ammonia.

4. Conclusions

Gas-permeable membranes (GPM) made of ePTFE were effective for the recovery of gaseous NH3 using a closed-loop system. A pH < 2 in the circulating acidic solution and a pH > 8 of the synthetic emitting solution were favorable for the process. At similar emission and capture conditions, the mass of NH3–N recovered by tubular GPMs was significantly increased by surface area, which was related to differences in the membrane diameter tested. However, the mass of NH3–N recovered was not affected by large differences in GPM material density (0.45 to 0.95 g/cm3), porosity (5.6 to 21.8%), air permeability (2 to 10 L·min−1 cm−1 at 1 bar pressure), and wall thickness (0.8 to 1.2 mm). A higher fluid velocity of the acidic solution significantly increased (approximately 3 times) the N-flux (mass N recovered per unit of surface area and time). Therefore, to optimize the effectiveness of the GPM system to capture gaseous ammonia, the fluid velocity is an important design consideration because this study showed that the efficiency can be increased 3 times with changes in acidic solution velocity.

Author Contributions

The conceptualization of this research was made by M.S.-H. and D.C.-C. The formal analysis, investigation, and data curation was conducted by M.S.-H., D.C.-C., and J.M.A.-R. Supervision was made by J.M.A.-R. and M.S.-B. Original draft was done by M.S.-H. Finally, review and editing of the manuscript were prepared by M.S.-H., J.M.A.-R., M.B.V., and M.S.-B.

Funding

The authors gratefully acknowledge funding by the European Union under the Project Life + “Ammonia Trapping” (LIFE15-ENV/ES/000284) “Development of membrane devices to reduce ammonia emissions generated by manure in poultry and pig farms”. Mention of trade names or commercial products in this article is solely for the purpose of providing specific information and does not imply recommendation or endorsement by the USDA.

Conflicts of Interest

The authors declare no conflict of interest.

References

  1. Beusen, A.; Bouwman, A.; Heuberger, P.; Van Drecht, G.; Van Der Hoek, K. Bottom-up uncertainty estimates of global ammonia emissions from global agricultural production systems. Atmos. Environ. 2008, 42, 6067–6077. [Google Scholar] [CrossRef]
  2. Erisman, J.W.; Bleeker, A.; Hensen, A.; Vermeulen, A. Agricultural air quality in Europe and the future perspectives. Atmos. Environ. 2008, 42, 3209–3217. [Google Scholar] [CrossRef] [Green Version]
  3. Sutton, M.A.; Oenema, O.; Erisman, J.W.; Leip, A.; van Grinsven, H.; Winiwarter, W. Too much of a good thing? Nature 2011, 472, 159–161. [Google Scholar] [CrossRef] [PubMed]
  4. Bouwman, A.F.; Van Vuuren, D.P.; Derwent, R.G.; Posch, M. A global analysis of acidification and eutrophication of terrestrial ecosystems. Water Air Soil Pollut. 2002, 141, 349–382. [Google Scholar] [CrossRef]
  5. EEA (European Environment Agency). European Union Emission Inventory Report 1990–2016 under the UNECE Convention on Long-Range Transboundary Air Pollution (LRTAP); ISNN: Cambridge, UK, 2018; pp. 1977–8449.
  6. MAPAMA (Ministerio de Agricultura y Pesca, Alimentación y Medio Ambiente). Inventario de Emisiones de España Emisiones de Contaminantes en el Marco de la Directiva de Techos Nacionales de Emisión Serie 1990–2015; MAPAMA: Madrid, Spain, 2017. Available online: http://www.mapama.gob.es/es/calidad-y-evaluacion-ambiental/temas/sistema-espanol-de-inventario-sei-/documentoresumeninventariotechosespana-serie1990-2015_tcm30-378885.pdf (accessed on 5 March 2019).
  7. EU (European Union). Directive (EU) 2016/2284 of the European Parliament and of the Council of 14 December 2016 on the Reduction of National Emissions of Certain Atmospheric Pollutants, Amending Directive 2003/35/EC and Repealing Directive 2001/81/EC; EU: Brussels, Belgium, 2016. [Google Scholar]
  8. Cho, M.S.; Ko, H.J.; Kim, D.; Kim, K.Y. On-site application of air cleaner emitting plasma ion to reduce airborne contaminants in pig building. Atmos. Environ. 2012, 63, 276–281. [Google Scholar] [CrossRef]
  9. Koerkamp, P.W.G.; Metz, J.H.M.; Uenk, G.H.; Phillips, V.R.; Holden, M.R.; Sneath, R.W.; Short, J.L.; White, R.P.; Hartung, J.; Seedorf, J.; et al. Concentration and emission of ammonia in livestock buildings in Northern Europe. J. Agric. Eng. Res. 1998, 70, 79–95. [Google Scholar] [CrossRef]
  10. Schauberger, G.; Piringer, M.; Heber, A.J. Odour emission scenarios for fattening pigs as input for dispersion models: A step from an annual mean Value to time series. Agric. Ecosyst. Environ. 2014, 193, 108–116. [Google Scholar] [CrossRef]
  11. García-González, M.C.; Vanotti, M.B. Recovery of ammonia from swine manure using gas-permeable membranes: Effect of waste strength and pH. Waste Manag. 2015, 38, 455–461. [Google Scholar] [CrossRef]
  12. Vanotti, M.B.; Szogi, A.A. Systems and Methods for Reducing Ammonia Emissions from Liquid Effluents and for Recovering Ammonia. U.S. Patent 9,005,333 B1, 29 October 2015. [Google Scholar]
  13. Vecino, X.; Reig, M.; Bhushan, B.; Gibert, O.; Valderrama, C.; Cortina, J.L. Liquid fertilizer production by ammonia recovery from treated ammonia-rich regenerated streams using liquid-liquid membrane contactors. Chem. Eng. J. 2019, 360, 890–899. [Google Scholar] [CrossRef]
  14. Adam, M.R.; Othman, M.H.; Samah, R.A.; Puteh, M.H.; Ismail, A.F.; Mustafa, A.; Rahman, M.A.; Jaafar, J. Current trends and future prospects of ammonia removal in wastewater: A comprehensive review on adsorptive membrane development. Sep. Purif. Technol. 2019, 213, 114–132. [Google Scholar] [CrossRef]
  15. Zhang, C.; Ma, J.; He, D.; Waite, T.D. Capacitive Membrane Stripping for Ammonia Recovery (CapAmm) from Dilute Wastewaters. Environ. Sci. Technol. 2018, 5, 43–49. [Google Scholar] [CrossRef]
  16. Vanotti, M.B.; Szogi, A.A. Use of Gas-Permeable Membranes for the Removal and Recovery of Ammonia from High Strength Livestock Wastewater. Proc. Water Environ. Fed. 2011, 2011, 659–667. [Google Scholar] [CrossRef]
  17. Nelson, N.O.; Mikkelsen, R.L.; Hesterberg, D.L. Struvite formation to remove phosphorus from anaerobic swine lagoon effluent. In Animal, Agricultural and Food Processing Wastes: Proceedings of the Eighth International Symposium; Moore, J.A., Ed.; American Society of Agricultural Engineers: St. Joseph, MI, USA, 2000; pp. 18–26. [Google Scholar]
  18. Zarebska, A.; Romero-Nieto, D.; Christensen, K.V.; Fjerbæk Søtoft, L.; Norddahl, B. Ammonium fertilizers production from manure: A critical review. Crit. Rev. Environ. Sci. Technol. 2015, 45, 1469–1521. [Google Scholar] [CrossRef]
  19. Szogi, A.A.; Vanotti, M.B.; Rothrock, M.J. Gaseous ammonia removal system. US Patent 8,906,332 B2, 9 December 2014. [Google Scholar]
  20. Chien, S.H.; Gearhart, M.M.; Villagarcía, S. Comparison of Ammonium Sulfate with Other Nitrogen and Sulfur Fertilizers in Increasing Crop Production and Minimizing Environmental Impact: A Review. Soil Sci. 2011, 176, 327–335. [Google Scholar] [CrossRef]
  21. Guo, Y.; Chen, J.; Hao, X.; Zhang, J.; Feng, X.; Zhang, H. A novel process for preparing expanded Polytetrafluoroethylene (ePTFE) micro-porous membrane through ePTFE/ePTFE co-stretching technique. J. Mater. Sci. 2007, 42, 2081–2085. [Google Scholar] [CrossRef]
  22. Rothrock, M.J.; Szögi, A.A.; Vanotti, M.B. Recovery of ammonia from poultry litter using flat gas permeable membranes. Waste Manage. 2013, 33, 1531–1538. [Google Scholar] [CrossRef] [PubMed]
  23. Rothrock, M.J.; Szögi, A.A.; Vanotti, M.B. Recovery of ammonia from poultry litter using gas permeable membranes. Trans. ASABE 2010, 53, 1267–1275. [Google Scholar] [CrossRef]
  24. Majd, A.M.S.; Mukhtar, S.; Kunz, A. Application of Diluted Sulfuric Acid for Manure Ammonia Extraction Using a Gas-Permeable Membrane; American Society of Agricultural and Biological Engineers: St. Joseph, MI, USA, 2012. [Google Scholar] [CrossRef]
  25. Majd, A.M.S.; Mukhtar, S. Ammonia Recovery Enhancement Using a Tubular Gas-Permeable Membrane System in Laboratory and Field-Scale Studies. Am. Soc. Agric. Biol. Eng. 2013, 56, 1951–1958. [Google Scholar] [CrossRef]
  26. Blet, V.; Pons, M.N.; Greffe, J.L. Separation of ammonia with a gas-permeable tubular membrane. Anal. Chim. Acta 1989, 219, 309–311. [Google Scholar] [CrossRef]
  27. Anthonisen, A.C.; Loehr, R.C.; Prakasam, T.B.S.; Srinath, E.G. Inhibition of nitrification by ammonia and nitrous acid. J. Water Pollut. Control Fed. 1976, 48, 835–852. [Google Scholar]
  28. Emerson, K.; Russo, R.C.; Lund, R.E.; Thurston, R.V. Aqueous Ammonia Equilibrium Calculations: Effect of pH and Temperature. J. Fish. Res. Board Can. 1975, 32, 4. [Google Scholar] [CrossRef]
  29. Lahav, O.; Mor, T.; Heber, A.J.; Molchanov, S.; Ramirez, J.C.; Li, C.; Broday, D.M. A new approach for minimizing ammonia emissions from poultry houses. Water Air Soil Pollut. 2008, 191, 183–197. [Google Scholar] [CrossRef]
  30. Dube, P.J.; Vanotti, M.B.; Szogi, A.A.; Garcia-González, M.C. Enhancing recovery of ammonia from swine manure anaerobic digester effluent using gas-permeable membrane technology. Waste Manag. 2016, 49, 372–377. [Google Scholar] [CrossRef] [PubMed] [Green Version]
  31. APHA; AWWA; WEF. Standard Methods for the Examination of Water and Wastewater, 21st ed.; American Public Health Association: Washington, DC, USA, 2005. [Google Scholar]
  32. Venkataraman, K.; Choate, W.T.; Torre, E.R.; Husung, R.D.; Batchu, H.R. Characterization studies of ceramic membranes. A novel technique using a Coulter Porometer. J. Membr. Sci. 1988, 39, 259. [Google Scholar] [CrossRef]
  33. SAS Institute. SAS/STAT User’s Guide, Ver. 9.2; SAS Inst.: Cary, NC, USA, 2008. [Google Scholar]
  34. Perfilov, V.; Fila, V.; Sanchez Marcano, J. A general predictive model for sweeping gas membrane distillation. Desalination 2018, 443, 285–306. [Google Scholar] [CrossRef]
  35. Schneider, I.M.; Marison, W.; Stockar, U. Principles of an efficient new method for the removal of ammonia from animal cell cultures using hydrophobic membranes. Enzym. Microb. Technol. 1994, 16, 957–963. [Google Scholar] [CrossRef]
  36. Daguerre-Martini, S.; Vanotti, M.B.; Rodriguez-Pastor, M.; Rosal, A.; Moral, R. Nitrogen recovery from wastewater using gas-permeable membranes: Impact of inorganic carbon content and natural organic matter. Water Res. 2018, 137, 201–210. [Google Scholar] [CrossRef] [Green Version]
  37. Fillingham, M.; VanderZaag, A.C.; Singh, J.; Burtt, S.; Crolla, A.; Kinsley, C.; MacDonald, J.D. Characterizing the performance of gas-permeable membranes as an ammonia recovery strategy from anaerobically digested dairy manure. Membranes 2017, 7, 59. [Google Scholar] [CrossRef]
Figure 1. Diagram of the process of ammonia uptake by the gas-permeable membrane in a closed loop.
Environments 06 00070 g001
Figure 2. Scanning electron microscopy (SEM) images for the ZM (a), PM (b), and FZM (c) ePTFE membranes showing typical elongated pores of different sizes structures. The images correspond to the inner surface of the tubular membranes. Images A and B were taken with 5000× magnification and the scale bar is equivalent to 20 μm in length. Image C were taken with 10,000× magnification and the scale bar is equivalent to 10 μm in length.
Environments 06 00070 g002
Figure 3. Weight loss of the acidic solution for each membrane type (experiment 1).
Environments 06 00070 g003
Figure 4. Mass of NH3–N remaining in the N emitting synthetic solution for three different types of ePTFE tubular membranes (experiment 1). Data points are means ± s.d. of duplicate experiments.
Environments 06 00070 g004
Figure 5. Mass of NH3–N recovered in the acidic solution for three different types of ePTFE tubular membranes (experiment 1). Data points are means ± s.d. of duplicate experiments.
Environments 06 00070 g005
Figure 6. Ammonia flux (mg N per cm2 of membrane surface per day) through the gas-permeable membrane as affected by changes in Reynolds number (combined data from experiments 1 and 2). Data points are means ± s.d. of duplicate experiments.
Environments 06 00070 g006
Table 1. Characteristics of the membranes.
Membrane CharacteristicsZMFZMPMPMZM4
Experiment 1Experiment 2
Length (cm)104.070.0104.046.3100.0
Outer diameter (mm)8.63.08.68.64.1
Width of the wall (mm)0.81.01.21.20.6
Average pore size length (µm) *27.6 ± 8.35.8 ± 0.814.7 ± 2.314.7 ± 2.3-
Average pore size width (µm) *7.6 ± 0.90.7 ± 0.15.5 ± 0.65.5 ± 0.6-
Polymer density (g/cm3)0.451.090.950.950.95
Absorption surface (cm2)282.366.0282.3125.7125.7
The membrane abbreviations are ZM: Zeus membrane (8.6 mm outer diameter), FZM: Zeus membrane (3.0 mm outer diameter), PM: Prodysol membrane (8.6 mm outer diameter), ZM4: Zeus membrane (4.1 mm outer diameter). * The membrane pores of the expanded polytetrafluoroethylene (ePTFE) membranes were elongated (Figure 2). Pore sizes were reported for both length and width by measuring 10 pores in the SEM.
Table 2. Values of number of pores, porosity, water permeability, and MFP (mean flow pore) of ZM and PM membranes in experiment 1.
Type of MembraneN° pores (pores/m2)Porosity (%)Water permeability (L·min−1)Air permeability (L·min−1·cm2)MFP (µm)
ZM1.2·× 1011 ± 4.1·× 101021.8 ± 3.22.5·× 10−7 ± 6.8·× 10−9 10–25–40 a1.7 ± 0.1
PM5.2·× 1010 ± 1.4·× 1010 5.6 ± 0.91.3·×10−7 ± 2.0·×10−82–5–10 a1.2 ± 0.1
(a) The air permeability was estimated at three pressures (1, 2, and 3 bars of pressure).
Table 3. Mass of NH3–N removal, NH3–N recovered by gas-permeable membranes, and N-flux with varied polymer density, surface area, and acidic solution velocity (experiment 1).
Type of Membranee-PTFE Density (g cm−3)i.d. 1 (mm)Acidic Solution Velocity 2 (cm min−1)Surface Area (cm2)NH3–N Mass Removed 3 (mg)NH3–N Mass Recovered (mg)N flux (mg N·cm−2·d−1)
PM0.956.269282.35381 a 43407 a1.7 b
ZM0.457.054282.35260 a3628 a1.8 b
FZM1.091.0265466.04764 a2661 b5.8 a
1 i.d. = inner diameter of the tubular membrane; 2 acidic solution velocity inside the tubular membrane. Flow rate was constant across membranes (1.25 L/h). Reynolds numbers were 73, 64, and 415 for PM, ZM, and FZM; 3 N mass removed from the N emitting synthetic solution; 4 values in a column followed by the same letter are not significantly different (p ≤ 0.05).
Table 4. Effect of acidic solution velocity on NH3–N recovered and N-flux of gas–permeable membranes (experiment 2).
Type of Membranee-PTFE Density (g cm3)i.d. 1 (mm)Surface Area (cm2)Acidic Solution Flow Rate (L h−1)Acidic Solution Velocity 2 (cm/min)Reynolds Number 3NH3–N Mass Recovered (mg)N Flux (mg N·cm−2·d−1)
PM0.956.2125.70.8346493162 bc 41.8 bc
PM0.956.2125.71.2569732780 c1.6 c
ZM40.952.9125.70.832101043686 ab2.1 b
ZM40.952.9125.71.253151554444 a2.5 a
1 i.d. = inner diameter of the tubular membrane; 2 acidic solution velocity inside the tubular membrane; 3 Reynolds number (Re) = v.l/ν, where v = velocity of the fluid (m/s), l = tube i.d. (m), and ν = kinematic viscosity of the liquid at 20 °C (9.79 × 10⁻⁷ m2/s); 4 values in a column followed by the same letter are not significantly different (p ≤ 0.05).

