MODIS-Based Investigation of Flood Areas in Southern Cambodia from 2002–2013


 ,
,
Abstract
1. Introduction
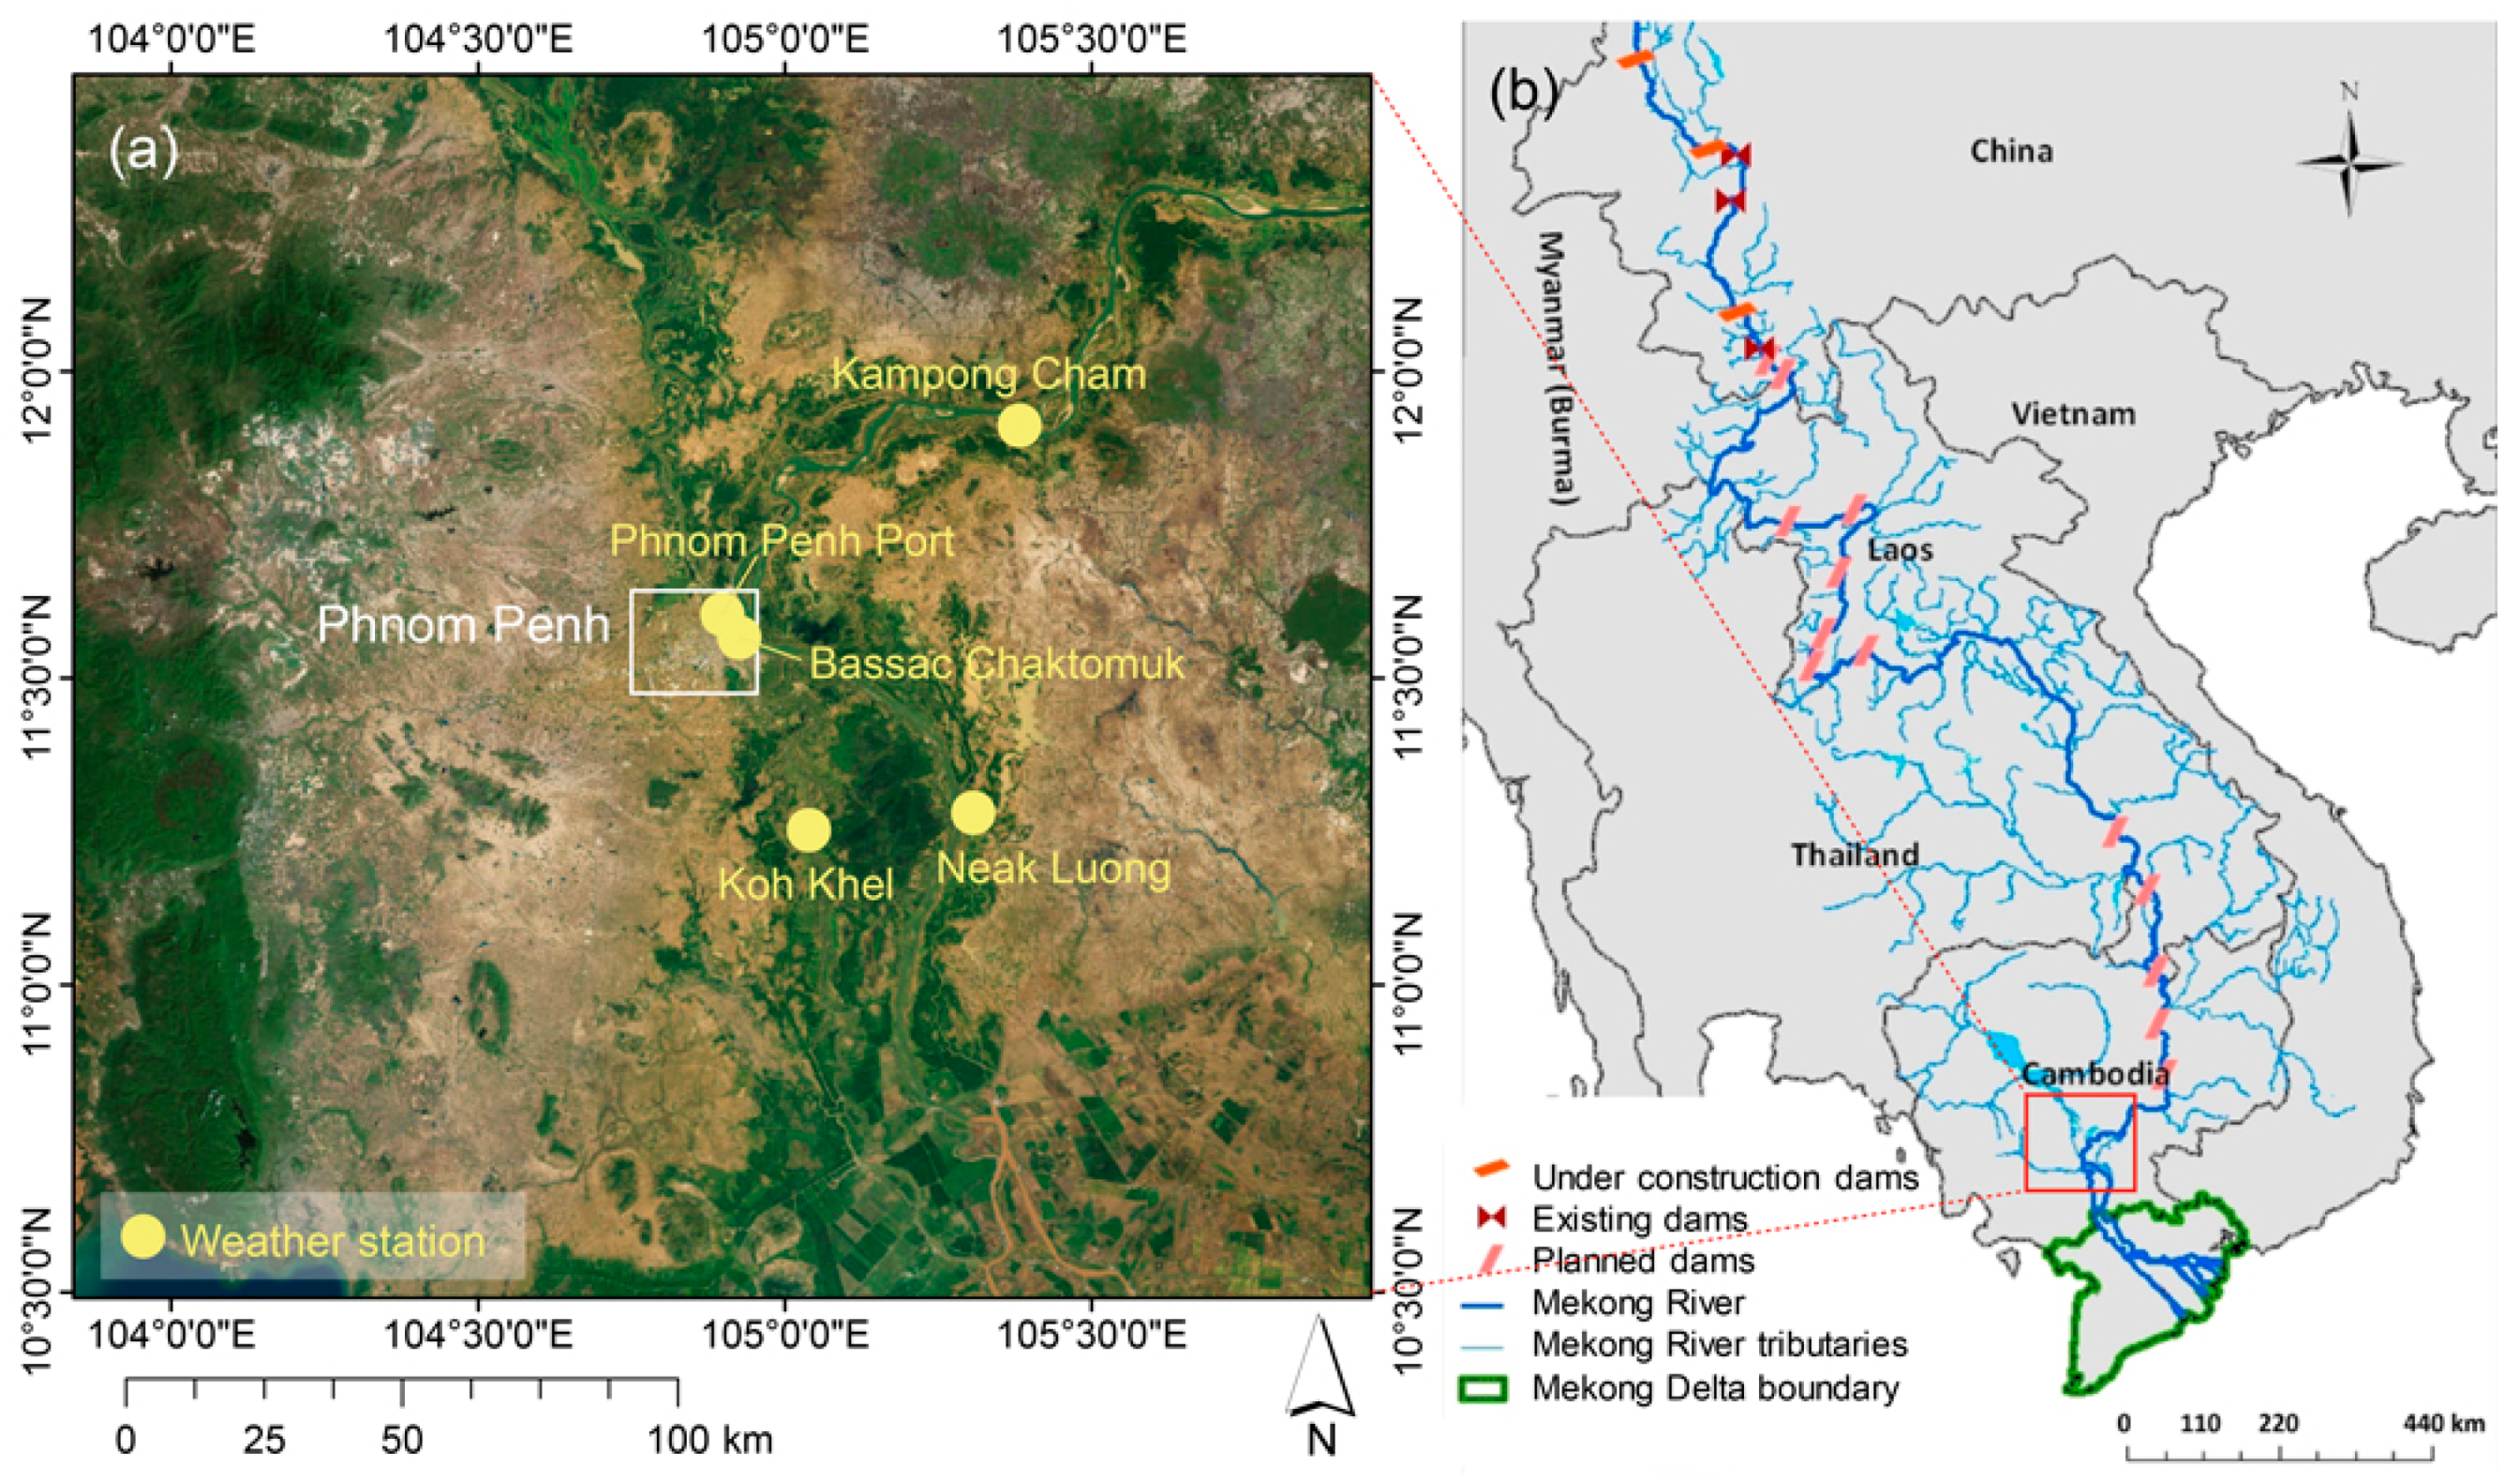
2. Study Area
3. Data Set
3.1. MODIS Data
3.2. Landsat Data
3.3. Daily Water Level
4. Methods
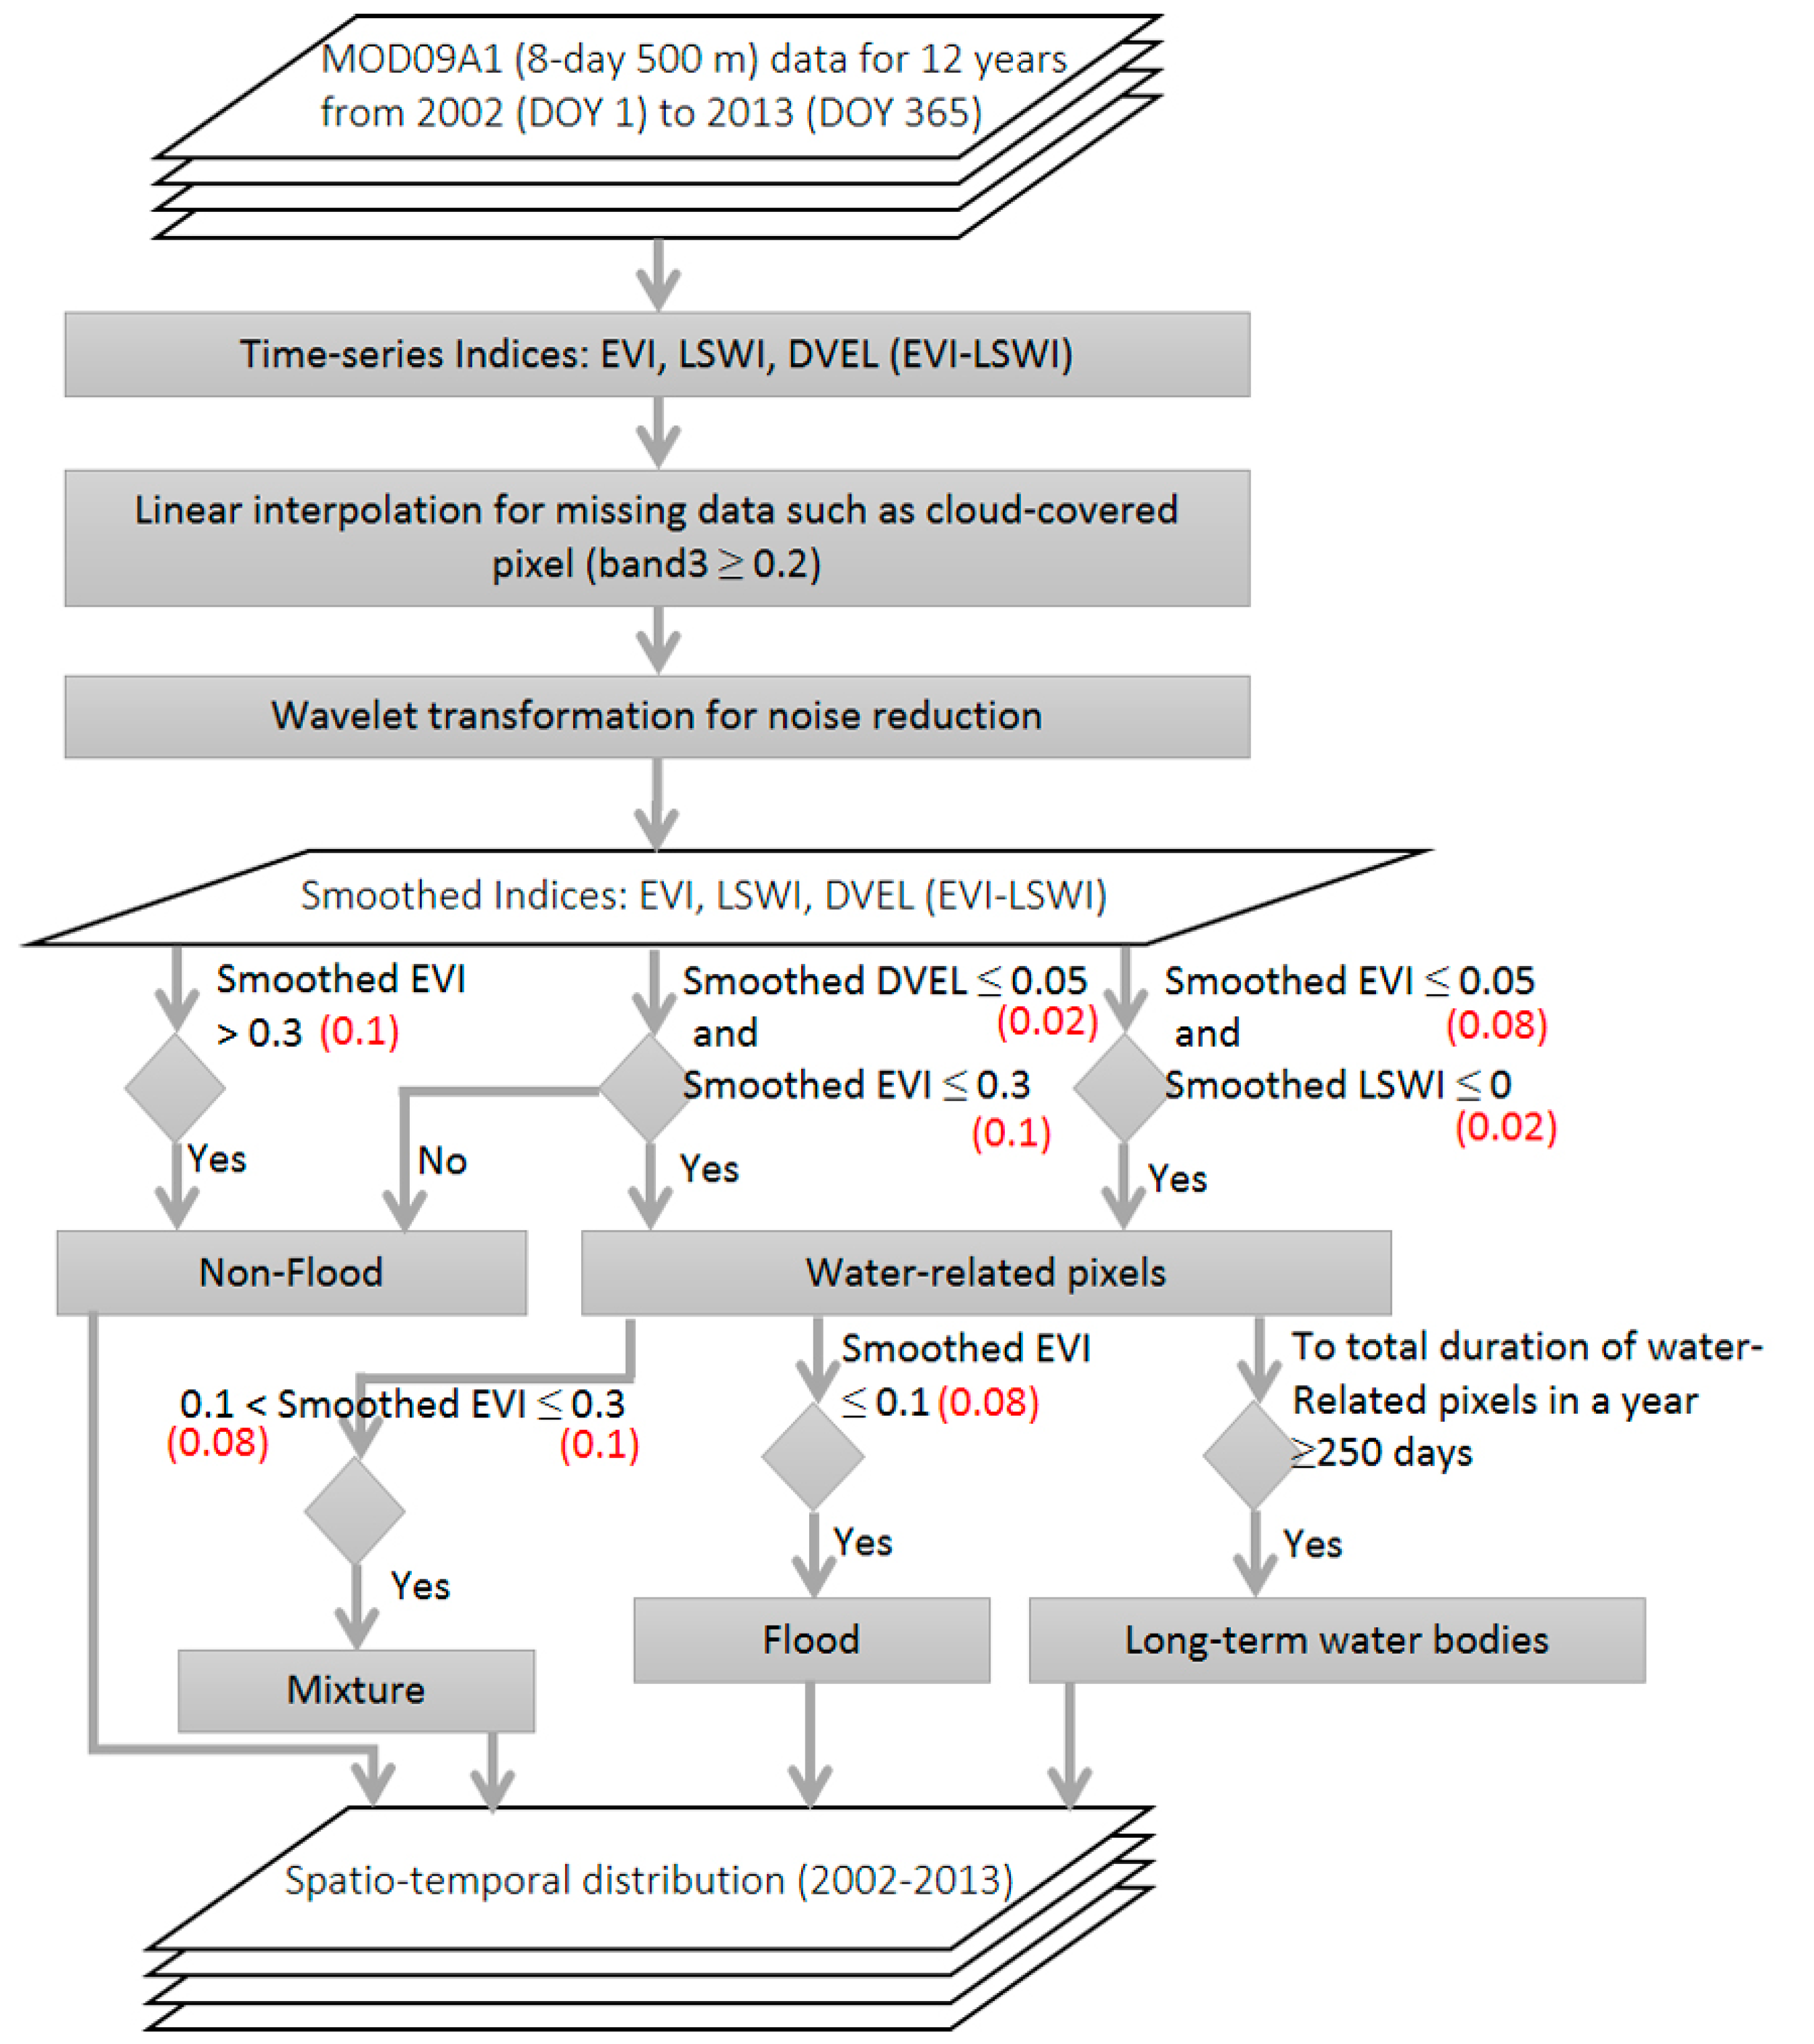
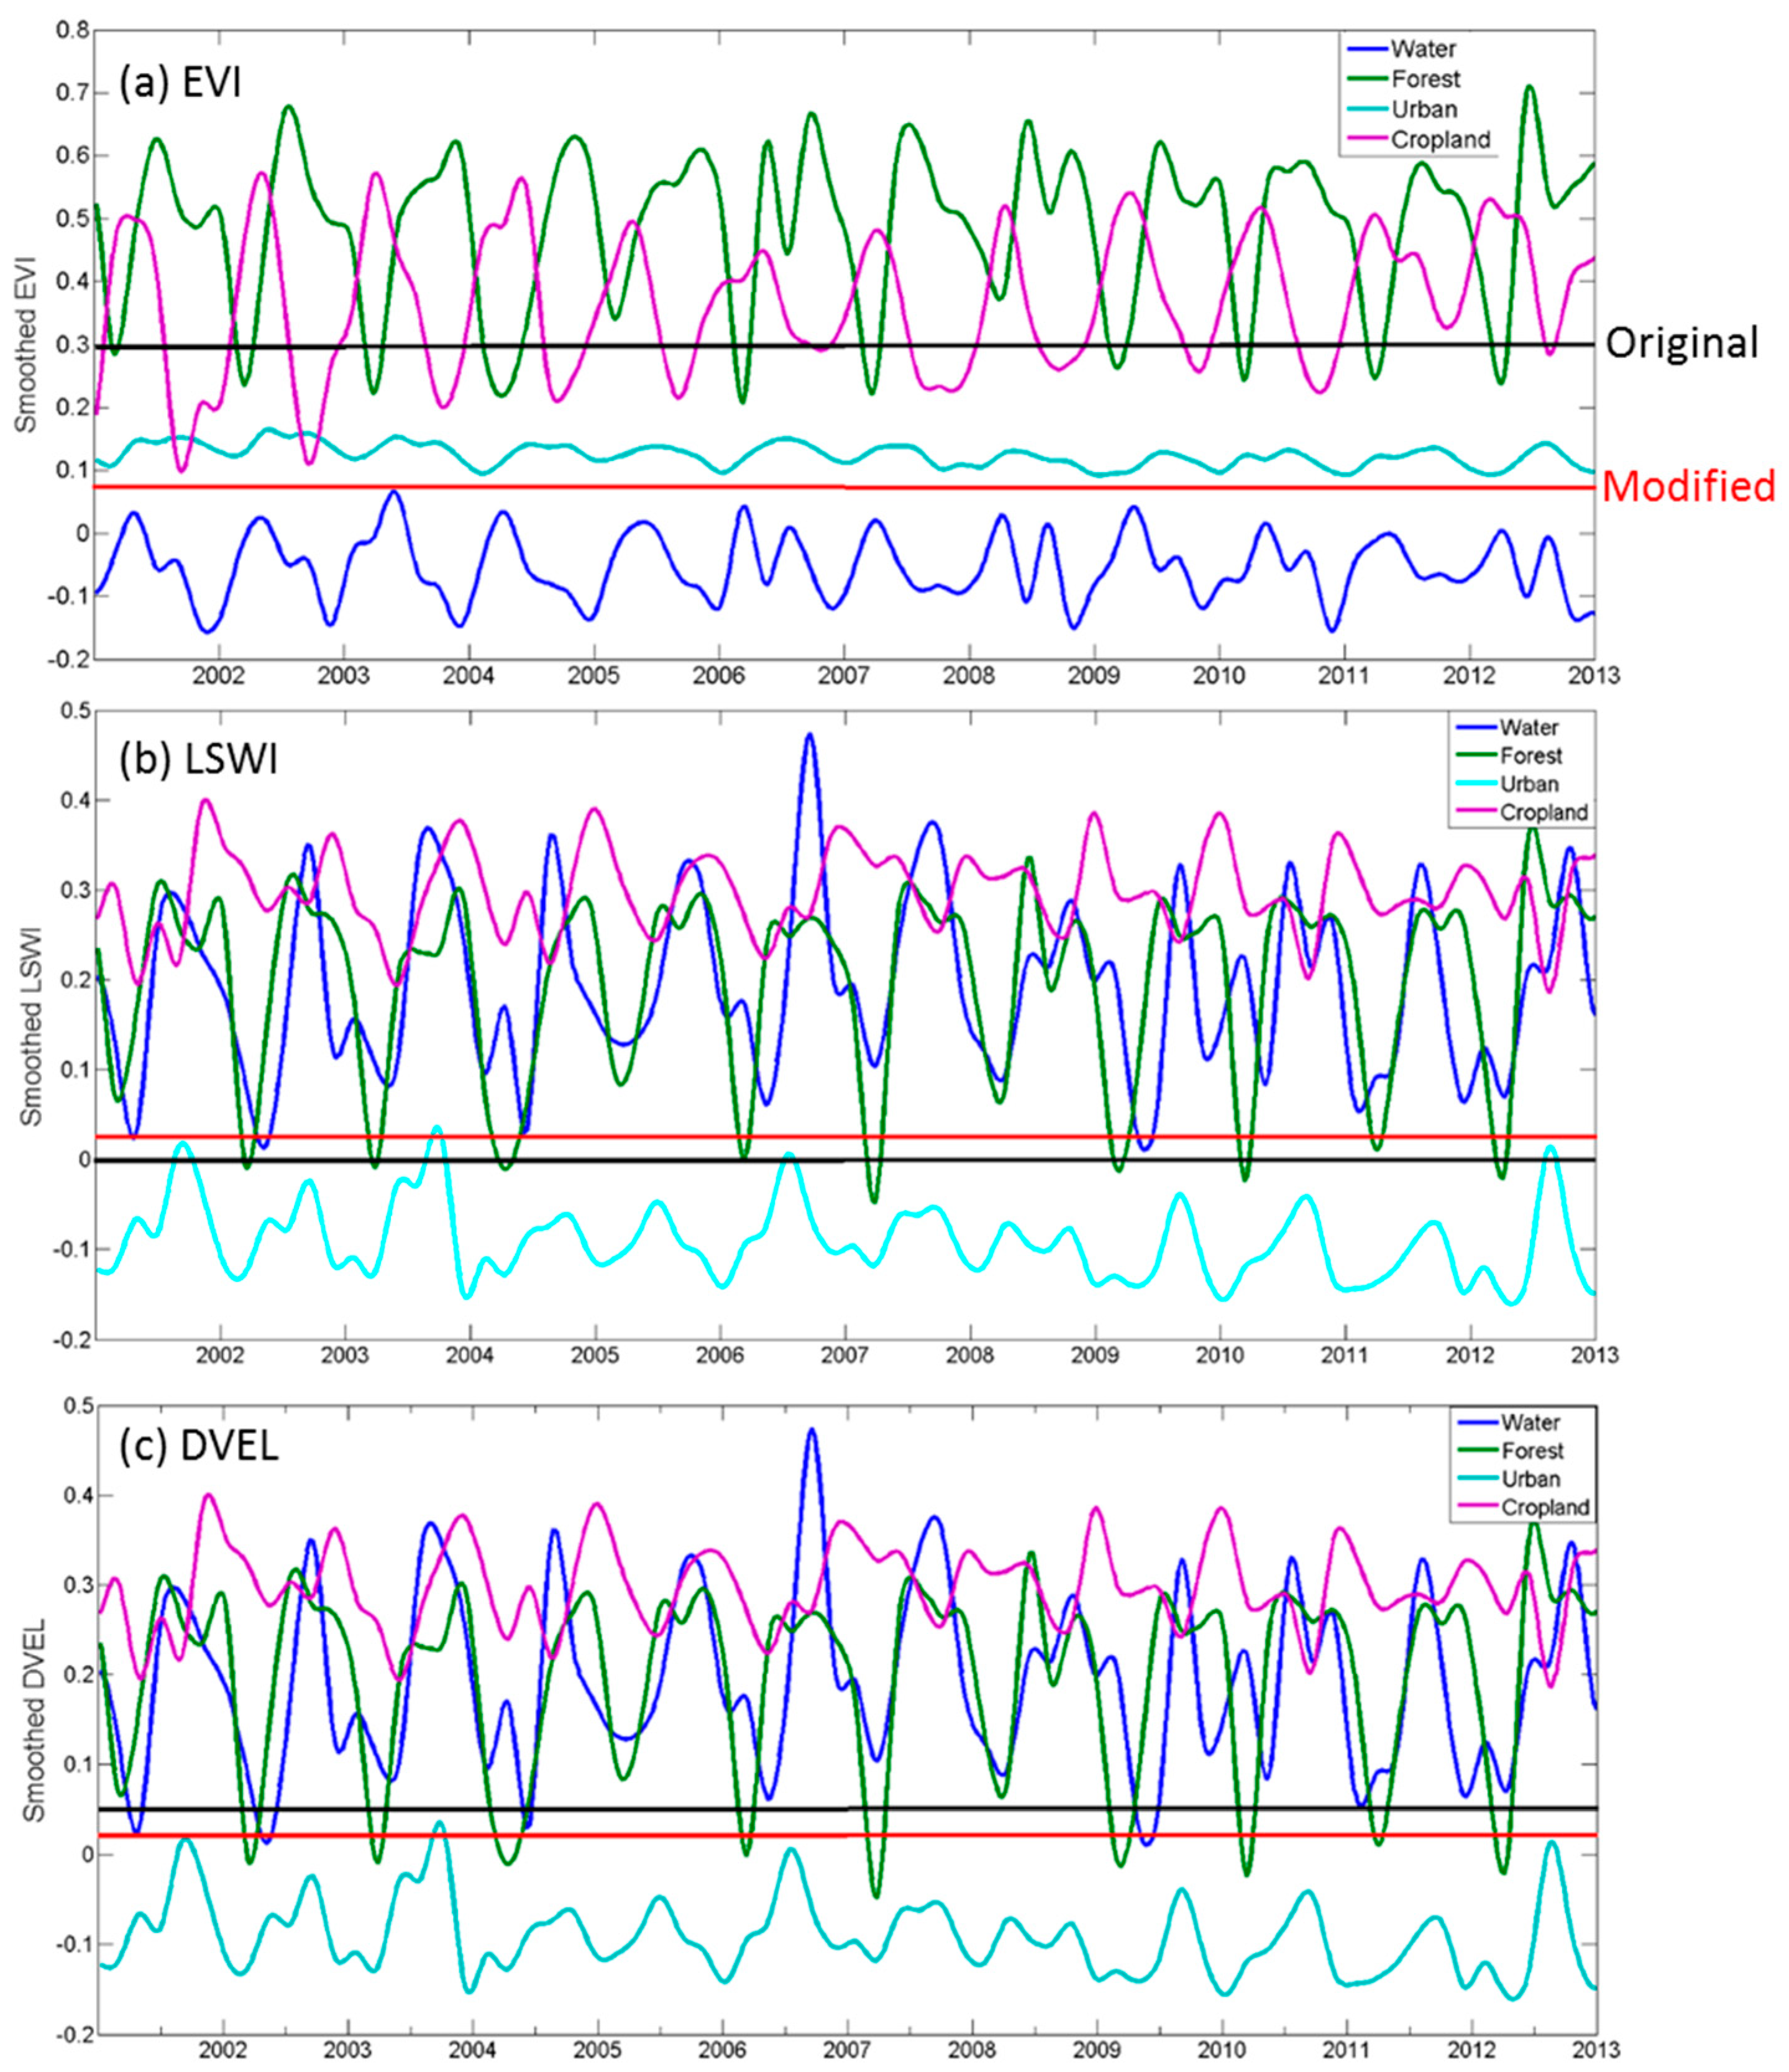
4.1. Detecting Water Surface Using MODIS Data with WFFI
4.2. Validation with Landsat Data
4.3. Start and End Dates of Flooding
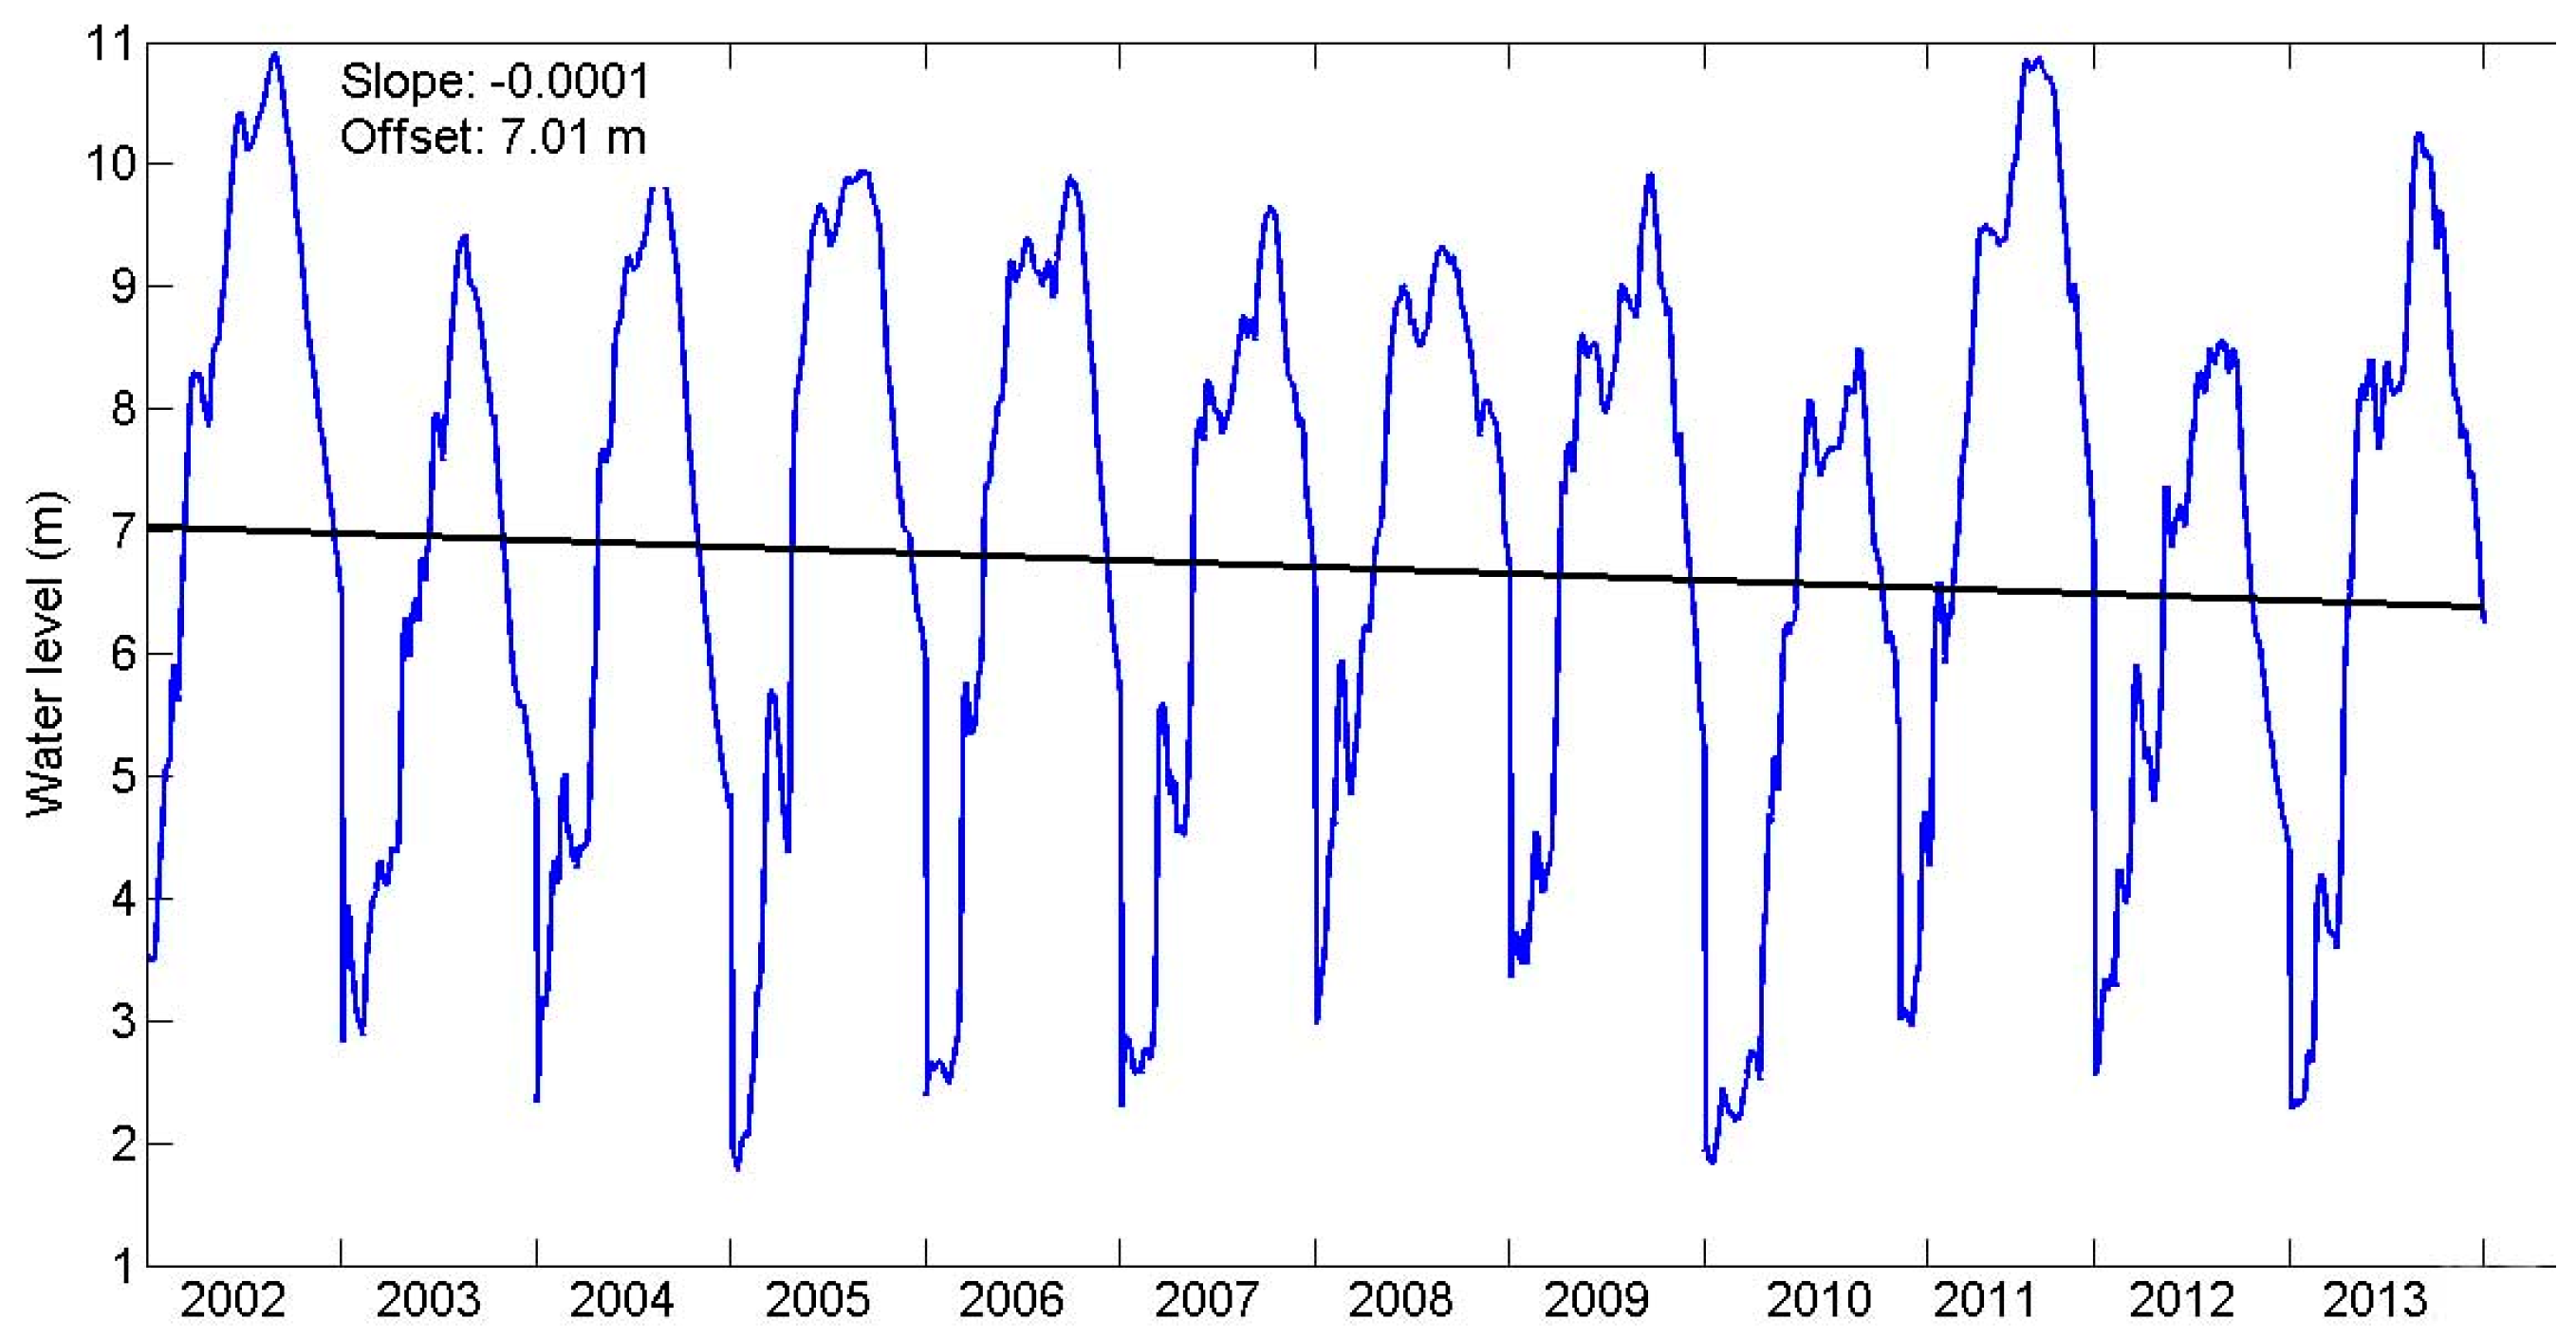
4.4. Water Level Trends
5. Results
5.1. Detecting Flood Areas
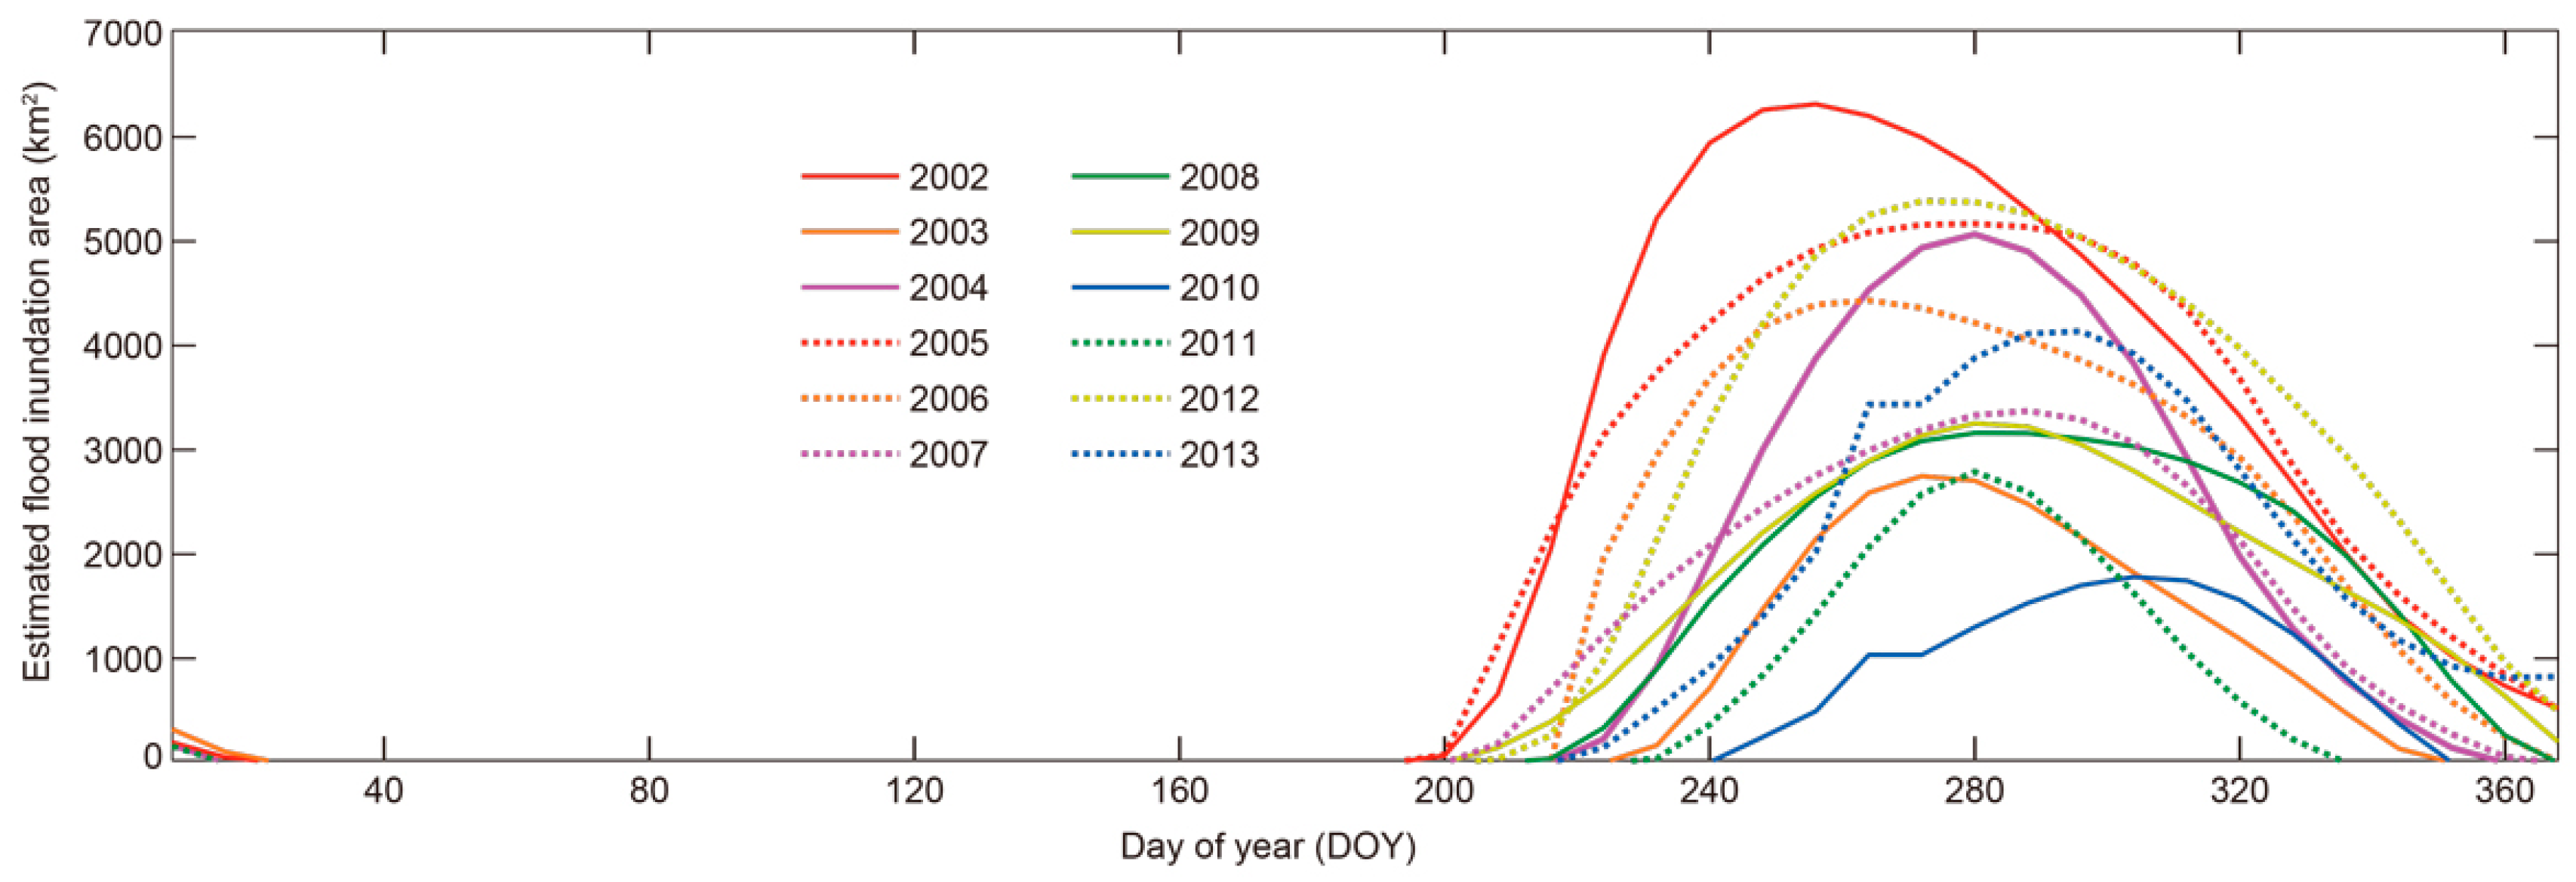
5.2. Temporal Characteristics of Annual Floods and Water Levels
5.3. Land Cover and Water Body Changes between 2002 and 2012
6. Conclusions
Author Contributions
Funding
Acknowledgments
Conflicts of Interest
References
- Cambodia, R.G. Post-Flood Early Recovery Need Assessment Report; United Nations Development Programme (UNDP): Phnom Penh, Cambodia, 2014. [Google Scholar]
- Oh, M.W.; Komatsu, S. Characterization of proteins in soybean roots under flooding and drought stresses. J. Proteomics 2015, 114, 161–181. [Google Scholar] [CrossRef] [PubMed]
- Kamal, A.H.M.; Rashid, H.; Sakata, K.; Komatsu, S. Gel-free quantitative proteomic approach to identify cotyledon proteins in soybean under flooding stress. J. Proteomics 2015, 112, 1–13. [Google Scholar] [CrossRef]
- Asada, H.; Matsumoto, J.; Rahman, R. Impact of recent severe floods on rice production in Bangladesh. Geogr. Rev. Jpn. 2005, 78, 783–793. [Google Scholar] [CrossRef]
- Junk, W.J.; Bayley, P.B.; Sparks, R.E. The flood pulse concept in river-floodplain-systems. Can. J. Fish. Aquat. Sci. 1989, 106, 110–127. [Google Scholar]
- Seiler, R.; Schmidt, J.; Diallo, O.; Csaplovics, E. Flood monitoring in a semi-arid environment using spatially high resolution radar and optical data. J. Environ. Manage. 2009, 90, 2121–2129. [Google Scholar] [CrossRef]
- Mallinis, G.; Gitas, I.Z.; Giannakopoulos, V.; Maris, F.; Tsakiri-Strati, M. An object-based approach for flood area delineation in a transboundary area using ENVISAT ASAR and LANDSAT TM data. Int. J. Digit. Earth 2013, 6, 124–136. [Google Scholar] [CrossRef]
- Henry, J.B.; Chastanet, P.; Fellah, K.; Desnos, Y.L. Envisat multi-polarized ASAR data for flood mapping. Int. J. Remote Sens. 2006, 27, 1921–1929. [Google Scholar] [CrossRef]
- Evans, T.L.; Costa, M.; Telmer, K.; Silva, T.S.F. Using ALOS/PALSAR and RADARSAT-2 to Map Land Cover and Seasonal Inundation in the Brazilian Pantanal. IEEE J. Sel. Top. Appl. Earth Obs. Remote Sens. 2010, 3, 560–575. [Google Scholar] [CrossRef]
- Xiao, X.; Boles, S.; Frolking, S.; Salas, W.; Moore, B.; Li, C.; He, L.; Zhao, R. Observation of flooding and rice transplanting of paddy rice fields at the site to landscape scales in China using VEGETATION sensor data. Int. J. Remote Sens. 2002, 23, 3009–3022. [Google Scholar] [CrossRef]
- Dao, P.D.; Liou, Y.A. Object-based flood mapping and affected rice field estimation with landsat 8 OLI and MODIS data. Remote Sens. 2015, 7, 5077–5097. [Google Scholar] [CrossRef]
- Sakamoto, T.; Cao, P.V.; Nguyen, N.V.; Kotera, A.; Yokozawa, M. Agro-ecological interpretation of rice cropping systems in flood-prone areas using MODIS imagery. Photogramm. Eng. Remote Sensing 2009, 75, 413–424. [Google Scholar] [CrossRef]
- Sakamoto, T.; Van Nguyen, N.; Ohno, H.; Ishitsuka, N.; Yokozawa, M. Spatio-temporal distribution of rice phenology and cropping systems in the Mekong Delta with special reference to the seasonal water flow of the Mekong and Bassac rivers. Remote Sens. Environ. 2006, 100, 1–16. [Google Scholar] [CrossRef]
- Sakamoto, T.; Van Phung, C.; Kotera, A.; Nguyen, K.D.; Yokozawa, M. Analysis of rapid expansion of inland aquaculture and triple rice-cropping areas in a coastal area of the Vietnamese Mekong Delta using MODIS time-series imagery. Landsc. Urban Plan. 2009, 92, 34–46. [Google Scholar] [CrossRef]
- Valavanis, V.D.; Pierce, G.J.; Zuur, A.F.; Palialexis, A.; Saveliev, A.; Katara, I.; Wang, J. Modelling of essential fish habitat based on remote sensing, spatial analysis and GIS. Hydrobiologia 2008, 612, 5–20. [Google Scholar] [CrossRef]
- Sakamoto, T.; Van Nguyen, N.; Kotera, A.; Ohno, H.; Ishitsuka, N.; Yokozawa, M. Detecting temporal changes in the extent of annual flooding within the Cambodia and the Vietnamese Mekong Delta from MODIS time-series imagery. Remote Sens. Environ. 2007, 109, 295–313. [Google Scholar] [CrossRef]
- Islam, A.S.; Bala, S.K.; Haque, M.A. Flood inundation map of Bangladesh using MODIS time-series images. J. Flood Risk Manag. 2010, 3, 210–222. [Google Scholar] [CrossRef]
- Doyle, C. City of Water: Architecture, Infrastructure and the Floods of Phnom Penh. Available online: https://www.academia.edu/2502352/City_of_Water_Architecture_Urbanism_and_the_Floods_of_Phnom_Penh (accessed on 20 April 2019).
- Dwyer, J.; Schmidt, G. The MODIS Reprojection Tool. In Earth Science Satellite Remote Sensing; Qu, J.J., Gao, W., Kafatos, M., Murphy, R.E., Salomonson, V.V., Eds.; Springer: Berlin/Heidelberg, Germany, 2007; pp. 162–177. ISBN 978-3-540-37294-3. [Google Scholar]
- Herrmann, H.; Bucksch, H. Global Land Cover Facility. Available online: http://www.landcover.org/ (accessed on 20 April 2019).
- Hui, F.; Xu, B.; Huang, H.; Yu, Q.; Gong, P. Modelling spatial-temporal change of Poyang Lake using multitemporal Landsat imagery. Int. J. Remote Sens. 2008, 29, 5767–5784. [Google Scholar] [CrossRef]
- Jain, S.K.; Singh, R.D.; Jain, M.K.; Lohani, A.K. Delineation of flood-prone areas using remote sensing techniques. Water Resour. Manag. 2005, 19, 333–347. [Google Scholar] [CrossRef]
- Ordoyne, C.; Friedl, M.A. Using MODIS data to characterize seasonal inundation patterns in the Florida Everglades. Remote Sens. Environ. 2008, 112, 4107–4119. [Google Scholar] [CrossRef]
- Ouma, Y.; Tateishi, R. A water index for rapid mapping of shoreline changes of five East African Rift Valley lakes: An empirical analysis using Landsat TM and ETM+ data. Int. J. Remote Sens. 2006, 27, 3153–3181. [Google Scholar] [CrossRef]
- Xu, H. Modification of normalised difference water index (NDWI) to enhance open water features in remotely sensed imagery. Int. J. Remote Sens. 2006, 27, 3025–3033. [Google Scholar] [CrossRef]
- Ticehurst, C.; Guerschman, J.P.; Chen, Y. The strengths and limitations in using the daily MODIS open water likelihood algorithm for identifying flood events. Remote Sens. 2014, 6, 11791–11809. [Google Scholar] [CrossRef]
- Ji, L.; Zhang, L.; Wylie, B. Analysis of Dynamic Thresholds for the Normalized Difference Water Index. Photogramm. Eng. Remote Sens. 2013, 75, 1307–1317. [Google Scholar] [CrossRef]
- Du, Y.; Zhang, Y.; Ling, F.; Wang, Q.; Li, W.; Li, X. Water bodies’ mapping from Sentinel-2 imagery with Modified Normalized Difference Water Index at 10-m spatial resolution produced by sharpening the swir band. Remote Sens. 2016, 8, 354. [Google Scholar] [CrossRef]
- Ryu, J.-H.; Won, J.-S.; Min, K.D. Waterline Extraction from Landsat TM Data in a Tidal Flat: A Case Study in Gomso Bay, Korea. Remote Sens. Environ. 2002, 83, 442. [Google Scholar]
- Frazier, P.S.; Page, K.J. Water body detection and delineation with Landsat TM data. Photogramm. Eng. Remote Sens. 2000, 66, 1461–1467. [Google Scholar]
- Ogilvie, A.; Belaud, G.; Delenne, C.; Bailly, J.-S.; Bader, J.-C.; Oleksiak, A.; Ferry, L.; Martin, D. Decadal monitoring of the Niger Inner Delta flood dynamics using MODIS optical data. J. Hydrol. 2015, 523, 368–383. [Google Scholar] [CrossRef]
- McFeeters, S.K. The use of the Normalized Difference Water Index (NDWI) in the delineation of open water features. Int. J. Remote Sens. 1996, 17, 1425–1432. [Google Scholar] [CrossRef]
- Hagiwara, T.; Kazama, S.; Sawamoto, M. Relationship Between Inundation Area and Irrigation Area on Flood Control in the Lower Mekong. In Advances in Hydraulics and Water Engineering; World Scientific Publishing Company: Singapore, 2010; Volume 1, pp. 590–595. [Google Scholar]
- Arias, M.E.; Cochrane, T.A.; Piman, T.; Kummu, M.; Caruso, B.S.; Killeen, T.J. Quantifying changes in flooding and habitats in the Tonle Sap Lake (Cambodia) caused by water infrastructure development and climate change in the Mekong Basin. J. Environ. Manage. 2012, 112, 53–66. [Google Scholar] [CrossRef]
- Tada, M.; Huang, W.; Kobayashi, S.; Tanji, H. Water resource exploitation of the Mekong river basin and the influences on the inland fisheries of Cambodia. In Proceedings of the Fourteenth Biennial Conference of the International Institute of Fisheries Economics & Trade, Nha Trang, Vietnam, 22–25 July 2008. [Google Scholar]
- Pearse-Smith, S.W.D. The Impact of Continued Mekong Basin Hydropower Development on Local Livelihoods. Cons. J. Sustain. Dev. 2012, 7, 62–75. [Google Scholar] [CrossRef]
- Senevirathne, N.; Mony, K.; Samarakoon, L.; Hazarika, M.K. Land Use/Land Cover Change Detection of Tonle Sap Watershed, Cambodia. In Proceedings of the 31st Asian Conference on Remote Sensing, Hanoi, Vietnam, 1–5 November 2014. [Google Scholar]
- Bansok, R.; Phirun, N.; Chhun, C. Development and Climate Change Project: The Case of Cambodia; CDRI Working Paper Series; Cambodia Development Resource Institute (CDRI): Phnom Penh, Cambodia, 2011. [Google Scholar]
- Chinvanno, S. Information for sustainable development in light of climate change in Mekong River Basin. Southeast Asia START Reg. Cent. Bangkok Thail. 2004, 108–115. [Google Scholar]
- Eastham, J.; Mpelasoka, F.; Ticehurst, C.; Dyce, P.; Ali, R.; Kirby, M. Mekong River Basin Water Resources Assessment: Impacts of Climate Change. Csiro 2008, 153. [Google Scholar]


| Satellite/Sensor | Date (Day of Year (DOY)) | Overall Accuracy (%) | |
|---|---|---|---|
| Original WFFI | Modified WFFI | ||
| Landsat 7/ETM+ | 3 January 2002 (003) | 30.61 | 82.11 |
| 20 February 2002 (051) | 37.75 | 93.51 | |
| 8 March 2002 (067) | 40.66 | 93.80 | |
| 7 February 2003 (038) | 41.58 | 91.64 | |
| 12 April 2003 (102) | 41.93 | 95.39 | |
| Landsat 8 OLI | 5 May 2013 (137) | 41.82 | 96.2 |
| 14 October 2013 (297) | 70.23 | 70.12 | |
| 27 December 2013 (361) | 43.14 | 81.31 | |
| Year | Land Cover Area (km2) and the Percent (%) Ratio since 2002 | |||||
|---|---|---|---|---|---|---|
| Water | Forest | Grassland | Permanent Wetland | Urban | Cropland | |
| 2002 | 1686.3 (100) | 2570.3 (100) | 2468.5 (100) | 790.8 (100) | 135.3 (100) | 20,138.0 (100) |
| 2003 | 1520.0 (90.1) | 2516.5 (97.9) | 2215.8 (89.8) | 763.3 (96.5) | 135.5 (100.2) | 20,638.0 (102.5) |
| 2004 | 1211.0 (71.8) | 2157.3 (83.9) | 2211.3 (89.6) | 545.8 (69.0) | 136.3 (100.7) | 21,527.5 (106.9) |
| 2005 | 488.0 (28.9) | 2353.3 (91.6) | 2220.0 (89.9) | 236.0 (29.8) | 137.0 (101.3) | 21,527.5 (106.9) |
| 2006 | 706.8 (41.9) | 2189.3 (85.2) | 2080.5 (84.3) | 462.3 (58.5) | 136.5 (100.9) | 22,249.8 (110.5) |
| 2007 | 650.8 (38.6) | 2076.8 (80.8) | 2144.8 (86.9) | 411.5 (52.0) | 136.8 (101.1) | 22,368.5 (111.1) |
| 2008 | 744.5 (44.2) | 2076.8 (80.8) | 2144.8 (86.9) | 659.0 (83.3) | 135.8 (100.4) | 22,071.8 (109.6) |
| 2009 | 633.5 (37.6) | 2054.3 (79.9) | 2076.8 (84.1) | 690.5 (87.3) | 136.3 (100.7) | 22,194.8 (110.2) |
| 2010 | 594.8 (35.3) | 2142.5 (83.4) | 2123.0 (86.0) | 574.3 (72.6) | 136.5 (100.9) | 22,218.0 (110.3) |
| 2011 | 1082.5 (64.2) | 2082.3 (81.0) | 1723.5 (69.8) | 680.5 (86.1) | 136.0 (100.6) | 22,084.3 (109.7) |
| 2012 | 919.8 (54.5) | 2195.8 (85.4) | 1602.0 (64.9) | 435.8 (55.1) | 137.0 (101.3) | 22,498.8 (111.7) |
© 2019 by the authors. Licensee MDPI, Basel, Switzerland. This article is an open access article distributed under the terms and conditions of the Creative Commons Attribution (CC BY) license (http://creativecommons.org/licenses/by/4.0/).
Share and Cite
Vichet, N.; Kawamura, K.; Trong, D.P.; On, N.V.; Gong, Z.; Lim, J.; Khom, S.; Bunly, C. MODIS-Based Investigation of Flood Areas in Southern Cambodia from 2002–2013. Environments 2019, 6, 57. https://doi.org/10.3390/environments6050057
Vichet N, Kawamura K, Trong DP, On NV, Gong Z, Lim J, Khom S, Bunly C. MODIS-Based Investigation of Flood Areas in Southern Cambodia from 2002–2013. Environments. 2019; 6(5):57. https://doi.org/10.3390/environments6050057
Chicago/Turabian StyleVichet, Nguon, Kensuke Kawamura, Dung Phan Trong, Nguyen Van On, Zhe Gong, Jihyun Lim, Sok Khom, and Chhun Bunly. 2019. "MODIS-Based Investigation of Flood Areas in Southern Cambodia from 2002–2013" Environments 6, no. 5: 57. https://doi.org/10.3390/environments6050057
APA StyleVichet, N., Kawamura, K., Trong, D. P., On, N. V., Gong, Z., Lim, J., Khom, S., & Bunly, C. (2019). MODIS-Based Investigation of Flood Areas in Southern Cambodia from 2002–2013. Environments, 6(5), 57. https://doi.org/10.3390/environments6050057