Article

Aeration to Improve Biogas Production by Recalcitrant Feedstock

United States Department of Agriculture, Agricultural Research Service, Food Animal Environmental Systems Research Unit, 2413 Nashville Road, Suite B5, Bowling Green, KY 42101, USA
*
Author to whom correspondence should be addressed.
Environments 2019, 6(4), 44; https://doi.org/10.3390/environments6040044
Submission received: 19 March 2019 / Revised: 8 April 2019 / Accepted: 9 April 2019 / Published: 11 April 2019

Abstract

:
Digestion of wastes to produce biogas is complicated by poor degradation of feedstocks. Research has shown that waste digestion can be enhanced by the addition of low levels of aeration without harming the microbes responsible for methane production. This research has been done at small scales and without provision to retain the aeration in the digestate. In this paper, low levels of aeration were provided to poultry litter slurry through a sub-surface manifold that retained air in the sludge. Digestate (133 L) was supplied 0, 200, 800, or 2000 mL/day air in 200 mL increments throughout the day via a manifold with a volume of 380 mL. Digesters were fed 400 g of poultry litter once weekly until day 84 and then 600 g thereafter. Aeration at 200 and 800 mL/day increased biogas production by 14 and 73% compared to anaerobic digestion while aeration at 2000 mL/day decreased biogas production by 19%. Biogas quality was similar in all digesters albeit carbon dioxide and methane were lowest in the 2000 mL/day treatment. Increasing feed to 600 g/week decreased gas production without affecting biogas quality. Degradation of wood disks placed within the digesters was enhanced by aeration.

1. Introduction

In 2012 over 8.5 billion broiler chickens were reared in the US [1]. Poultry are usually raised on bedding composed of absorbent materials termed “litter”; used poultry litter is usually applied to fields as fertilizer due to its high nitrogen and phosphorus content with or without prior composting. Its relatively high carbon content often depletes a considerable portion of the litter’s nitrogen content during decomposition, though, reducing its fertilizer value [2]. In addition, the high phosphorus content of poultry litter is responsible for eutrophication of much of the nation’s waters, especially in the southeast US where poultry rearing operations are especially concentrated [3].
Anaerobic digestion of animal wastes is an attractive option to controlling pollution caused by the large amounts of wastes generated in large animal rearing operations. Not only does it reduce the volume and strength of the waste, it also produces a crude natural gas (biogas) that can be used as fuel and thereby reduces the emission of methane, a potent greenhouse gas (GHG).
Animal waste, however, can often be a relatively poor feedstock for anaerobic digestion. This is because manures are often composed of complex carbohydrates (e.g., cellulose, pectin) and other substances such as lignin that are normally poorly degraded in anaerobic environments [4,5]. Poultry litter is a prime example of this, with high crude fiber content [2] due to the use of bedding materials such as wood chips, rice hulls, and straw, as well as high ash content resulting from decomposition of the litter and manure in the housing. Due to the high numbers of poultry reared, improved treatment technologies for the resulting waste are urgently needed to reduce pollution of the nation’s waters. However, without means of improving yields of biogas from, and digestibility of, poultry litter, anaerobic digestion of poultry litter is unlikely to achieve widespread adoption.
Previous research has demonstrated that biogas yield and waste degradation can be improved by the addition of small amounts of air or oxygen to anaerobic digestates [6,7,8]. This has been termed “micro-aeration” wherein sufficient amounts of air are introduced to an anaerobic digestion to sustain the growth of organisms capable of degrading polymers such as cellulose that are normally persistent in anaerobic environments without harming the growth of the obligately anaerobic archaea or bacteria responsible for the production of methane or volatile fatty acids. For instance, Fu et al. [9] found that populations of oxygen-tolerant Methanosarcina and Methanobacterium were doubled under micro-aerobic conditions and, interestingly, that the abundances of strictly anaerobic Clostridiales were also increased under the same conditions.
Most of this research, however, has been performed upon a small scale and as a single batch fed experiment (e.g., [10,11,12]) without provision for retaining aeration below the surface of the digestate. This could present a problem in real world situations since much of the aeration could potentially be wasted by escaping the digestate and perhaps even dilute the biogas. This would be analogous to wastewater treatment in which aeration is typically inefficient, the majority of the air escaping to the atmosphere [13].
The aim of this research was to construct prototypes of anaerobic digesters that utilize a sub-surface manifold to retain aeration within the sludge layer of the digestate and more specifically within the manifold itself, where oxygen could be consumed without harmful effects on the microbial community responsible for biogas production. By retaining the aeration within the manifold, it was reasoned that the efficiency of micro-aeration would be increased.
The digesters were designed to simulate farm digesters treating waste fed on a continuing and regular basis (i.e., as would be employed in pit-recharge animal housing) over a prolonged period. In addition to ostensibly anaerobic conditions (discounting dissolved oxygen received during feeding), three levels of aeration over a ten-fold range were employed to gauge their effect on biogas yield and quality.

2. Materials and Methods

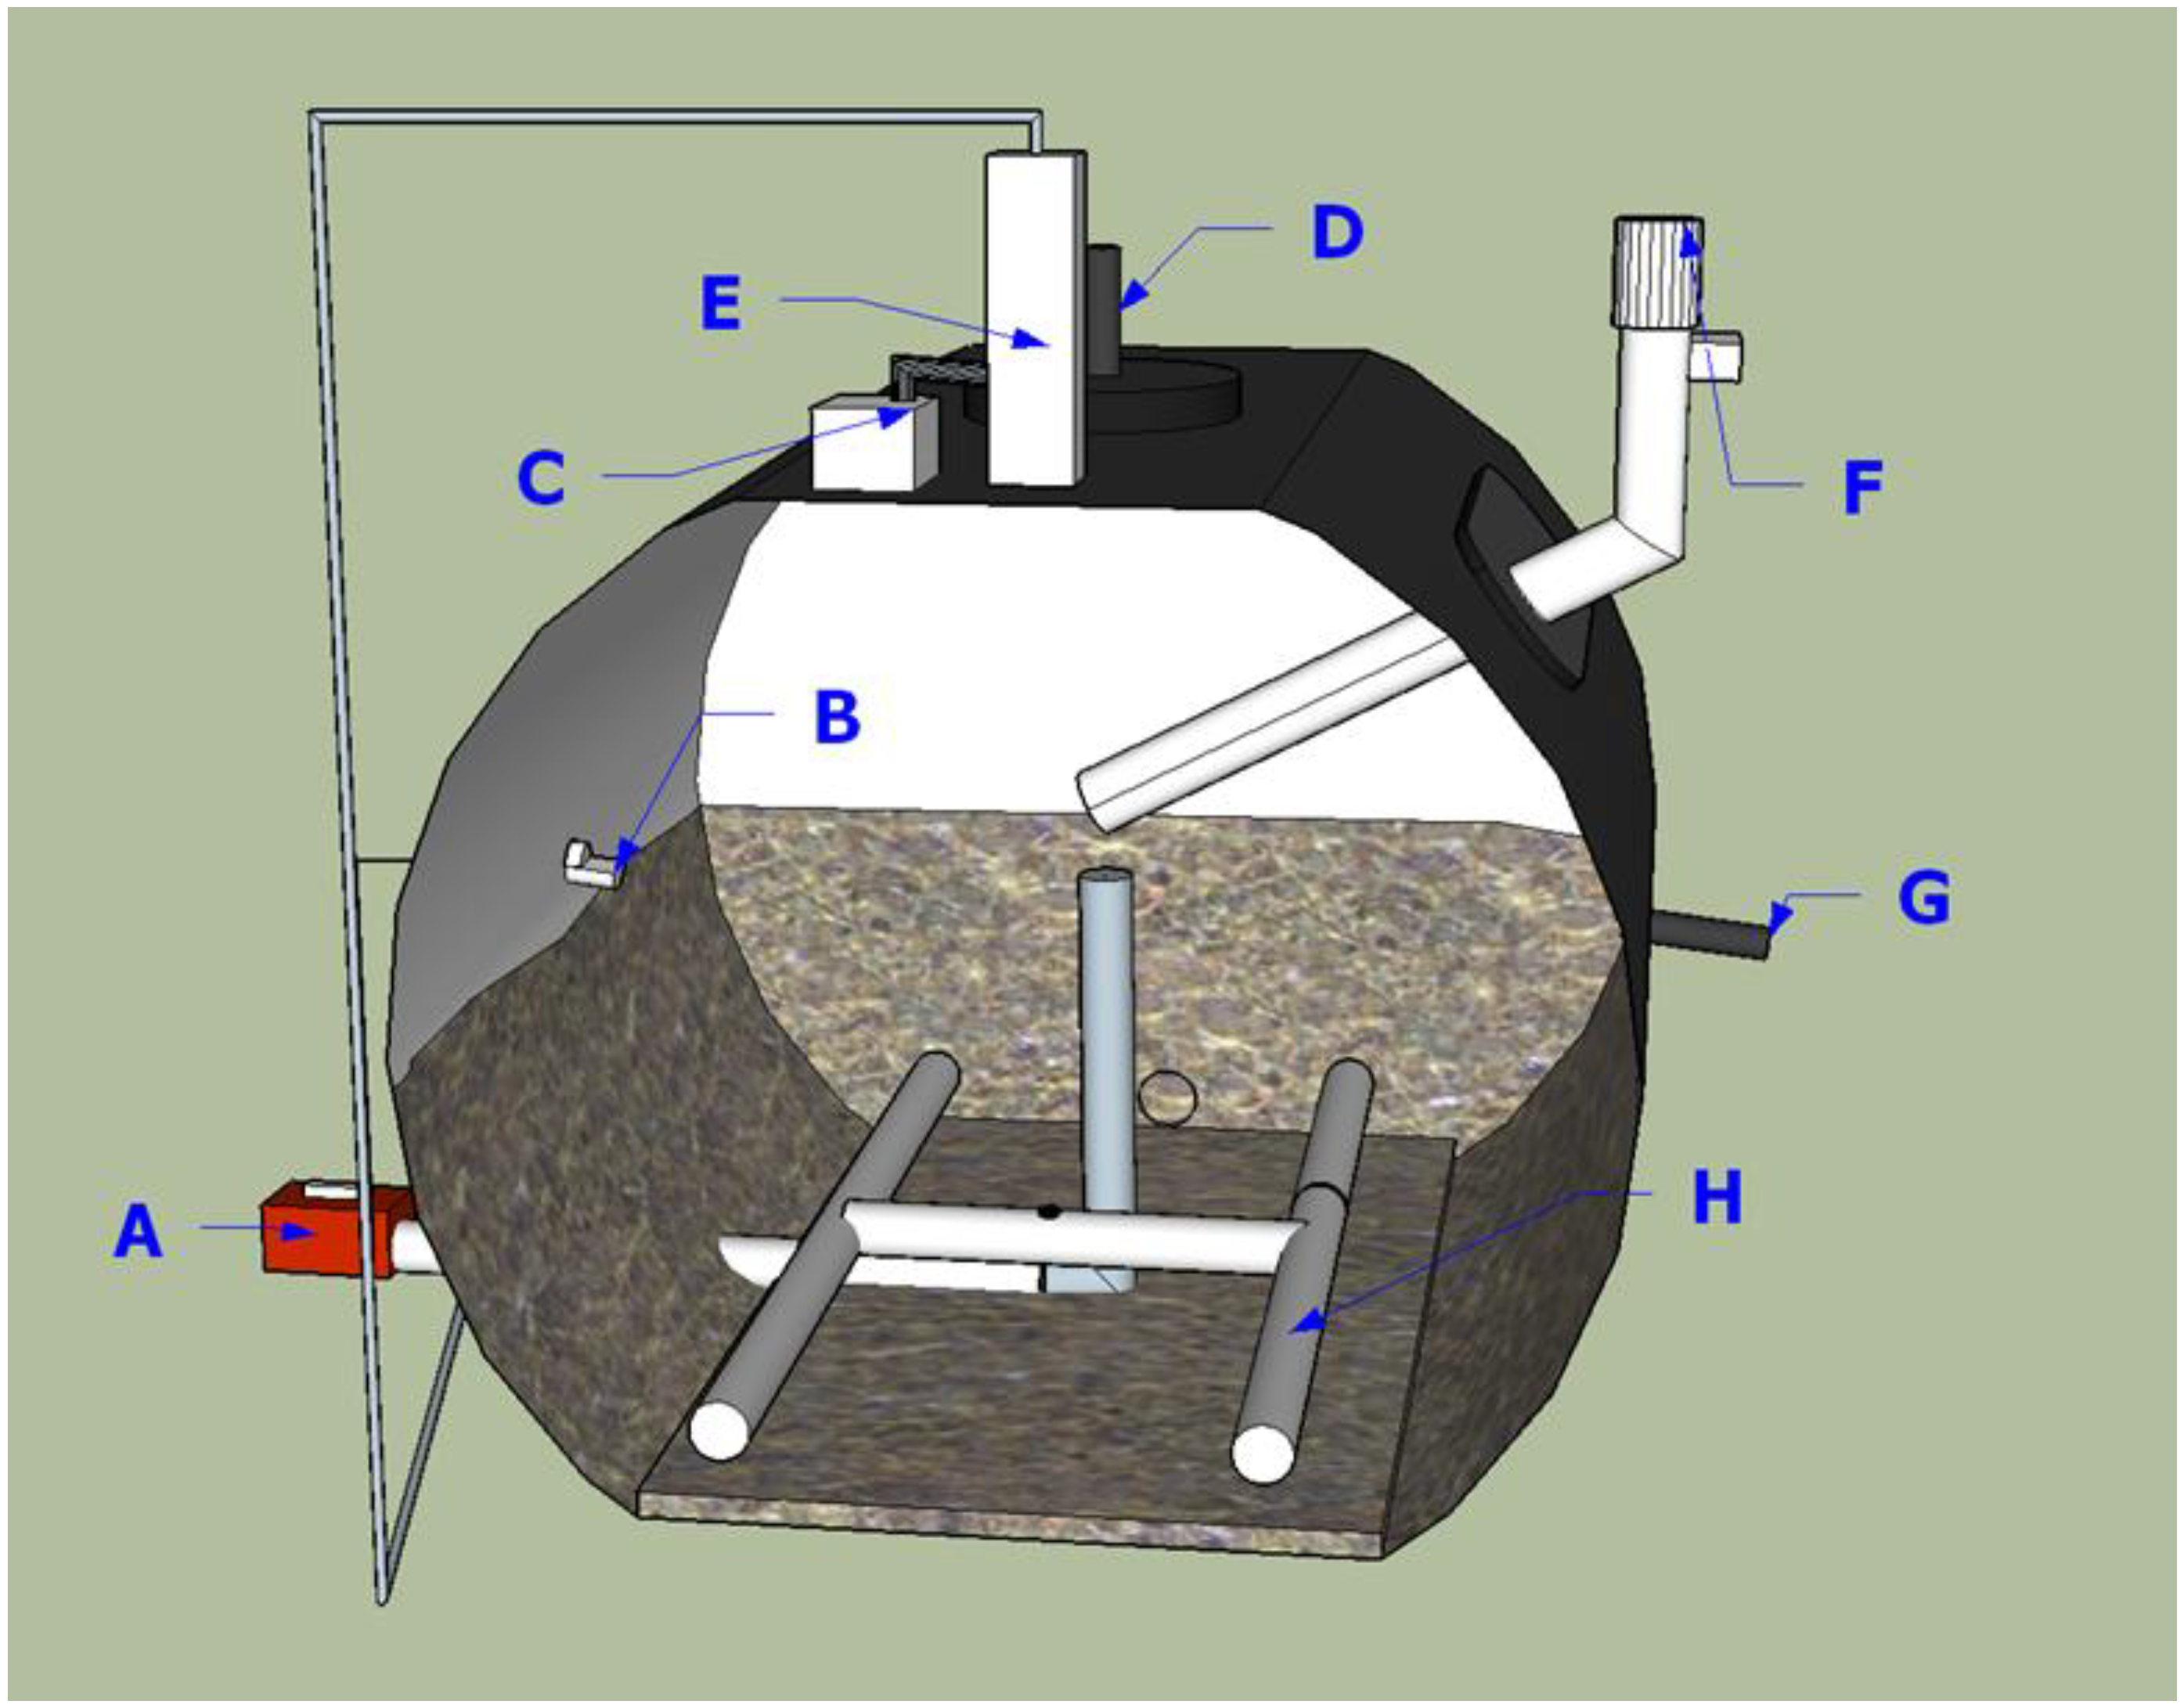
2.1. Digester Descriptions

Digesters were constructed from 208 L (55 gallon) blow-molded applicator tanks (US Plastic Inc., Lima, OH, USA). The side of each tank had a hole drilled into it to accommodate a 5.08 cm diameter polyvinyl chloride (PVC) pipe fitted with a manually operated ball valve that served as a waste inlet. This pipe extended into the tank below the surface of the digestate liquid. Float level switches (Omega Engineering Inc., Norwalk, CT, USA) were installed in the side of the tanks to maintain a digestate volume of 133 L. The float level switch was used to activate an electrical relay (American Zettler, Inc., Aliso Viejo, CA, USA) routing power to a 1.27 cm full port solenoid-actuated 120-VAC PVC ball valve (Valworx, Inc., Cornelius, NC, USA) installed on a 1.27 cm diameter PVC pipe that served as the waste outlet.
The waste outlet pipe had a hole drilled into it that accommodated a 0.3175 cm diameter line that led into the interior of the tank and provided aeration to a 2.54 cm diameter manifold constructed of PVC pipe installed in the bottom of the digester tank. The manifold had an “H” configuration with the long arms (0.6 m) of the manifold extending the length of the tank and the short arms (0.3 m) extending the width of the tank with a resulting volume of approximately 380 mL. The manifold had end caps installed on the end of its long arms and the bottom of the manifold had a series of 0.3175 cm diameter holes drilled in it allowing communication to the sludge layer of the digestate. Aeration was supplied to the subsurface manifold in 200 mL increments over 15 min intervals 0, 1, 4, or 10 times daily. The air was supplied through a 15 cm tall flow meter supplied by a diaphragm air pump and a 12-volt DC solenoid-actuated gas valve (Spartan Scientific, Boardman, OH, USA) controlled by a rotary timer. The aeration periods were spaced at equal intervals throughout the day.
The cap of each tank was adapted to accommodate a 3-way luer valve and 0.635 cm tubing that served as a gas outlet and sampling port. The tubing was connected to a Wet Tip Flow Meter® (wettipgasmeter.com) by one arm of a 3-way luer valve fitting. The other arm of the fitting accommodated a syringe for taking samples for gas analysis. The side of the tank had an additional 0.635 cm diameter port installed for liquid analysis. All pipe connections to the tanks were made with Uniseal® pipe to tank fittings (US Plastic, Inc.). A schematic of a micro-aerated digester is presented as Figure 1.

2.2. Digester Operation

The digesters were kept in a greenhouse maintained at 26.7 °C. The digesters were ‘seeded’ with 20 L of liquid obtained from an anaerobic digester located on a commercial broiler operation in Kentucky. Digesters were then fed 400 g of poultry litter in 4 L deionized water once weekly until day 84 and from then on fed 600 g once weekly. The poultry litter averaged 40.4 ± 6.5% moisture with a volatile solids (VS) and ash content of 74.7 ± 3.6% and 25.3 ± 3.6%, respectively, on a dry weight basis. Gas production was measured daily during the workweek and averaged over the weekends. Gas quality, dissolved gas content, and wastewater quality were measured weekly.
At the beginning of the experiment, each tank had seven disks of tulip poplar wood (Liriodendron tulipifera L.) placed within them with a diameter and thickness of 5.72 and 1.91 cm, respectively. The disks were dried at 105 °C for three days and weighed prior to placing them in the digesters. They had an average weight of 55.9 ± 6.1 g. At the end of the experiment, the disks were removed, cleaned and dried at 105 °C for three days prior to reweighing.

2.3. Analyses

All gas and wastewater analyses were performed on samples obtained from the digesters immediately prior to weekly feedings of poultry litter. Wastewater and solids analyses were performed per standard methods [14]. Dry weights of poultry litter were determined by heating the litter for 24 h at 105 °C while ash content was determined after drying for 24 h at 550 °C.
Dissolved GHG, bicarbonate, and carbonate (HCO3, CO32−) were measured by collecting 0.5 mL water samples using a syringe with an 18-gauge needle. The sample was then injected into a 20 mL vial filled with 9.5 mL of 0.1 N HCl and fitted with a rubber septum.
Total CO2 (solvated CO2, HCO3, and CO32−) concentrations were determined by:
Σ   C O 2 ,   m M = 20 [ ( 0.8 C o n c + C o n c ) 1000   µ g   m g 1 1 44.01   m g   m m o l 1 ]
where 20 is a multiplication constant accounting for 0.5 mL injections onto the gas chromatograph, 0.8 is the dimensionless Henry’s constant (KH) for CO2, and Conc is the CO2 concentration in the gas vial in µg L−1. The sum of the HCO3 and CO32− concentrations were determined by a use of the Henderson–Hasselbalch equation [15]:
Σ H C O 3 , C O 3 2 , m M   = [ T o t a l   C O 2 , m M ] 1 + 10 ( p H 6.35 )   10 ( p H 6.35 )
where pH is the pH of the solution and 6.35 equals the pka1 for H2O + CO2 ⇌ HCO3− + OH. Carbonate was calculated using the formula:
C O 3 2 ,   m M = [ T o t a l   C O 2 , m M ] 1 + 10 ( p H 10.33 )   10 ( p H 10.33 )
with the variables the same as in Equation (2) and substituting a pka2 of 10.33 for HCO3 ⇌ CO32− + H+. Bicarbonate concentrations were calculated by subtracting CO32− concentrations from those calculated in Equation (3) from the concentrations calculated in Equation (2). Solvated CO2 (sCO2) concentrations were calculated by subtracting the values calculated from Equation (2) from those calculated in Equations (1) and (3).
Aqueous CH4 and N2O concentrations in the wastewater were calculated by Equation (1) using dimensionless Henry’s constants of 27.02 and 1.1, respectively, and molar masses of 16.04 mg mmol−1 and 44.01 mg mmol−1, respectively [16,17].
Gas chromatographic analyses were performed as previously described [18] and statistical analyses were performed using SAS version 9.3 (SAS Institute, Cary, NC, USA).

3. Results and Discussion
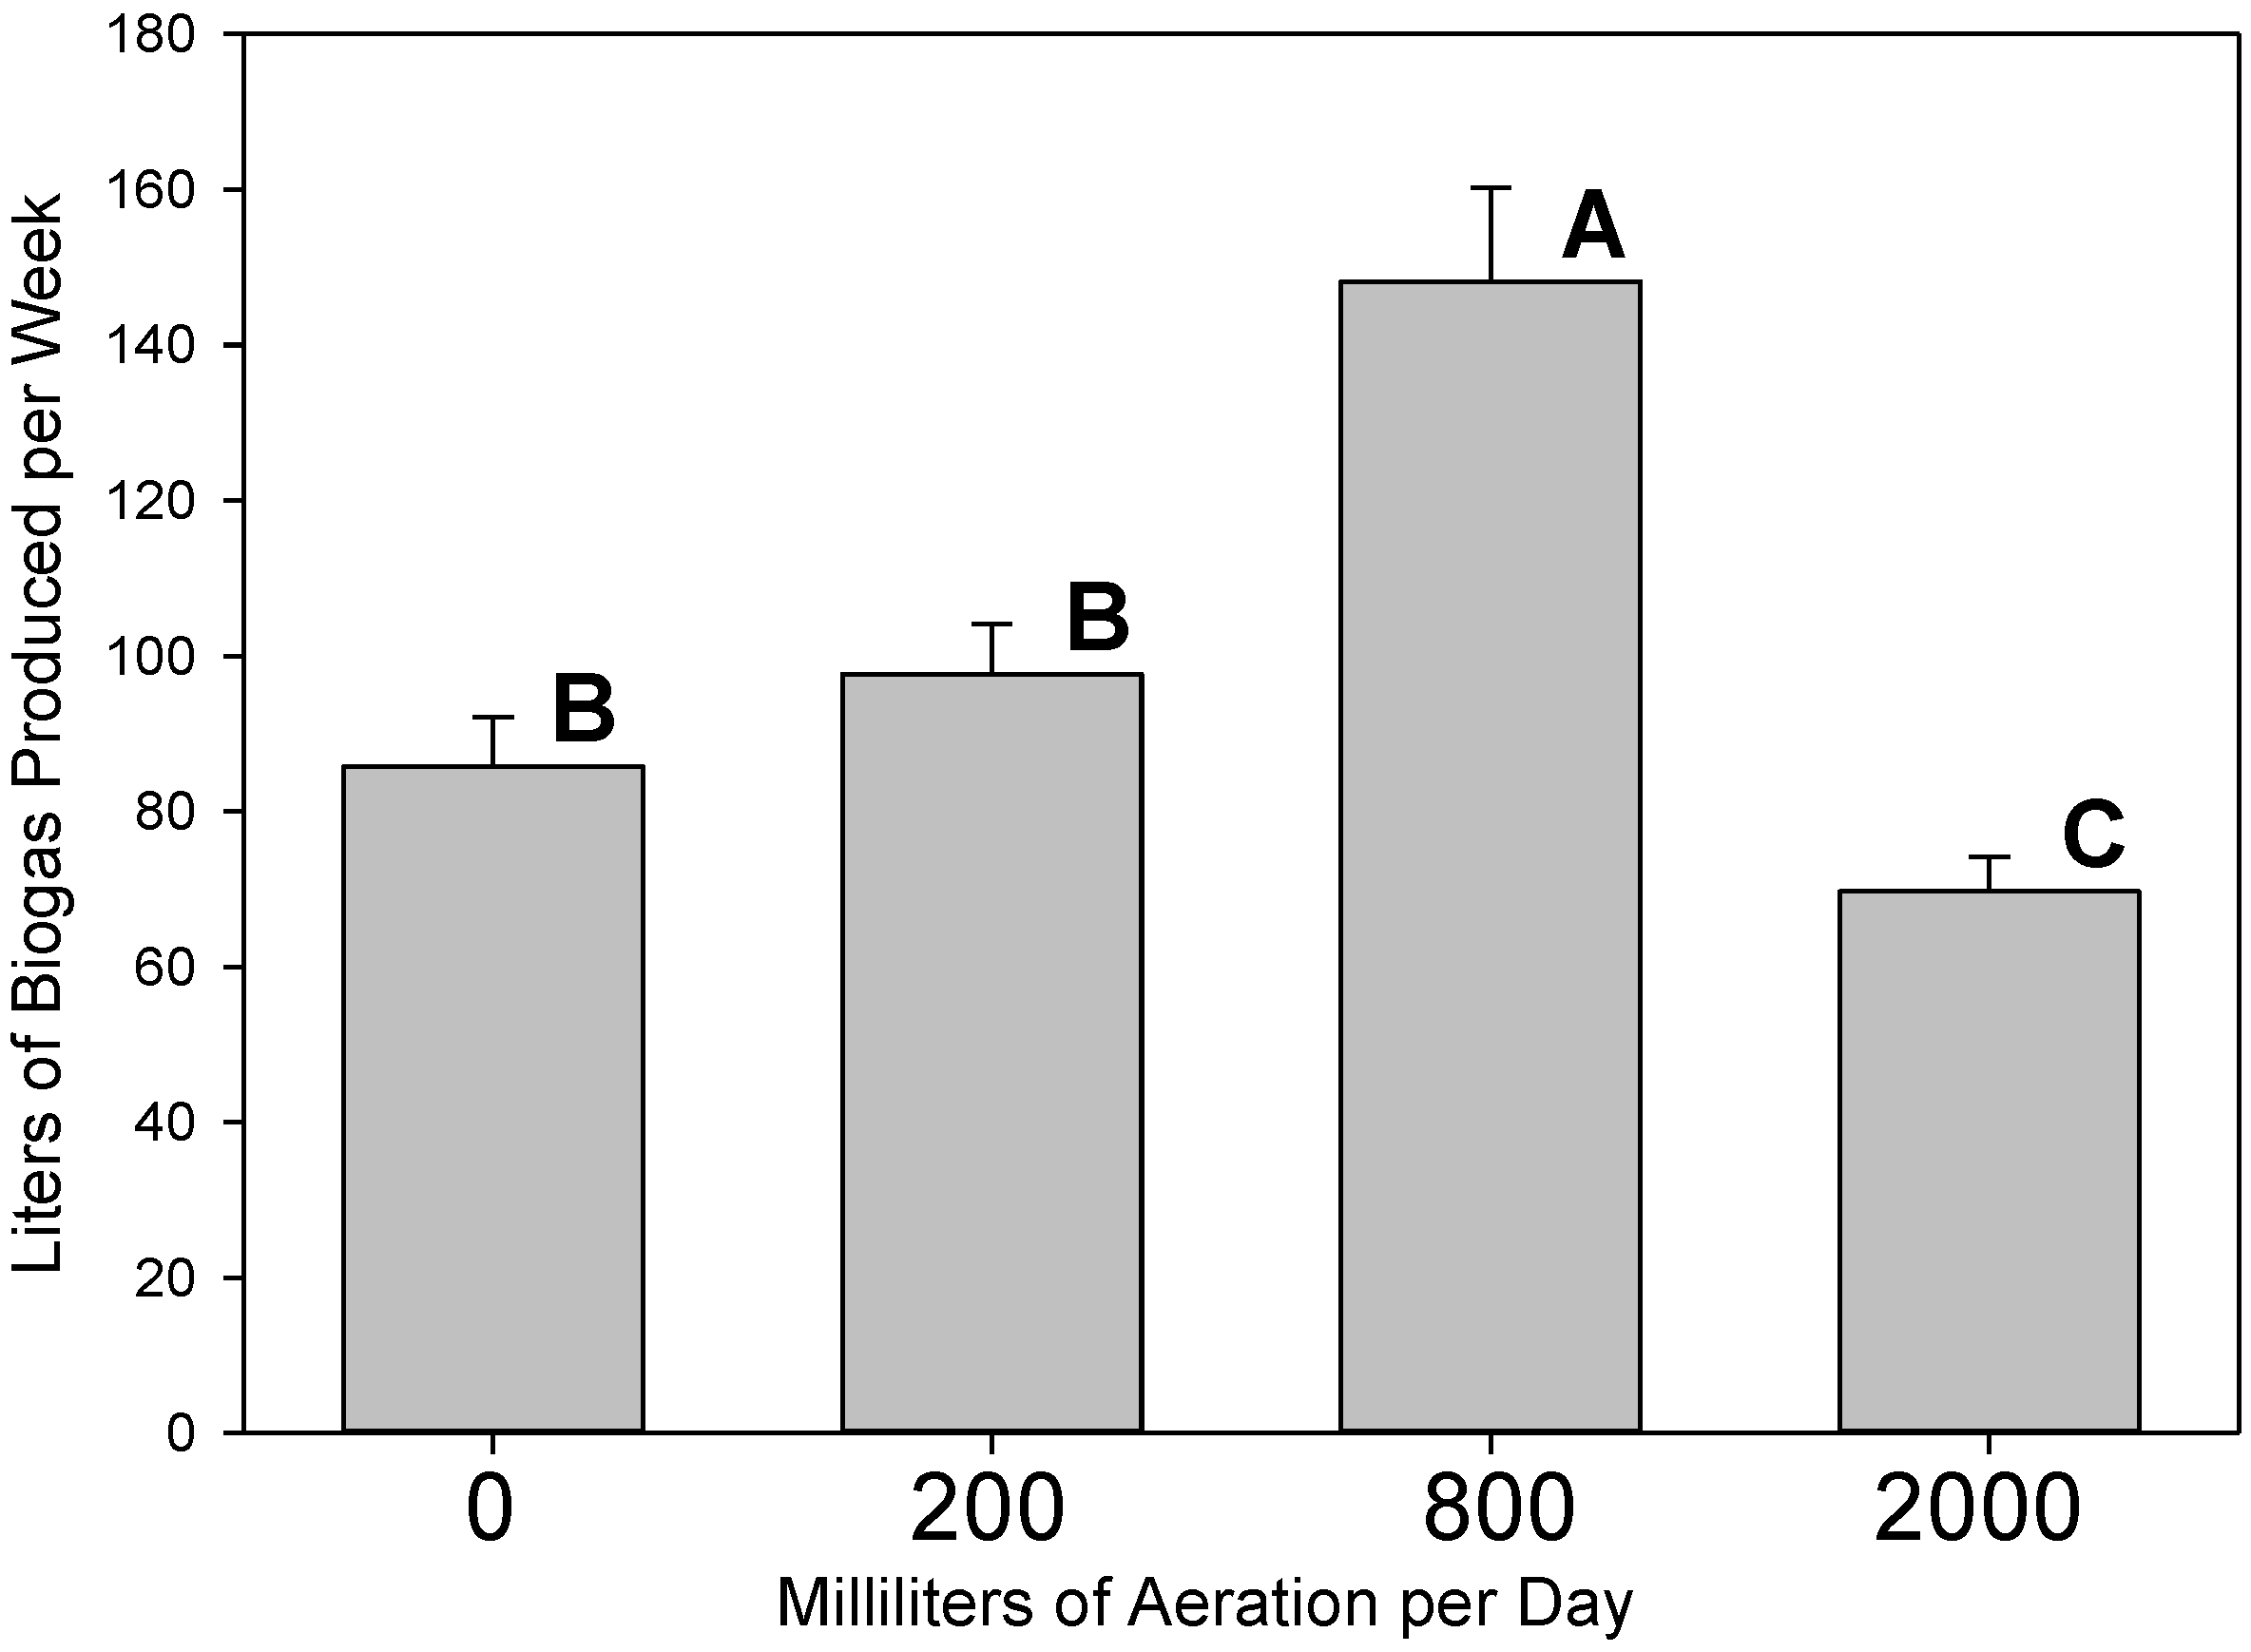
3.1. Gas Production

Averaged for all four treatments, the digesters produced 0.4 m3 of biogas per kg of volatile solids which compares favorably to a previously reported potential of 0.8 m3 biogas per kg of volatile solids for poultry litter [15]. Aeration at 200 or 800 mL/day improved gas production over that of strictly anaerobic digestion by 14 and 73%, respectively (Figure 2). Conversely, aeration at 2000 mL/day decreased gas production by 19% as compared to the strictly anaerobic digester.
From day 84 onwards, digesters were fed 600 g of poultry litter once weekly rather than the 400 g that had been fed previously. This had a negative effect on gas production in all four digesters. From day 59 to 83, gas production in all four digesters averaged 19.4 L/day while from day 84 onwards gas production averaged only 14.6 L/day. The digester receiving 2000 mL/day of supplemental aeration suffered the greatest decline in gas production at 34.1% whereas all other treatments averaged losses of 22.6%. This indicated that, regardless of treatment, either the capacity of the digesters for waste treatment had been exceeded or the waste loading rate had been increased too quickly.
As stated, part of the rationale for introducing micro-aeration to the digesters via a manifold was that the air would at least in part be retained within the manifold, so it could be consumed more efficiently. Of course, the belief that the aeration was retained within the manifold rests upon the supposition that it diffused into the digestate and the O2 was consumed before the next aeration period. With the 2000 mL/day treatment, this meant air was supplied once every 2.4 h. Whether this time was enough to consume O2 between aeration periods is unknown.
Two hundred, 400, and 800 mL of aeration per day introduced 1.5, 6.0, and 15 mL air per L digestate daily and roughly 0.45, 1.8, and 4.5 mg O2 daily per L of digestate. In previous research, Xu et al. [12] obtained enhanced CH4 production from a micro-aerated upflow anaerobic sludge blanket digester when aeration was supplied at a rate of 265 L air per kg VS and reduced CH4 production at an aeration rate of 399 L air per kg VS. Here, we found significantly enhanced biogas production at 800 mL/day aeration which from day 0–84 of the experiment corresponded to 46.4 L air per kg VS on a weekly basis and decreased biogas production at 2000 mL of aeration per day which over this same time corresponded to 116 L air per kg VS. These numbers, however, are estimates since they do not account for accumulation of undigested feed during the experiment. It is problematic to compare our results to results of Xu et al. [12] since they used a different digester design and feedstock. It is possible, nevertheless, that we achieved enhanced production of biogas at lower aeration rates due to retention of the aeration within the manifold.
Although aeration at 800 mL/day significantly increased gas production, and aeration at 2000 mL/day significantly decreased gas production compared to the anaerobic digester, biogas quality was similar in all digesters. Nevertheless, biogas CO2 concentrations did decline with increasing aeration (Table 1). Similarly, there was little difference in CH4 concentrations between the various digesters. Aeration at 200 mL/day increased CH4 concentrations by 8.7% compared to the strictly anaerobic digester whereas aeration at 800 and 2000 mL/day decreased CH4 concentrations by 1% and 6.3%, respectively.
As stated, from day 84 onwards, digesters were fed 600 g once weekly rather than the previous 400 g. While this had negative consequences on gas production, gas quality was not similarly affected. Carbon dioxide and CH4 biogas concentrations were quite similar before and after increasing to 600 g per week feedings.
Previous research has shown increases in bicarbonate buffering during micro-aeration of digestates [19] and we also noted increases in bicarbonate concentrations with increasing levels of aeration (Table 1). This likely explains the lower concentrations of CO2 in digesters receiving aeration when compared to the anaerobic digester. To our knowledge, no previous research has conducted measurements of soluble CO2 so the question of whether micro-aeration also affects sCO2 concentrations has likely not been previously addressed. Here, we noted that nominally sCO2 concentrations increased with the higher levels of aeration. We refer to CO2 as nominally soluble because we feel that a considerable portion of the CO2 is not solvated but rather in the form of bubbles, either free or attached to solids and other surfaces within the digesters. This supposition is supported by the fact that whereas bicarbonate concentrations increased smoothly throughout the experiment in all digesters (Figure 3), in the digester receiving 2000 mL of air per day considerable surges in sCO2 were noted at weeks 11, 15, and 17 onwards. These surges are best envisioned as being due to bubbles of CO2 rather than as being caused by increases in the concentration of solvated gas. Still, in general, sCO2 concentrations tended to fall as the pH and HCO3 buffering of the digesters increased. In contrast to the behavior of sCO2, sCH4 concentrations reached their maximum concentrations by week four of the experiment and did not increase thereafter (data not shown).
We did not measure H2S or HS in our experiments. However, research has demonstrated a decrease in biogas H2S concentrations due to micro-aeration [19]. This has been ascribed to the removal of HS and S2− ions as elemental sulfur at O2 tensions of less than 0.1 mg/L or sulfide oxidation to sulfate at higher O2 tensions [20]. It is important to note that H2S is often described as being toxic to methanogens and hence potentially reducing biogas yields [7,20,21]. It is more likely, however, that sulfate reducing bacteria (SRB) and archaea (SRA) outcompete methanogens for H2 rather than H2S exhibiting toxicity to methanogens per se [22]. In a micro-aerated digester, it is possible for sulfate ions to be formed which could encourage the activity of SRB and SRA. Although we did not note a corresponding increase in digestate pH as would likely be expected with enhanced HCO3 buffering, normally increased buffering would be expected to raise pH and thereby decrease biogas H2S concentrations given that the pka for H2S is 6.9.

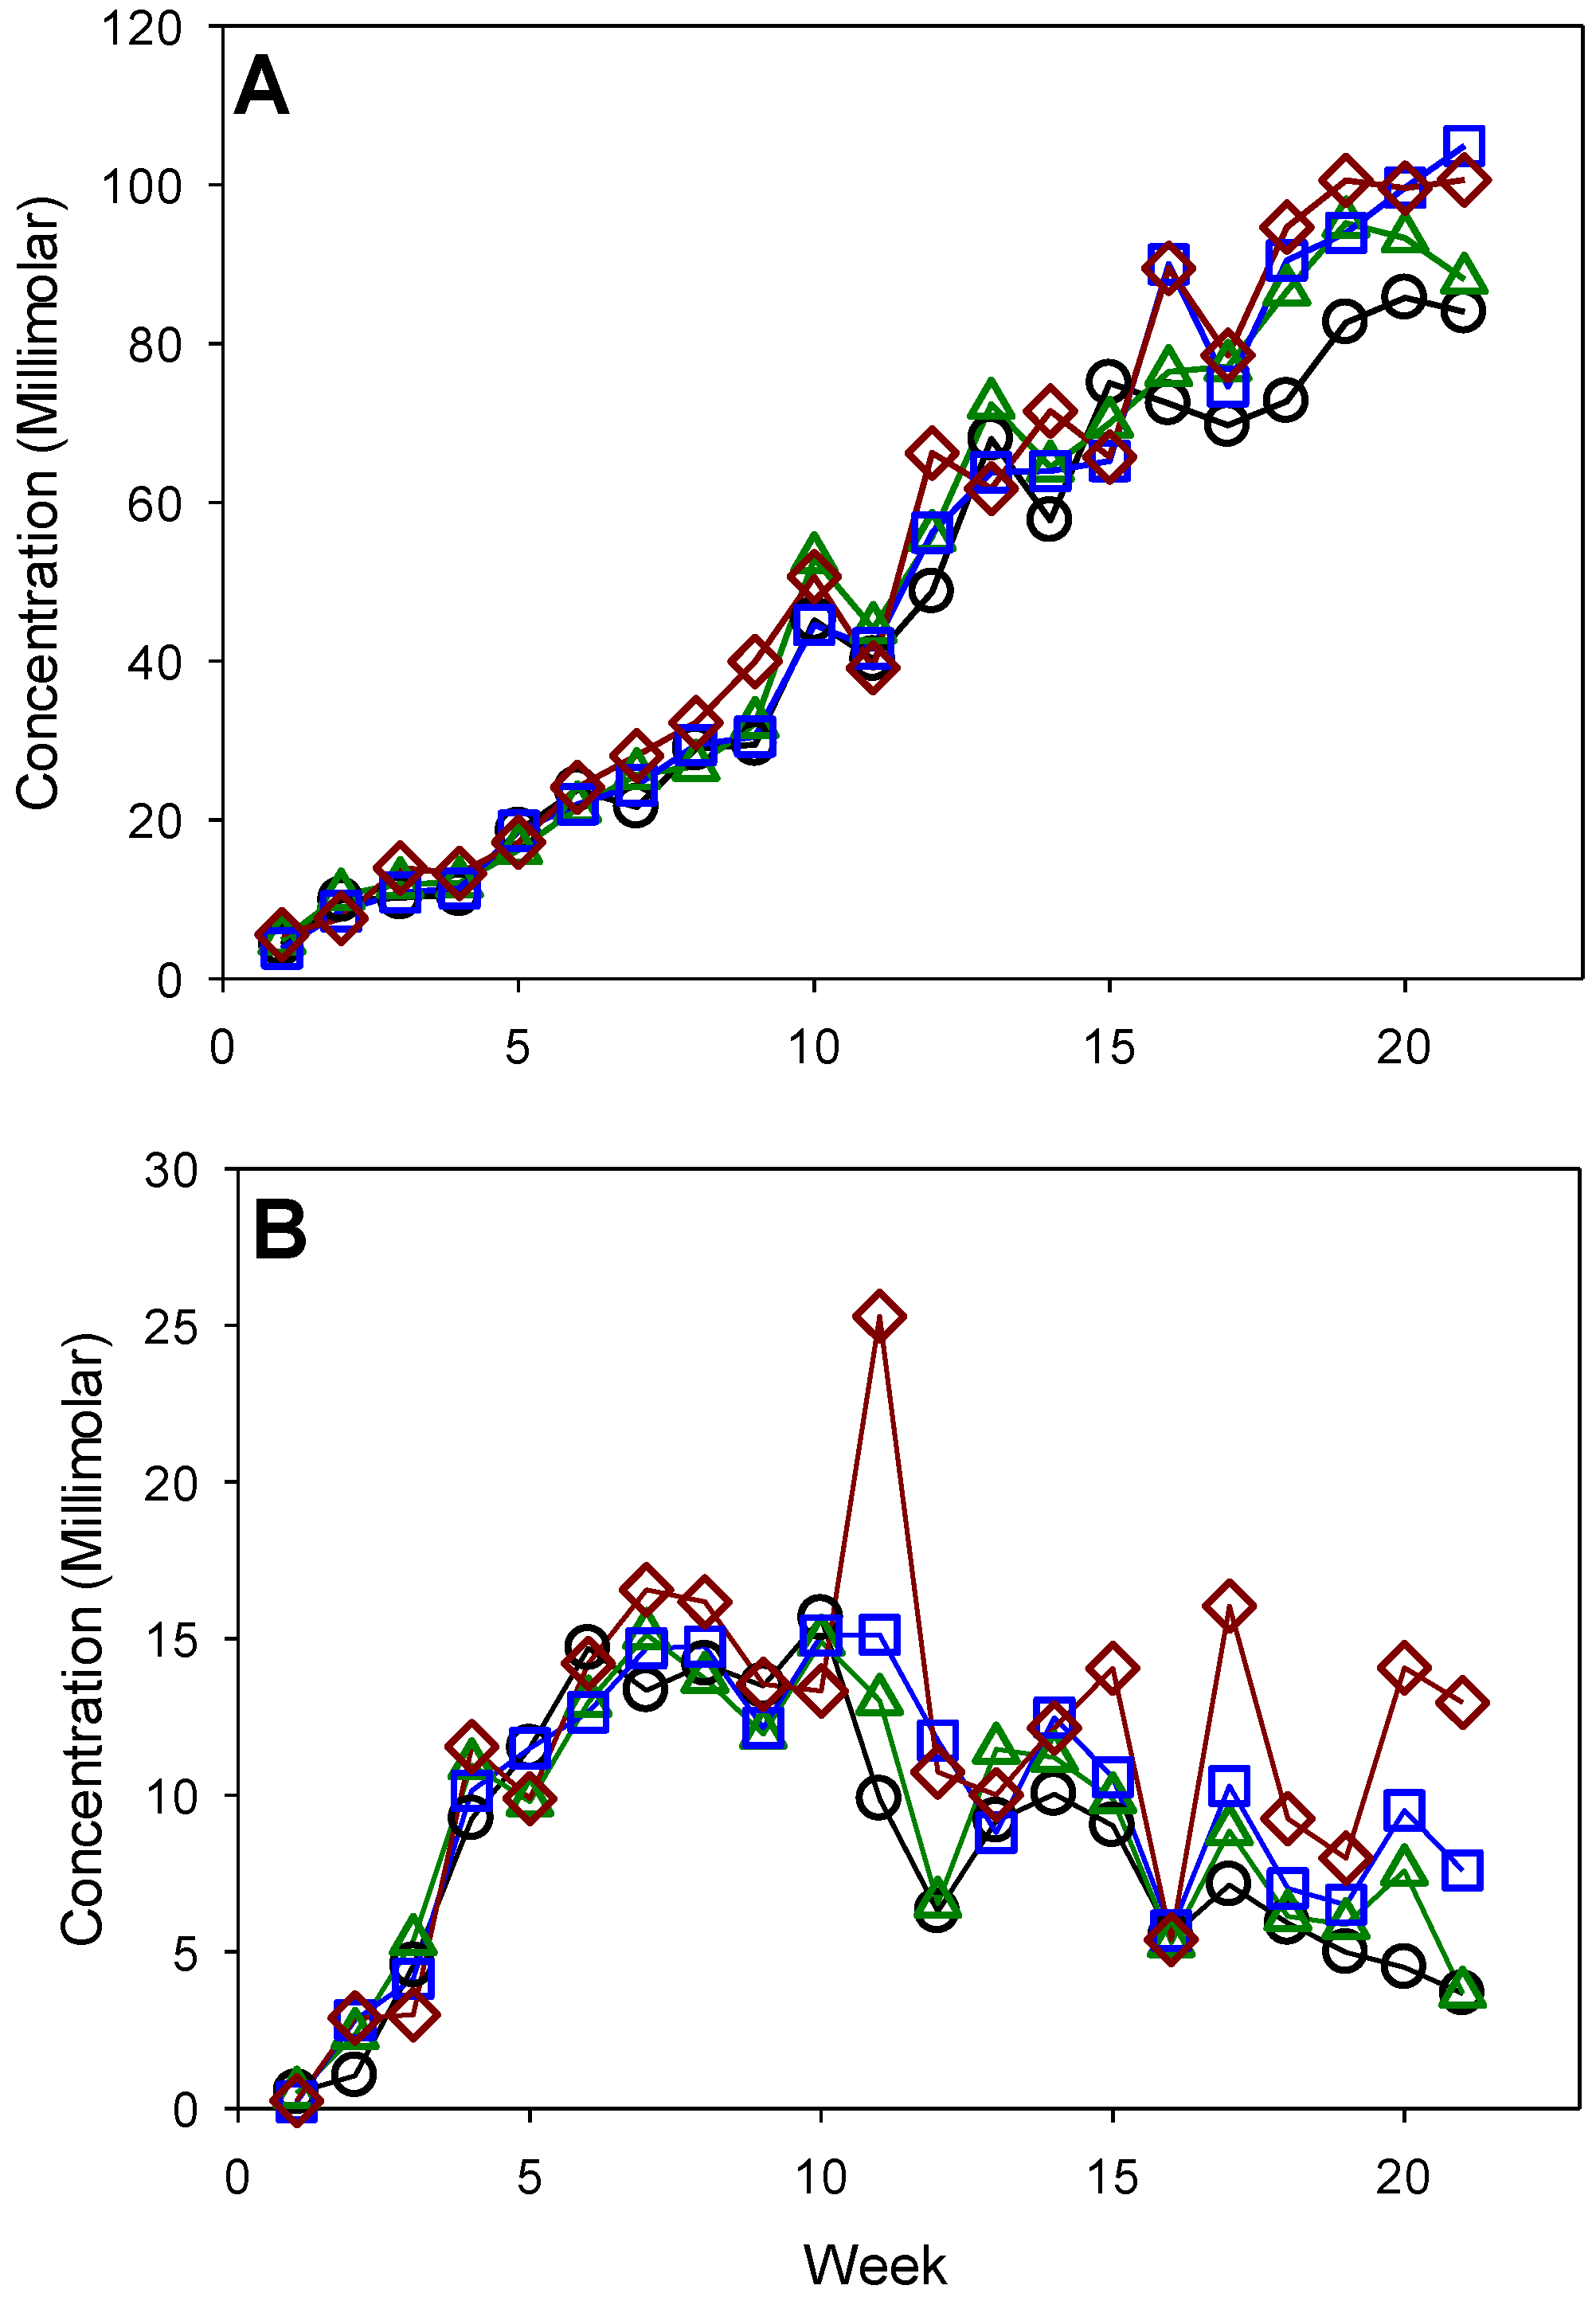
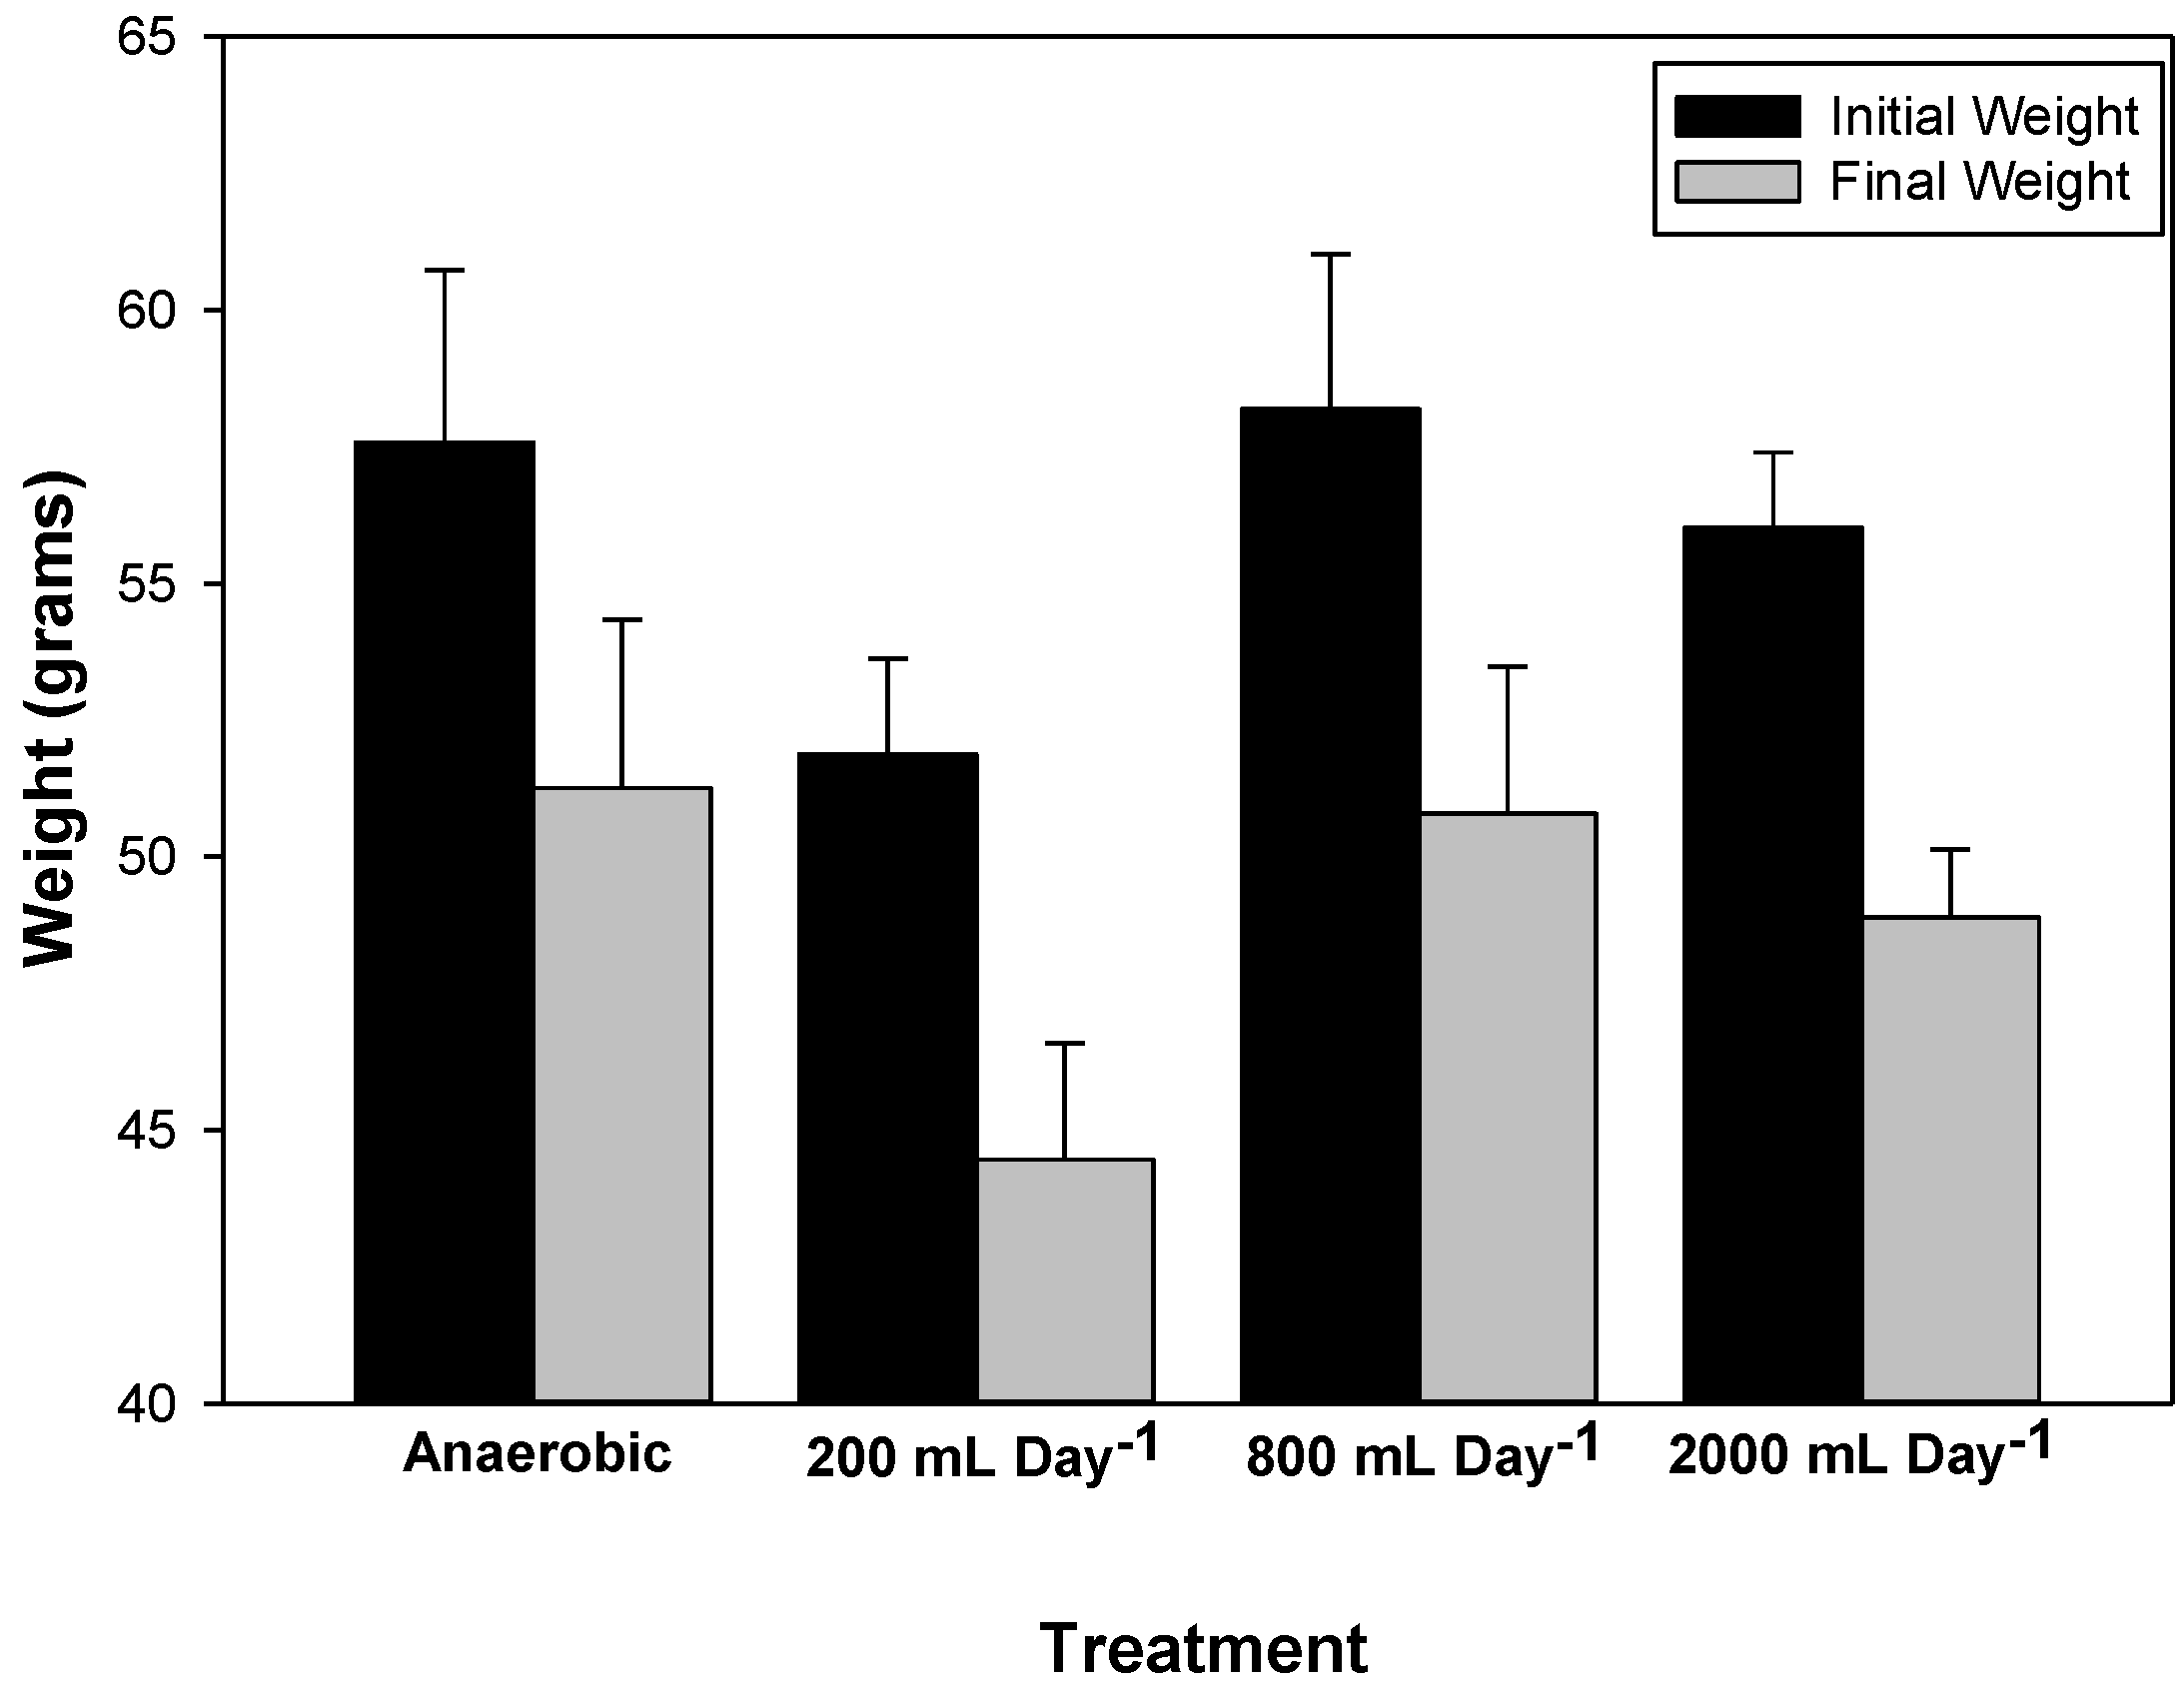
3.2. Waste Degradation

Gas production was increased slightly in the digesters receiving 200 and especially 800 mL/day of aeration compared to the anaerobic digester. Conversely, at 2000 mL/day, gas production was likely decreased by oxygen inhibition of the microbial consortia responsible for methane production. It would be expected, therefore, that waste degradation would be enhanced by all treatments as compared to the anaerobic control. We did find that chemical oxygen demand (COD) was significantly reduced by all treatments as compared to the anaerobic digester (Table 1). While no significant differences in total suspended solids (TSS) were seen in any treatment as compared to the anaerobic digester, TSS were lower in all the aerated digesters.
While biogas production was inhibited by increasing weekly feedings to 600 g, increases in COD and TSS concentrations were not as great as might be expected. COD concentration in the anaerobic, 200, and 2000 mL/day averaged 3320, 2670, and 2570 mg/L from day 59 to 84, respectively, and 3760, 3040, and 2570 mg/L onwards. COD concentration was lowered in the 800 mL/day treatment as compared to the anaerobic digester, averaging 3010 mg/L from day 59 to 84 and 2910 mg/L afterwards. TSS averaged 329, 284, 368, and 359 mg/L from day 59 to 84 in the anaerobic, 200, 800, and 2000 mL/day aeration treatments, respectively, and 355, 341, 239, and 284 mg/L afterwards.
Ammonium concentrations were not affected by micro-aeration treatment (Table 1). No significant concentrations of either nitrate or nitrite were found in any of the wastewater samples (data not shown), nor was dissolved N2O. This shows that even in the digester receiving 2000 mL/day aeration, conditions did not support any significant nitrification/denitrification.
As stated, a rationale for this study was that much agricultural waste is to a large extent composed of substances (e.g., wood) that is recalcitrant to degradation in anaerobic environments. The producer from whom the poultry litter was obtained indicated that the bedding material consisted of either an unspecified Pinus species or tulip poplar (L. tulipifera) wood chips depending upon price and availability. Therefore, to test whether the supplemental low-level aeration would facilitate breakdown of the bedding material, we added wood disks cut from tulip poplar boards to the digestate at the beginning of the experiment. Figure 4 represents wood disk weights at the beginning of the experiment and after incubation in the digesters for 148 days.
Although significant weight loss occurred in the experiment for all treatments (p < 0.0001, t-test of log10 transformed data), there were no significant differences seen in weight loss among treatments. Nevertheless, wood disks placed in the strictly anaerobic tanks lost the least amount, averaging 6.3 g on a dry weight basis whereas all other treatments lost over 7 g dry weight. It has been shown that micro-aeration of wastes increases the hydrolysis of polymers such as cellulose as compared to strictly anaerobic conditions [6,7,8].
Fungal growth was noted on the wood disks in digesters receiving micro-aeration but most notably in the digester receiving 2000 mL/day air. No fungal growth was noticed on wood disks in the strictly anaerobic digester. It has been reported that biogas production can be improved in the presence of white rot fungi and anaerobic fungi such as Neocallimastigomycota [23] due to their ability to degrade complex polymers, and that the cellulose degradation activity of anaerobic fungi is increased in the presence of methanogens [24]. Analyses are planned to identify this fungus as well as determine how bacterial and other microbial populations may have been affected by micro-aeration.

4. Conclusions

At least three outcomes are desired in the micro-aeration of anaerobic wastes: that the production of biogas is enhanced, that waste degradation is enhanced, and that bicarbonate buffering is enhanced so that the stability of the digestion process is improved. Data from this experiment shows that all these goals can be achieved by micro-aeration. It also shows that considerable manipulation of aeration rates may be needed to achieve optimal results. It also shows that if waste loading rates are increased during digestion, it should be done gradually to maintain ideal digestion rates and avoid overloading digesters.

Author Contributions

Investigation, J.L. and N.L.; Methodology, J.L. and N.L.; Project administration, J.L.

Funding

This research received no external funding and was conducted as part of USDA-ARS National Program 212: Soil and Water, Developing Safe, Efficient and Environmentally Sound Management Practices for the Use of Animal Manure.

Acknowledgments

The authors thank Stacy Antle, Mike Bryant, (USDA-ARS), and Zachary Berry (Department of Chemistry, Western Kentucky University) for technical assistance. The use of trade, firm, or corporation names in this web site is for the information and convenience of the reader. Such use does not constitute an official endorsement or approval by the United States Department of Agriculture or the Agricultural Research Service of any product or service to the exclusion of others that may be suitable.

Conflicts of Interest

The authors declare no conflict of interest.

References

  1. National Agricultural Statistics Service. Available online: https://www.usda.gov/sites/default/files/documents/nass-poultry-stats-factsheet.pdf. (accessed on 8 March 2019).
  2. Stephenson, A.H.; McCaskey, T.A.; Ruffin, B.G. A survey of broiler litter composition and potential value as a nutrient resource. Biol. Wastes 1990, 34, 1–9. [Google Scholar] [CrossRef]
  3. Kibet, L.C.; Allen, A.; Kleinman, P.J.; Feyereisen, G.W.; Church, C. Phosphorus runoff losses from subsurface-applied poultry litter on coastal plain soils. J. Environ. Qual. 2011, 40, 412–420. [Google Scholar] [CrossRef]
  4. Kirk, T.K.; Farrell, R.L. Enzymatic “combustion”: The microbial degradation of lignin. Ann. Rev. Microbiol. 1987, 41, 465–505. [Google Scholar] [CrossRef] [PubMed]
  5. Leschine, S.B. Cellulose degradation in anaerobic environments. Annu. Rev. Microbiol. 1995, 49, 399–426. [Google Scholar] [CrossRef] [PubMed]
  6. Díaz, I.; Donoso-Bravo, A.; Fdz-Polanco, M. Effect of microaerobic conditions on the degradation kinetics of cellulose. Bioresour. Technol. 2011, 102, 10139–10142. [Google Scholar] [CrossRef] [PubMed]
  7. Tsapekos, P.; Kougias, P.G.; Vasileiou, S.A.; Lyberatos, G.; Angelelidaki, I. Effect of micro-aeration and inoculum type on the biodegradation of lignocellulosic substrate. Bioresour. Technol. 2017, 225, 246–253. [Google Scholar] [CrossRef]
  8. Sawatdeenarunat, C.; Sung, S.; Khanal, S.K. Enhanced volatile fatty acids production during anaerobic digestion of lignocellulosic biomass via micro-oxygenation. Bioresour. Technol. 2017, 237, 139–145. [Google Scholar] [CrossRef] [PubMed]
  9. Fu, S.-F.; Wang, F.; Shi, X.-S.; Guo, R.-B. Impacts of microaeration on the anaerobic digestion of corn straw and the microbial community structure. Chem. Eng. J. 2016, 287, 523–528. [Google Scholar] [CrossRef]
  10. Zhu, M.; Lü, F.; Hao, L.-P.; He, P.-J.; Shao, L.-M. Regulating the hydrolysis of organic wastes by micro-aeration and effluent recirculation. Waste Manag. 2009, 29, 2042–2050. [Google Scholar] [CrossRef]
  11. Lim, J.W.; Wang, J.-Y. Enhanced hydrolysis and methane yield by applying microaeration pretreatment to the anaerobic co-digestion of brown water and food waste. Waste Manag. 2013, 33, 813–819. [Google Scholar] [CrossRef]
  12. Xu, S.; Selvan, A.; Wong, J.W.C. Optimization of micro-aeration intensity in acidogenic reactor of a two-phase anaerobic digester treating food waste. Waste Manag. 2014, 34, 363–369. [Google Scholar] [CrossRef]
  13. Malovanyy, M.; Shandrovych, V.; Malovanyy, A.; Polyuzhyn, I. Comparative analysis of the effectiveness of regulation of aeration depending on the quantitative characteristics of treated sewage water. J. Chem. 2016, 2016, 6874806. [Google Scholar] [CrossRef]
  14. American Public Health Association (APHA). Standard Methods for Examination of Water and Wastewater, 20th ed.; APHA; AWWA; WPCF: Washington, DC, USA, 1998. [Google Scholar]
  15. Po, H.N.; Senozan, N.M. The Henderson-Hasselbalch equation: Its history and limitations. J. Chem. Educ. 2001, 78, 1499–1503. [Google Scholar] [CrossRef]
  16. Howard, P.H.; Meylan, W.H. Handbook of Physical Properties of Organic Chemicals, 1st ed.; Chemical Rubber Corporation Press: Boca Raton, FL, USA, 1997. [Google Scholar]
  17. Jacinthe, P.A.; Groffman, P.M. Silicone rubber sampler to measure dissolved gases in saturated soils and waters. Soil Biol. Biochem. 2001, 33, 907–912. [Google Scholar] [CrossRef]
  18. Loughrin, J.H.; Cook, K.L.; Lovanh, N. Recirculating swine waste through a silicone membrane in an aerobic chamber improves biogas quality and wastewater malodors. Trans. ASABE 2014, 55, 1929–1937. [Google Scholar] [CrossRef]
  19. Nuguyen, P.H.L.; Kuruparan, P.; Visvanathan, C. Anaerobic digestion of municipal solid waste as a treatment prior to landfill. Bioresour. Technol. 2007, 98, 380–387. [Google Scholar] [CrossRef]
  20. Krayzelova, L.; Bartacek, J.; Kolesarova, N.; Jenicek, P. Microaeration for hydrogen sulfide removal in UASB reactor. Bioresour. Technol. 2014, 172, 297–302. [Google Scholar] [CrossRef]
  21. Zhou, W.; Imai, T.; Ukita, M.; Li, F.; Yuasa, A. Effect of limited aeration on the anaerobic treatment of evaporator condensate from a sulfite paper mill. Chemosphere 2007, 66, 924–929. [Google Scholar] [CrossRef]
  22. Kristjansson, J.K.; Sch6nheit, P.; Thauer, R.K. Different Ks values for hydrogen of methanogenic bacteria and sulfate reducing bacteria: An explanation for the apparent inhibition of methanogenesis by sulfate. Arch. Microbiol. 1982, 131, 278–282. [Google Scholar] [CrossRef]
  23. Da Silva, R.R.; Pesezzi, R.; Souto, T.B. Exploring the bioprospecting and biotechnological potential of white-rot and anaerobic Neocallimastigomycota fungi: Peptidases, esterases, and lignocellulolytic enzymes. Appl. Microbiol. Biotechnol. 2017, 101, 3089–3101. [Google Scholar] [CrossRef]
  24. Marvin-Sikkema, F.D.; Richardson, A.J.; Stewart, C.S.; Gorrschal, J.C.; Prins, R.A. Influence of Hydrogen-consuming bacteria on cellulose degradation by anaerobic fungi. Appl. Environ. Microbiol. 1990, 56, 3793–3797. [Google Scholar]
Figure 1. Cutaway schematic of a micro-aerated digester: (A) Waste outlet valve; (B) Float level switch; (C) Air pump; (D) Gas sampling port; (E) Flow meter for aeration; (F) Feed inlet; (G) Wastewater sampling port; (H) Aeration “H”-manifold.
Environments 06 00044 g001
Figure 2. Average weekly gas production by digesters from week three onwards. Bars represent the mean of 18 determinations ± standard error of the mean. Bars labeled by the same letter are not significantly different by a Duncan’s multiple range test.
Environments 06 00044 g002
Figure 3. Bicarbonate (A) and soluble CO2 (B) concentrations in digesters. Black line, circles: 0 mL supplemental aeration; green line, triangles: 200 mL aeration; blue lines, squares: 400 mL aeration; red lines, diamonds: 2000 mL aeration.
Environments 06 00044 g003
Figure 4. Weights of wood disks at beginning and end of experiment. Data represent the mean of seven determinations ± standard error of the mean.
Environments 06 00044 g004
Table 1. Biogas and wastewater quality characteristics of digesters 1.
Milliliters of Aeration Per Day
02008002000
pH6.99 (0.09) a6.98 (0.09) a6.94 (0.08) a6.93 (0.08) a
Biogas Concentration (µg/L)
CO2755,000 (21,300) a740,000 (17,700) a718,000 (17,800) a683,000 (16,500) a
CH4318,000 (14,300) a331,000 (24,600) a314,000 (17,300) a298,000 (9650) a
Wastewater Concentration (Millimolar)
HCO349.8 (6.0) b53.8 (6.6) a54.5 (7.2) a57.2 (7.1) a
sCO29.1 (0.9) a9.7 (0.8) a10.5 (0.7) a12.4 (1.0) a
sCH421.1 (0.5) a21.7 (0.5) a23.5 (0.7) a26.2 (0.5) a
Wastewater Concentration (mg/L)
Chemical oxygen demand3240 (194) a2720 (120) b2760 (98) b2420 (96) b
Total suspended solids287 (29) a276 (24) a241 (27) a262 (28) a
NH4+153 (83) a162 (65) a150 (65) a154 (68) a
1 Values represent the mean of 18 determinations (standard error of the mean). Within rows, means followed by the same letter are not significantly different by a Duncan’s multiple range test.

