Article

A Simple Method to Evaluate Adaptation Measures for Urban Heat Island

by
Hideki Takebayashi
Urban Environmental Engineering Laboratory, Kobe University, Kobe 657-8501, Japan
Environments 2018, 5(6), 70; https://doi.org/10.3390/environments5060070
Submission received: 16 May 2018 / Revised: 13 June 2018 / Accepted: 14 June 2018 / Published: 16 June 2018
(This article belongs to the Special Issue Adaptation Measures for Urban Heat Island)

Abstract

:
In recent years, adaptation measures such as awnings, louvers, directional reflective materials, mist sprays, and evaporative materials, have been developed with the expectation that they will serve as effective solutions to outdoor human thermal environments that are under the influence of urban heat island. A simple method to evaluate the aforementioned adaptation measures is examined in this study, focusing on their appropriate introduction on urban space. The influence of the solar transmittance of adaptation measures such as shading, on mean radiant temperature (MRT) is approximately 1.5 °C per 0.10. If a shielding device that reflects a large amount of solar radiation and facilitates high levels of evaporation is developed, MRT and standard new effective temperature (SET*) will both decrease.

1. Introduction

Mitigation measures such as green roof, cool roof (with a high reflectance material), and water-retentive materials, have been developed with the expectation that they will serve as countermeasures to the urban heat island [1,2,3,4]. In recent years, in order to serve as effective solutions to outdoor human thermal environments under the influence of urban heat islands, adaptation measures such as awnings, louvers, directional reflective materials, mist sprays, and evaporative materials have been developed. A simple method to evaluate these adaptation measures focusing on their appropriate introduction into urban space has been here investigated.
The Japanese Ministry of the Environment developed the ‘Heat countermeasure guideline in the city’ [5], which includes basic, specific adaptation measures, and technical sections. The guideline states that ‘by understanding the factors that make it hot and implementing appropriate adaptation measures for places we have to wait for or places we want to spend comfortably such as bus stops and plazas, we can promote a healthy and comfortable environment in the urban area’ (p. 11 of [5]). In the basic section, the adaptation measures against heat are explained in an accessible manner for the Japanese administration and the general public. In the specific adaptation measures section, the type and effect of adaptation measure technologies and precautions to be considered upon introducing them are explained for the general public and practitioners involved in town development. In the technical section, technical information on adaptation measure technologies is explained for building and external construction design practitioners.
Several studies focused on effective measures against heat waves have been implemented in various countries [6,7]. Evaporative cooling effects such as irrigation [6,7], vegetation and pavement watering [7] have been studied by the numerical simulation. Some of those scenarios assumed the future climate affected by climate change [7,8]. Discussions including the improvement of thermal environments in the street canyon or in the plaza were not sufficiently conducted based on the evaluation of the human thermal comfort in previous examinations [9,10,11].
In Germany, several cities are considering adaptation measures. According to a report from Karlsruhe City [12], it is recommended that appropriate adaptation measures be introduced in ‘hot spots’ where temperatures are high. Several typical urban districts in cities that may undergo adaptation in the future are also discussed. Within the Osaka Heat Island Countermeasure Technology Consortium [13], adaptation technologies developed by various companies were presented and evaluation methods were discussed so that they may be properly implemented in society. In this study, a specific method to evaluate adaptation measures is discussed, considering these efforts in Japan.

2. Adaptation Measures

The adaptation measures for urban heat islands listed in the heat countermeasure guidelines established by the Japanese Ministry of Environment [5], the report by the Japanese Ministry of Environment [14], and the town planning idea competition considering the urban heat island presented at the Osaka Heat Island Countermeasure Technology Consortium [15] are shown in Table 1. The mechanisms by which these methods work and the evaluation indices governing their effects are also presented. Heat is mainly mitigated by solar shading, solar reflection, and evaporation. Therefore, solar transmittance, solar reflectance, and evaporative efficiency (evaporative rate) are the primary evaluation indices. The increase in the convection heat transfer coefficient is the cause of cooling by fractal-shaped sunshades, and the artificial cooling is the cause of cooling by ceiling cooling systems and water cooling benches. Examples of adaptation measures developed by Japanese companies are shown in Figure 1, Figure 2 and Figure 3 [14]. Experiments demonstrating these measures are currently proceeding throughout Japan [5,14,15,16,17,18,19,20,21,22,23,24,25,26,27,28].

3. Simple Evaluation Method of Adaptation Measures

3.1. Methods

The effect of the studied adaptation measures is evaluated by outdoor human thermal comfort, which is strongly correlated to the outdoor thermal environment. As Nouri et al. [29] pointed out, the selection of the index for the assessment of outdoor thermal comfort conditions is still a debated matter [30]. They stated that, “So far, within the international community various indices have been developed and disseminated, including the (i) Standard Effective Temperature (SET*) [31]; (ii) Outdoor Standard Effective Temperature (OUT_SET*) [32,33]; (iii) Perceived Temperature (PT) [34]; (iv) Predicted Mean Vote (PMV) [35,36]; (v) Index of Thermal Stress (ITS) [37]; (vi) Predicted Percentage of Dissatisfied (PPD) [35]; (vii) COMFA outdoor thermal comfort model [38]; (viii) Universal Thermal Climate Index (UTCI) [39,40,41]; (ix) Wet Bulb Globe Temperature (WBGT) [42,43]; and (x) Predicted Heat Strain (PHS) [44,45,46].” They also demonstrated the necessity of standardizing a thermal comfort index for specific regions. Currently, different indices are widely used by each academic community. Physiologically Equivalent Temperature (PET) is widely used in Europe; it has been defined as the air temperature at which, in a typical indoor setting, the human energy budget is maintained by the skin temperature, core temperature, and perspiration rate, which are equivalent to those under the conditions to be assessed [47,48]. In Japan, SET* and WBGT are mainly used. WBGT, which is a stress index worldwide accepted as a preliminary tool for the assessment of hot thermal environments [49,50,51], is often used under more severe conditions to warn of the risk of heat stroke. SET* is defined as the equivalent dry bulb temperature of an isothermal environment at 50% RH in which a subject, while wearing clothing standardized for the activity concerned, would have the same heat stress and thermo-regulatory strain as in the actual test environment [31], is used to evaluate the thermal environment [5]. The relationship between SET* and thermal comfort, which is based on the results of a declaration test for the outdoor comfort of Japanese people, is shown in Table 2 [52]. SET* is desirable as an index from the viewpoint of appropriately introducing adaptation measures in urban areas and developing a more comfortable outdoor space as it exhibits a good relationship with outdoor thermal comfort [53].

3.1.1. Sensitivity Analysis

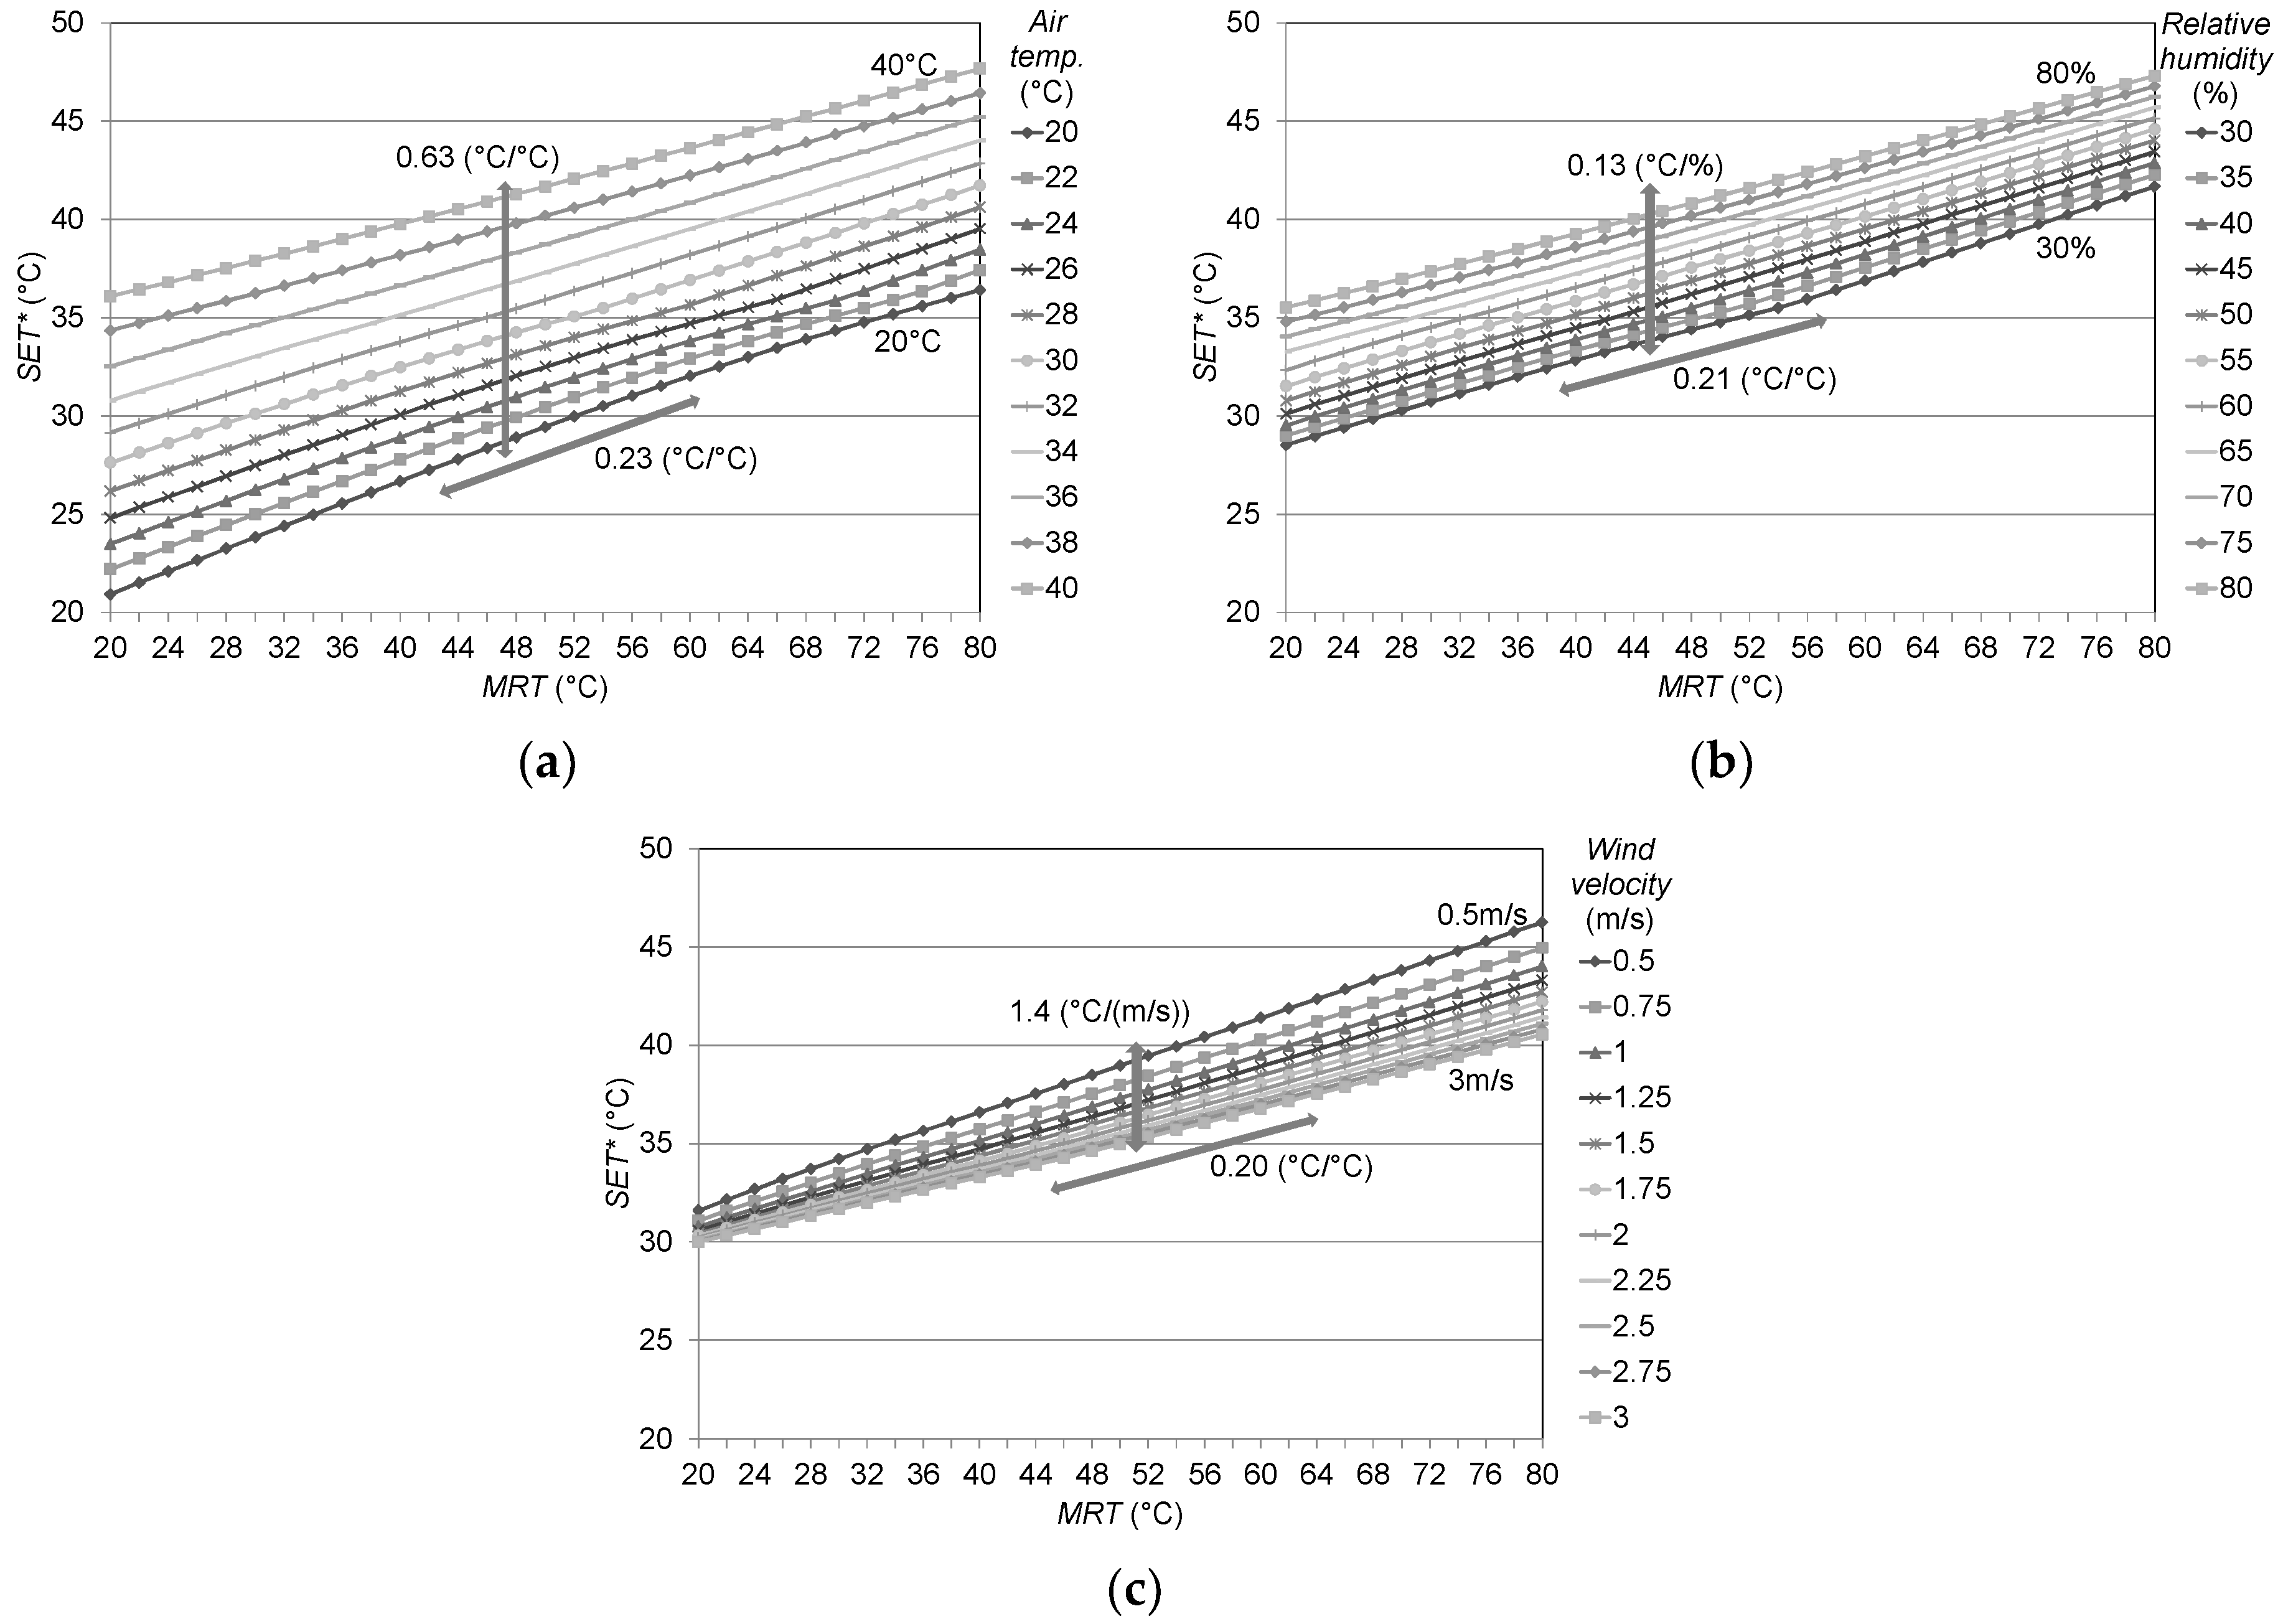
Assuming a typical summer day as a standard condition; under which the air temperature is 34 °C, relative humidity is 50%, wind speed is 1 m/s, mean radiant temperature (MRT) in a sunny place is 50 °C or 37 °C in a shaded place, clothing insulation is 0.6 clo, and metabolic rate is 2 Met; a SET* sensitivity analysis was conducted with a variation range of 20 °C to 40 °C for air temperature, 30% to 80% for relative humidity, 0.5 m/s to 3 m/s for wind speed, and 20 °C to 60 °C for MRT [54,55].

3.1.2. MRT and Surface Temperature Reduction Evaluation

The decrease in MRT caused by solar radiation shielding was dominant over the improvement in SET*. Assuming the implementation of adaptation measures such as shading, MRT was evaluated using the following indices: solar transmittance τ, evaporation rate E, solar absorptance a, and convective heat transfer coefficient h. Assuming that the human body is spherical with a solar absorptance ah which is assumed to be 0.5, MRT can be calculated from Equation (1) [55,56,57]:
  M R T = ( a h Q / σ + i = 1 Φ i T i 4 ) 1 4
With reference to previous studies in Japan [54,55], the weather conditions during a typical summer day were assumed as follows; solar radiation J was 1000 W/m2 (direct solar radiation was 900 W/m2 and diffuse solar radiation was 100 W/m2), each surface temperature Ti was the same as the air temperature Ta (Ti = Ta = 34 °C), the MRT under clear sky conditions was 56.2 °C. While the relationship between the human body and the surrounding objects is varied actually, in order to simplify the discussion, it is supposed to be a human body on a green area that has been thoroughly irrigated. The incident solar radiation on the human body was calculated by Q = 900/4 + 100 W/m2, as the human body was assumed to be a sphere. σ is the Stefan–Boltzmann constant (=5.67 × 10⁻⁸ W/(m2K4)), and Φi is the shape factor between the human body and each surface.
Surface temperature Ts of the adaptation measures is calculated from Equation (2):
T s = 1 h ( a J + ε q l E ) + T a
where, ε is emissivity, q is net infrared radiation and l is the latent heat of vaporization of water (=2500 kJ/kg).

3.2. Results

3.2.1. Sensitivity Analysis

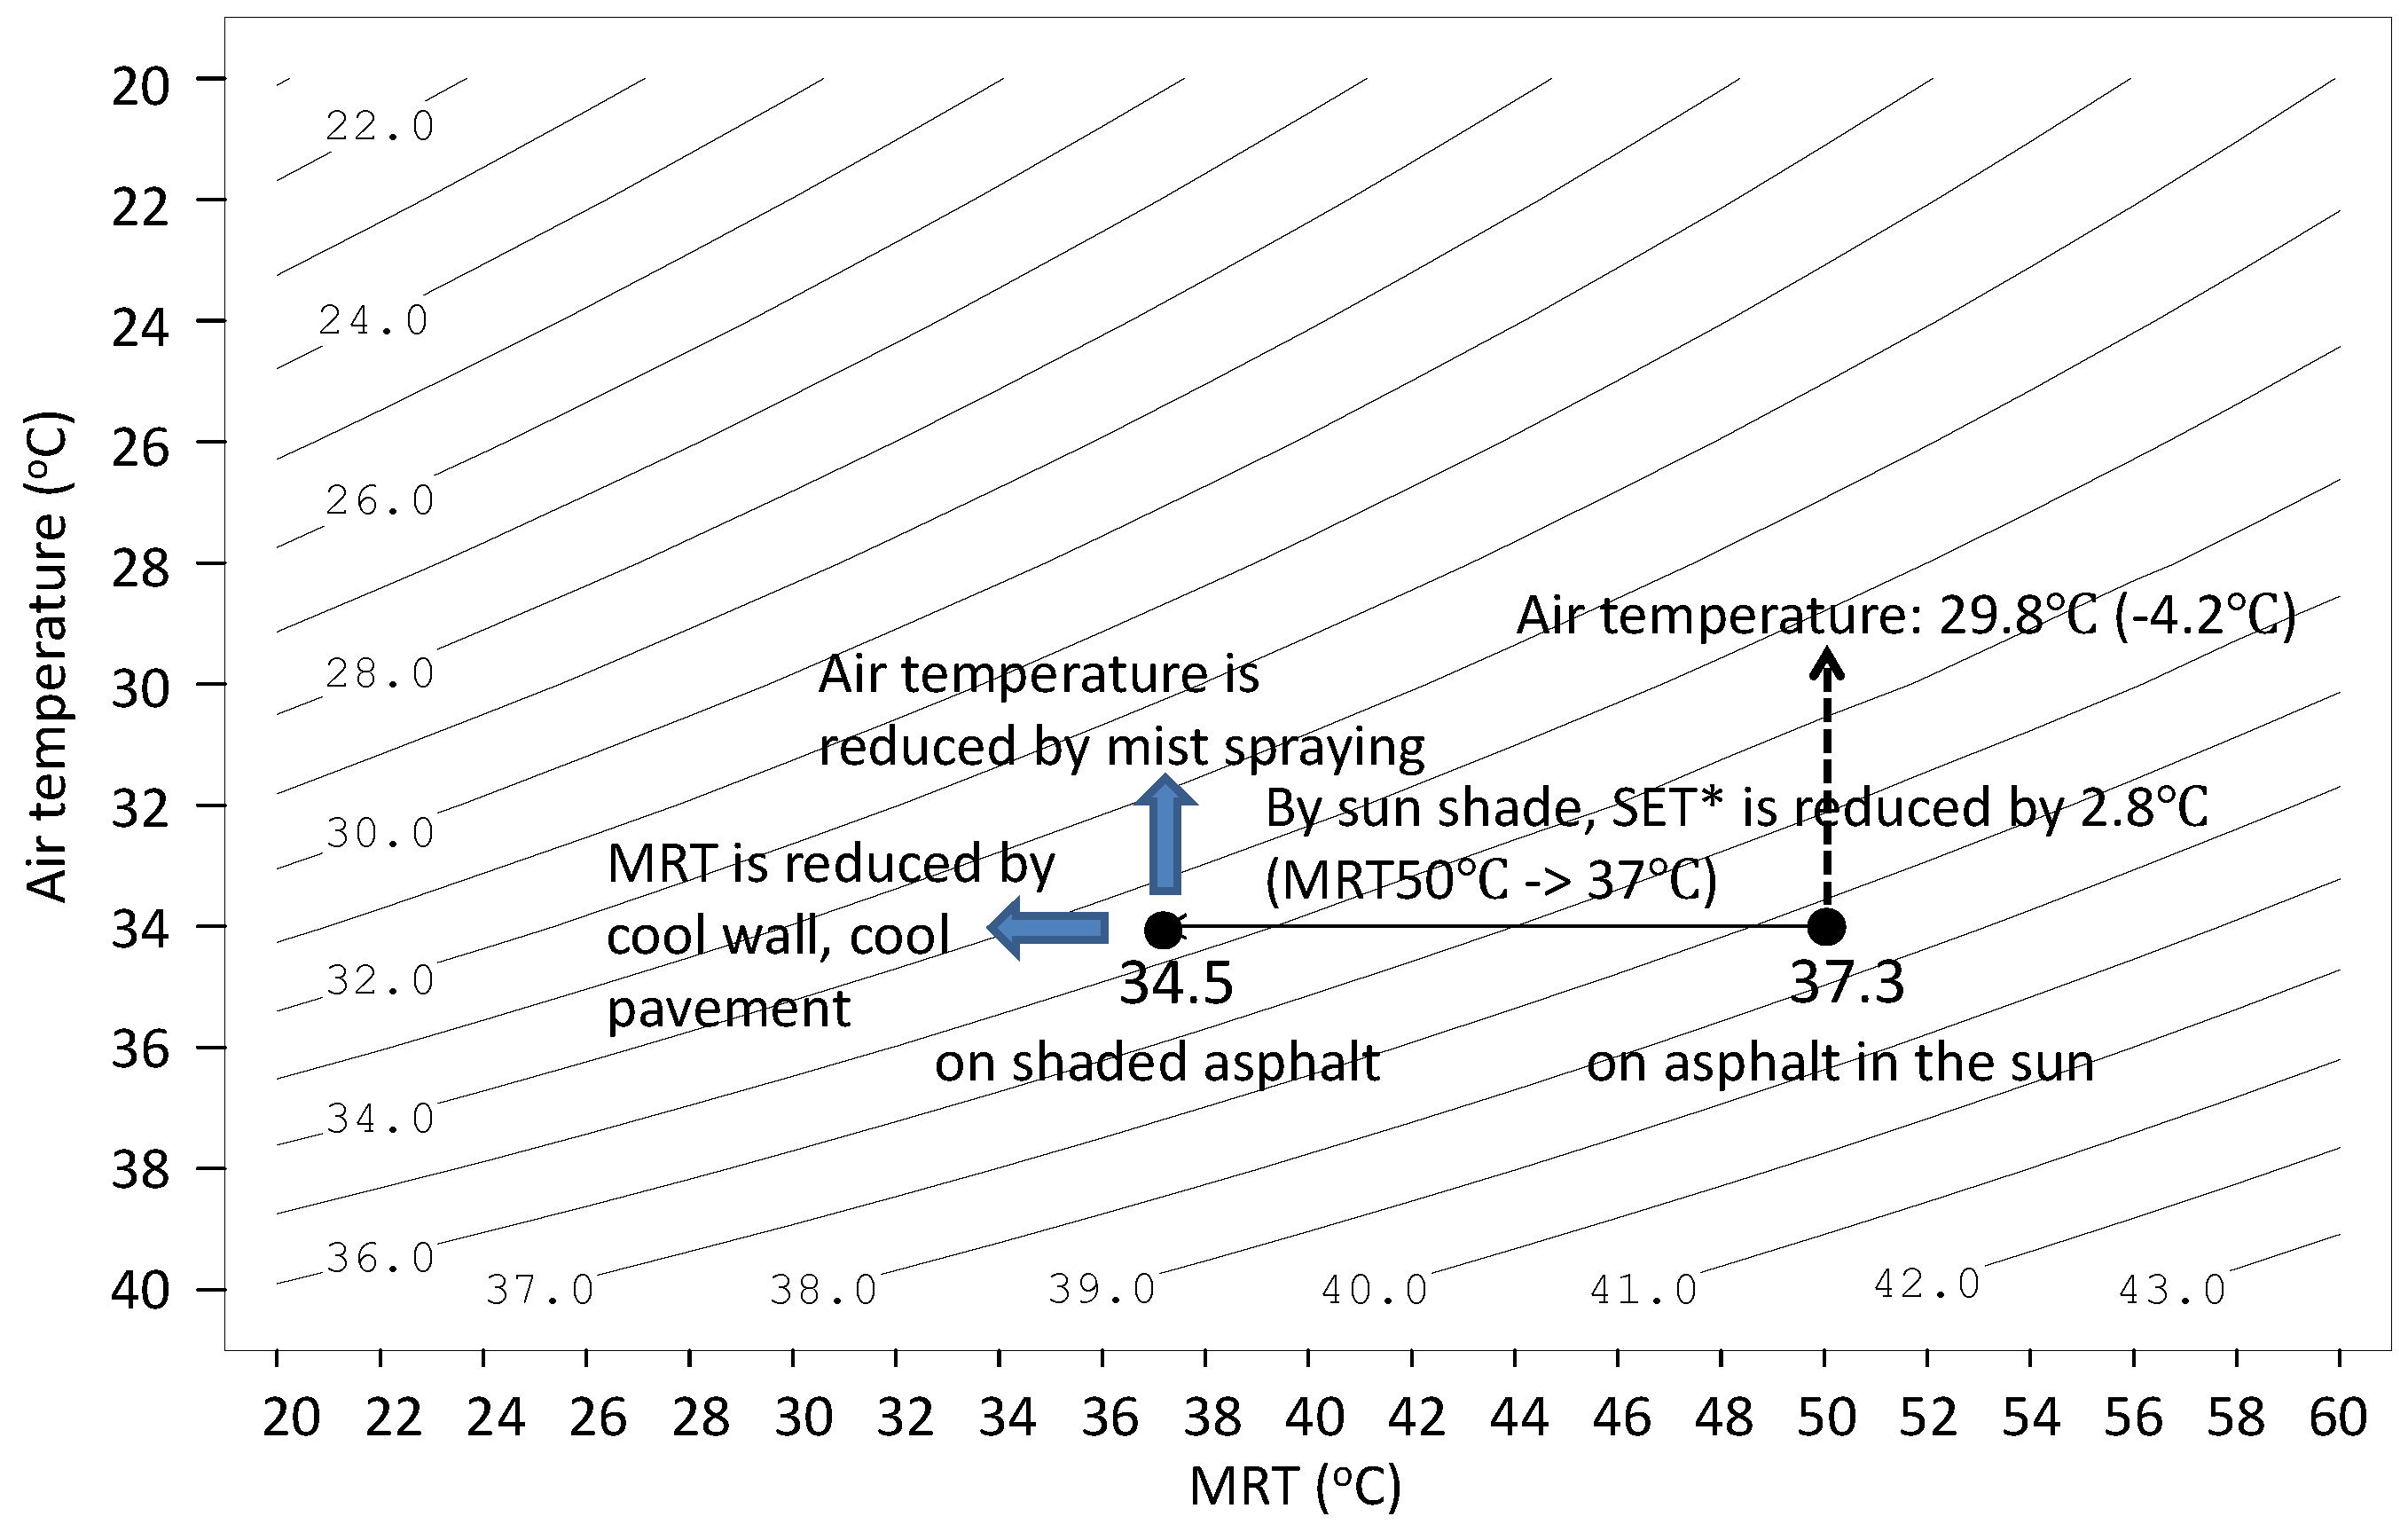
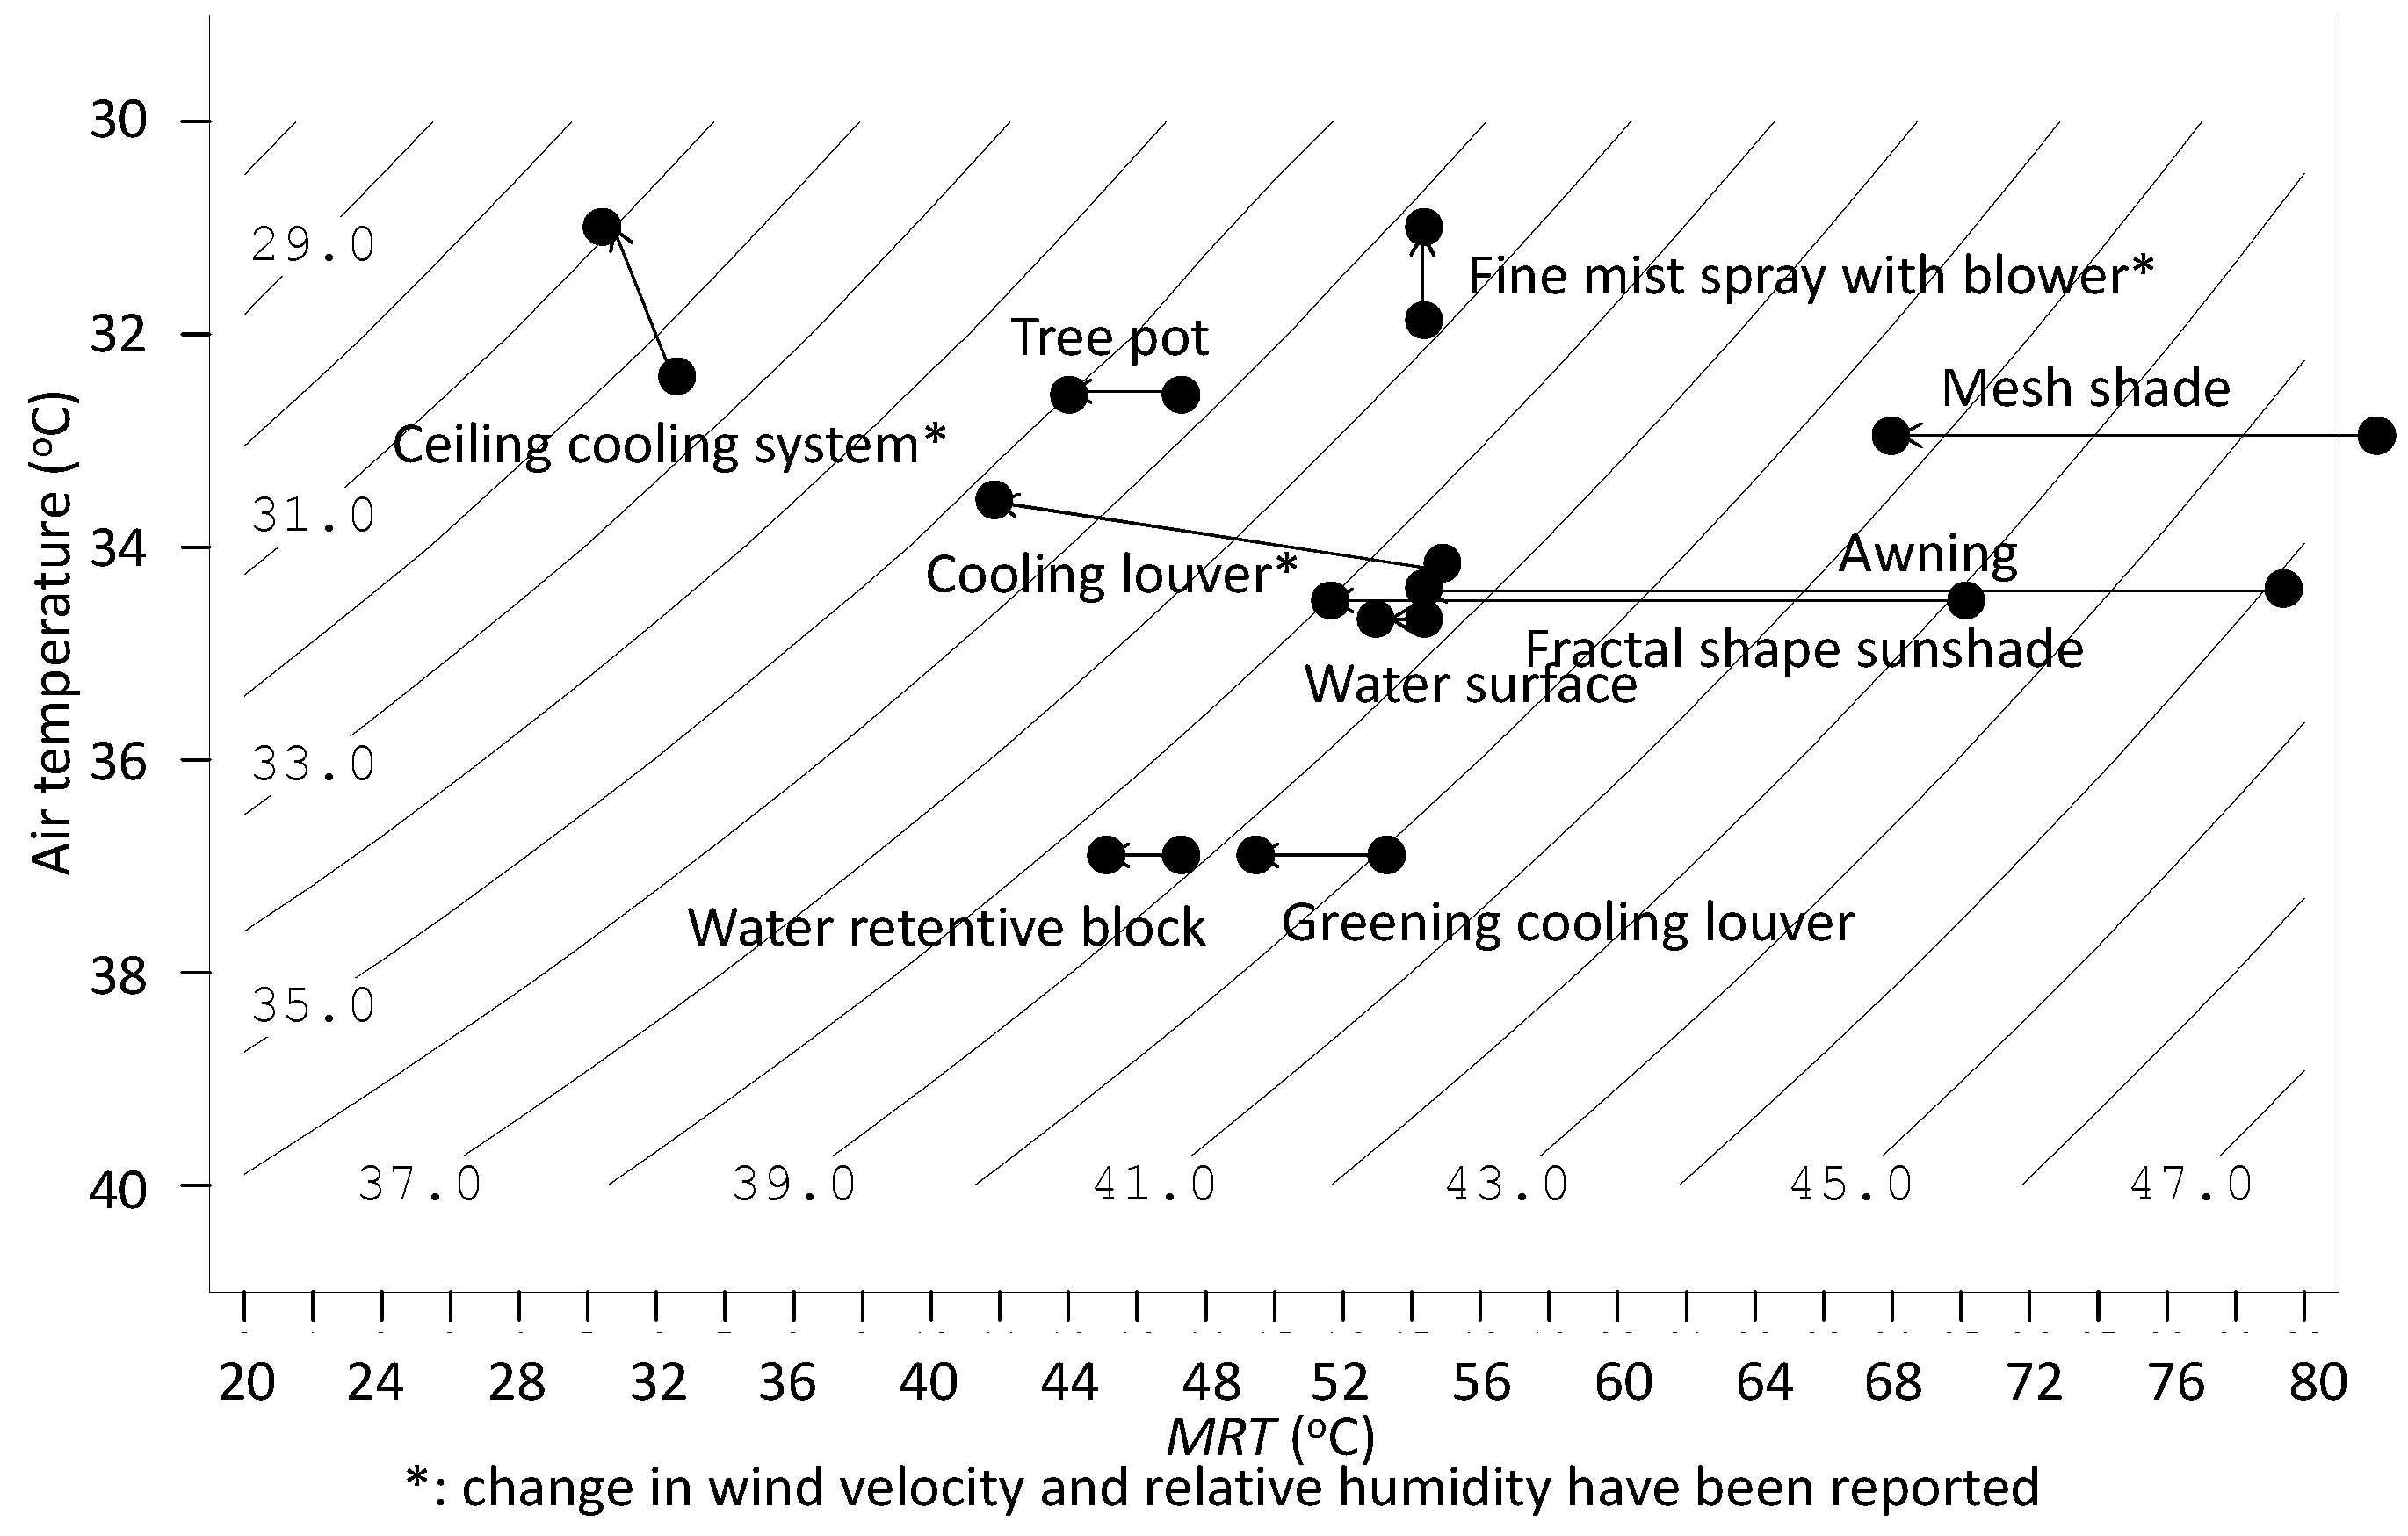
Sensitivity analysis results are shown in Figure 4. The sensitivities by air temperature, relative humidity, wind speed, and MRT were 0.63 °C/°C, 0.13 °C/%, 1.4 °C/(m/s), and 0.21 °C/°C, respectively. The sensitivities by MRT and wind speed were larger than those by air temperature and relative humidity, however, they were within the expected variation range of each element. The relationship between air temperature, MRT, and SET* is shown in Figure 5. SET* is indicated by a contour line. Above-standard conditions were set for the other elements. If the evaluation point moved from a sunny to a shaded place, the MRT decreased by 13 °C and SET* decreased by 2.8 °C. To obtain the same decrease in SET* due to air temperature reduction by mist spraying, it must be lowered by 4.2 °C. Similarly, it is difficult to considerably reduce MRT using cool walls and pavements. Examples of the effects of adaptation measures obtained by demonstrative experiments are shown in Figure 6. As MRT was measured by a globe thermometer, the solar absorptance was set to 1.0, which was much larger than that of the human body. The measurements were taken at various places and times under typical summer weather condition, therefore, a simple mutual comparison was not appropriate. It was, however, possible to qualitatively recognize the characteristics of each adaptation measure [14]. Shielding of solar radiation to pedestrians was a more effective method of lowering MRT and SET*.

3.2.2. MRT and Surface Temperature Reduction Evaluation

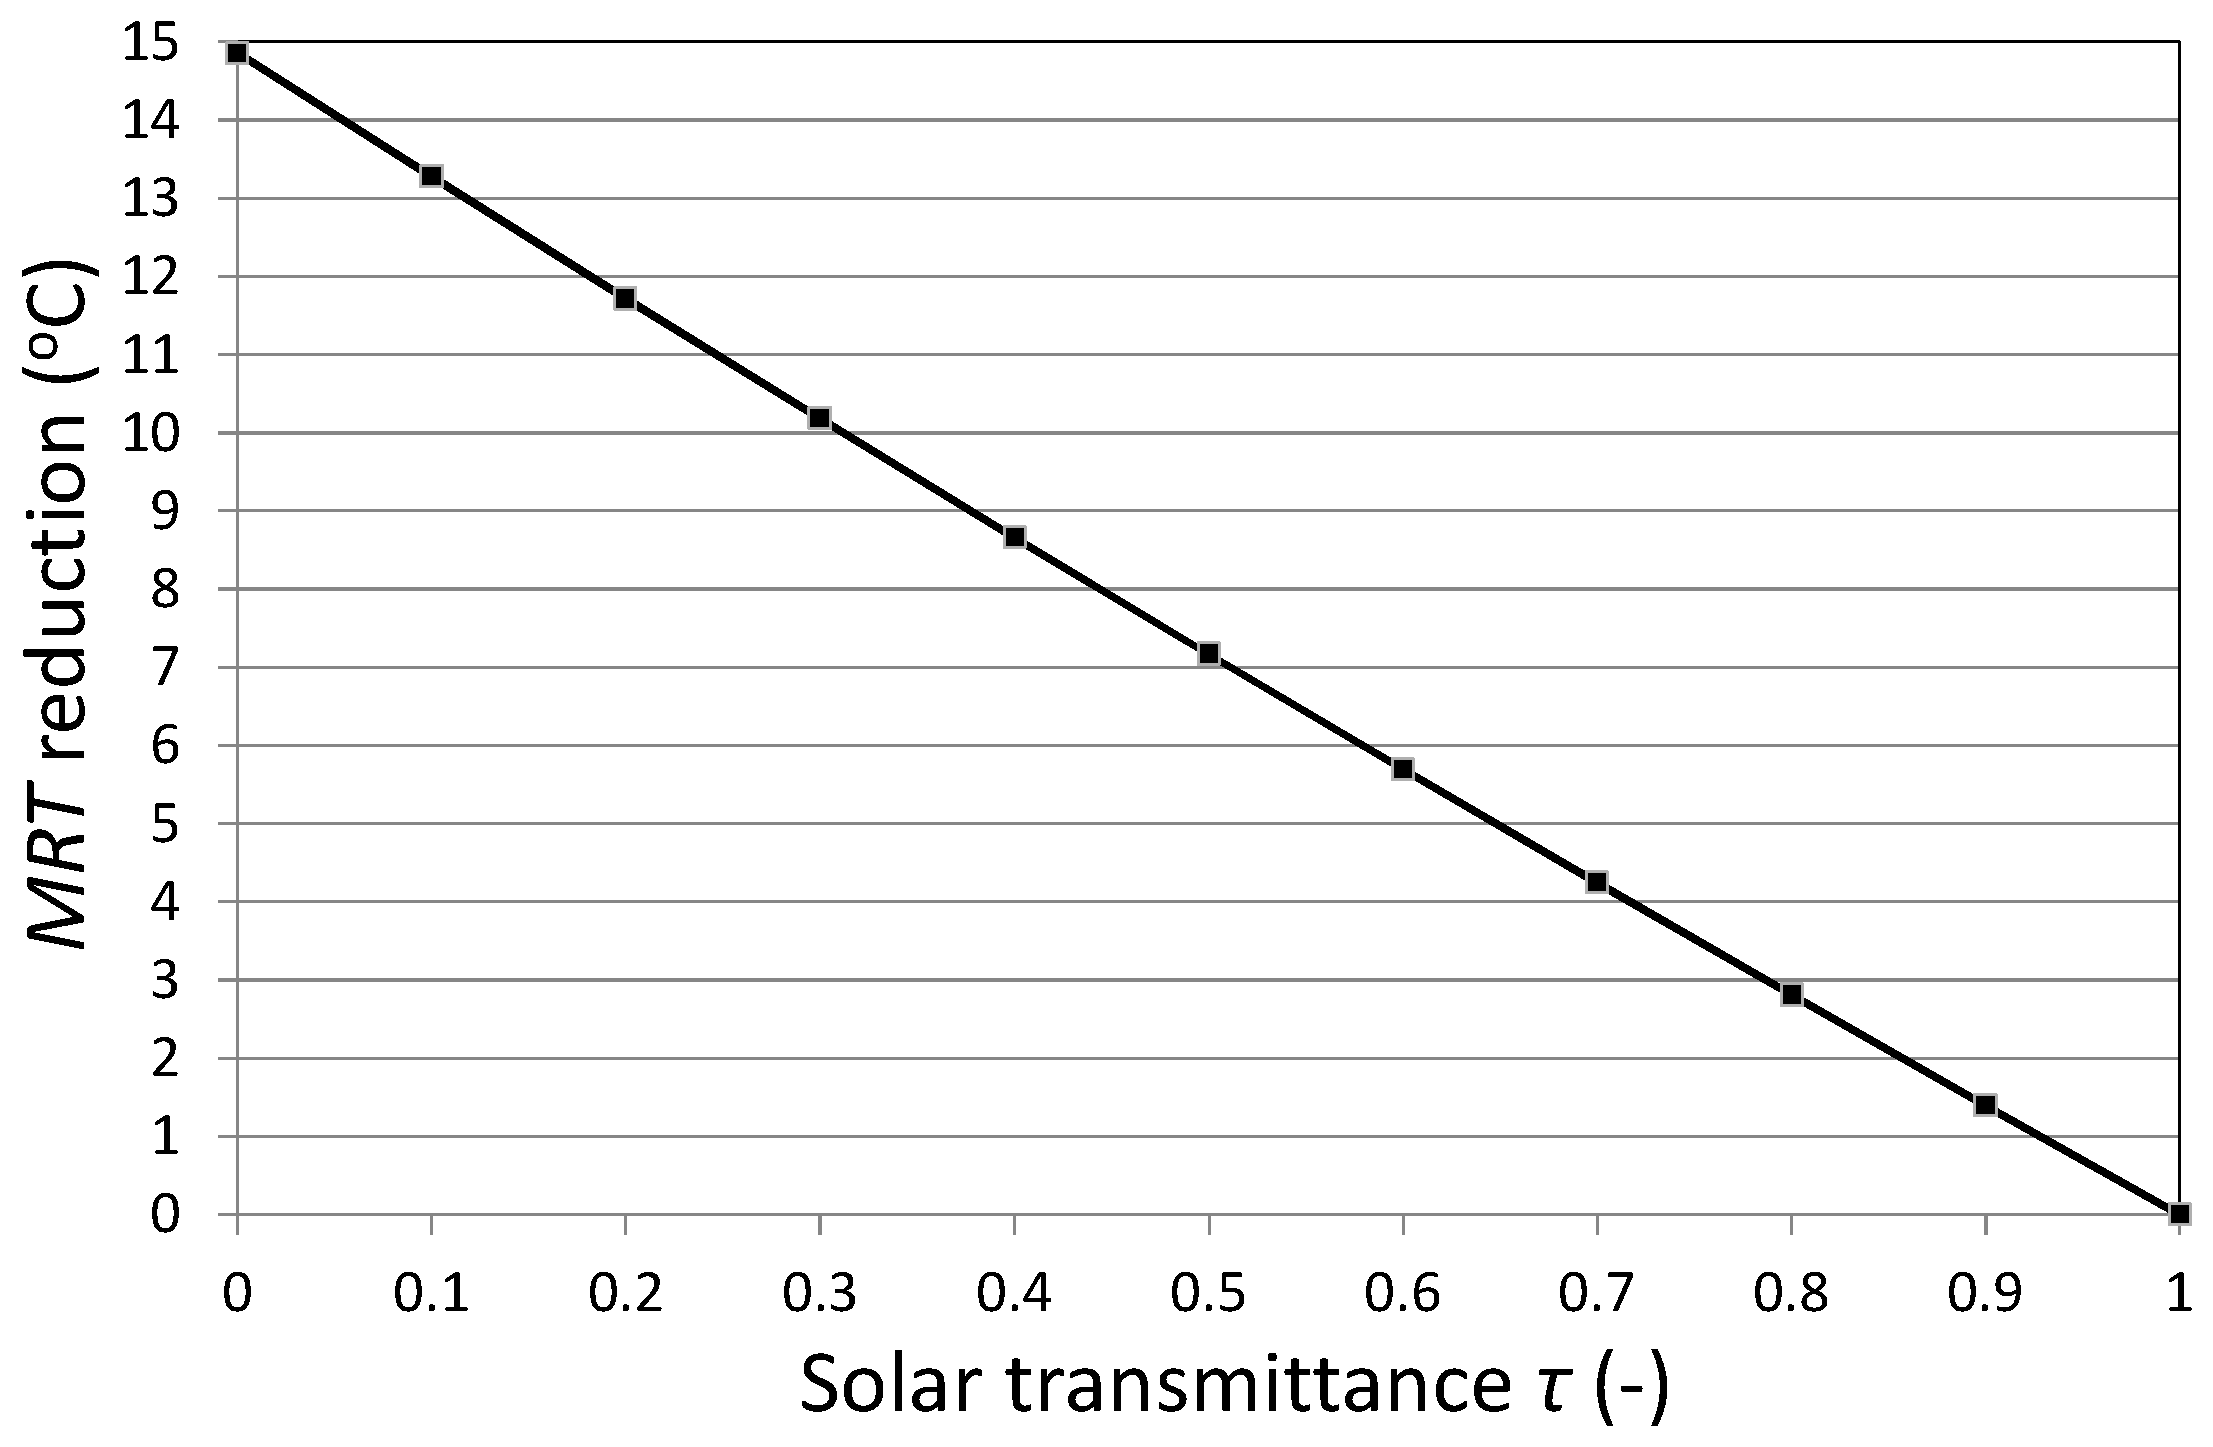
The relationship between solar transmittance τ and MRT reduction by adaptation measures such as an awning, is shown in Figure 7. If the influence of long-wave radiation was ignored, complete shielding of solar radiation decreased the MRT by 15 °C.
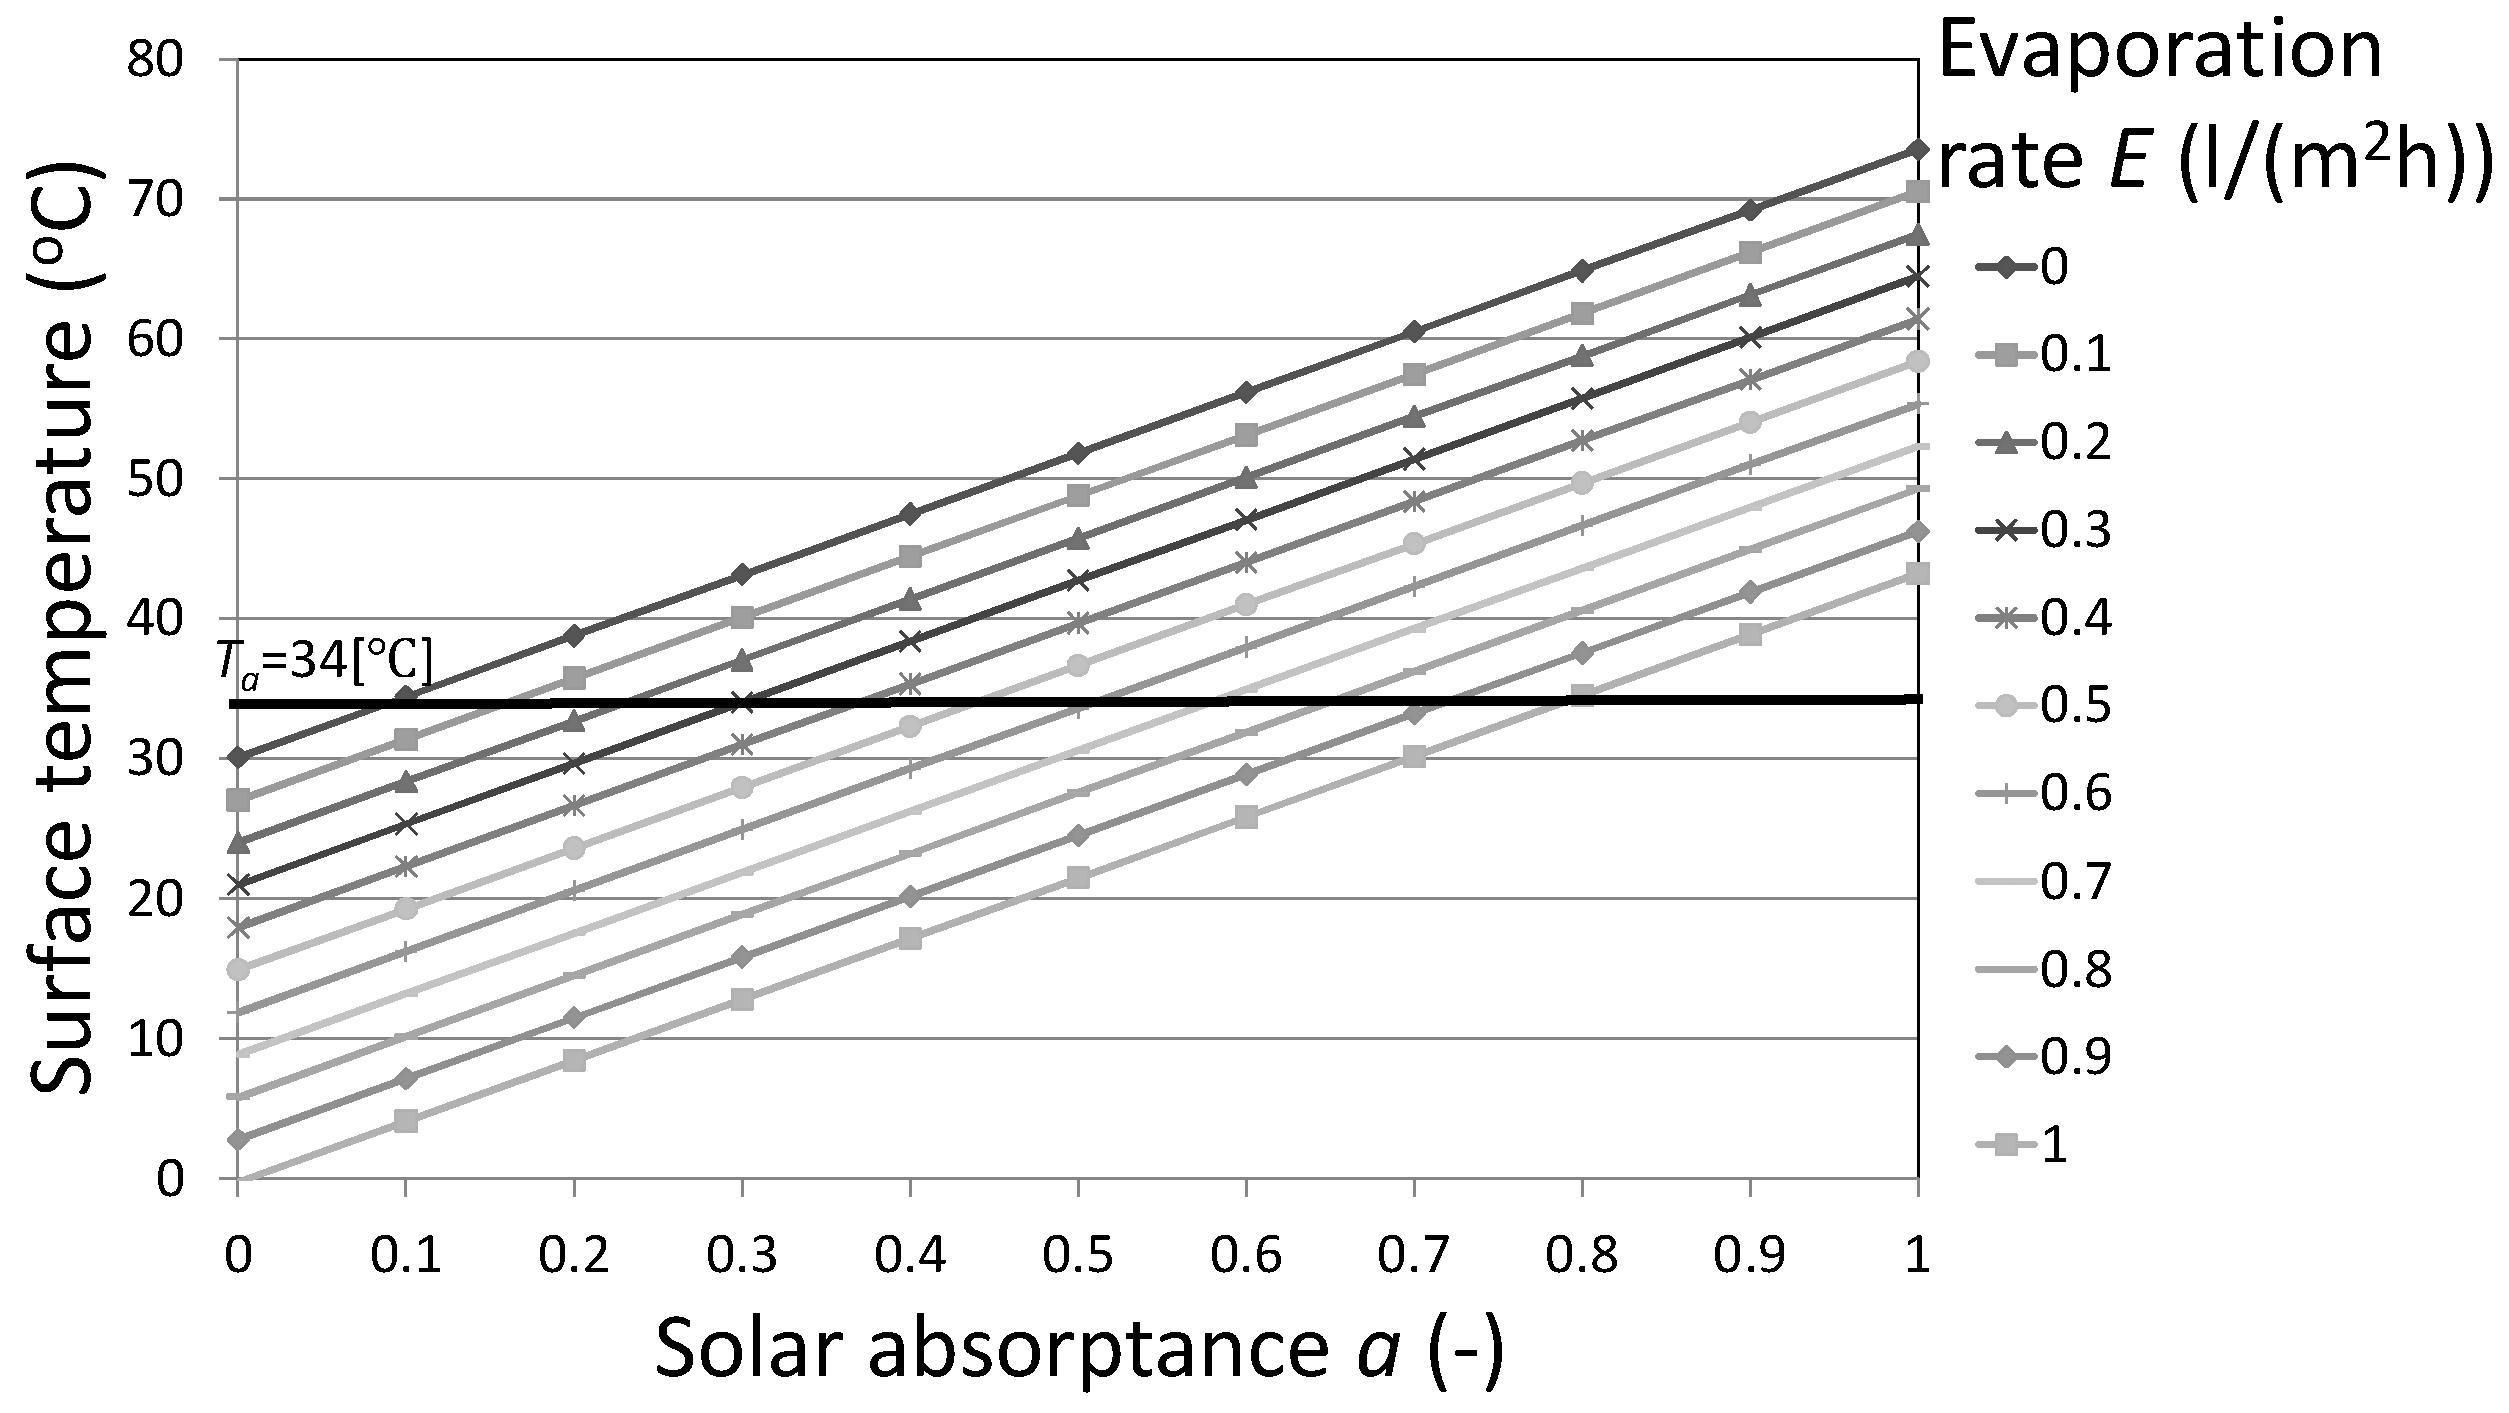
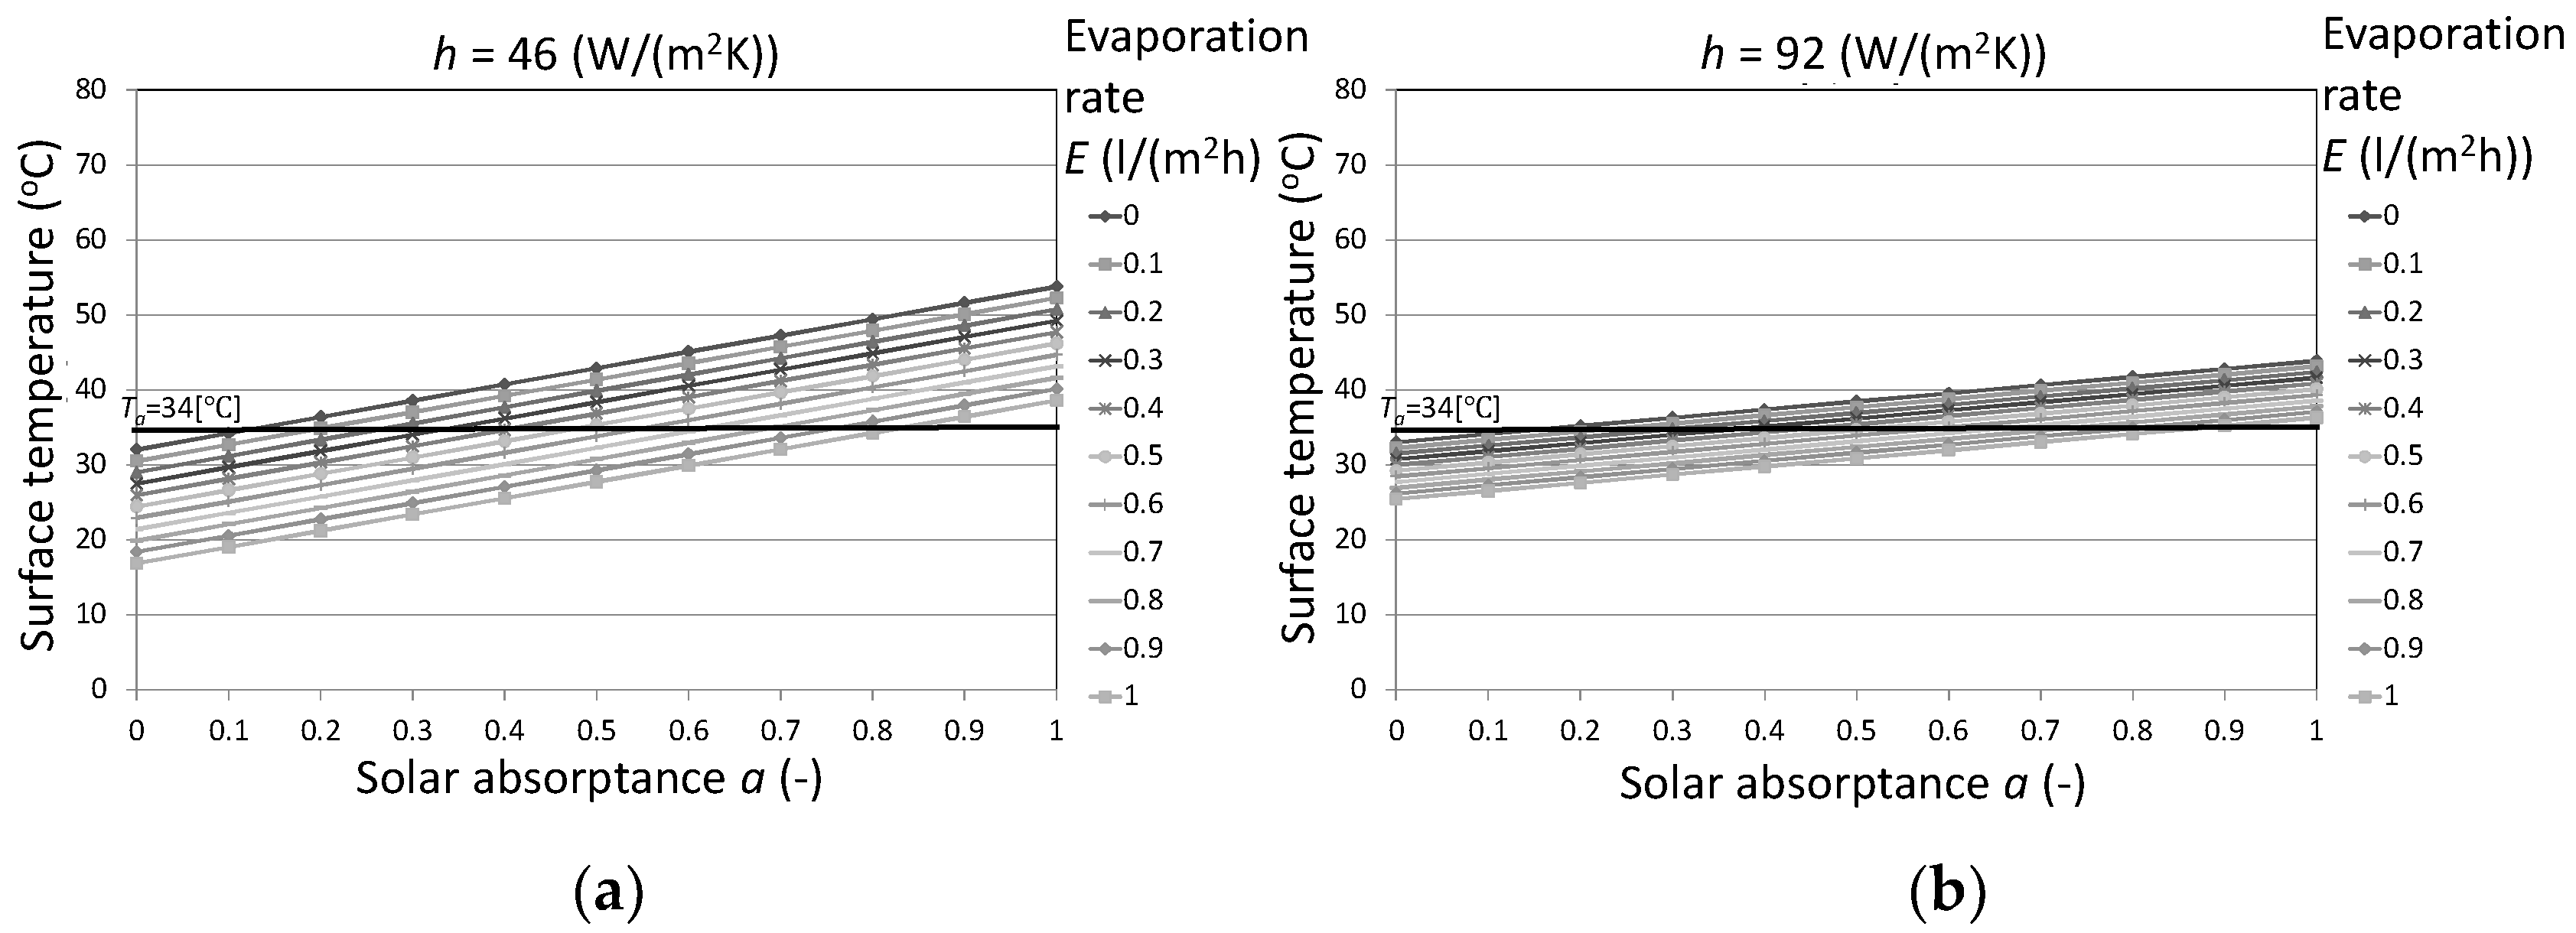
The relationship between the surface temperature Ts of the adaptation measures and the solar absorptance a when the heat transfer coefficient h is 23 W/(m2K), emissivity ε is 0.97, and net infrared radiation q is −93 W/m2 for different values of the evaporation rate E is shown in Figure 8. Although net infrared radiation q and the evaporation rate E varied depending on weather conditions such as surface temperature, air temperature, and wind velocity, they were set to specific values to allow simple evaluation. Even if the evaporation rate E was 0 L/(m2h), when the solar radiation absorptance a was 0.1, the surface temperature Ts was almost the same as the air temperature. The surface temperature Ts when the heat transfer coefficient h is 46 or 92 W/(m2K) is shown in Figure 9. A fractal-shaped sunshade was developed focusing on the utilization of the effect caused by increasing the heat transfer coefficient [17]. As the heat transfer coefficient h increased, the surface temperature Ts approached the air temperature value regardless of the solar absorptance a and evaporation rate E.
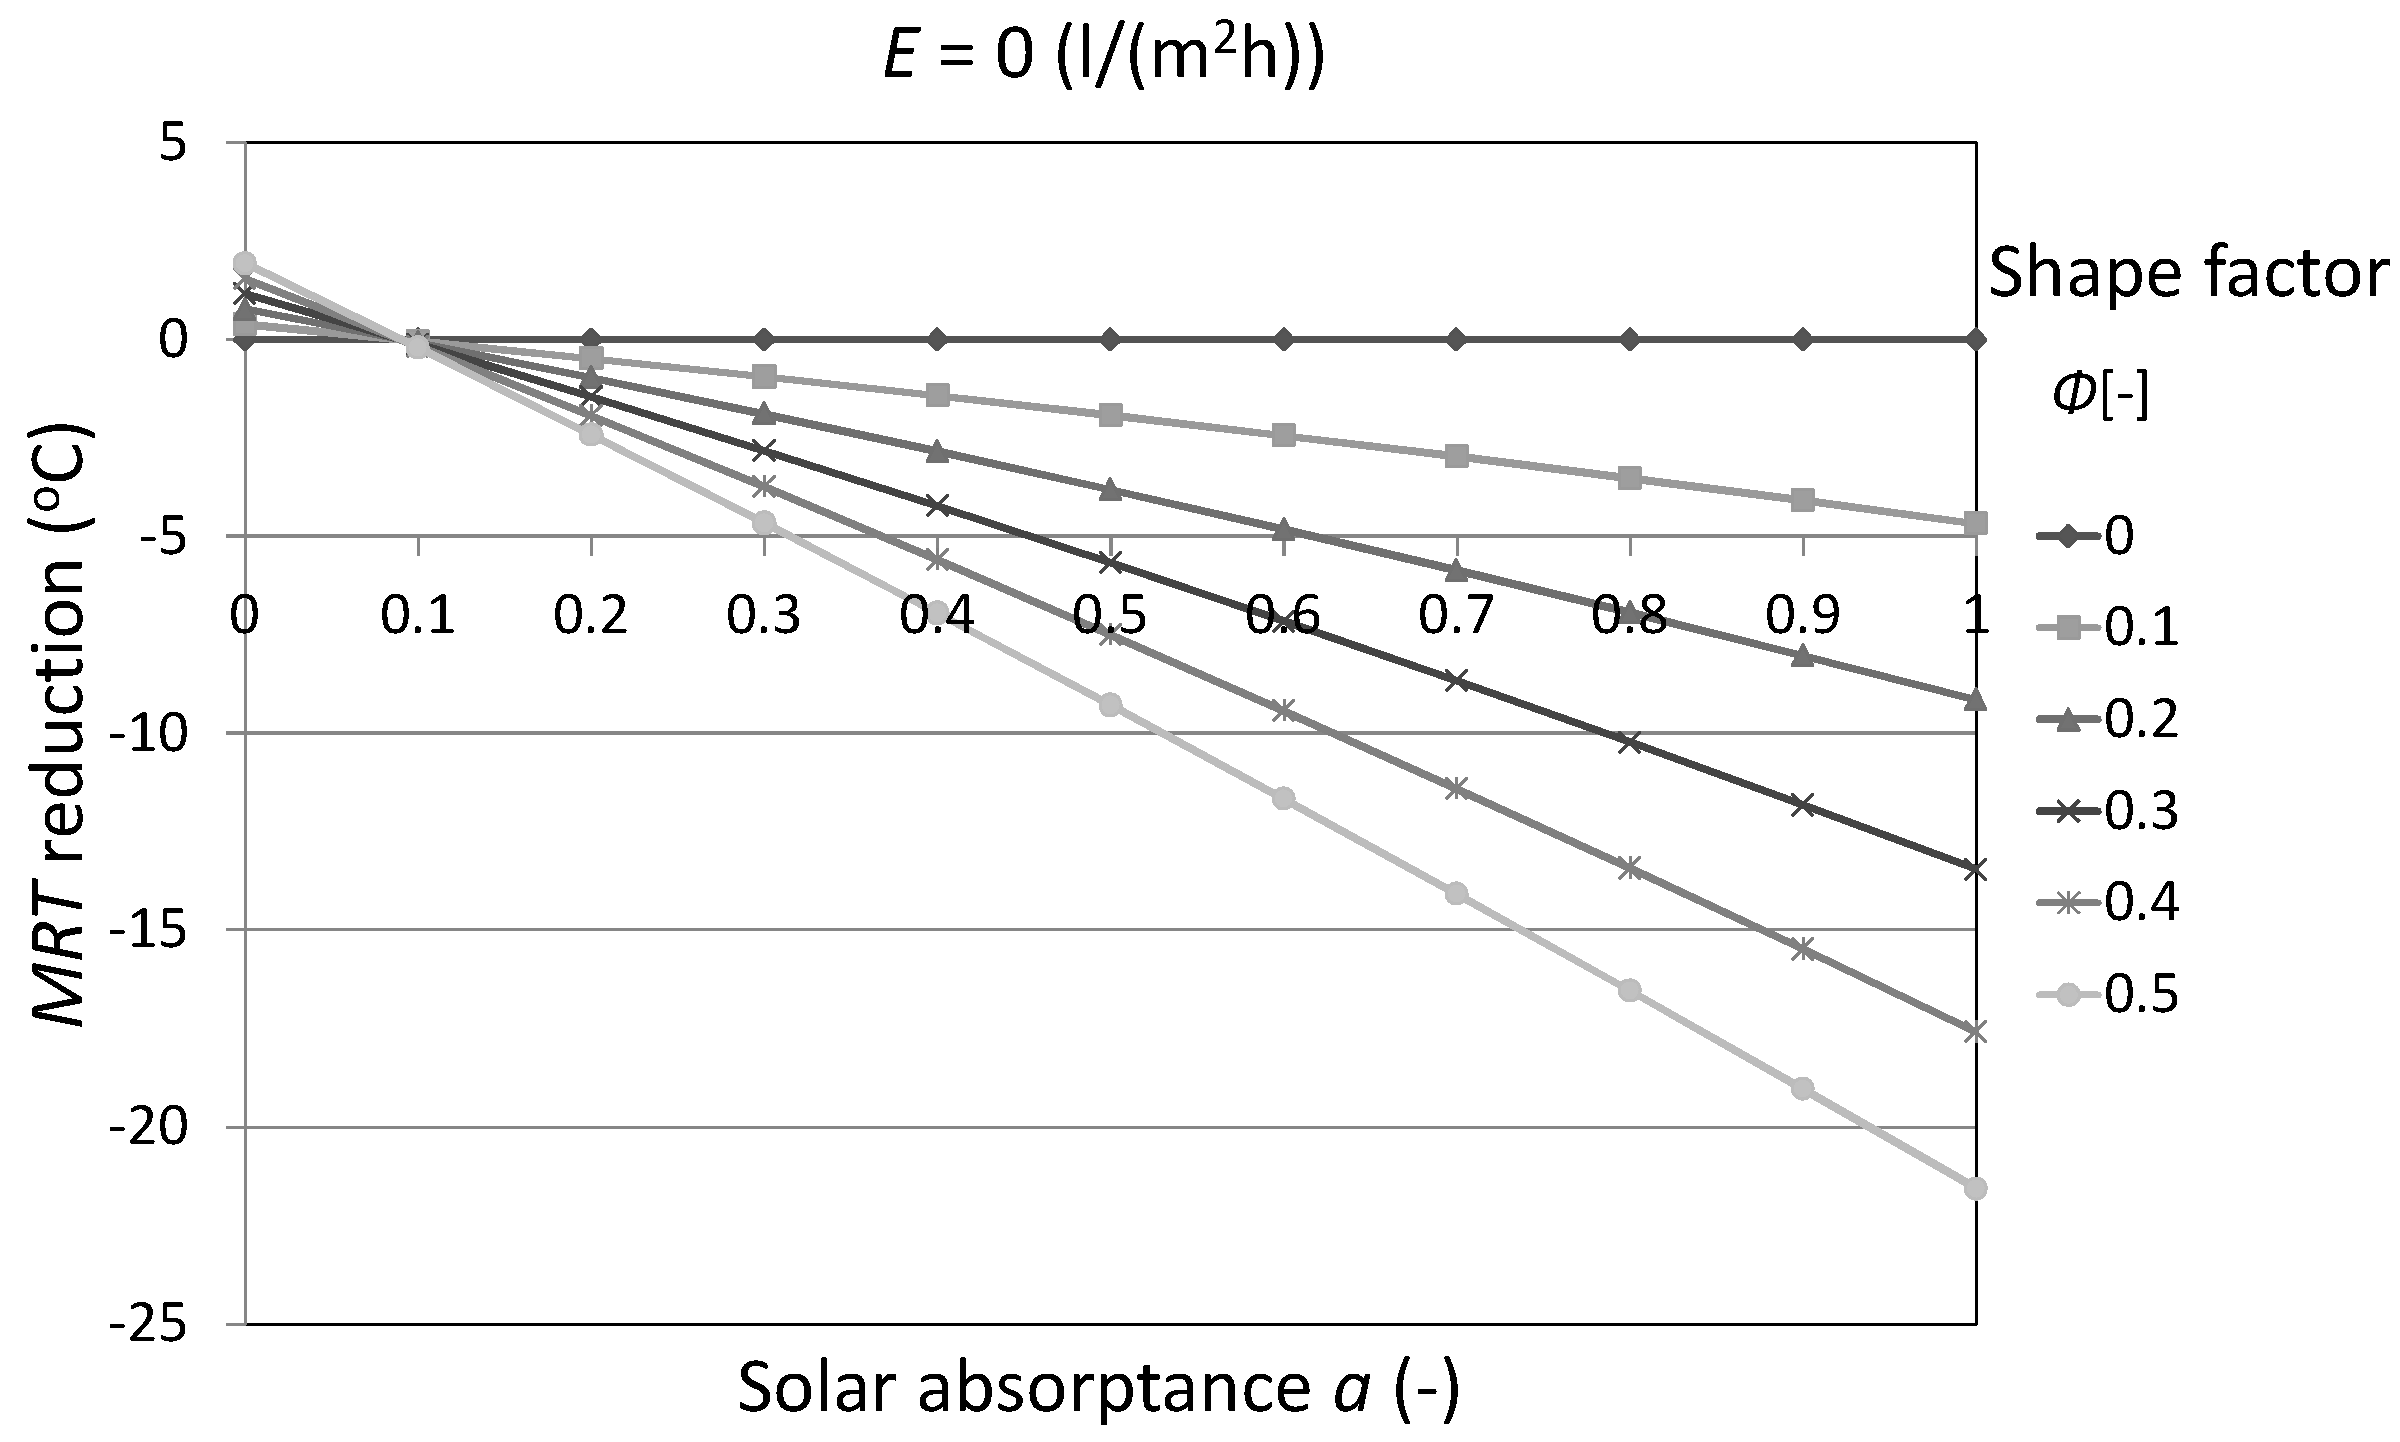
The relationship between the MRT reduction and the solar absorptance a when the evaporation rate E is 0 L/(m2h) for different values of the shape factor Φ of the human body is shown in Figure 10. When the shape factor Φ and solar absorptance a were large, the MRT increased due to the effect of long-wave radiation from the adaptation measures.
The relationship between the MRT reduction and the solar transmittance τ when the evaporation rate E is 0 L/(m2h) and the shape factor of the human body Φ is 0.3 for different values of the solar absorptance a is shown in Figure 11. When the targeted MRT reduction was 10 °C, the required solar transmittance τ plus solar absorptance a was 0.4 or less.
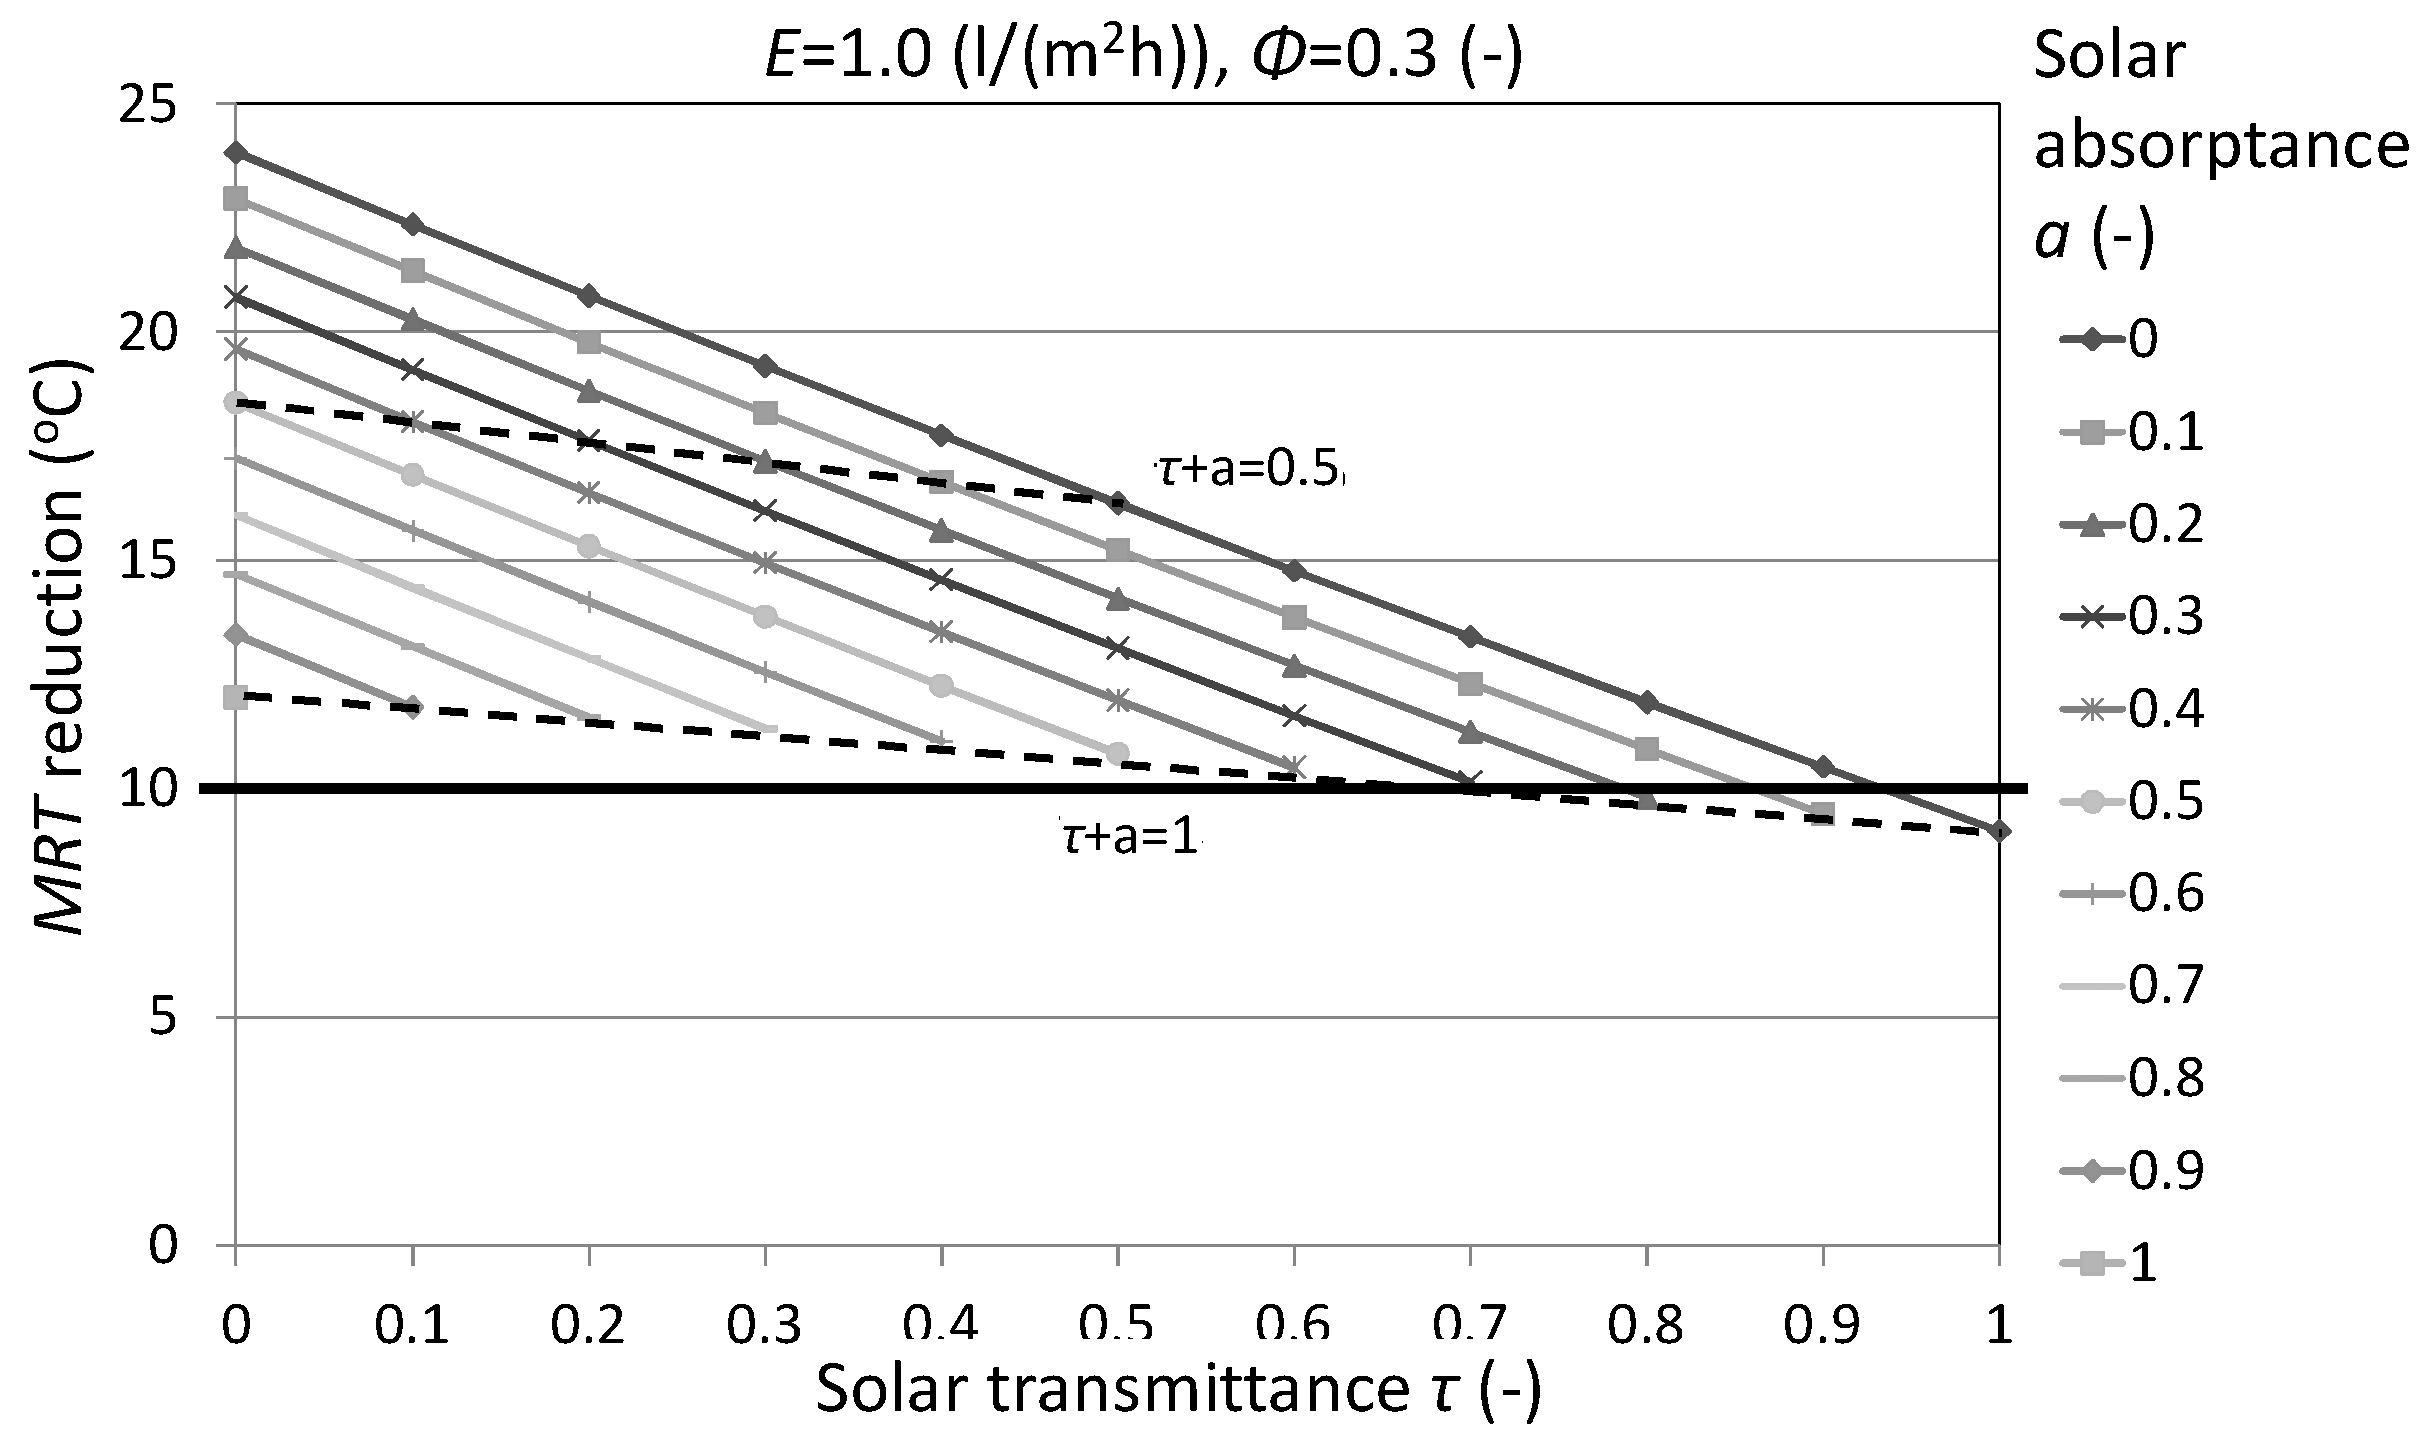
The relationship between the MRT reduction and the solar transmittance τ when the evaporation rate E is 1.0 L/(m2h) and the shape factor of the human body Φ is 0.3 for different values of the solar absorptance a is shown in Figure 12. If the evaporation rate E was 1.0 L/(m2h) or more, MRT decreased by 10 °C regardless of solar transmittance τ and solar absorptance a.

4. Discussion

In a typical summer day weather condition, if the evaluation point moved from a sunny to a shaded place, the MRT decreased by 13 °C and SET* decreased by 2.8 °C. Watanabe et al. have revealed that the globe temperature in sunlight was higher than that in the building shade by 16.7 °C and was 13.9 °C higher than that in the pergola shade in a clear day with global solar radiation of 800 W/m2 [55]. Changes in the MRT in this study and the globe temperature by Watanabe et al. due to solar shielding corresponded relatively. It is difficult to reduce MRT to this level using cool walls and pavements. Through several examples of the effects of adaptation measures obtained by demonstrative experiments [14], it can be seen shielding of solar radiation to pedestrians is a more effective method of lowering MRT and SET*. If the influence of long-wave radiation was ignored, complete shielding of solar radiation decreased the MRT by 15 °C. Even if the evaporation rate E was 0 L/(m2h), when the solar radiation absorptance of the adaptation measures a was less than 0.1, the surface temperature Ts was almost the same as the air temperature. A fractal-shaped sunshade was developed focusing on the utilization of the effect caused by increasing the heat transfer coefficient [17]. As the heat transfer coefficient h increased, the surface temperature Ts approached the air temperature value regardless of the solar absorptance a and evaporation rate E. When the shape factor between the human body and the adaptation measures Φ and solar absorptance a were large, the MRT increased due to the effect of long-wave radiation from the adaptation measures. When the targeted MRT reduction was 10 °C, the required solar transmittance τ plus solar absorptance a was 0.4 or less. If the evaporation rate E was 1.0 L/(m2h) or more, MRT decreased by 10 °C regardless of solar transmittance τ and solar absorptance a.

5. Conclusions

Through several examples of the effects of adaptation measures obtained by demonstrative experiments, it can be seen that shielding of solar radiation to pedestrians is a more effective method of lowering MRT and SET*. The influence of the solar transmittance of adaptation measures such as shading, on MRT is approximately 1.5 °C per 0.10. The influence of the solar absorptance of adaptation measures such as an awning, on MRT is approximately 1.0 °C per 0.10, which also depends on the shape factor between the human body and adaptation measures. The influence of the evaporation rate on MRT is approximately 1.0 °C per 0.10 L/(m2h). If a shielding device that reflects a large amount of solar radiation and facilitates high levels of evaporation is developed, MRT and SET* will both decrease.

Funding

This research received no external funding.

Acknowledgments

Part of the materials used in this study was provided by Ikusei Misaka of the Nippon Institute of Technology. The author thanks the members of the Study Committee of Osaka HITEC and the Cool Roof Proper Promotion Subcommittee of AIJ for their valuable comments.

Conflicts of Interest

The author declares no conflict of interest.

Nomenclature

εemissivity of the adaptation measures (-)
σStefan–Boltzmann constant (W/(m2K4))
τsolar transmittance of the adaptation measures (-)
Φishape factor between the human body and each surface (-)
asolar absorptance of the adaptation measures (-)
ahsolar absorptance of human body (-)
Eevaporation rate of the adaptation measures (L/(m2h))
hconvective heat transfer coefficient (W/(m2K))
Jsolar radiation (W/m2)
llatent heat of water (kJ/kg)
MRTmean radiant temperature (°C)
qnet infrared radiation (W/m2)
Qincident solar radiation on the human body (W/m2)
SET*standard effective temperature (°C)
Taair temperature (°C)
Tisurface temperature of each surface (°C)
Tssurface temperature of the adaptation measures (°C)

References

  1. Akbari, H.; Kolokotsa, D. Three decades of urban heat islands and mitigation technologies research. Energy Build. 2016, 133, 834–842. [Google Scholar] [CrossRef]
  2. Aleksandrowicz, O.; Vuckovic, M.; Kiesel, K.; Mahdavi, A. Current trends in urban heat island mitigation research: Observations based on a comprehensive research repository. Urban Clim. 2017, 21, 1–26. [Google Scholar] [CrossRef]
  3. Santamouris, M. Cooling the cities—A review of reflective and green roof mitigation technologies to fight heat island and improve comfort in urban environments. Sol. Energy 2014, 103, 682–703. [Google Scholar] [CrossRef]
  4. Santamouris, M. Using cool pavements as a mitigation strategy to fight urban heat island—A review of the actual developments. Renew. Sustain. Energy Rev. 2013, 26, 224–240. [Google Scholar] [CrossRef]
  5. The Ministry of the Environment of Japan, Heat Countermeasure Guideline in the City. Available online: http://www.env.go.jp/air/life/heat_island/guidelineH28/city_gline_all.pdf (accessed on 9 April 2018).
  6. Broadbent, A.M.; Coutts, A.M.; Tapper, N.J.; Demuzere, M. The cooling effect of irrigation on urban microclimate during heatwave conditions. Urban Clim. 2018, 23, 309–329. [Google Scholar] [CrossRef]
  7. Daniel, M.; Lemonsu, A.; Viguié, V. Role of watering practices in large-scale urban planning strategies to face the heat-wave risk in future climate. Urban Clim. 2018, 23, 287–308. [Google Scholar] [CrossRef]
  8. De Munck, C.; Lemonsu, A.; Masson, V.; Le Bras, J.; Bonhomme, M. Evaluating the impacts of greening scenarios on thermal comfort and energy and water consumptions for adapting Paris city to climate change. Urban Clim. 2018, 23, 260–286. [Google Scholar] [CrossRef]
  9. Baklanov, A.; Grimmond, C.S.B.; Carlson, D.; Terblanche, D.; Tang, X.; Bouchet, V.; Lee, B.; Langendijk, G.; Kolli, R.K.; Hovsepyan, A. From urban meteorology, climate and environment research to integrated city services. Urban Clim. 2018, 23, 330–341. [Google Scholar] [CrossRef]
  10. Gao, Z.; Bresson, R.; Qu, Y.; Milliez, M.; Munck, C.; Carissimo, B. High resolution unsteady RANS simulation of wind, thermal effects and pollution dispersion for studying urban renewal scenarios in a neighborhood of Toulouse. Urban Clim. 2018, 23, 114–130. [Google Scholar] [CrossRef]
  11. Ng, E.; Ren, C. China’s adaptation to climate & urban climatic changes: A critical review. Urban Clim. 2018, 23, 352–372. [Google Scholar] [CrossRef]
  12. Beermann, B.; Berchtold, M.; Baumüller, J.; Gross, G.; Kratz, M. Städtebaulicher Rahmenplan Klimaanpassung für Die Stadt Karlsruhe (Teil II); LUBW Landesanstalt für Umwelt, Messungen und Naturschutz Baden-Württemberg: Karlsruhe, Germany, 2014. [Google Scholar]
  13. Osaka Heat Island Countermeasure Technology Consortium. HITEC News. Available online: http://osakahitec.com/active/news/news2018_01_vol14.pdf (accessed on 9 April 2018).
  14. Center for Environmental Information Science. Report on Consignment Work of Survey and Verification for the Creation of a Low-Carbon City Using Surplus Groundwater etc.; Report Entrusted by the Ministry of the Environment in 2016 Fiscal Year; Center for Environmental Information Science: Tokyo, Japan, 2017. (In Japanese)
  15. Osaka Heat Island Countermeasure Technology Consortium. Town Planning Idea Competition Considering Urban Heat Island. Available online: http://osakahitec.com/result/index.html (accessed on 9 April 2018).
  16. Takayama, N.; Yoshikoshi, H.; Yamamoto, H.; Iwaya, K.; Harada, Y.; Yamasaki, T.; Tateishi, Y. Quantitative evaluation of mitigation effect for thermal load of solar radiation through the glass window by wall greening. J. Environ. Eng. (Trans. AIJ) 2011, 661, 247–254. [Google Scholar] [CrossRef]
  17. Sakai, S.; Nakamura, M.; Furuya, K.; Amemura, N.; Onishi, M.; Iizawa, I.; Nakata, J.; Yamaji, K.; Asano, R.; Tamotsu, K. Sierpinski’s forest: New technology of cool roof with fractal shapes. Energy Build. 2012, 55, 28–34. [Google Scholar] [CrossRef]
  18. Inoue, T.; Ichinose, M.; Nagahama, T. Improvement of outdoor thermal radiation environment in urban areas using wavelength-selective retro-reflective film. In Proceedings of the PLEA 2015, Bologna, Italy, 9–11 September 2015; p. 48. [Google Scholar]
  19. Sakai, H.; Emura, K.; Igawa, N.; Iyota, H. Reduction of reflected heat of the sun by retroreflective materials. J. Heat Isl. Inst. Int. 2012, 7, 218–221. [Google Scholar]
  20. Takebayashi, H.; Moriyama, M. Study on surface heat budget of various pavements for urban heat island mitigation. Adv. Mater. Sci. Eng. 2012, 1–11. [Google Scholar] [CrossRef]
  21. Akagawa, H.; Takebayashi, H.; Moriyama, M. Experimental study on improvement of human thermal environment on a watered pavement and a highly reflective pavement. J. Environ. Eng. (Trans. AIJ) 2008, 623, 85–91. [Google Scholar] [CrossRef]
  22. Takebayashi, H.; Moriyama, M. Study on the urban heat island mitigation effect achieved by converting to grass-covered parking. Sol. Energy 2009, 83, 1211–1223. [Google Scholar] [CrossRef] [Green Version]
  23. Misaka, I.; Suzuki, H.; Mizutani, A.; Murano, N.; Tashiro, Y. Evaluation of heat balance of wall greening. AIJ J. Technol. Des. 2006, 23, 233–236. (In Japanese) [Google Scholar] [CrossRef]
  24. Hirayama, Y.; Ohta, I.; Hoyano, A. Development of a surface wetting passive cooling louver system with hydrophilic and water absorbing coating film and an evaluation of its fundamental performance by outdoor experiment. J. Heat Isl. Inst. Int. 2015, 10, 24–34. (In Japanese) [Google Scholar]
  25. Yoon, G.; Yamada, H.; Okumiya, M.; Tsujimoto, M. Study on cooling system by using dry mist, Validation of cooling effectiveness and CFD simulation. J. Environ. Eng. (Trans. AIJ) 2008, 633, 1313–1320. [Google Scholar] [CrossRef]
  26. Farnham, C.; Nakao, M.; Nishioka, M.; Nabeshima, M.; Mizuno, T. Study of mist-cooling for semi-enclosed spaces in Osaka, Japan. Procedia Environ. Sci. 2011, 4, 228–238. [Google Scholar] [CrossRef]
  27. Kojima, I.; Yoshinaga, M. Analysis of the effect by the material and color of awnings—Discussion about the outdoor test method of SC-value based on JIS A 1422. Summ. Tech. Pap. Annu. Meet. AIJ 2013, D-2, 145–146. (In Japanese) [Google Scholar]
  28. Nishimura, N.; Nomura, T.; Iyota, H.; Kimoto, S. Novel water facilities for creation of comfortable urban micrometeorology. Sol. Energy 1998, 64, 197–207. [Google Scholar] [CrossRef]
  29. Nouri, A.S.; Costa, J.P.; Santamouris, M.; Matzarakis, A. Approaches to Outdoor Thermal Comfort Thresholds through Public Space Design: A Review. Atmosphere 2018, 9, 108. [Google Scholar] [CrossRef]
  30. D’Ambrosio Alfano, F.R.; Olesen, B.W.; Palella, B.I. Povl Ole Fanger’s Impact Ten Years Later. Energy Build. 2017, 152, 243–249. [Google Scholar] [CrossRef]
  31. Gagge, A.; Fobelets, P.; Bergland, L. A standard predictive index of human response to thermal environment. ASHRAE Trans. 1986, 92, 709–731. [Google Scholar]
  32. Spagnolo, J.; de Dear, R. A field study of thermal comfort in outdoor and semi-outdoor environments in subtropical Sydney, Australia. Build. Environ. 2003, 38, 721–738. [Google Scholar] [CrossRef]
  33. De Dear, R.; Pickup, R. An outdoor thermal comfort index (OUT_SET*)—Part I—The model and its assumptions. In Proceedings of the International Conference on Urban Climatology, Sydney, Australia, 8–9 November 1999. [Google Scholar]
  34. Tinz, B.; Jendrizky, G. Europa- und Weltkarten der Gefühlten Temperatur; Chmielewski, F., Foken, T., Eds.; Beiträge zur Klima- und Meeresforschung: Berlin/Bayreuth, Germany, 2003; pp. 111–123. [Google Scholar]
  35. Fanger, P.O. Thermal Comfort: Analysis and Applications in Environmental Engineering; McGraw-Hill Book Company: New York, NY, USA, 1972; p. 244. [Google Scholar]
  36. D’Ambrosio Alfano, F.R.; Palella, B.I.; Riccio, G. Notes on the calculation of the PMV index by means of Apps. Energy Procedia 2016, 101, 243–249. [Google Scholar] [CrossRef]
  37. Givoni, B. Man, Climate and Architecture; Applied Science Publishers: London, UK, 1976. [Google Scholar]
  38. Kenny, A.; Warland, S.; Brown, R. Part A: Assessing the performance of the COMFA outdoor thermal comfort model on subjects performing physical activity. Int. J. Biometeorol. 2009, 53, 415–428. [Google Scholar] [CrossRef] [PubMed] [Green Version]
  39. Jendritzky, G.; Maarouf, A.; Fiala, D.; Staiger, H. An update on the development of a Universal Thermal Climate Index. In Proceedings of the 15th Conference on Biometeorology Aerobiology and 16th ICB02, Kansas City, MO, USA, 27 October–1 November 2002; AMS: New York, NY, USA, 2002. [Google Scholar]
  40. Jendritzky, G.; de-Dear, R.; Havenith, G. UTCI—Why another thermal index? Int. J. Biometeorol. 2012, 56, 421–428. [Google Scholar] [CrossRef] [PubMed] [Green Version]
  41. Bröde, P.; Fiala, D.; Blazejczyk, K.; Holmér, I.; Jendritzky, G.; Kampmann, B.; Tinz, B.; Havenith, G. Deriving the operational procedure for the Universal Thermal Climate Index (UTCI). Int. J. Biometeorol. 2012, 56, 481–494. [Google Scholar] [CrossRef] [PubMed] [Green Version]
  42. Yaglou, C.; Minard, D. Control of heat casualties at military training centers. AMA Arch. Ind. Health 1957, 16, 302–316. [Google Scholar] [PubMed]
  43. Alfano, F.; Malchaire, J.; Palella, B.; Riccio, G. WBGT index revisited after 60 years of use. Ann. Occup. Hyg. 2014, 58, 955–970. [Google Scholar]
  44. Malchaire, J.; Piette, A.; Kampmann, B.; Mehnerts, P.; Gebhardt, H.; Havenith, G.; Hartog, E.; Holmer, I.; Parsons, K.; Alfanoss, G.; et al. Development and Validation of the Predicted Heat Strain Model. Ann. Occup. Hyg. 2001, 45, 123–135. [Google Scholar] [CrossRef]
  45. International Organization for Standardization. Ergonomics of the Thermal Environment—Analytical Determination and Interpretation of Heat Stress Using Calculation of the Predicted Heat Strain—ISO 7933 Standard; ISO: Geneva, Switzerland, 2004. [Google Scholar]
  46. D’Ambrosio Alfano, F.R.; Palella, B.I.; Riccio, G.; Malchaire, J. On the Effect of Thermophysical Properties of Clothing on the Heat Strain Predicted by PHS Model. Ann. Occup. Hyg. 2016, 60, 231–251. [Google Scholar] [CrossRef] [PubMed]
  47. Höppe, P. The physiological equivalent temperature—A universal index for the biometeorological assessment of the thermal environment. Int. J. Biometeorol. 1999, 43, 71–75. [Google Scholar] [CrossRef] [PubMed]
  48. Mayer, H.; Höppe, P. Thermal comfort of man in different urban environments. Theor. Appl. Climatol. 1987, 38, 43–49. [Google Scholar] [CrossRef]
  49. ACGIH. Threshold Limit Values for Chemical Substances and Physical Agents and Biological Exposures Indices; American Conference of Governmental Industrial Hygienists: Cincinnati, OH, USA, 2011. [Google Scholar]
  50. Palella, B.I.; Quaranta, F.; Riccio, G. On the management and prevention of heat stress for crews onboard ships. Ocean Eng. 2016, 112, 277–286. [Google Scholar] [CrossRef]
  51. International Organization for Standardization. Ergonomics of the Thermal Environment—Assessment of Heat Stress Using the WBGT (Wet Bulb Globe Temperature) Index—ISO Standard 7243; ISO: Geneva, Switzerland, 2017. [Google Scholar]
  52. Ishii, A.; Katayama, T.; Shiotsuki, Y.; Yoshimizu, H.; Abe, Y. Experimental study on comfort sensation of people in the outdoor environment. J. Arch. Plan. Res. 1988, 386, 28–37. [Google Scholar] [CrossRef]
  53. Nakano, J.; Tanabe, S. Thermal comfort and adaptation in semi-outdoor environments. ASHRAE Trans. 2004, 110, 543–553. [Google Scholar]
  54. Nagano, K.; Horikoshi, T. New index indicating the universal and separate effects on human comfort under outdoor and non-uniform thermal conditions. Energy Build. 2011, 43, 1694–1701. [Google Scholar] [CrossRef] [Green Version]
  55. Watanabe, S.; Nagano, K.; Ishii, J.; Horikoshi, T. Evaluation of outdoor thermal comfort in sunlight, building shade, and pergola shade during summer in a humid subtropical region. Build. Environ. 2014, 82, 556–565. [Google Scholar] [CrossRef]
  56. VDI 3787 Part 2, Environmental Meteorology Methods for the Human Biometeorological Evaluation of Climate and Air Quality for Urban and Regional Planning at Regional Level Part I: Climate. 1998. Available online: http://www.scirp.org/(S(oyulxb452alnt1aej1nfow45))/reference/ReferencesPapers.aspx?ReferenceID=1721475 (accessed on 16 May 2018).
  57. Watanabe, S.; Horikoshi, T.; Ishii, J.; Tomita, A. The measurement of the solar absorptance of the clothed human body—The case of Japanese, college-aged male subjects. Build. Environ. 2013, 59, 492–500. [Google Scholar] [CrossRef]
Figure 1. Automatically opening and closing awning installed at a bus stop, which are provided by Prof. Misaka. (a) whole view; (b) internal view; (c) closed state.
Environments 05 00070 g001
Figure 2. Fractal-shaped sunshade, which is provided by Prof. Misaka. (a) in a park; (b) at a tram stop.
Environments 05 00070 g002
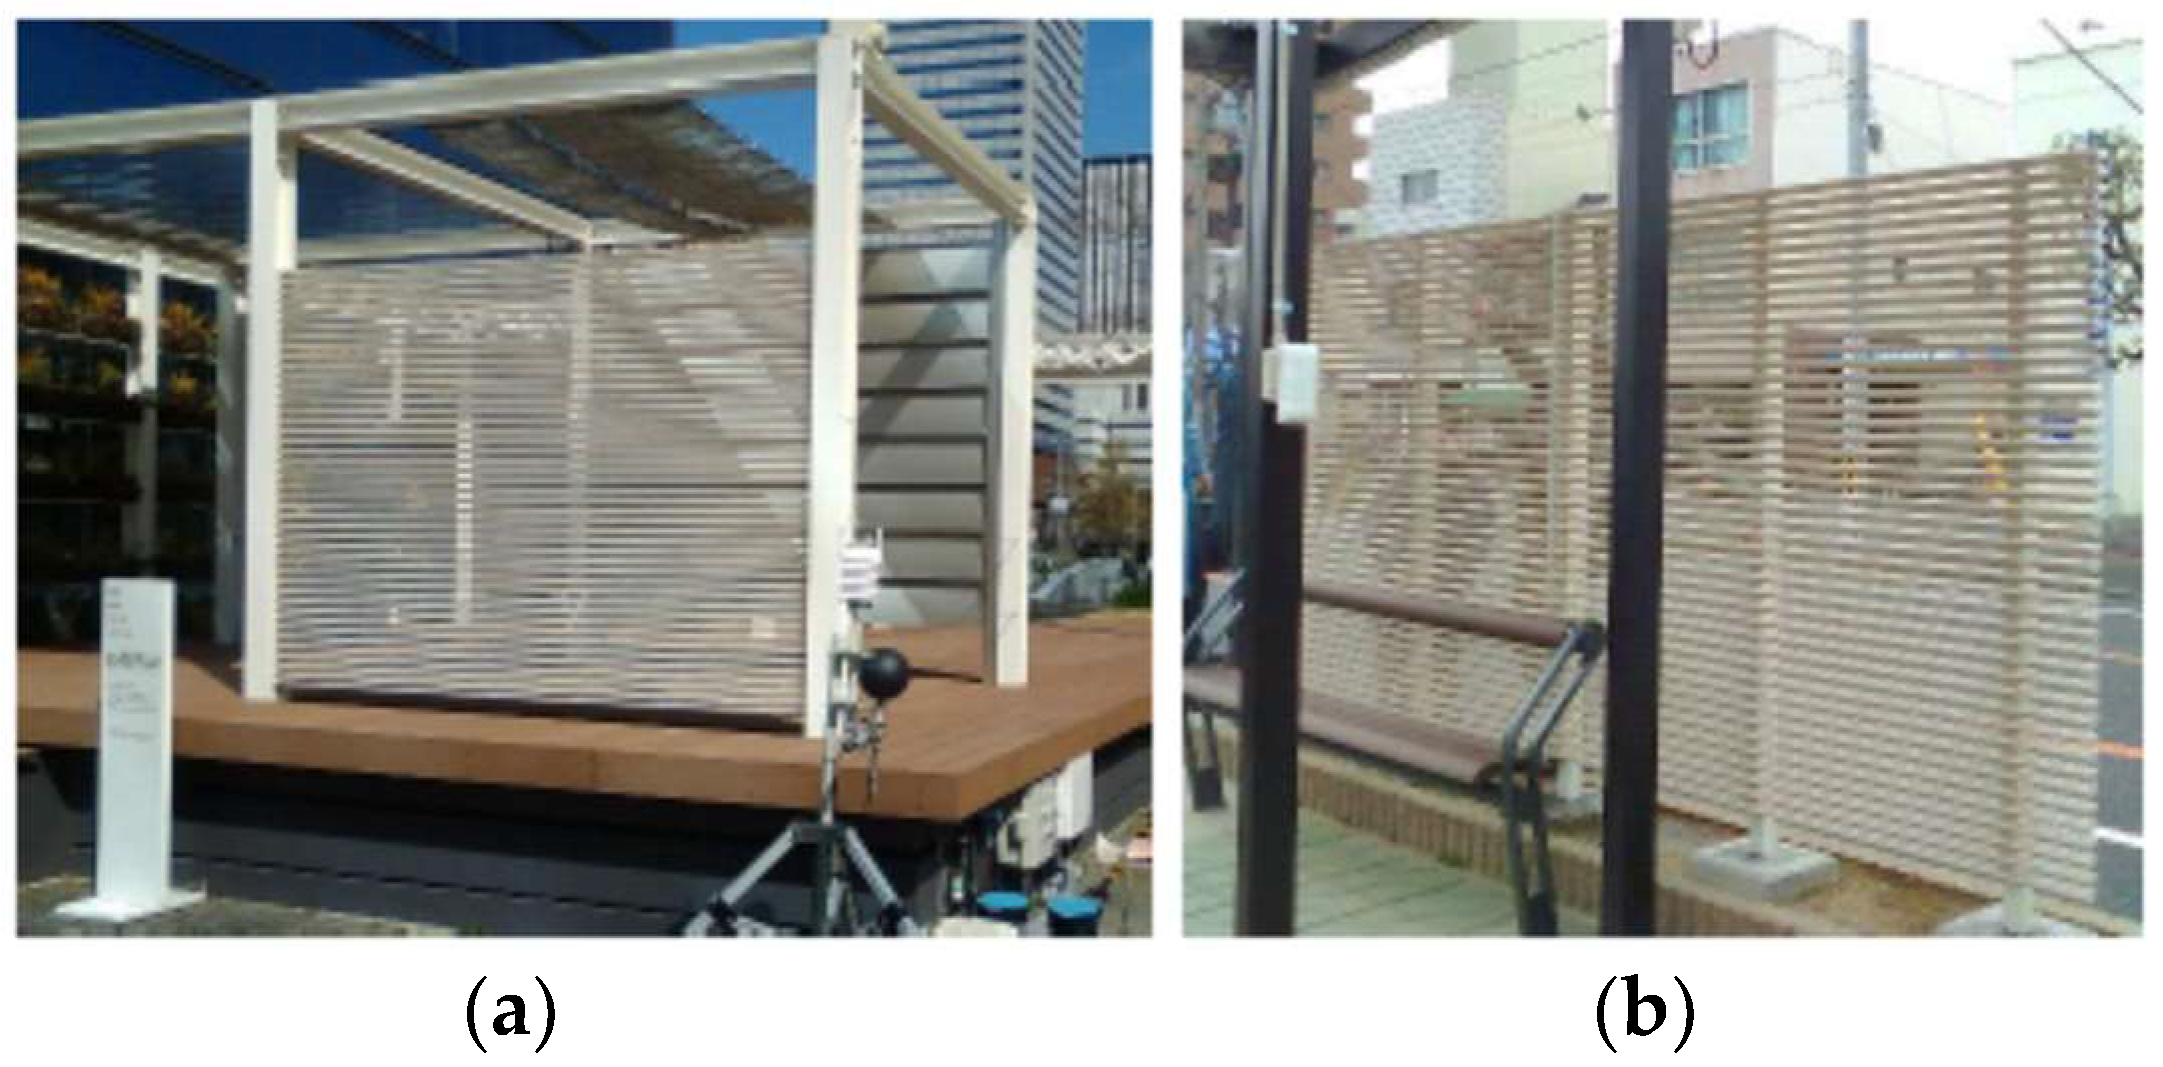
Figure 3. Evaporative cooling louver, which is provided by Prof. Misaka. (a) in a park; (b) at a tram stop.
Environments 05 00070 g003
Figure 4. Sensitivity analysis results conducted with a variation range of (a) 20 to 40 °C for air temperature, (b) 30 to 80% for relative humidity, (c) 0.5 to 3 m/s for wind speed, and 20 to 60 °C for mean radiant temperature (MRT), when clothing insulation is 0.6 clo and metabolic rate is 2 Met.
Environments 05 00070 g004
Figure 5. Relationships between air temperature, MRT, and SET*. SET* is indicated by a contour line. The relative humidity is 50%, wind speed is 1 m/s, clothing insulation is 0.6 clo, and metabolic rate is 2 Met.
Environments 05 00070 g005
Figure 6. Examples of the effects of adaptation measures obtained through demonstrative experiments. The background SET* is the same as that in Figure 5.
Environments 05 00070 g006
Figure 7. Relationship between solar transmittance τ and MRT reduction by adaptation measures.
Environments 05 00070 g007
Figure 8. Relationship between the surface temperature Ts of the adaptation measures and the solar absorptance a when the heat transfer coefficient h is 23 W/(m2K), emissivity ε is 0.97, and net infrared radiation q is −93 W/m2 for different values of the evaporation rate E.
Environments 05 00070 g008
Figure 9. Surface temperature Ts when the heat transfer coefficient (a) h is 46, (b) h is 92 W/(m2K).
Environments 05 00070 g009
Figure 10. Relationship between the MRT reduction and the solar absorptance a when the evaporation rate E is 0 L/(m2h) for different values of the shape factor Φ of the human body.
Environments 05 00070 g010
Figure 11. Relationship between the MRT reduction and the solar transmittance τ when the evaporation rate E is 0 L/(m2h) and the shape factor of the human body Φ is 0.3 for different values of the solar absorptance a.
Environments 05 00070 g011
Figure 12. Relationship between the MRT reduction and the solar transmittance τ when the evaporation rate E is 1.0 L/(m2h) and the shape factor of the human body Φ is 0.3 for different values of the solar absorptance a.
Environments 05 00070 g012
Table 1. Adaptation measures for urban heat islands and their effects and associated evaluation indices.
MenuEvaluation IndexMain Effect Mechanism
From the heat countermeasure guidelines by the Japanese Ministry of Environment [5]
Green shade [16]Solar transmittance, Evaporative efficiencySun shade, Evaporative cooling
Solar radiation shade [17]Solar transmittance, Convection heat transfer coefficientSun shade, Convection heat transfer
Retroreflective surface [18,19]Downward solar reflectanceSolar reflection
Water retentive pavement [20,21]Evaporative efficiencyEvaporative cooling
Cool pavement [21]Solar reflectanceSolar reflection
Green pavement [22]Evaporative efficiencyEvaporative cooling
Green wall [23]Evaporative efficiencyEvaporative cooling
Water-retentive wall [24]Evaporative efficiencyEvaporative cooling
Fine mist spray [25,26]Evaporation rateEvaporative cooling
from the report by the Japanese Ministry of Environment [14]
Awning [27]Solar transmittanceSun shade
Fractal-shaped sunshade [17]Solar transmittance, Convection heat transfer coefficientSun shade, Convection heat transfer
Mesh shade and water supply [14]Solar transmittance, Evaporative efficiencySun shade, Evaporative cooling
Evaporative cooling louver [24]Evaporative efficiencyEvaporative cooling
Greening cooling louver [14]Evaporative efficiencyEvaporative cooling
Tree pot [14]Solar transmittance, Evaporative efficiencySun shade, Evaporative cooling
Water-retentive block [20]Evaporative efficiencyEvaporative cooling
Water surface [28]Evaporative efficiencyEvaporative cooling
Fine mist spray with blower [25,26]Evaporation rateEvaporative cooling
Ceiling cooling system [14]Surface temperatureArtificial cooling
Water cooling bench [14]Surface temperatureArtificial cooling
from town planning idea competition by Osaka Heat Island Countermeasure Technology Consortium [15]
Water surface [28]Evaporative efficiencyEvaporative cooling
Watering [28]Evaporative efficiencyEvaporative cooling
Fine mist spray [25,26]Evaporation rateEvaporative cooling
Shading [27]Solar transmittanceSun shade
Tree plantingSolar transmittance, Evaporative efficiencySun shade, Evaporative cooling
Roof and ground greening [22]Evaporative efficiencyEvaporative cooling
Wind useConvection heat transfer coefficientConvection heat transfer
Traffic mode controlAnthropogenic heat releaseReduction of anthropogenic heat release
Unused energy use, natural energy useAnthropogenic heat releaseReduction of anthropogenic heat release
ICT useHuman body physiological amountReduction of human thermal load
Table 2. Relationship between Standard Effective Temperature (SET*) and thermal comfort.
SET* (°C)Thermal Comfort
33.3
32.1
30.8
28.4
27.0
extremely uncomfortable
Uncomfortable
slightly uncomfortable
Neither
slightly comfortable
Comfortable