Spectroscopic and Voltammetric Analysis of Platinum Group Metals in Road Dust and Roadside Soil


Abstract
:1. Introduction
2. Materials and Methods
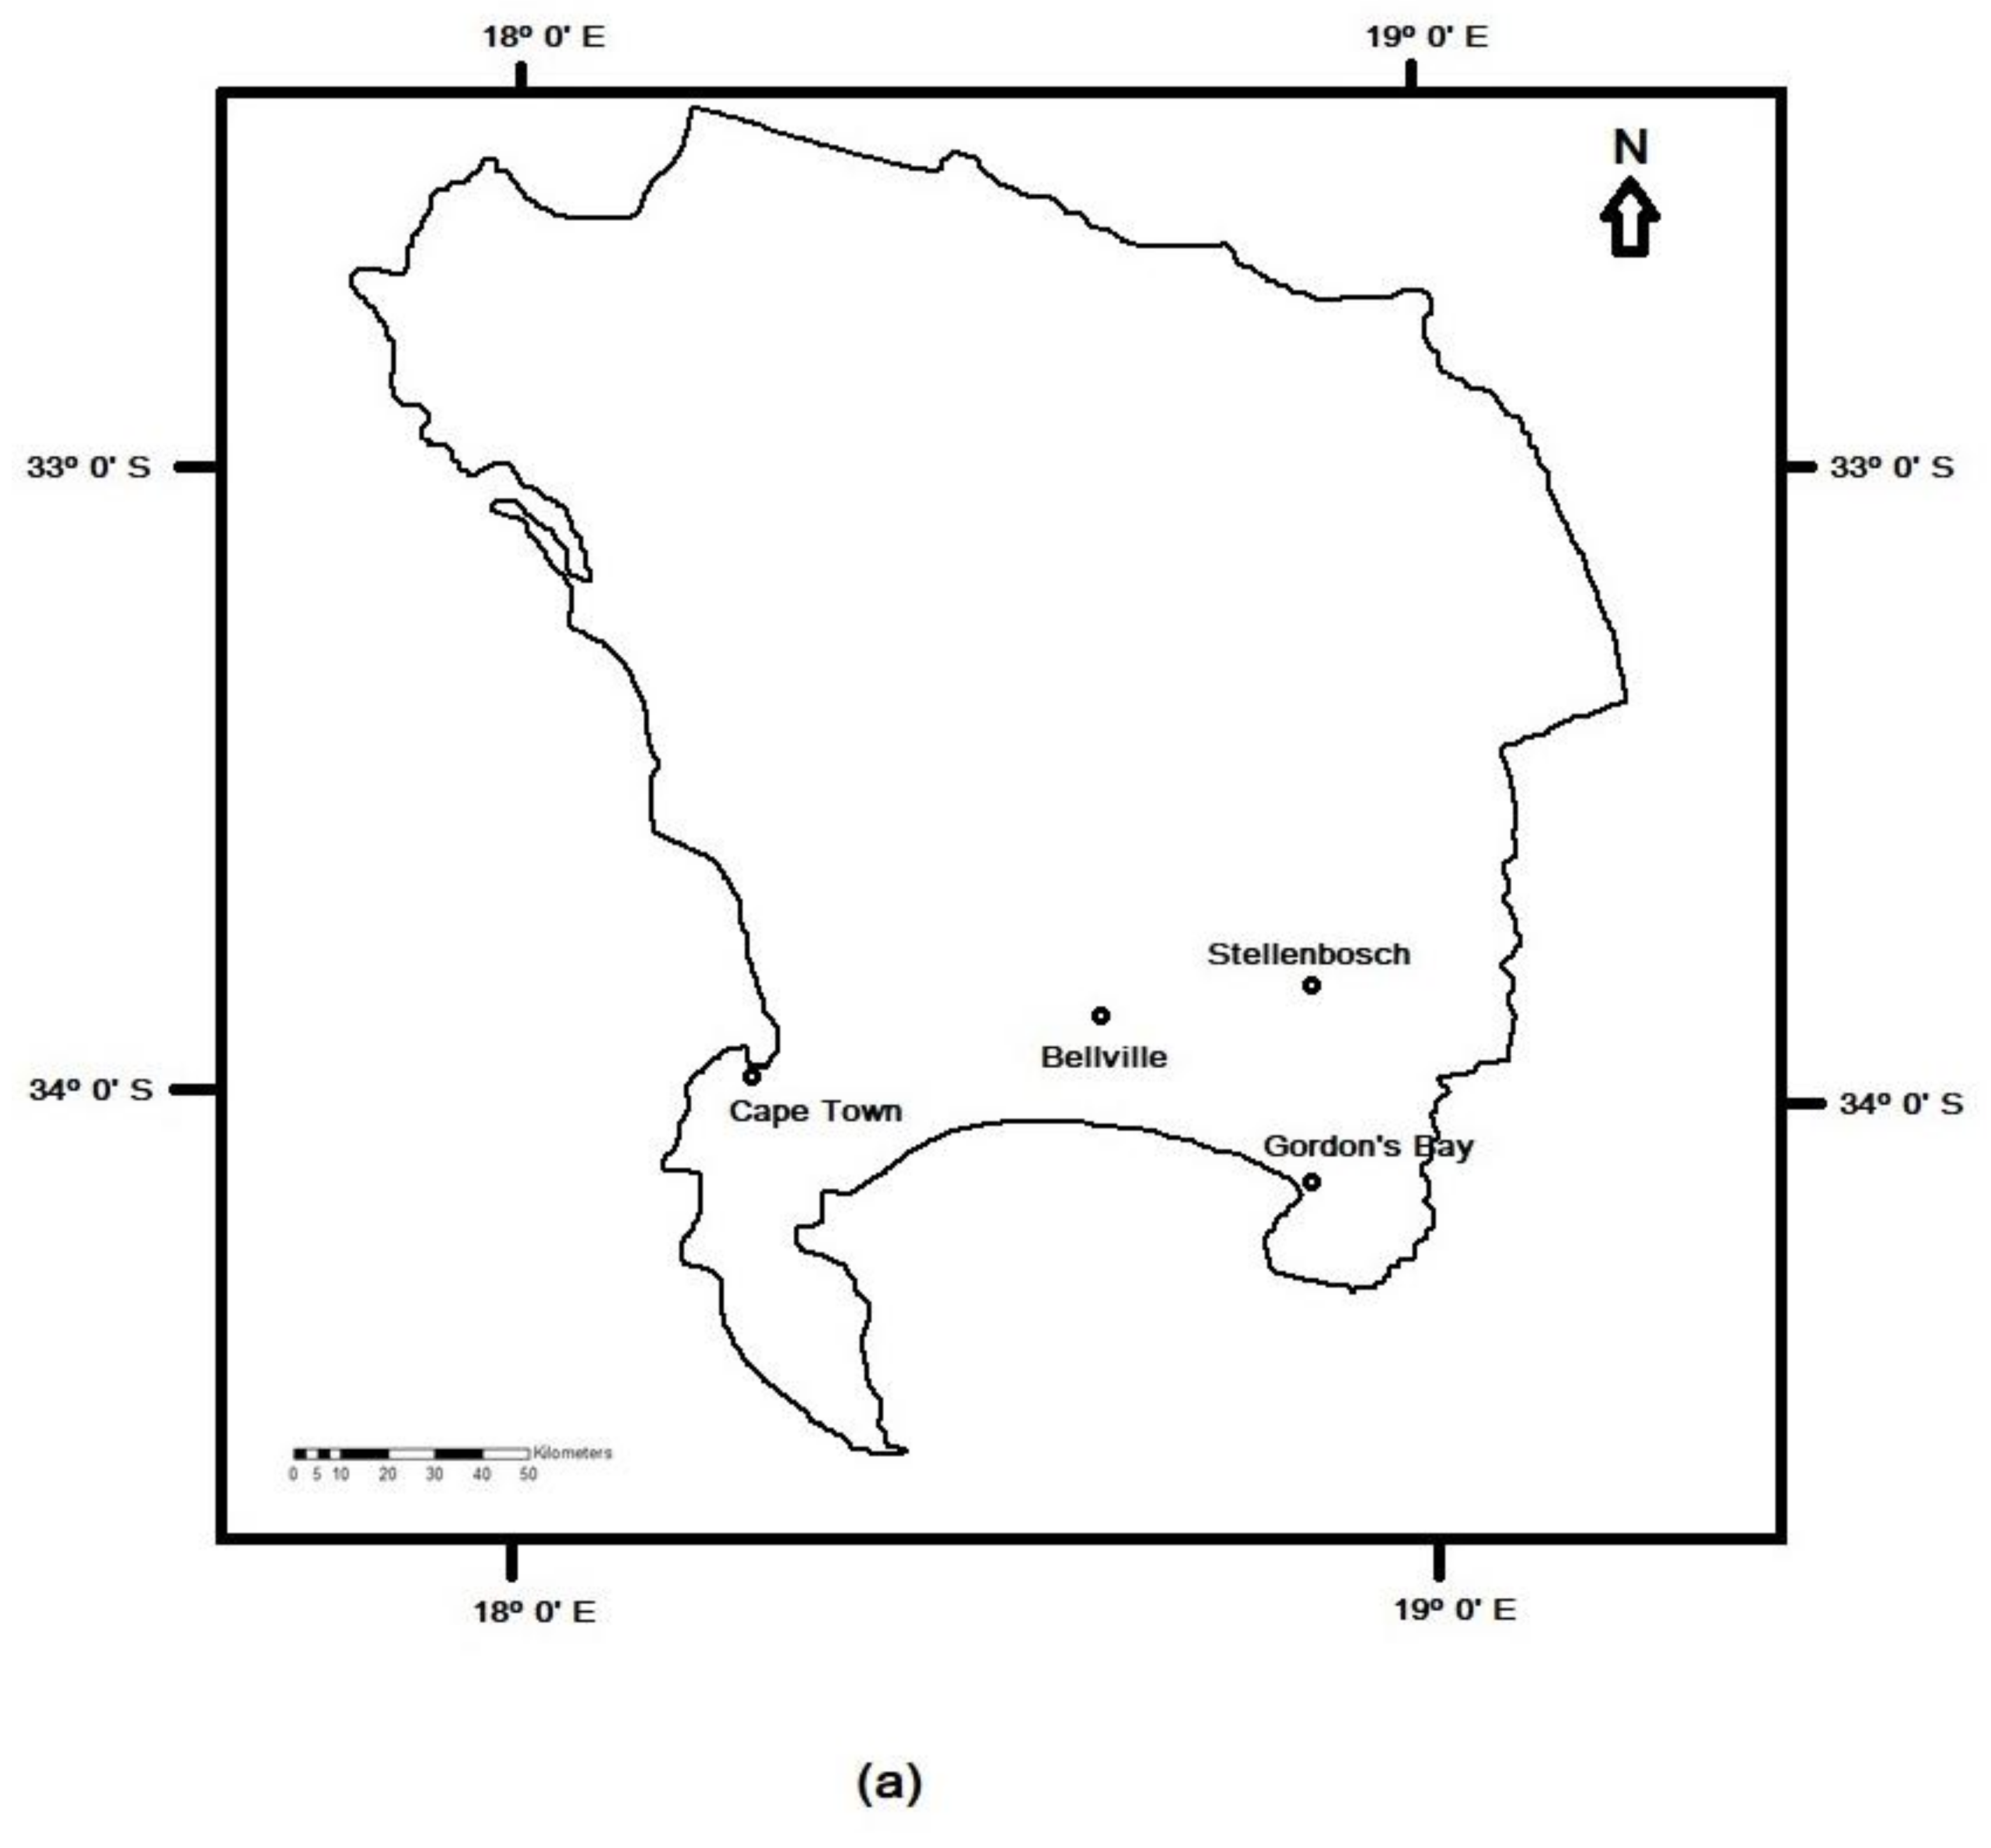
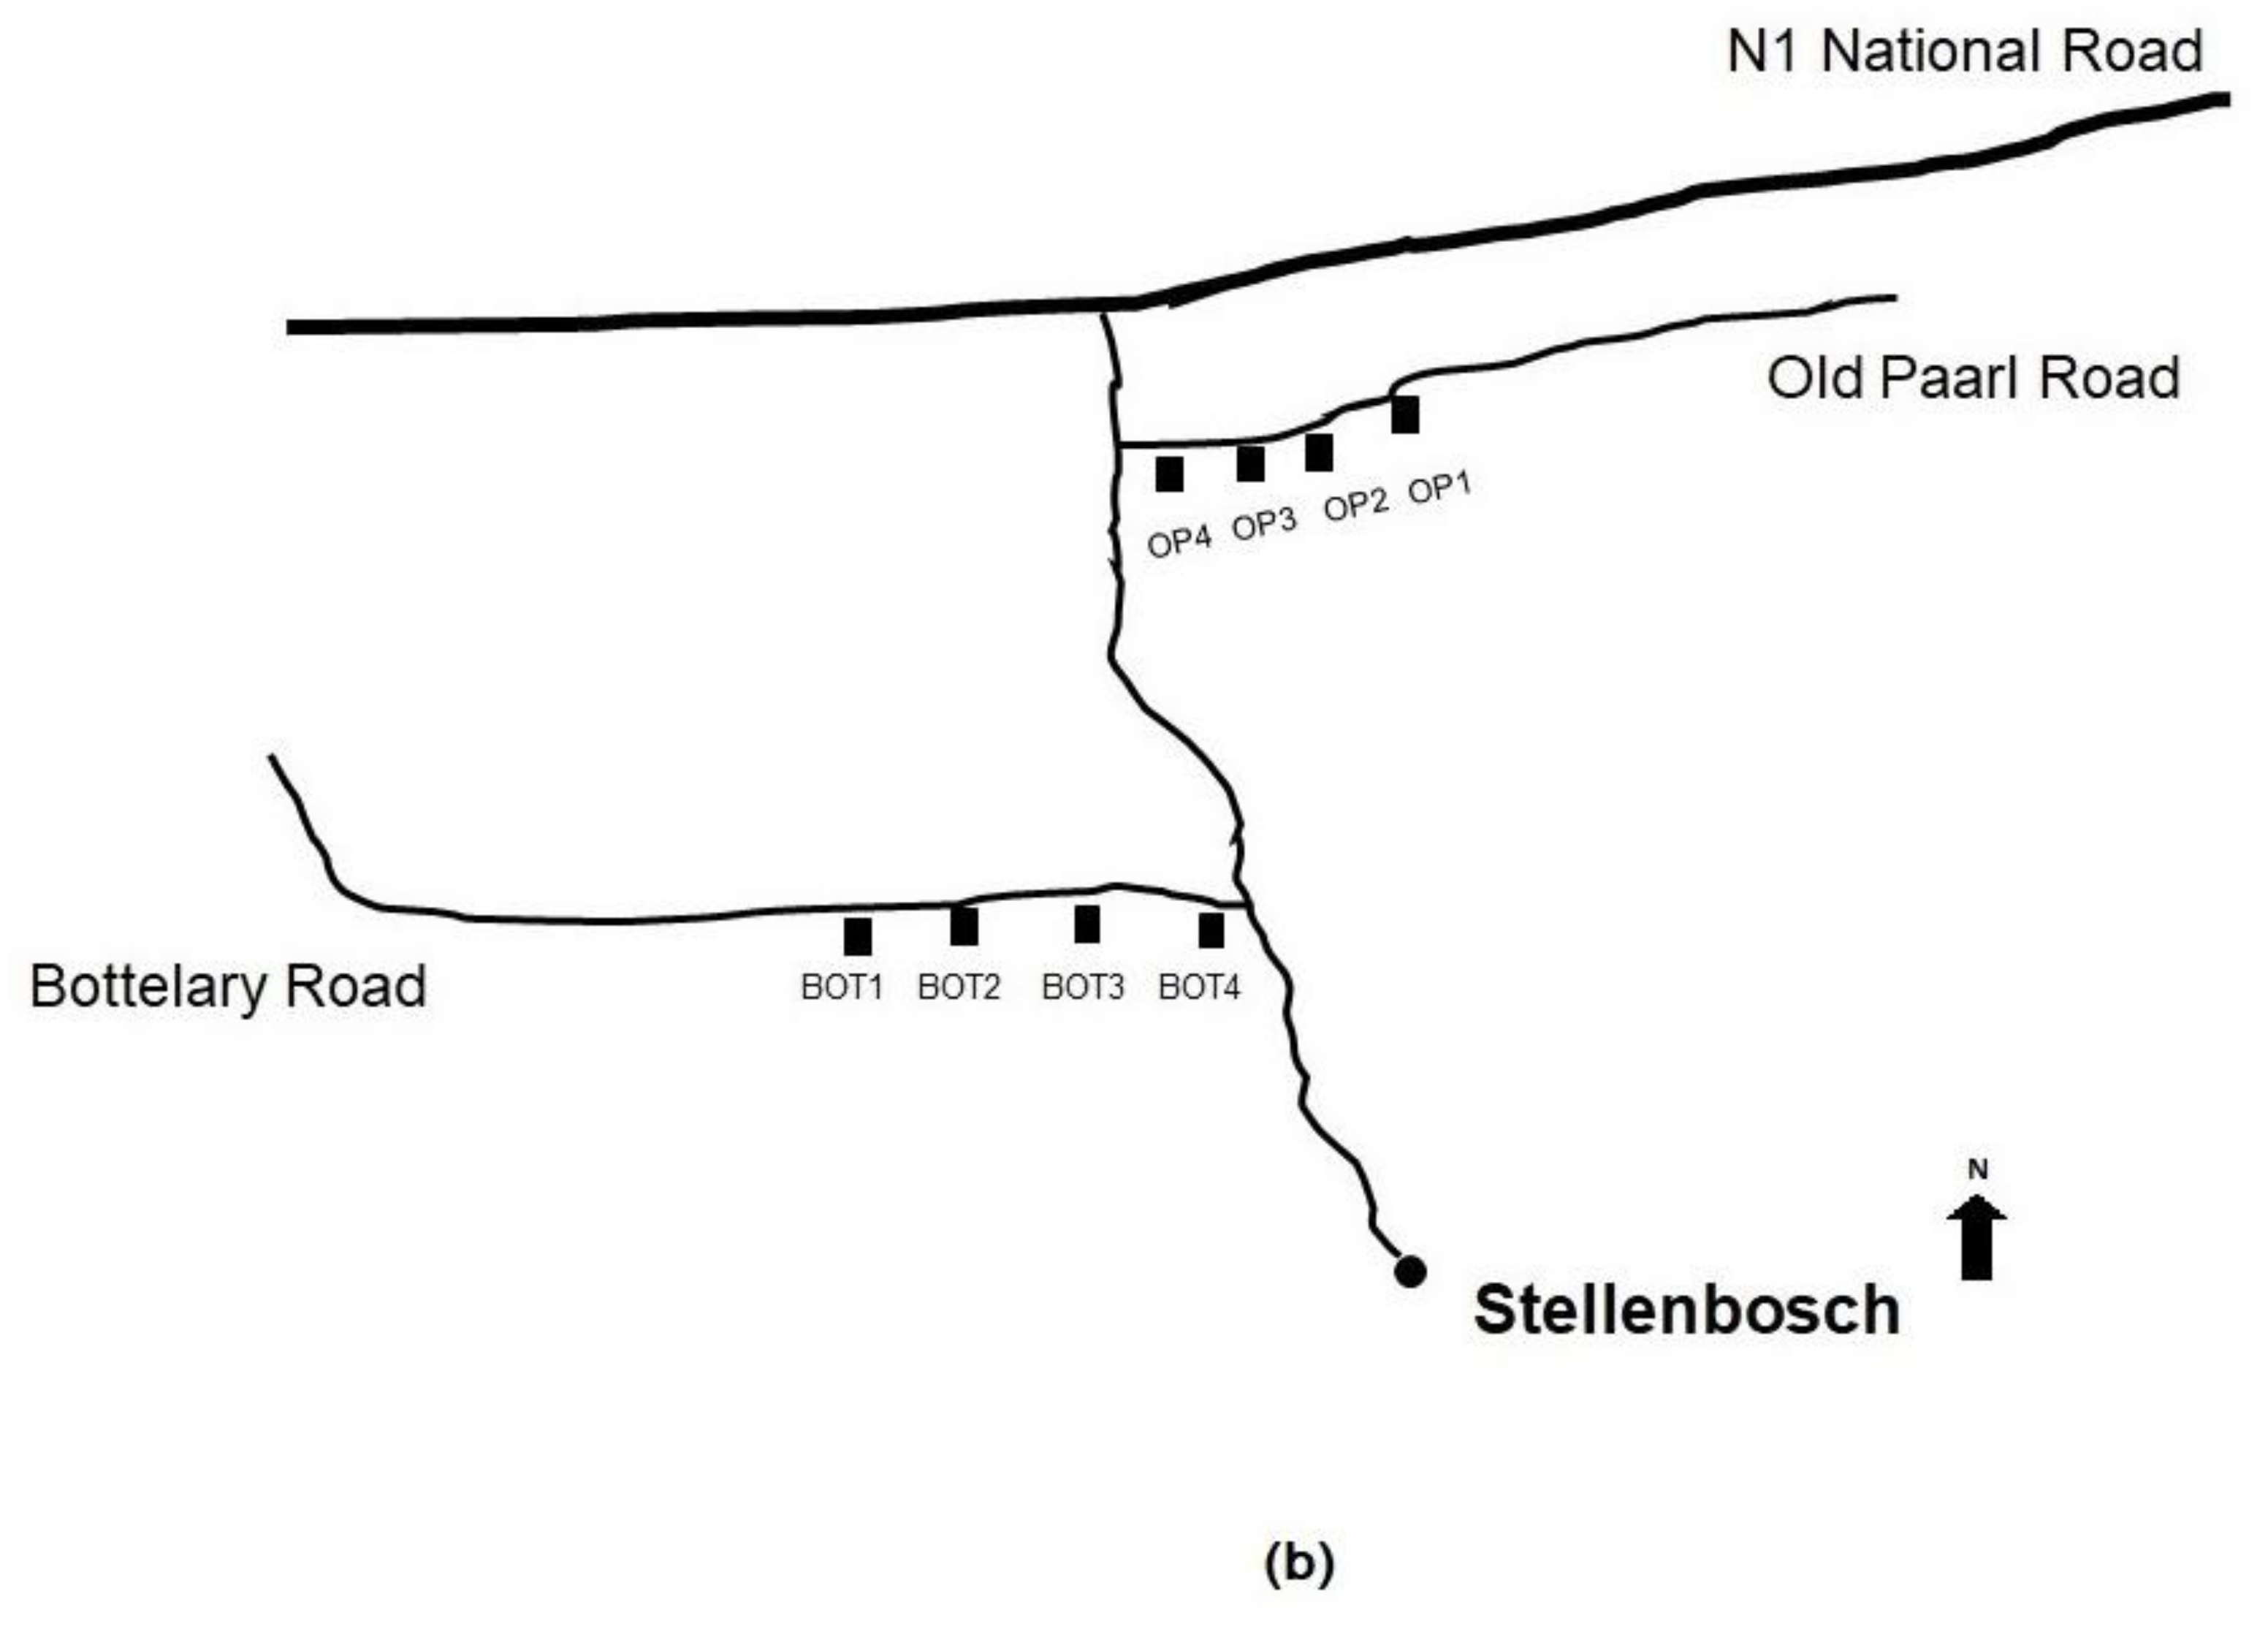
2.1. Dust and Soil Sampling
2.2. Sample Preparation
2.2.1. Carbonate-Bound
2.2.2. Fe-Mn Oxide-Bound
2.2.3. Organic Matter-Bound
2.3. Platinum Group Metal Analysis
2.3.1. ICP-QMS Analysis
2.3.2. Voltammetric Analysis
3. Results
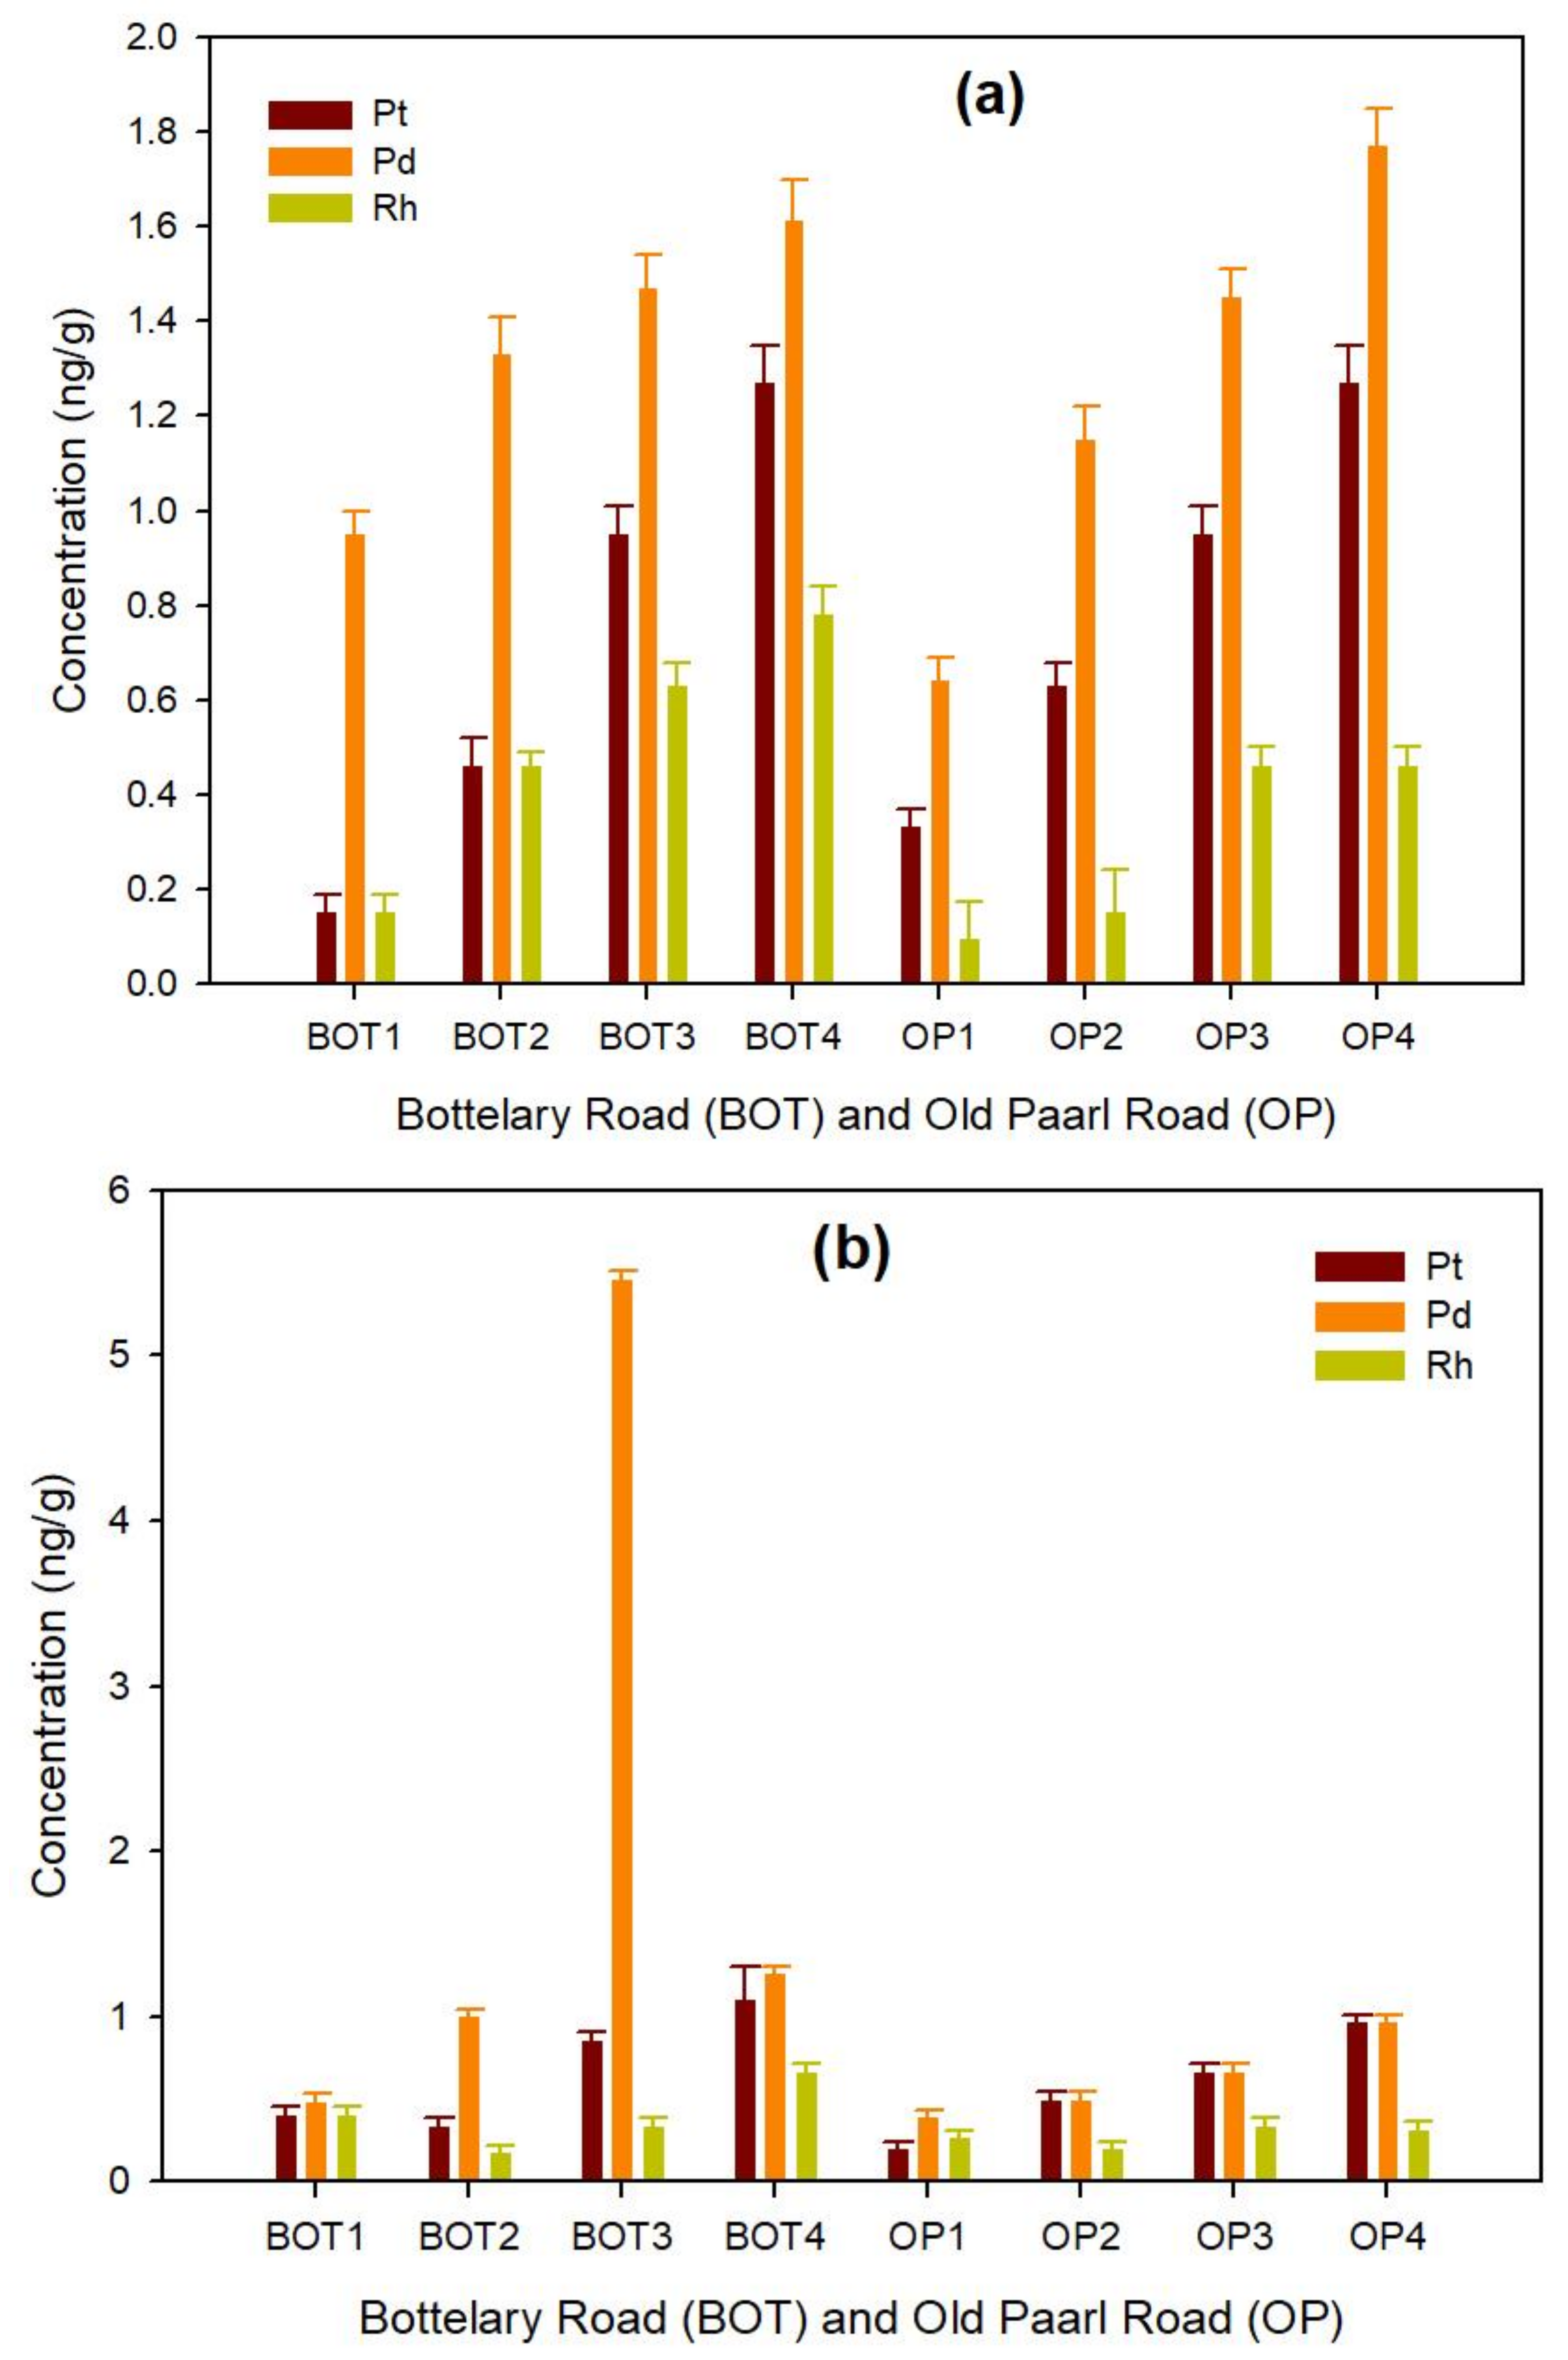
3.1. Spectroscopic Analysis
3.1.1. Road Dust
3.1.2. Roadside Soil
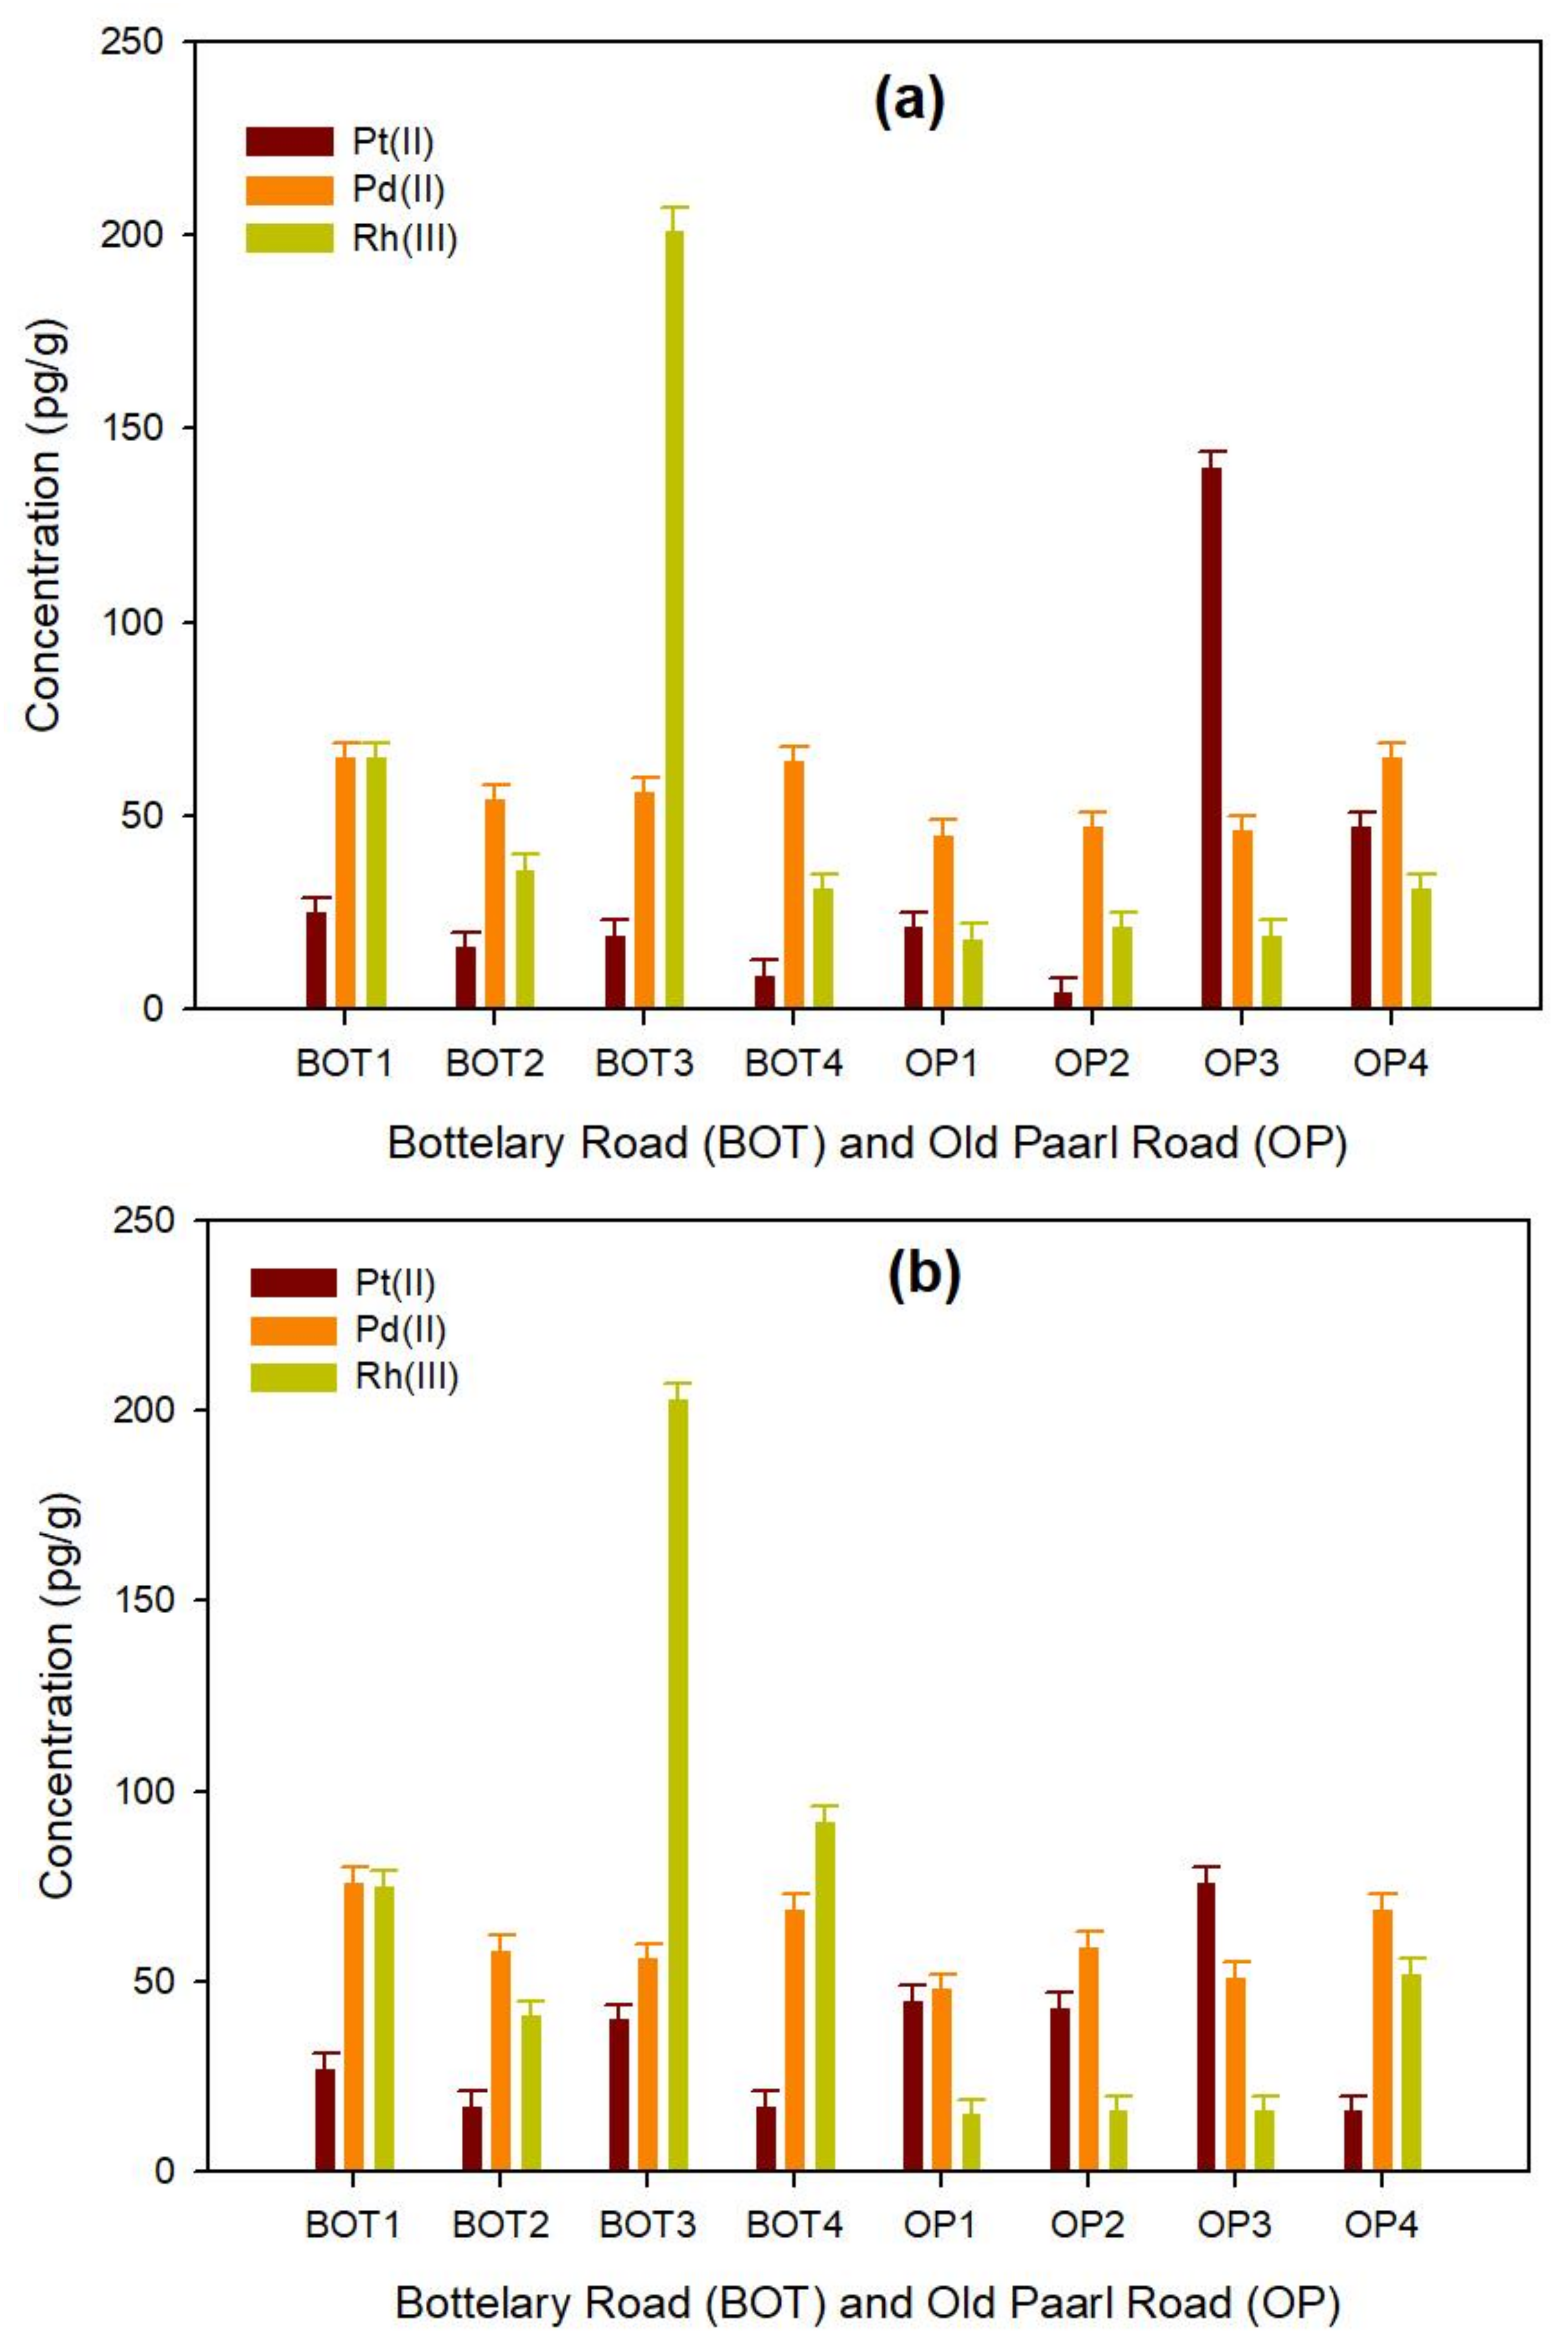
3.2. Voltammetric Analysis
3.2.1. Road Dust
3.2.2. Roadside Soil
3.3. Discussion
3.3.1. Mobility of Pt, Pd, and Rh in Roadside Dust and Soil Samples
3.3.2. Comparison between Spectroscopic and Voltammetric Analysis
4. Conclusions
Author Contributions
Funding
Acknowledgments
Conflicts of Interest
References
- Niemelä, M.; Perämäki, P.; Piispanen, J.; Poikolainen, J. Determination of platinum and rhodium in dust and plant samples using microwave-assisted sample digestion and ICP-MS. Anal. Chim. Acta 2004, 521, 137–142. [Google Scholar] [CrossRef]
- Ravindra, K.; Bencs, L.; Van Grieken, R.N. Platinum group elements in the environment and their health risk. Sci. Total Environ. 2004, 318, 1–43. [Google Scholar] [CrossRef] [Green Version]
- Dubiella-Jackowska, A.; Kudlak, B.; Polkowska, Z.; Namiesnik, J. Environmental Fate of Traffic-Derived Platinum Group Metals. Crit. Rev. Anal. Chem. 2009, 39, 251–271. [Google Scholar] [CrossRef]
- Moldovan, M.; Palacios, M.A.; Gomez, M.M.; Morrison, G.; Rauch, S.; McLeod, C.; Ma, R.; Caroli, S.; Alimenti, A.; Petrucci, F.; et al. Environmental risk of particulate and soluble platinum group elements released from gasoline and diesel engine catalytic converters. Sci. Total Environ. 2002, 296, 199–208. [Google Scholar] [CrossRef]
- Wei, C.; Morrison, G.M. Platinum in road dusts and urban river sediments. Sci. Total Environ. 1994, 146/147, 169–174. [Google Scholar] [CrossRef]
- Hooda, P.S.; Miller, A.; Edwards, A.C. The plant availability of auto-cast platinum group element. Environ. Geochem. Health 2008, 30, 135–139. [Google Scholar] [CrossRef] [PubMed]
- WHO (World Health Organization). Environmental Health Criteria 125-Platinum; International Programme on Chemical Safety: Geneva, Switzerland, 1991. [Google Scholar]
- WHO (World Health Organization). Environmental Health Criteria 226-Palladium; International Programme on Chemical Safety: Geneva, Switzerland, 2002. [Google Scholar]
- Gagnon, Z.; Newkirk, C.; Hicks, S. Impacts of platinum group metals on the environment: A toxicological, genotoxic and analytical chemistry study. J. Environ. Sci. Health A 2006, 41, 397–414. [Google Scholar] [CrossRef] [PubMed]
- Merian, E. Metals and Their Compounds in the Environment–Occurrence; Analysis and Biological Relevance; VCH: Weinheim, Germany, 1991. [Google Scholar]
- Wayne, D.M. Direct Determination of Trace Noble Metals (Palladium, Platinum and Rhodium) in Automobile Catalysts by Glow Discharge Mass Spectrometry. J. Anal. At. Spectrom. 1997, 12, 1195–1202. [Google Scholar] [CrossRef]
- Alt, F.; Weber, G.; Messerschmidt, J.; von Bohlen, A.; Kastenholz, B.; Guenther, K. Bonding States of Palladium in Phytosystems: First Results for Endive. Anal. Lett. 2002, 35, 1349–1359. [Google Scholar] [CrossRef]
- Cantarero, A.; Gomez, M.M.; Camara, C.; Palacios, M.A. On-line preconcentration and determination of trace platinum by flow-injection atomic absorption spectrometry. Anal. Chim. Acta 1994, 296, 205–211. [Google Scholar] [CrossRef]
- Somerset, V.; Van der Horst, C.; Silwana, B.; Iwuoha, E. Biomonitoring and evaluation of metal concentrations in sediment and crab samples from the North-West Province of South Africa. Water Air Soil Pollut. 2015, 226, 43. [Google Scholar] [CrossRef]
- De Boni, A.; Cairns, W.; Capodaglio, G.; Cescon, P.; Cozzi, G.; Rauch, S.; Hemond, H.F.; Boutron, C.; Barbante, C. On-line matrix separation for the determination of PGEs in sediments by ICP-MS. In High Urban Environ; Springer: Berlin, Germany, 2007; Volume 12, pp. 259–269. [Google Scholar]
- Probst, T.U.; Rietz, B.; Alfassi, Z.B. Platinum Concentrations in Danish Air Samples Determined by Instrumentral Neutron Activation Analysis. J. Environ. Monit. 2001, 3, 217–219. [Google Scholar] [CrossRef] [PubMed]
- Fariseo, P.; Speziali, M.; Herborg, C.; Orvini, E. Platinum Determination by NAA in Two Road Dust Matrices. Microchem. J. 2005, 79, 43–47. [Google Scholar] [CrossRef]
- Lustig, S. Platinum in the Environment. Ph.D. Thesis, Ludwig-Maximillians-Universitaet, Muenchen, Germany, October 1997; p. 143. [Google Scholar]
- Balcerzak, M. Analytical Methods for the Determination of Platinum in Biological and Environmental Materials. A Review. Analyst 1997, 122, 67R–74R. [Google Scholar] [CrossRef] [PubMed]
- Barefoot, R. Determination of platinum at trace levels in environmental and biological materials. Environ. Sci. Technol. 1997, 31, 309–314. [Google Scholar] [CrossRef]
- Dragoe, D.; Spataru, N.; Kawasaki, R.; Manivannan, A.; Spataru, T.; Tryk, D.A.; Fujishima, A. Detection of trace levels of Pb2+ in tap water at boron-doped diamond electrodes with anodic stripping voltammetry. Electrochim. Acta 2006, 51, 2437–2441. [Google Scholar] [CrossRef]
- Gonzalez, P.; Cortınez, V.A.; Fontan, C.A. Determination of nickel by anodic adsorptive stripping voltammetry with a cation exchanger-modified carbon paste electrode. Talanta 2002, 58, 679–690. [Google Scholar] [CrossRef]
- Marino, G.; Bergamini, M.F.; Teixeira, M.F.S.; Cavalheiro, E.T.G. Evaluation of a carbon paste electrode modified with organofunctionalized amorphous silica in the cadmium determination in a differential pulse anodic stripping voltammetric procedure. Talanta 2003, 59, 1021–1028. [Google Scholar] [CrossRef]
- Almécija, C.; Cobelo-García, A.; Santos-Echeandía, J. Improvement of the ultra-trace voltammetric determination of Rh in environmental samples using signal transformation. Talanta 2016, 146, 737–743. [Google Scholar] [CrossRef] [PubMed] [Green Version]
- Orecchio, S.; Amorello, D. Platinum levels in urban soils from Palermo (Italy); Analytical method using voltammetry. Microchem. J. 2011, 99, 283–288. [Google Scholar] [CrossRef]
- Dalvi, A.A.; Satpati, A.K.; Palrecha, M.M. Simultaneous determination of Pt and Rh by catalytic adsorptive stripping voltammetry, using hexamethylene tetramine (HMTA) as complexing agent. Talanta 2008, 75, 1382–1387. [Google Scholar] [CrossRef] [PubMed]
- Švancara, I.; Galík, M.; Vytřas, K. Stripping voltammetric determination of platinum metals at a carbon paste electrode modified with cationic surfactants. Talanta 2007, 72, 512–518. [Google Scholar] [CrossRef] [PubMed]
- Galík, M.; Cholota, M.; Švancara, I.; Bobrowski, A.; Vytřas, K. A Study on Stripping Voltammetric Determination of Osmium(IV) at a Carbon Paste Electrode Modified In Situ with Cationic Surfactants. Electroanalysis 2006, 18, 2218–2224. [Google Scholar] [CrossRef]
- Van der Horst, C.; Silwana, B.; Iwuoha, E.; Somerset, V. Stripping voltammetric determination of palladium, platinum and rhodium in South African water resources. J. Environ. Sci. Health Part A 2012, 47, 2084–2093. [Google Scholar] [CrossRef] [PubMed]
- Silwana, B.; Van der Horst, C.; Iwuoha, E.; Somerset, V. Screen-printed electrodes modified with a bismuth film for stripping voltammetric analysis of platinum group metals in environmental samples. Electrochim. Acta 2014, 128, 119–127. [Google Scholar] [CrossRef]
- Van der Horst, C.; Silwana, B.; Iwuoha, E.; Somerset, V. Synthesis and characterisation of bismuth-silver bimetallic nanoparticles for electrochemical sensor applications. Anal. Lett. 2015, 48, 1311–1332. [Google Scholar] [CrossRef]
- Van der Horst, C.; Silwana, B.; Iwuoha, E.; Somerset, V. Bismuth–silver bimetallic nanosensor application for the voltammetric analysis of dust and soil samples. J. Electroanal. Chem. 2015, 752, 1–11. [Google Scholar] [CrossRef]
- Van der Horst, C.; Silwana, B.; Iwuoha, E.; Somerset, V. Application of a Bismuth-Silver Nanosensor for the Simultaneous Determination of Pt-Rh and Pd-Rh Complexes. J. Nano Res. 2016, 44, 126–133. [Google Scholar] [CrossRef]
- Van der Horst, C.; Silwana, B.; Iwuoha, E.; Somerset, V. Voltammetric analysis of platinum group metals using a bismuth-silver bimetallic nanoparticles sensor. In Recent Progress in Organometallic Chemistry: Chapter 6; Rahman, M.M., Asiri, A.M., Eds.; INTECH: Rijeka, Croatia, 2017; pp. 123–137. [Google Scholar]
- Whitely, J.D.; Murray, F. Anthropogenic platinum group element (Pt, Pd and Rh) concentrations in road dusts and roadside soils from Perth, Western Australia. Sci. Total Environ. 2003, 317, 121–135. [Google Scholar] [CrossRef]
- Li, L.; Xu, Z.; Wu, J.; Tian, G. Bioaccumulation of heavy metals in the earthworm Eiseniafetida in relation to bioavailable metal concentrations in pig manure. Bioresour. Technol. 2010, 101, 3430–3436. [Google Scholar] [CrossRef] [PubMed]
- Morera, M.T.; Echeverria, J.C.; Mazkiaran, C.; Garrido, J.J. Isotherms and sequential extraction procedures for evaluating sorption and distribution of heavy metals in soils. Environ. Pollut. 2001, 113, 135–144. [Google Scholar] [CrossRef]
- Nguyena, X.P.; Islam, M.N.; Jo, Y.-T.; Park, J.-H. Variation of Cu and Zn fractionation and mobility in mine tailing soil due to experimental leaching. Soil Sediment Contam. 2017, 26, 210–219. [Google Scholar] [CrossRef]
- Silwana, B.; Van der Horst, C.; Iwuoha, E.; Somerset, V. Amperometric determination of cadmium, lead, and mercury metal ions using a novel polymer immobilised horseradish peroxidase biosensor system. J. Environ. Sci. Health Part A 2014, 49, 1501–1511. [Google Scholar] [CrossRef] [PubMed]
- Silwana, B.; Van der Horst, C.; Iwuoha, E.; Somerset, V. Inhibitive Determination of Metal Ions Using a Horseradish Peroxidase Amperometric Biosensor. In State of the Art in Biosensors-Environmental and Medical Application; Rinken, T., Ed.; INTECH: Rijeka, Croatia, 2013; pp. 105–119. [Google Scholar]
- Somerset, V.S.; Hernandez, L.H.; Iwuoha, E.I. Stripping voltammetric measurement of trace metal ions using screen-printed carbon and modified carbon paste electrodes on river water from the Eerste-Kuils River System. J. Environ. Sci. Health Part A 2011, 46, 17–32. [Google Scholar] [CrossRef] [PubMed]
- Ntsendwana, B.; Mamba, B.B.; Sampath, S.; Arotiba, O.A. Electrochemical Detection of Bisphenol A Using Graphene-Modified Glassy Carbon Electrode. Int. J. Electrochem. Sci. 2012, 7, 3501–3512. [Google Scholar]
- Somerset, V.; Silwana, B.; Van der Horst, C.; Iwuoha, E. Construction and Evaluation of a Carbon Paste Electrode Modified with Polyaniline-co-poly(dithiodianiline) for Enhanced Stripping Voltammetric Determination of Metals Ions. In Sensing Electroanalysis; Kalcher, K., Metelka, R., Švancara, I., Vytřas, K., Eds.; University Press Centre Pardubice: Pardubice, Czech Republic, 2014; pp. 143–154. [Google Scholar]
- Gomez, M.B.; Palacios, M.; Gomez, M.M.; Sanchez, J.; Morrison, G.; Rauch, S. Levels and risk assessment for humans and ecosystems of platinum-group elements in the airborne particles and road dust of some European cities. Sci. Total Environ. 2002, 299, 1–19. [Google Scholar] [CrossRef]
- Higney, E.; Olive, V.; MacKenzie, A.B.; Pulford, I.D. Isotope dilution ICPMS analysis of platinum in road dusts from west central Scotland. Appl. Geochem. 2002, 17, 1123–1129. [Google Scholar] [CrossRef]
- Petrucci, F.; Bocca, B.; Alimonti, A.; Caroli, S. Determination of Pd, Pt and Rh in airborne particulate and road dust by high resolution ICP-MS: A preliminary investigation of the emission from automotive catalysts in the urban area of Rome. J. Anal. At. Spectrom. 2000, 15, 525–528. [Google Scholar] [CrossRef]
- Lesniewska, B.A.; Godlewska-Zylkiewicz, B.; Bocca, B.; Caimi, S.; Hulanicki, A. Platinum, Palladium and rhodium content in road dust, tinnel dust and common grass in Bialystok area (Poland): A pilot study. Sci. Total Environ. 2004, 321, 93–104. [Google Scholar] [CrossRef] [PubMed]
- Gomez, B.; Gomez, M.; Sanchez, J.L.; Fernandez, R.; Palacios, M.A. Platinum and rhodium distribution in airborne particulate matter and road dust. Sci. Total. Environ. 2001, 261, 131–144. [Google Scholar] [CrossRef]
- Okorie, I.A.; Enwistle, J.; Dean, J.R. Platinum group elements in urban road dust. Curr. Sci. 2015, 109, 938–942. [Google Scholar] [CrossRef]
- Morcelli, C.P.R.; Figueiredo, A.M.G.; Sarkis, J.E.S.; Enzweiler, J.; Kakazua, M.; Sigolo, J.B. PGEs and other traffic-related elements in roadside soils from São Paulo. Brazil. Sci. Total Environ. 2005, 345, 81–91. [Google Scholar] [CrossRef] [PubMed]
- Morton, O.; Puchelt, H.; Hernández, E.; Lounejeva, E. Traffic-related platinum group elements (PGE) in soils from Mexico City. J. Geochem. Explor. 2001, 72, 223–227. [Google Scholar] [CrossRef]
- Cinti, D.; Angelone, M.; Masi, U.; Cremisini, C. Platinum levels in natural and urban soils from Rome and Latium (Italy): Significance for pollution by automobile catalytic converter. Sci. Total Environ. 2002, 293, 47–57. [Google Scholar] [CrossRef]
- Silwana, B.; Van der Horst, C.; Iwuoha, E.; Somerset, V. Synthesis, characterisation and electrochemical evaluation of reduced graphene oxide modified antimony nanoparticles. Thin Solid Films 2015, 592, 124–134. [Google Scholar] [CrossRef]


| Fraction | Reactant | Conditions |
|---|---|---|
| Carbonate-bound | 100 mL of 1.0 M NaOAc | Shaken for 5 h at room temperature |
| Fe-Mn oxide-bound | 100 mL of 0.04 M NH2OH-HCl | Shaken for 4 h at 85 °C |
| Organic matter-bound | 20 mL of 0.02 M HNO3 50 mL of 30% H2O2 | Shaken for 4 h at room temperature |
| Instrument Parameter | Condition |
| Plasma power (W) | 1590 |
| Nebulizer gas flow (L/min) | 0.98 |
| Auxiliary gas flow (L/min) | 0.11 |
| Octapole bias (V) | −18 |
| Quadrupole bias (V) | −17.2 |
| Analytical Parameter | |
| Acquisition mode | He |
| Acquisition time | 0.50 s for 103Rh, 105Pd, 195Pt |
| Channels per mass | 3 for 103Rh, 105Pd, 195Pt |
| Number of repetitions/sample | 3 |
| Stripping Step | Determinant | 1Pt(HDMG)2 | 2Pd(HDMG)2 | 3Rh(HDMG)3 |
| pH | 4.7 | |||
| Reduction potential (V) | −0.9 | −0.7 | −0.8 | |
| Deposition time (s) | 30 | 90 | 30 | |
| Supporting electrolyte | 0.2 M NaOAc | |||
| Measurement Technique | Measurement | DPSV | ||
| Potential window | 0.1 to −0.6 V | |||
| Supporting electrolyte | 0.2 M NaOAc |
| Method | Pollutant | Sample | Linear Response | LOD | References |
|---|---|---|---|---|---|
| ICP-MS | Pd | Road dust | 2.70–203.7 ng/g | [49] | |
| Pt | 8.1–118.5 ng/g | ||||
| Rh | 1.2–54.8 ng/g | ||||
| HR-ICP-MS | Pd | Roadside soil | 0.3−17 ng/g | 0.1 ng/g | [50] |
| Pt | 1.1−58 ng/g | 0.7 ng/g | |||
| Rh | 0.07−8.2 ng/g | 0.04 ng/g | |||
| ICP-MS | Pt | Road dust | 12.0 ng/mL | [35] | |
| DPAdSV | Pd(II) | Road dust Roadside soil | 0.2–1.0 ng/L | 0.19 ng/L | [31] |
| Pt(II) | 0.2–1.0 ng/L | 0.20 ng/L | |||
| Rh(III) | 0.4–1.0 ng/L | 0.22 ng/L | |||
| ICP-MS | Pd | Soil | 0.088 µg/L | [51] | |
| Pt | 0.043 µg/L | ||||
| Rh | 0.016 µg/L | ||||
| ICP-MS | Pt | Soil | 7.6 ng/L | [52] | |
| DPAdSV | Pt(II) | 6.0–54 pg/L | 6.0 pg/L | [53] | |
| ICP-QMS | Pd | Road dust Roadside soil | 3 × 10⁻⁶ µg/g | This work | |
| Pt | 3 × 10⁻⁶ µg/g | ||||
| Rh | 1 × 10⁻⁶ µg/g | ||||
| DPAdSV | Pd(II) | Road dust Roadside soil | 4 × 10⁻⁷–1.0 × 10⁻⁶ µg/g | 7 × 10⁻⁸ µg/g | This work |
| Pt(II) | 2 × 10⁻⁷–8 × 10⁻⁷ µg/g | 6 × 10⁻⁸ µg/g | |||
| Rh(III) | 2 × 10⁻⁷–8 × 10⁻⁷ µg/g | 2 × 10⁻⁷ µg/g |
© 2018 by the authors. Licensee MDPI, Basel, Switzerland. This article is an open access article distributed under the terms and conditions of the Creative Commons Attribution (CC BY) license (http://creativecommons.org/licenses/by/4.0/).
Share and Cite
Van der Horst, C.; Silwana, B.; Iwuoha, E.; Somerset, V. Spectroscopic and Voltammetric Analysis of Platinum Group Metals in Road Dust and Roadside Soil. Environments 2018, 5, 120. https://doi.org/10.3390/environments5110120
Van der Horst C, Silwana B, Iwuoha E, Somerset V. Spectroscopic and Voltammetric Analysis of Platinum Group Metals in Road Dust and Roadside Soil. Environments. 2018; 5(11):120. https://doi.org/10.3390/environments5110120
Chicago/Turabian StyleVan der Horst, Charlton, Bongiwe Silwana, Emmanuel Iwuoha, and Vernon Somerset. 2018. "Spectroscopic and Voltammetric Analysis of Platinum Group Metals in Road Dust and Roadside Soil" Environments 5, no. 11: 120. https://doi.org/10.3390/environments5110120
APA StyleVan der Horst, C., Silwana, B., Iwuoha, E., & Somerset, V. (2018). Spectroscopic and Voltammetric Analysis of Platinum Group Metals in Road Dust and Roadside Soil. Environments, 5(11), 120. https://doi.org/10.3390/environments5110120