Article

Applications of Information and Communication Technology for Improvements of Water and Soil Monitoring and Assessments in Agricultural Areas—A Case Study in the Taoyuan Irrigation District

1
Department of Bioenvironmental Systems Engineering, National Taiwan University, 10617 Taiwan
2
Department of Irrigation and Engineering, Council of Agriculture Executive Yuan, 10014 Taiwan
*
Author to whom correspondence should be addressed.
Environments 2017, 4(1), 6; https://doi.org/10.3390/environments4010006
Submission received: 7 December 2016 / Revised: 9 January 2017 / Accepted: 9 January 2017 / Published: 17 January 2017

Abstract

:
In order to guarantee high-quality agricultural products and food safety, efforts must be made to manage and maintain healthy agricultural environments under the myriad of risks that they face. Three central system components of sustainable agricultural management schemes are real-time monitoring, decision-making, and remote access. Information and Communications Technology (ICT) systems are a convenient means of providing both these and other functions, such as wireless sensor networking, mobile phone applications, etc., to agricultural management schemes. ICT systems have significantly improved in recent years and have been widely used in many fields, including environmental monitoring and management. Moreover, ICT could benefit agricultural environment management by providing a platform for collaboration between researchers and stakeholders, thereby improving agricultural practices and environments. This article reviews and discusses the way in which ICT can efficiently improve monitoring systems and risk assessments of agricultural environment monitoring, as well as the technological and methodological improvements of ICT systems. Finally, we develop and apply an ICT system, referred to as the agricultural environment protection system—comprised of a cloud, six E-platforms, three mobile devices, automatic monitoring devices, indigenous wireless sensor nodes, and gateways in agricultural networks—to a case study in the Taoyuan irrigation district, which acts as a pilot area in Taiwan. Through the system, we use all available information from the interdisciplinary structured cloud database to classify the focal area into different agricultural environmental risk zones. We also conducted further analysis based on a hierarchical approach in order to classify the agricultural environments in the study area, to allocate additional sampling with resin packages and mobile devices, as well as to assist decision makers and stakeholders. The main contributions that the system provides include a technical innovation platform (suitable for integrating innovations), economic benefits, and societal benefits.

1. Introduction

Sustaining healthy agricultural environments depends on adequate environmental monitoring, particularly as the number of threats continues to increase. Environmental monitoring is also a fundamental requirement for securing food production and food safety. Therefore, environmental monitoring initiative goals should include the investigation, assessment, and integration of adequate data and information, in order to decrease the risk of being exposed to contaminants, as well as to reduce and control uncertainty [1]. In addition, sensors, wireless sensors, and sensor networks, are fundamental components in environmental monitoring schemes since they increase data availability [2,3]. Effective sensor networks and wireless sensor networks (WSN) that consist of numerous components, including mobile smart devices for collecting application-oriented data [4], are essential monitoring infrastructure for providing real-time information during agricultural environmental monitoring and can enhance agricultural environmental management strategies by improving the performance of models, such as water quality and quantity simulations [2,3,4]. In sum, a sensor network performs three major functions, including sensing, communication, and computation, via appropriate hardware, software, and algorithms [4]. An effective sensor network for monitoring environments should sustain reactivity, robustness, and network lifetime [5]. Klug and Kmoch [3] presented a framework of Wireless Sensor Networks (WSN) that included everything from in-situ measured data, to the real-time provision of conditioned information delivery to end users. In their study, the WSN included real-time sensors (sensors and sensor nodes), a sensor gateway with data storing, ethernet controller, WIFI, Global System for Mobile Communications (GSM) or General Packet Radio Service (GPRS), Universal Mobile Telecommunications System (UMT), satellite connection capabilities, Open Geospatial Consortium (OGC), and internet society (ISO) standards, as well as a web-service/database, an interface, and indicators [3]. Their proposed system processed the in-situ measurements using predefined standardized digital formats, including different data storage, receiving, and transmission protocols. This allows for the delivery of easily interpretable, high-quality data to end users [3].
Agricultural and environmental sectors usually manage diverse and heterogeneous sources of data and information. In order to make better management decisions, suitable data cleaning and filtering approaches should combine these heterogeneous data sources [6]. Since the proficiency with which e-services information and communication technology (ICT) systems deal with heterogeneous datasets could be particularly useful in environmental monitoring [1], one viable option for heterogeneous data combination is via ICT systems, which consist of broadband network infrastructure, wireless technologies, and mobile devices [7]. Furthermore, ICT may be an effective tool for facilitating data collection, validation, access, exploration, and communication [8], by allowing various stakeholders to assemble and share data pertaining to the interests of any given project [1]. Accordingly, in the last few decades, many projects have applied ICT systems to numerous fields, including the environmental monitoring of agricultural production. In terms of geospatial science, technology, and monitoring, using ICT systems has several distinct advantages, as real-time sensors seamlessly track, store, and recover field data, which can be used to investigate a large range of different issues. For example, due to a lack of data in agricultural engineering studies, it is often difficult to trace irrigation water, soil, or product contaminant sources, from farm to fork [9]. Well-designed ICT systems have the potential to examine related more thoroughly, by integrating a large number of different devices, products, tools, services, and technologies, which do not only improve monitoring, but also enhance agricultural management. Such ICT systems could include the spatiotemporal integration of geographic information systems (GIS), remote sensing (RS), and global positioning systems (GPS), as well as mobile devices, to provide site-specific agricultural solutions through the derivation of data relating to agricultural management and production. By doing so, the results of specific strategies or past events can be evaluated at the scale of individual farms [9].
ICT-based monitoring systems are widely applied in a number of agricultural areas. Such systems include the remote monitoring of farm conditions and the remote control of farm equipment, such as irrigation systems, through smartphone applications [10]. In fact, there is a large body of work in this field, and a number of associated tools have been developed. Cardell-Oliver et al. [5] and Mancuso et al. [11] developed sensor networks for monitoring soil moisture and soil temperature, respectively. Rao [12] introduced the concept that ICTs can actually improve agricultural development, leading to an increase in rural income and sustainable agricultural development. Reddy et al. [13] applied ICT tools to develop a system that improves the performance and utilization of agricultural technology for farmers. In addition, several recent studies have developed ICT systems for specific applications within agricultural systems and management schemes. Jiang et al. [14] proposed a water environment monitoring system that consisted of data monitoring nodes, data base stations, and remote monitoring centers based on a WSN. Adil et al. [15] improved irrigation efficiency by developing a system based on ICT systems. Bartlett et al. [16] and Sesma et al. [17] applied ICT to irrigation systems at the irrigation district scale. They included most of the available technologies from local monitoring, remote sensing, crop modelling, and remote control of irrigation processes [18]. Jagannathan and Priyatharshini [19] developed a system that measured physical parameters, such as soil moisture content, nutrient content, and the soil pH of agricultural areas. Klug and Kmoch [3] provided new ways of using WSN and standardized web services for driving the next generation of real-time multi-purpose data assemblage, evaluation, modelling, and visualization, in flood and water scarcity decision-making. Yoshida et al. [10] introduced a quasi real-time monitoring system that consists of a web server, AD converter, DA converter, ethernet controller, high-intensity LED lighting, and sensors interconnected by a mobile internet provider (GSM/3G). Perea et al. [20] developed an ICT-based system that schedules and manages irrigation at the micro-scale level (i.e., a strawberry farm), using the principles of precision irrigation. In this study, we used an ICT-based monitoring system to evaluate the risk of contamination in different places within a pilot area. We then investigated the benefits of the ICT agricultural environment protection system for reducing environmental pollution in the pilot area. In addition to demonstrating the results of the agricultural water management system component within the pilot study area, we also discuss many of the other benefits and functions of the proposed ICT system in the field of agricultural engineering.

2. Development of an Agricultural Environmental Protection System Using ICT

2.1. Application of ICT in a Pilot Study Area

In Taiwan, agricultural pollution incidents, including soil and water pollution events in agricultural environments, have drastically declined in recent years. Such events were particularly prevalent from 1950 to 1995, as the country underwent rapid industrialization and urbanization. Although agricultural products are currently sampled at random, and are regularly proven safe for consumption, many agricultural environmental management problems remain unresolved since contaminant source locations have not been pinpointed, and neither have their specific remediation measures. Furthermore, recycling and transmission mechanisms have not been identified (Figure 1). These difficulties become more apparent when inter-sectoral stakeholder cooperation is complicated, resulting in a scattering of resources (policies and regulations), heterogeneous data, production on inappropriate farmland, difficulties in irrigation systems management, farmland and crop contamination, as well as overall concern with public food safety standards. In order to address these agricultural production problems and improve food quality and safety, it is essential to develop a reliable information system which can reveal causal relationships and key issues, providing transparent information to decision makers, farmers, and consumers.
As always, the first priority is to trace pollution transmission mechanisms in the agricultural environments. These include pollution sources, transmission pathways, soil deposition, crop absorption, and human consumption. As identified in Figure 1, sources of contaminants include air (unfiltered exhausts), water (a pollutant legally or illegally discharged), industrial waste (liquid and solid), and hazardous materials which were directly or indirectly discharged into the agricultural environments through various pathways, such as deposition, irrigation channels, illegal dumping, and illegal disposal [21,22]. Such contaminants can compromise the quality and safety of certain crops through their entrance into the food supply via food crop absorption. These problems consist of six categories which require specific managerial strategies. The basic categories are comprised of water management, irrigation water quality, sediment, soil, crops, and production (Table 1). These issues could be solved by a number of measures, including the development of a hierarchical management system of agricultural and environmental water resources, the establishment of an agricultural irrigation water management center, the implementation of heavy metal irrigation monitoring techniques, the development of pollutant mobility models, the development of a water body carrying capacity index, the integration of a pollution management subsidy mechanism, the establishment of crop safety management and cultivation techniques, the integration of environmental resources, and, finally, the increase of product traceability and associated value (Table 1).
When considering contaminant exposure and associated risks, the first priority is to identify contaminant transmission mechanisms in agricultural environments. These include pollution sources, transmission pathways, soil deposition, crop absorption, and human consumption. As identified in Figure 1, sources of contaminants include air (unfiltered exhaust), water (pollutant legally or illegally discharged), industrial waste (liquid and solid), and hazardous materials directly or indirectly discharged into the agricultural environments through various pathways such as deposition, irrigation channels, illegal dumping, illegal disposal [21,22]. Such contaminants can compromise the quality and safety of certain crops through their entrance into the food supply via food crop absorption. Broadly speaking, we classify the above problems into six categories, each of which requires specific managerial strategies. The basic components comprise of water management, irrigation water quality, sediment, soil, crops and production (Table 1). As indicated in the far right column of Table 1, these issues can be handled via a number of adaptation strategies and technologies.
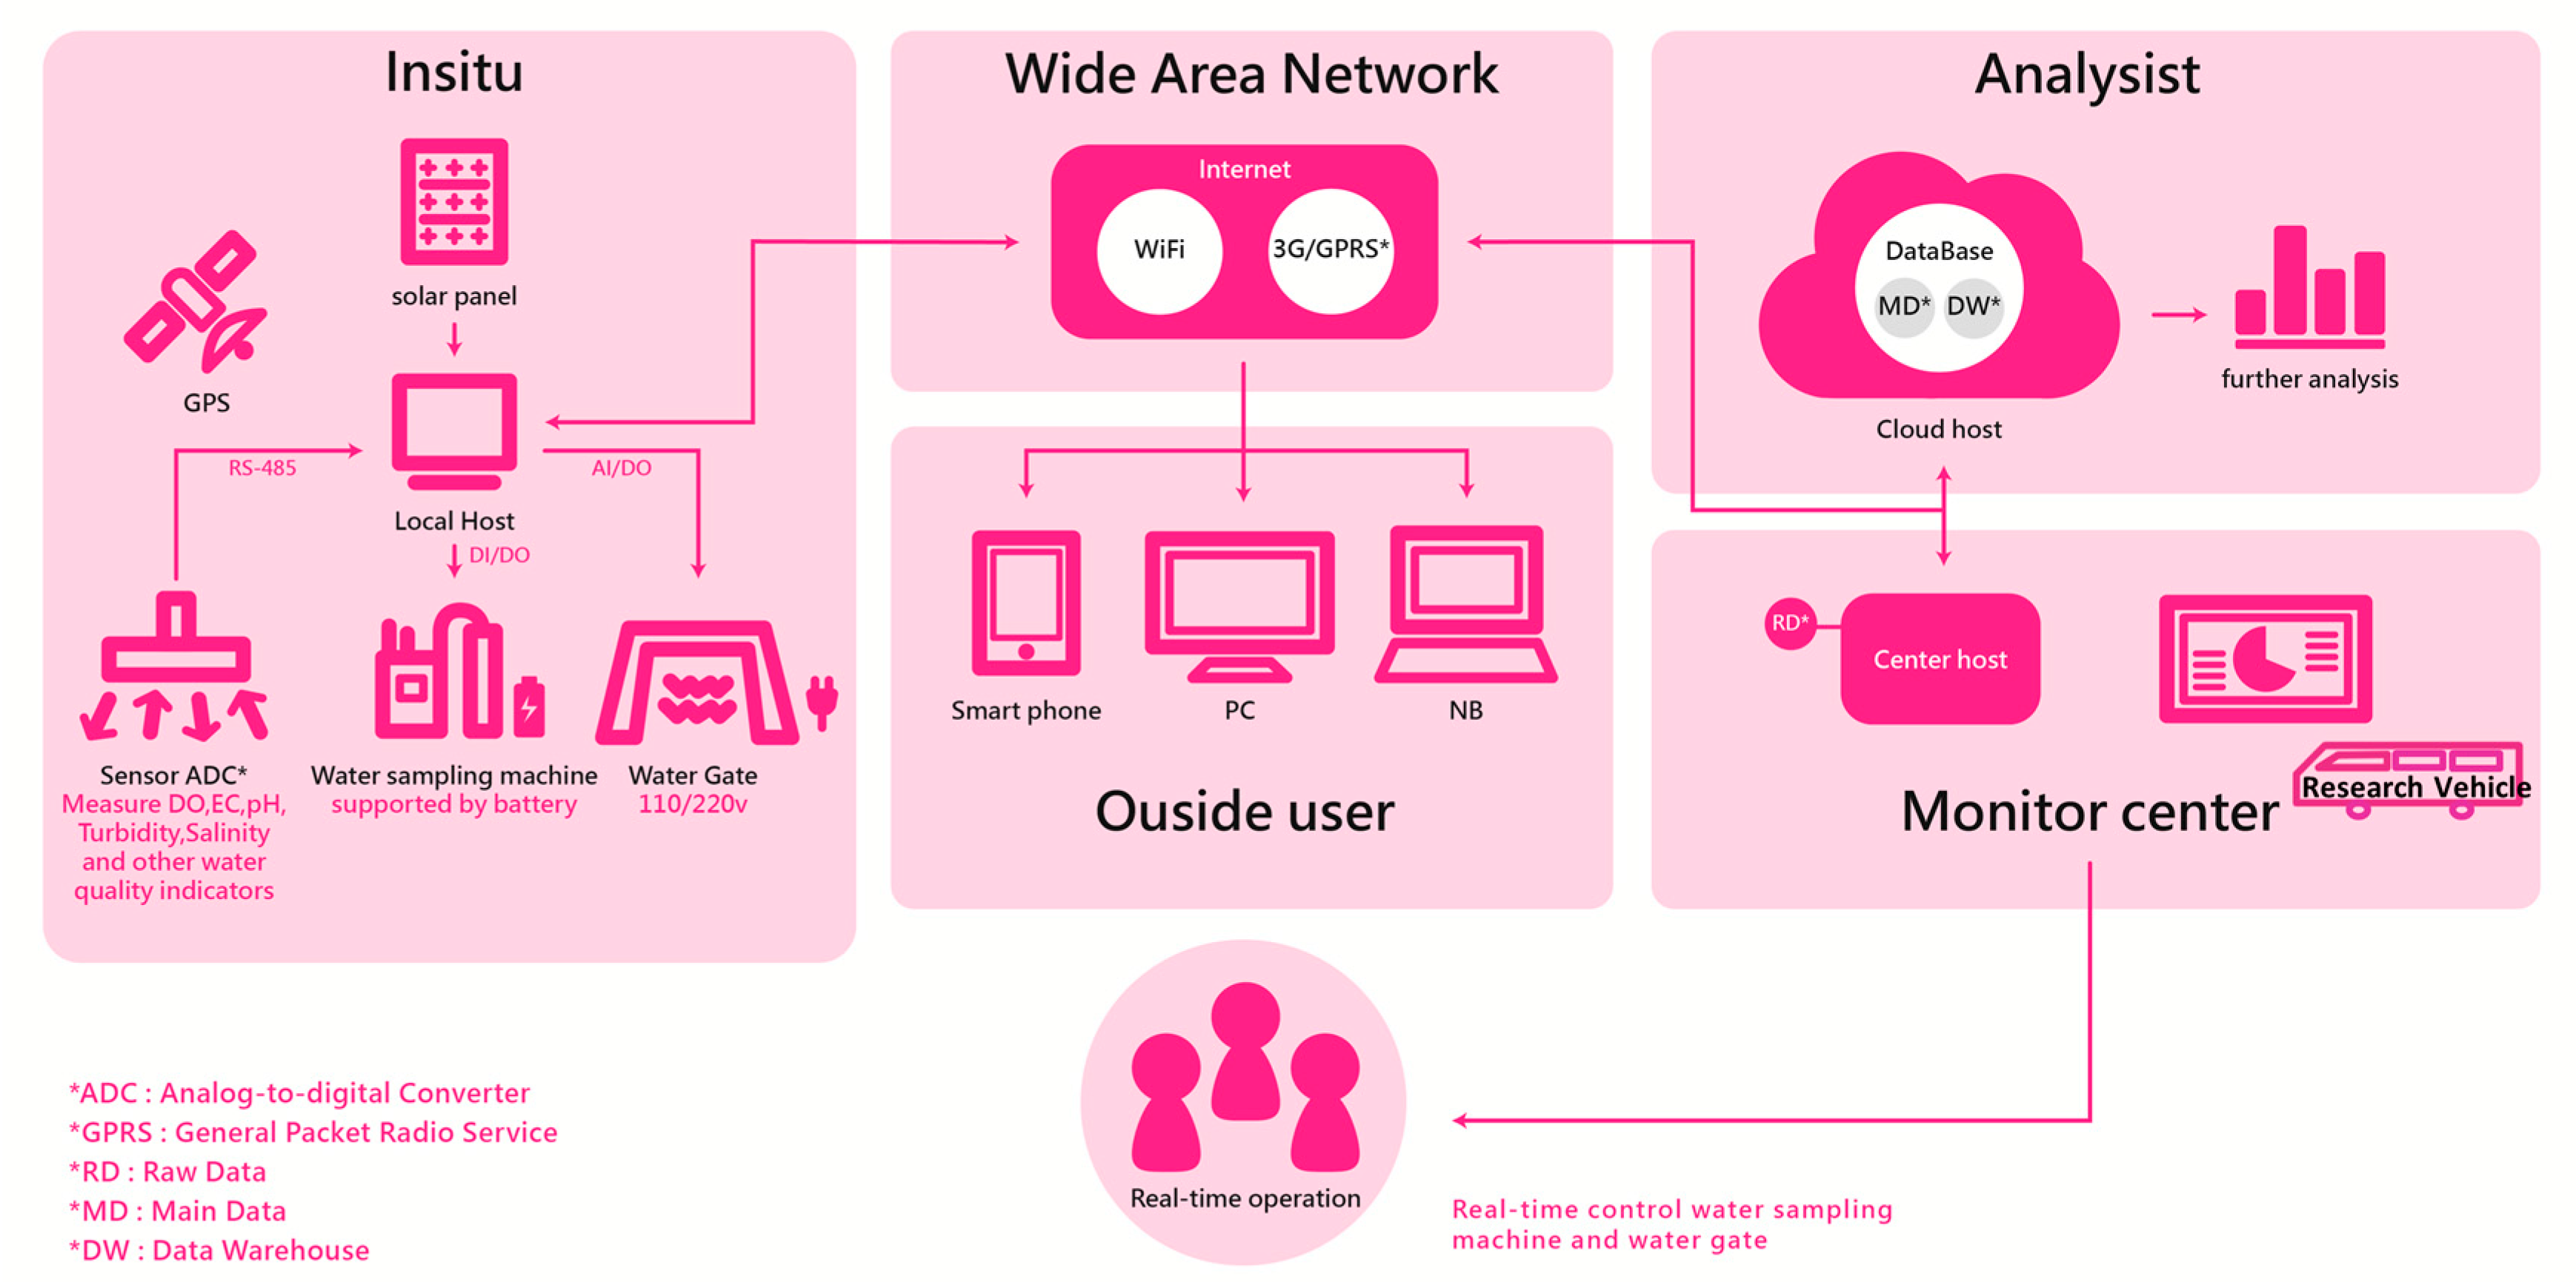
Providing effective information and data for further analysis of agricultural environments through the integration of data into an agricultural production safety database is difficult. Therefore, this study developed an ICT system with wireless sensors and automatic monitoring devices, called the agricultural environment protection system. It consists of a cloud, six platforms, three mobile devices, and a mobile research vehicle. The system was installed and centrally controlled at a control center. The center can provide historical data and real-time monitoring data on the environmental conditions in the focal area to end users.

2.2. Conceptual Model of the Agricultural Environmental Protection System Based on the ICT System

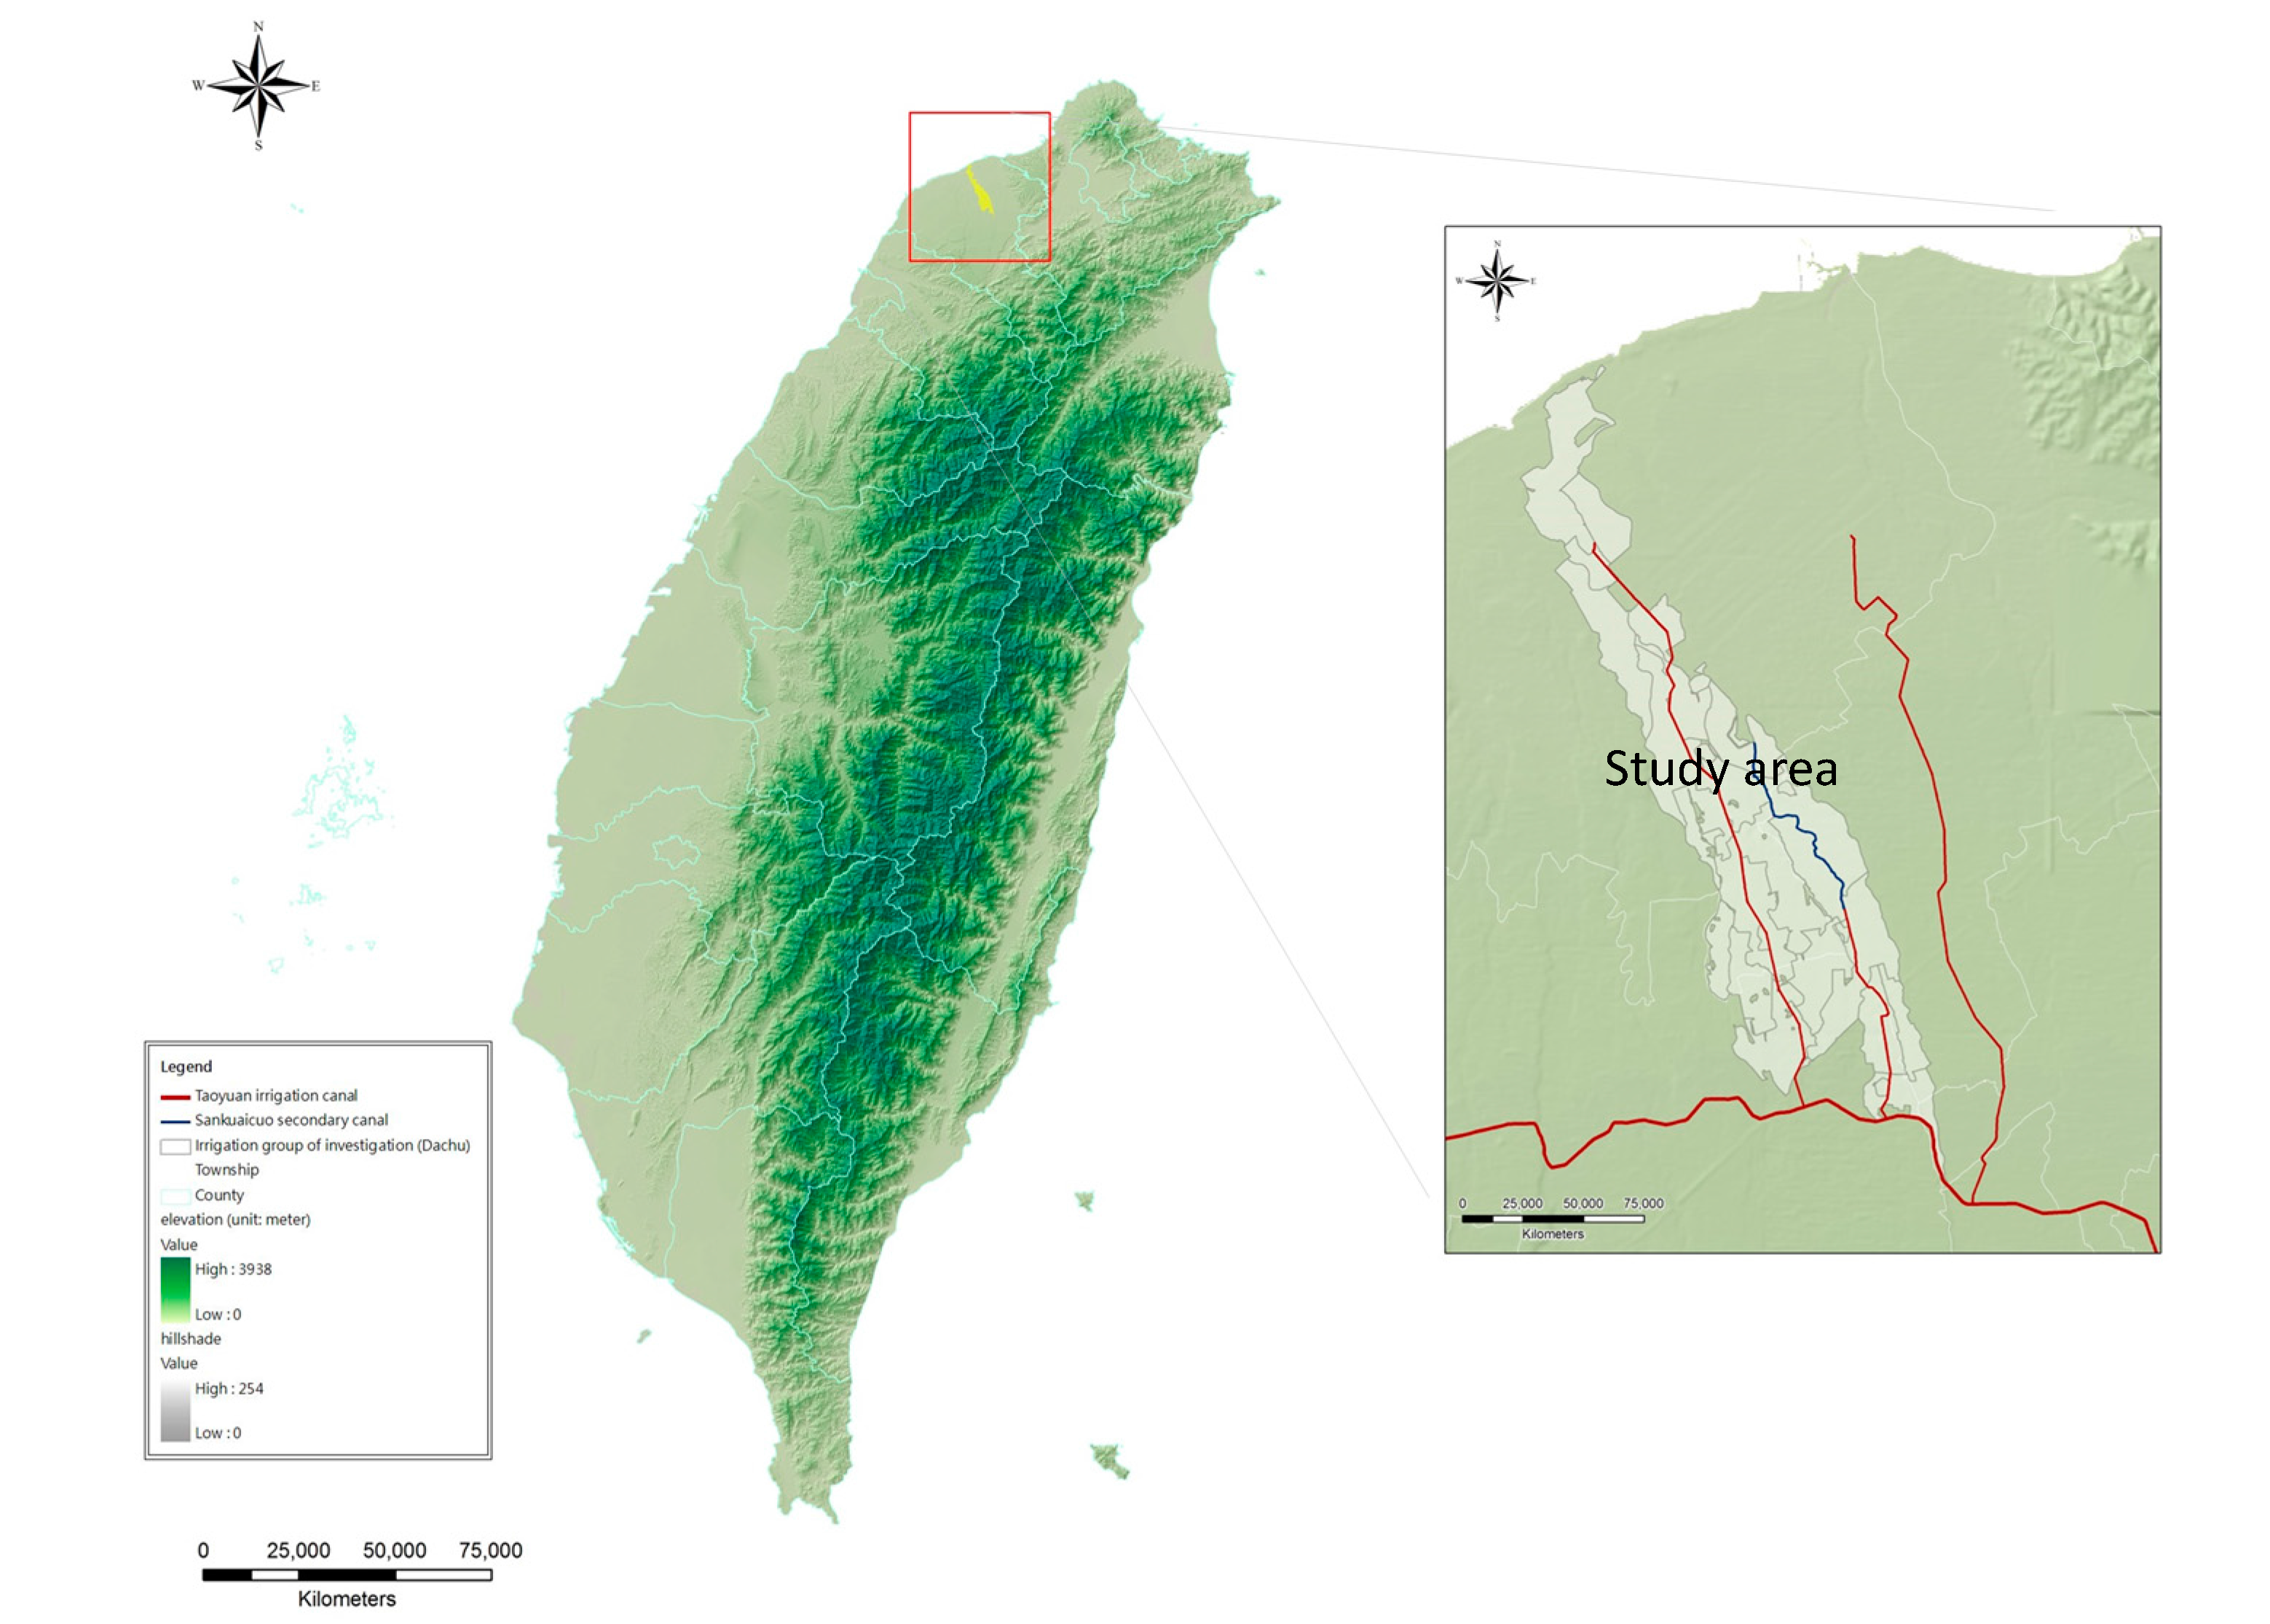
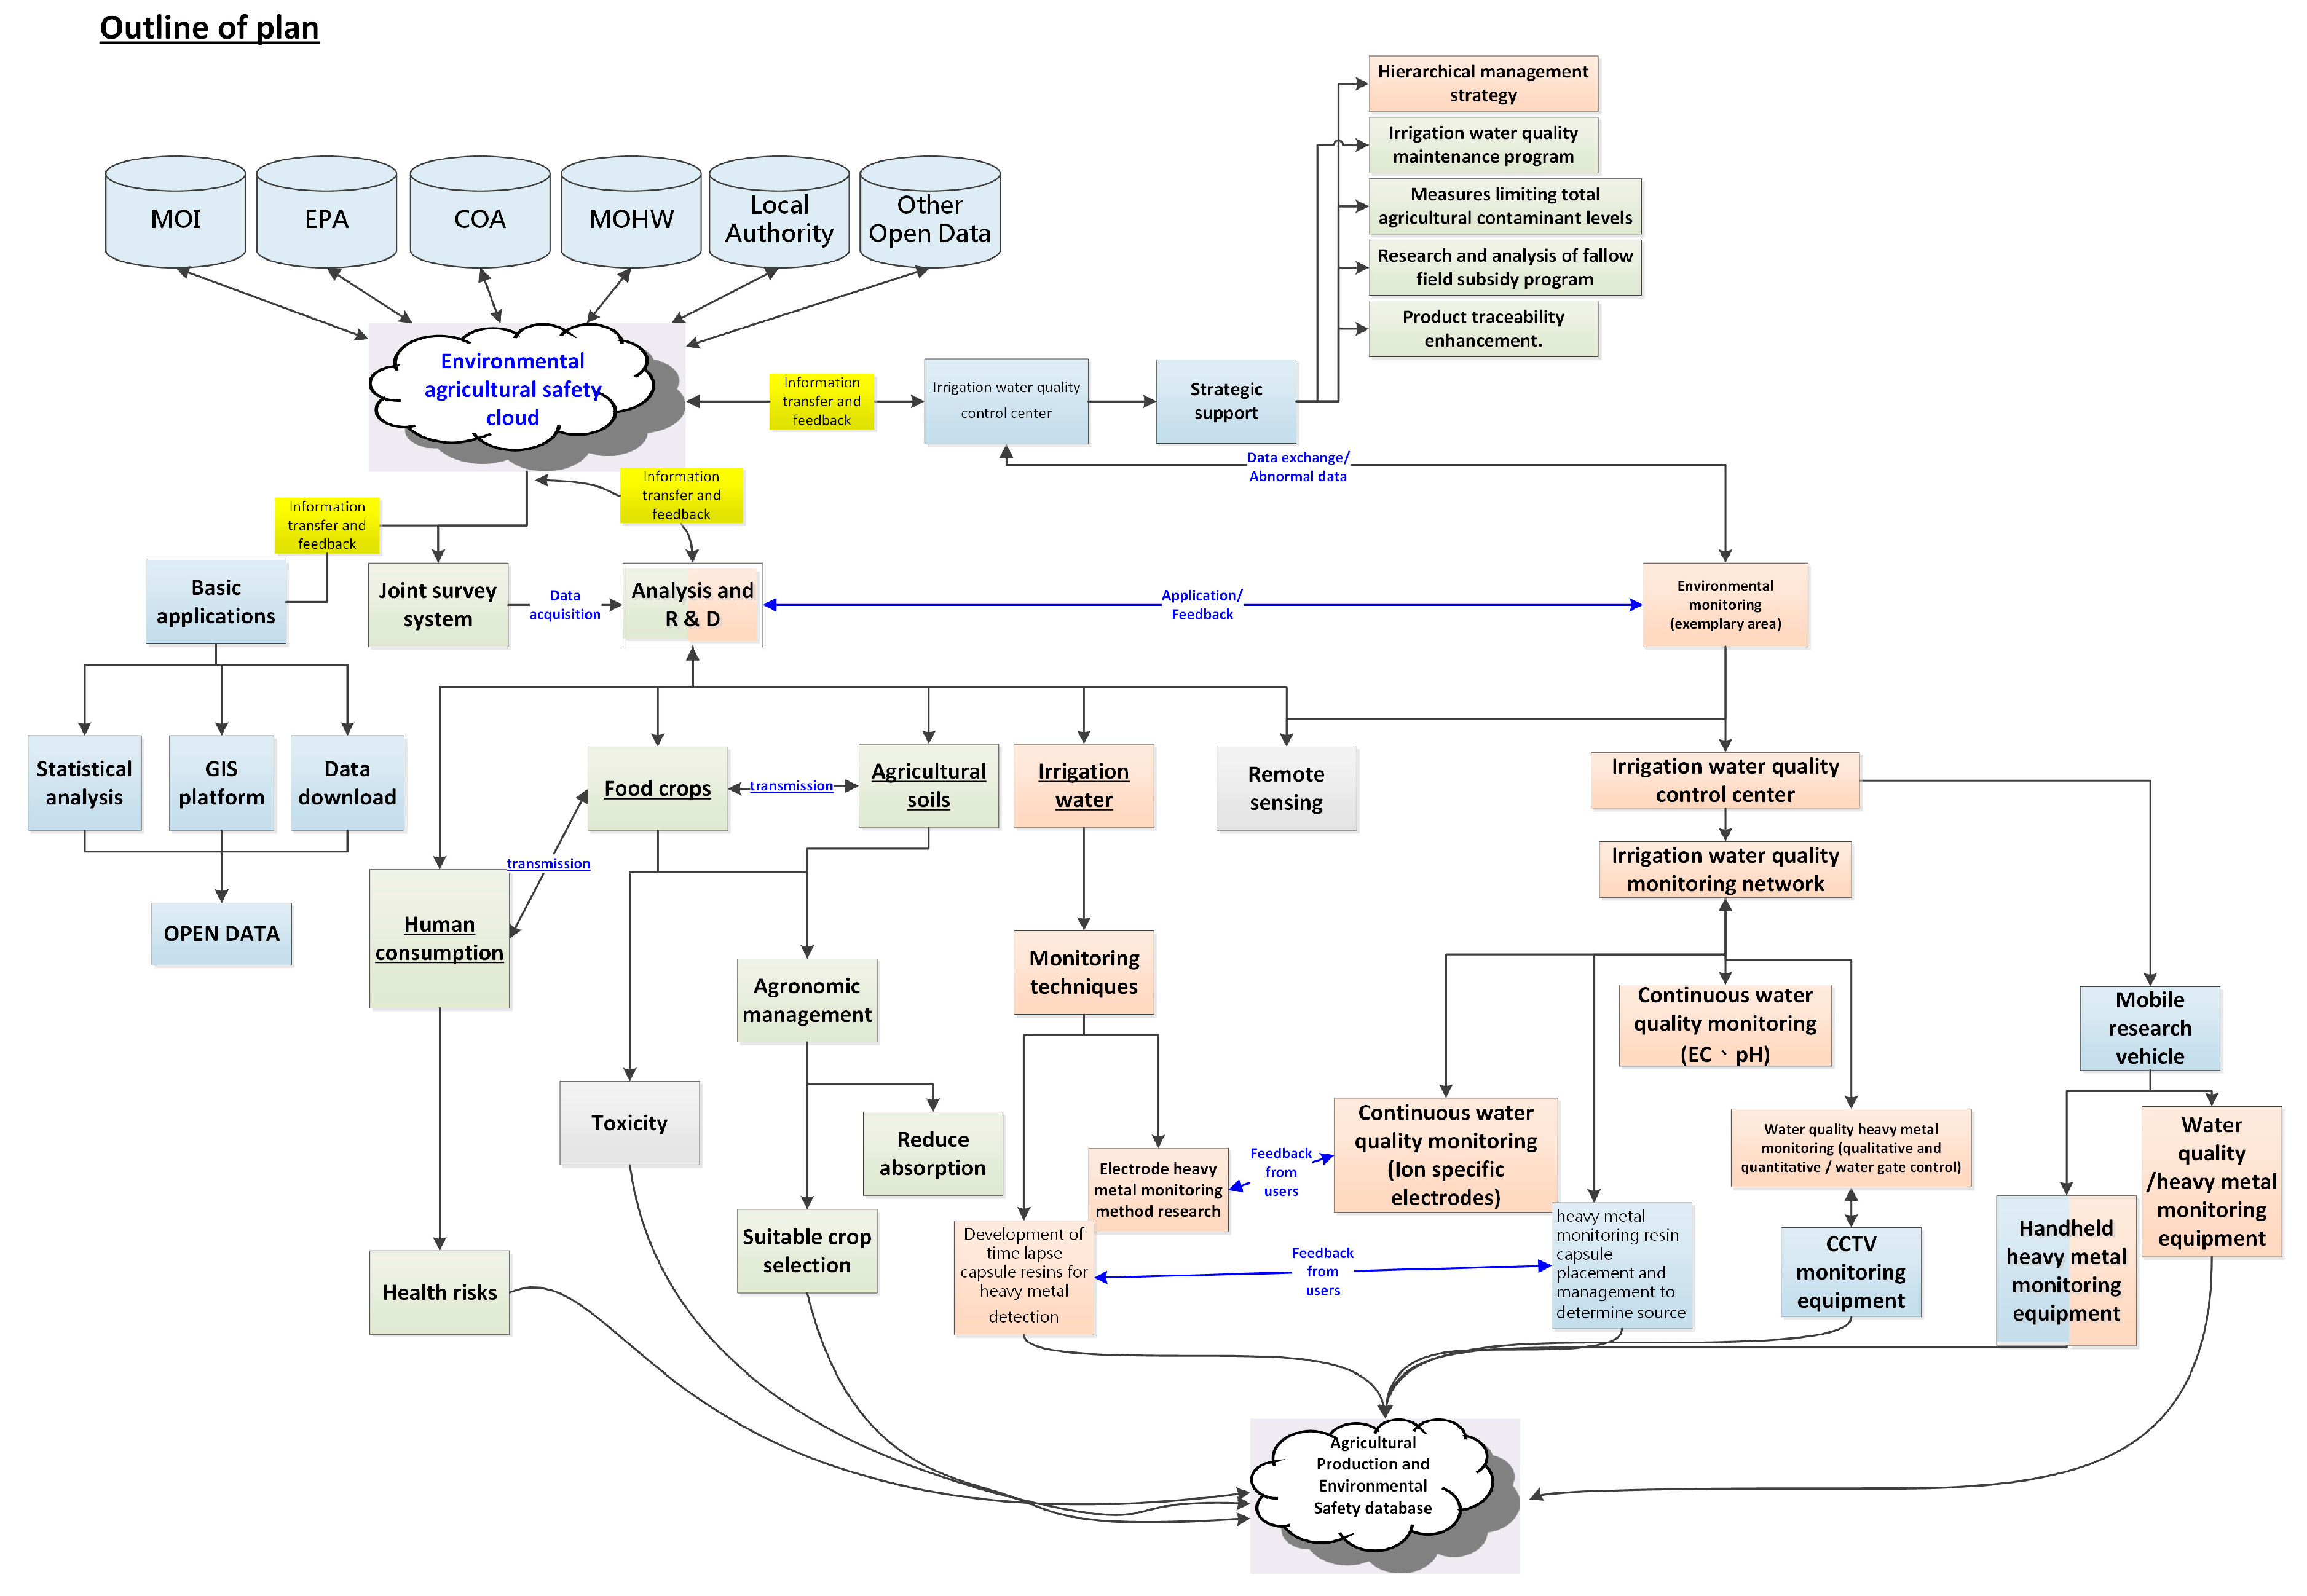
The 2217 ha Dayuan irrigation area, located within the Taoyuan irrigation district (24,721 ha) of Northern Taiwan, is the pilot study area considered in this paper (Figure 2). The conceptual framework of the ICT-oriented agricultural environment protection system is presented in Figure 3 and Figure 4. Whereas Figure 3 shows a simplified conceptualization, Figure 4 shows a more in-depth diagram of the agricultural environment protection system. 3G/GPRS internet interconnects the database, the auto-monitoring devices, the mobile devices, and the mobile research vehicle’s onboard systems.
The agricultural environment protection system database is comprised of heterogeneous data from various sources, such as the Environmental Protection Agency (EPA), the Council of Agriculture Executive Yuan (COA), the Ministry of the Interior (MOI), the Ministry of Health and Welfare (MOHW), and other open source data (Figure 4). While integrating such diverse datasets can entail a number of issues (e.g., disparate spatiotemporal scales, accuracy, precision, etc.), data cleaning approaches, including type checking, normalizing, fixing, and imputation, can resolve many of these concerns. While the system provides many benefits, one of the main advantages of this system is the continuous real-time uploading of data from a wide range of sensors, to its databases. Since data uploaded to any of the databases are instantaneously available to all stakeholders through the ICT system, the system allows for more timely responses. In addition, the information provided by the agricultural environment monitoring and management support platform is easy to interpret, since it delivers all requested data and information in GIS formats. The data is also available in smart-phone formats.
By integrating a number of different platforms into this framework, each designed for a specific purpose, the system also adds flexibility and functionality to real-time responses. If, for example, the irrigation water quality falls below a given safety threshold, the water gate platform controls the irrigation water gates, whilst the management platform dispatches the monitoring vehicle to check and confirm emergency situations, identified by the decision control center. Data collected with the mobile monitoring vehicle is then uploaded to the control center and the agricultural environmental monitoring and management support platform, in order to provide simultaneous data and information updates. In order to obtain appropriate contamination samples of irrigation water and soils, the ion exchange resin capsule layout management platform identifies suitable locations for additional data collection.
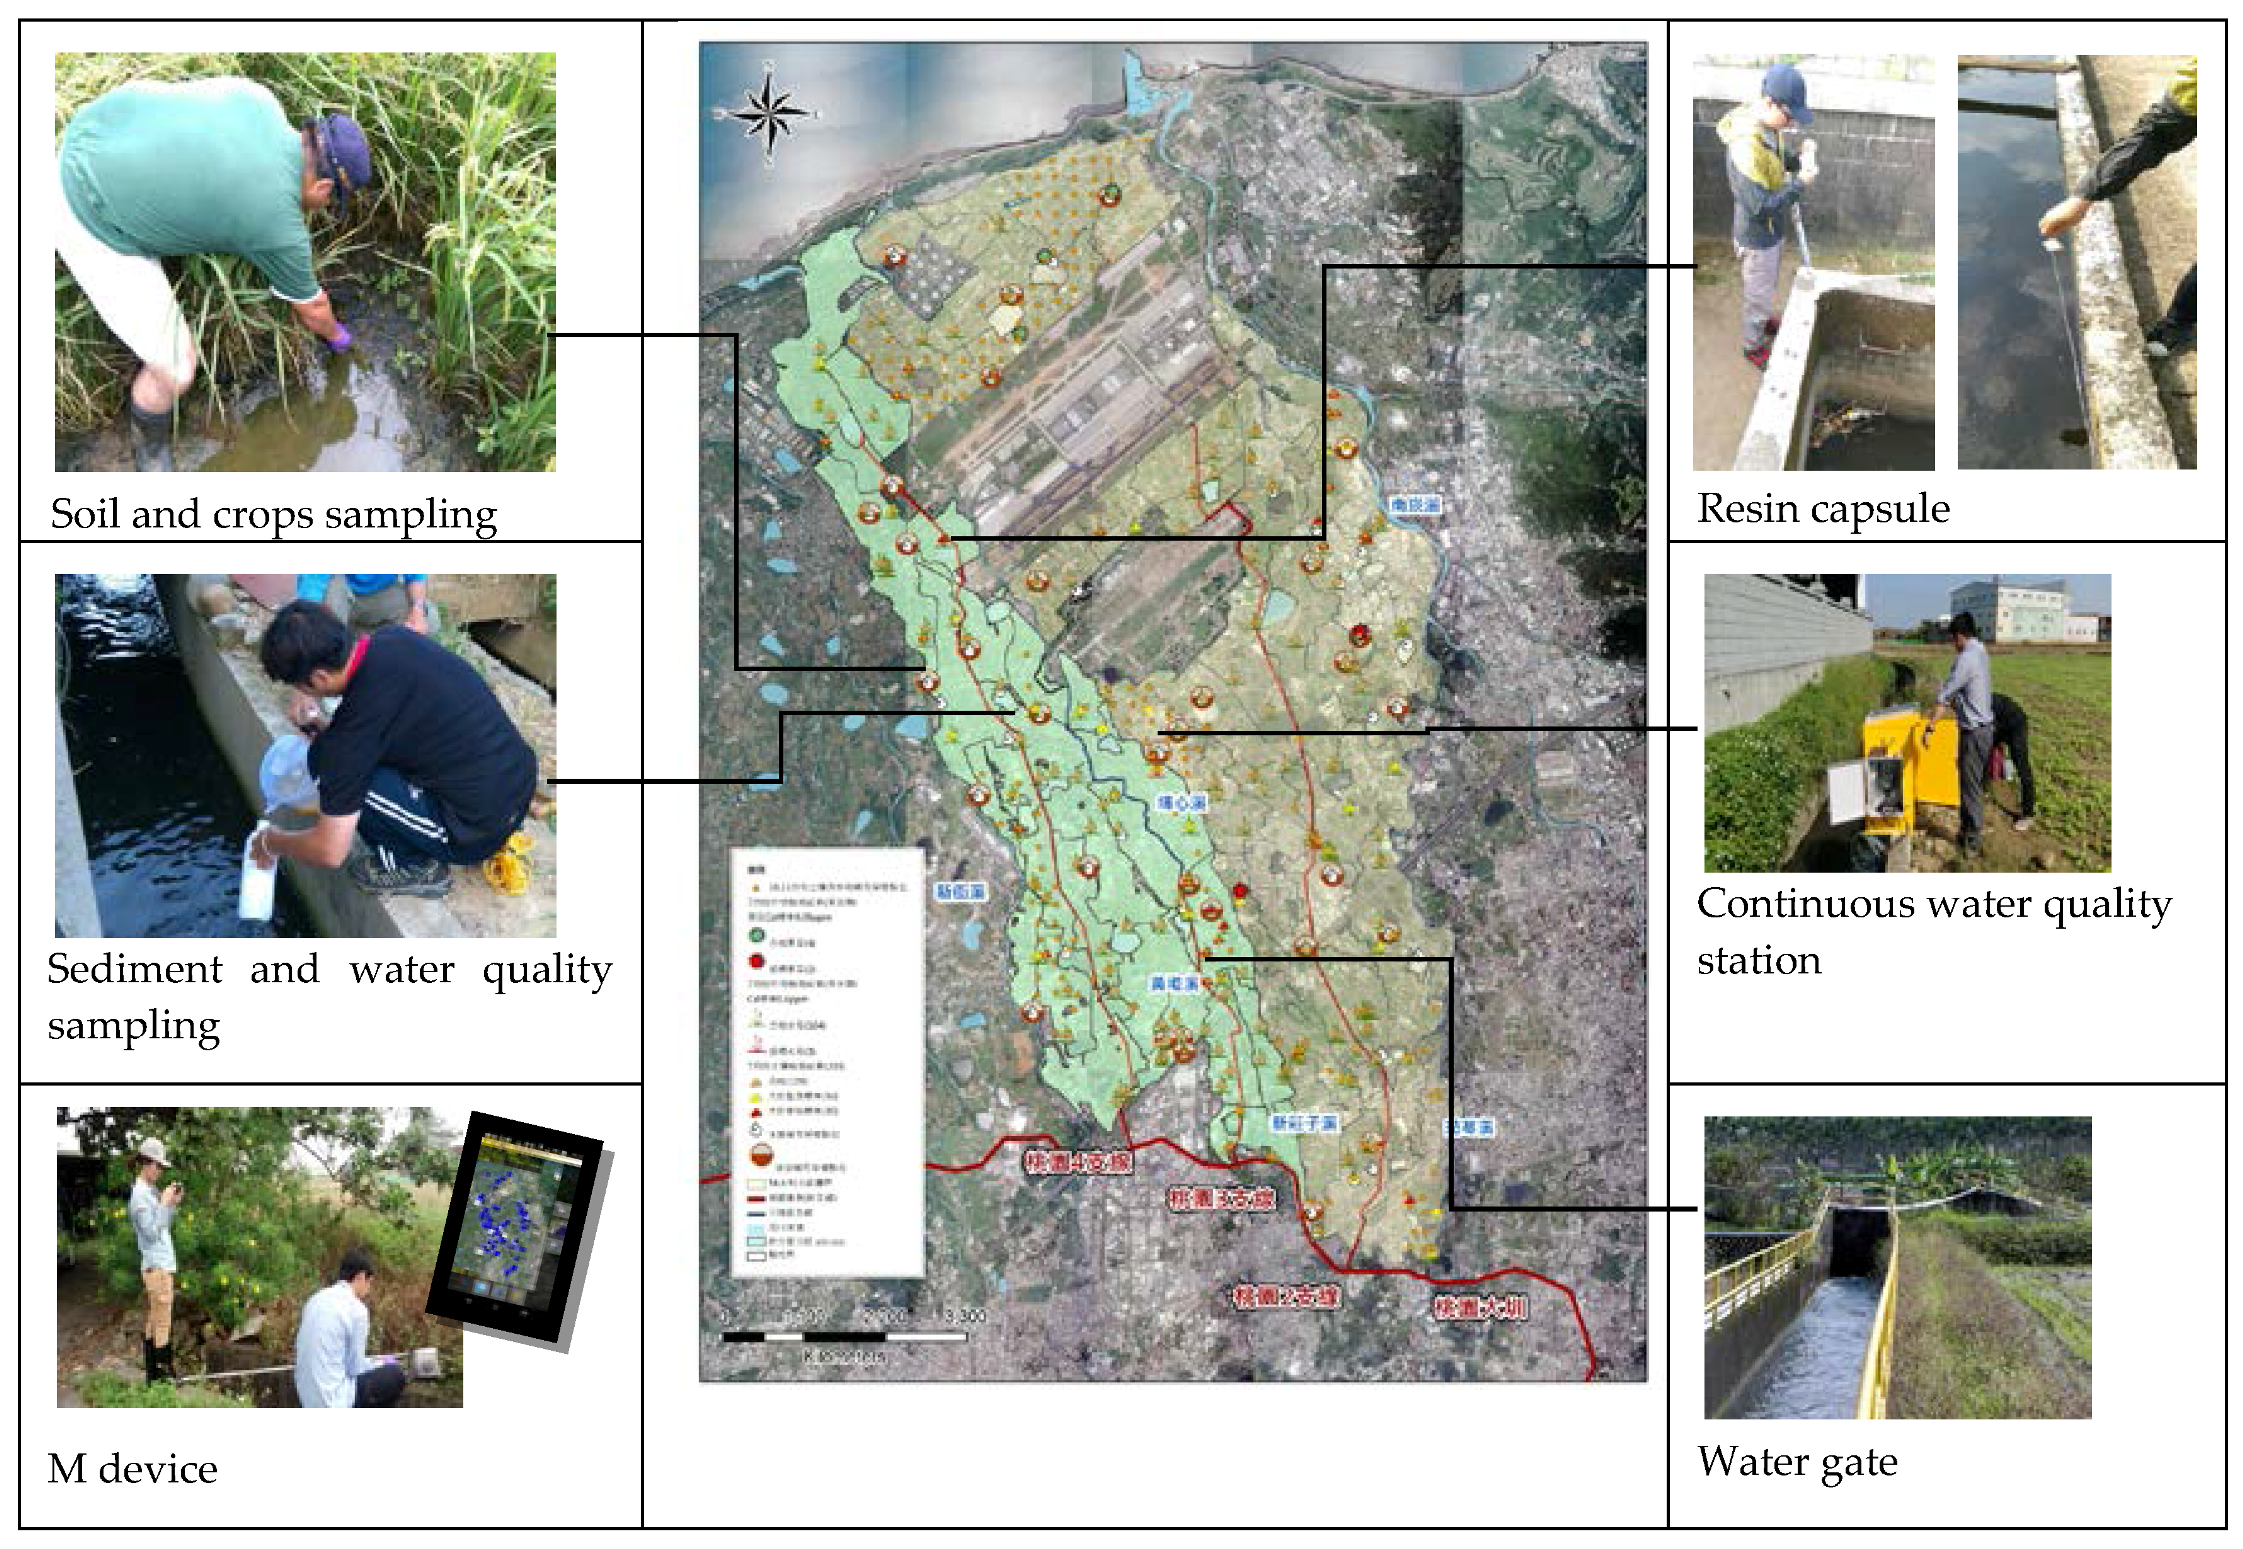
Once again, all of the tools previously mentioned are available in smartphone formats, allowing for an easier decision implementation, data collection, and data interpretation. In this study, we classify all mobile smartphones equipped with various cell phone applications as three M-devices (Mobile-devices). Beyond sample data, the smartphones with GIS platforms also send spatially explicit information about field data to the interconnected platforms. Prior to uploading data to the database, appropriate data checking procedures validate the data. Figure 4 shows the interconnections and causal loops of the system components, including the database, platforms, mobile devices, and the mobile monitoring vehicle. The cloud consists of data transferred and exchanged between the six platforms, via the irrigation quality control center. Through this framework (Figure 4), the system supports the development of a hierarchical management strategy, maintenance of the irrigation water quality program, reinforcement of product traceability, the decrease of total agricultural contamination levels, and fallow field subsidy programs, research, and analysis. Figure 5 shows the spatial distribution of monitoring stations, samples, and locations of water gates, along with a simulation showing the relative risk of different areas based on the agricultural environmental protection system.

2.3. Management Based on the Agricultural Environmental Protection ICT System

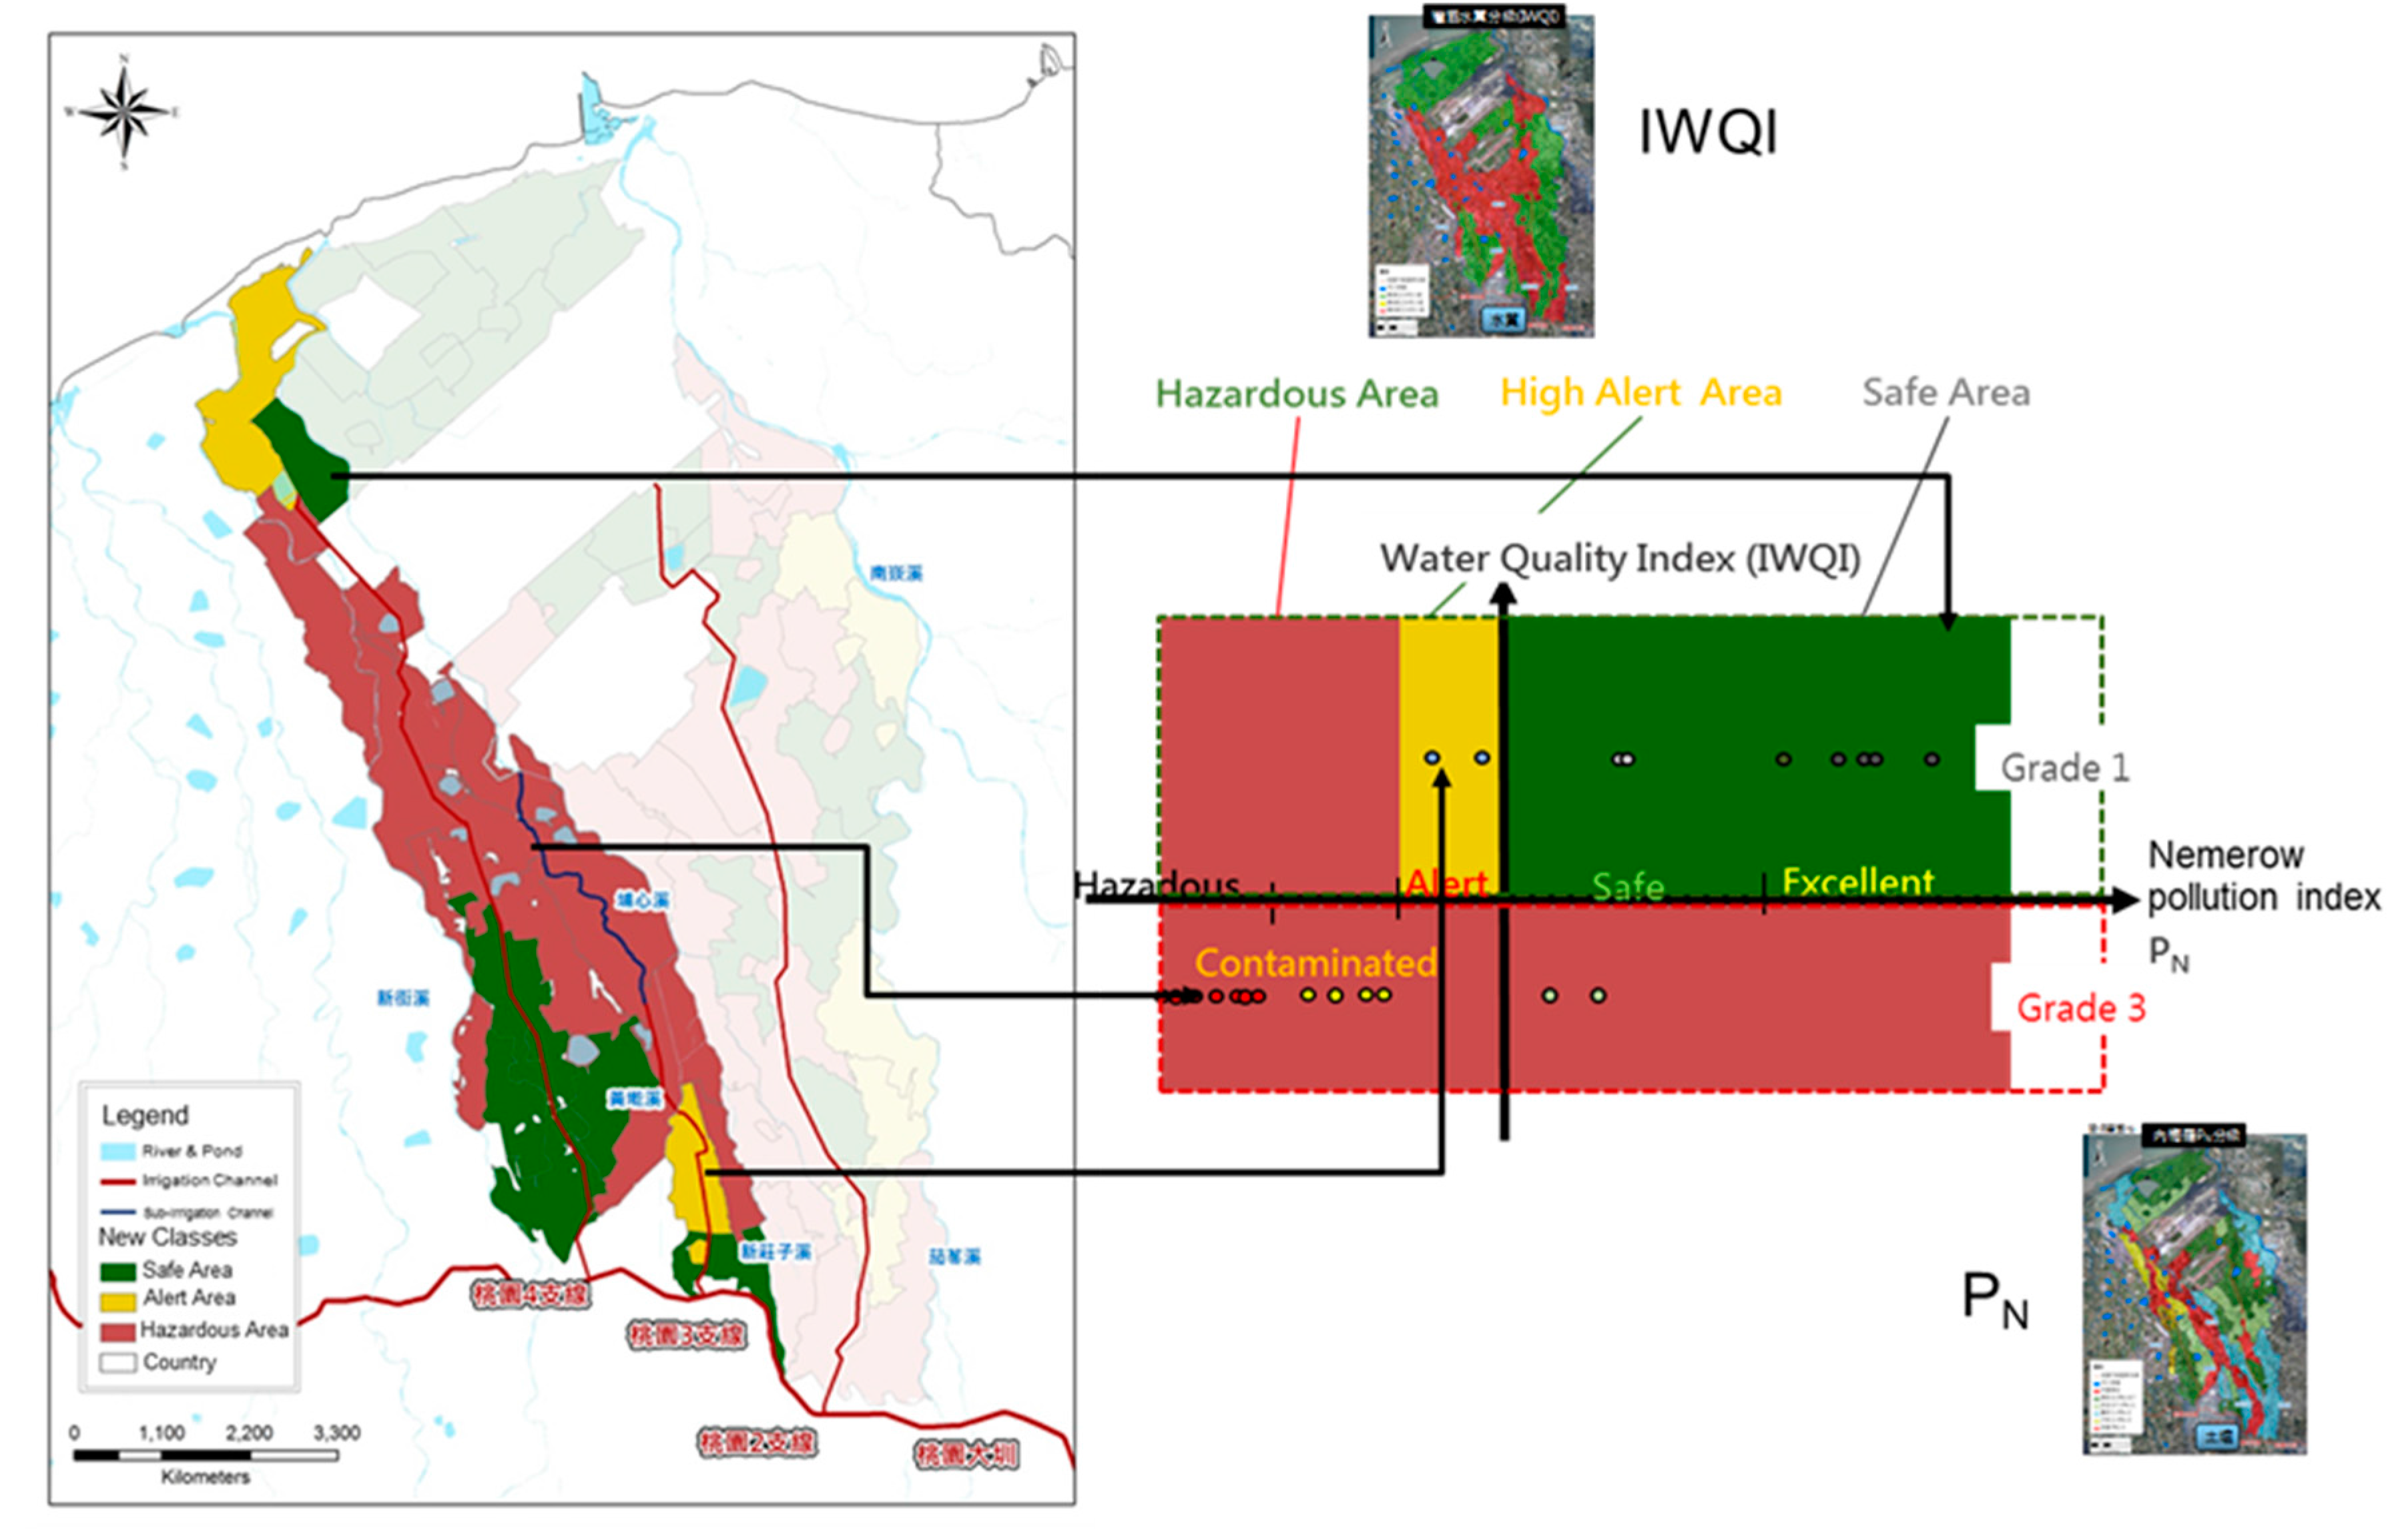
In order to demonstrate a hierarchical management strategy, we used the current ICT database system to calculate an irrigation water quality index (IWQI) for the pilot area. Figure 6 shows the results of the hierarchical approach, based on the cloud database using the Nemerow pollution index (PN) [23] and an irrigation water quality index (IWQI). Below are the methods for calculating these two indices (Equations 1 and 3).
P N = 1 2 [ 1 n i = 1 n ( C i C s i ) 2 + ( C m C s ) 2 ]
C m C s = max ( C 1 C s 1 , C 2 C s 2 , ... , C n C s n )
where Ci represents measured values of i pollutant, Csi represents i evaluation standard concentration, n is the number of pollutants, Cm represents the maximum concentration, and Cs is the maximum evaluation standard concentration. The PN is classified to be safe (PN ≤ 0.7), precautionary (0.7 ≤ PN ≤ 1), slightly polluted (1 ≤ PN ≤ 2), moderately polluted (2 ≤ PN ≤ 3), or heavily polluted (PN ≥ 3) [23,24,25].
The IWQI consists of three grades that represent the irrigation water quality at different stations and irrigation channels [26]. The IWQI classifies irrigation canals into one of three grades: contaminated, grade III, if any heavy metal concentrations exceed the respective safety threshold; hazardous, grade II, if non-heavy metal contamination is severe; or safe, grade I. The IWQI considers six non-heavy metal contaminants, as well as seven aqueous and eight sedimentary heavy metals. For non-heavy metal contaminants, these include electrical conductivity, residual sodium carbonate content, chloride content, sulfate content, ammonium content, and the sodium absorption ratio. Customized equations for each of the above contaminants first calculate a score, qi, ranging from 0 to 100 for respective contaminant readings. Based on the scores, the readings are classified into either grade I: 100–50 or II: <50. If none of the non-heavy metal contaminant scores are below 50, the IWQI score for the specific reading is simply calculated as the lowest score of the contaminants. The IWQI is calculated as follows:
I W Q I = ( i = 1 n q i n ) 1.5 10
where qi is the lowest score for each non-heavy metal contaminant (interval I: 100–50, interval II: <50, and interval III >regulations of heavy metals), and n is the number of non-heavy metal contaminant scores available for the calculation. Table 2 lists the grades.
Figure 6 shows contaminated areas, hazardous areas, high alert areas, and safe areas in the pilot location, identified by the hierarchical management strategy in the pilot study area.

3. Discussion

Information infrastructures can benefit the environmental monitoring of agricultural systems in three major ways, by: (1) providing data and metadata; (2) promoting standards and guidelines for increased data consistency and data sharing; and (3) acting as a clearinghouse to facilitate data access and exploration [1]. Similar to the flood and water scarcity cases presented by Klung and Kmoch [3], the ICT system developed in this paper provides data and metadata access, as well as analysis and exploratory functions of soil, water, irrigation systems, and land-use data. This allows for improvements in the modeling and analysis of a range of dynamic issues. Enhanced modeling and analytical results can: refine spatial representations of hierarchical management strategies and irrigation water quality maintenance programs; reinforce product traceability and decrease total agricultural contamination levels; and further fallow field subsidy programs analyses. Moreover, our proposed system provides both historical and real-time spatially explicit information via WSNs. The WSNs used in this study allow for a detailed GIS representation and assist in issue visualization, interpretation, decision-making, and policy assessment. In this study, the proposed system successfully classified contaminated areas, hazardous areas, and safe areas in the pilot area, based on ICT system water quality data and soil pollution data.
The efficacy of environmental assessments and environmental management decisions are ultimately dependent on data availability. Both can therefore benefit from ICT systems, which drastically increase the amount and accessibility of spatiotemporal data [8], by integrating a number of databases, which are normally difficult to manage due to heterogeneous data types. Without the use of ICT systems, heterogeneous data can pose a significant problem to environmental monitoring programs [8]. For example, disparate sensor or data transmission errors and infrequent system behavior may cause anomalous data [27]. In order to mitigate data aberrations, this study synchronized and integrated data from the Environmental Protection Agency (EPA), the Council of Agriculture, the Executive Yuan (COA), the Ministry of the Interior (MOI), the Ministry of Health and Welfare (MOHW), and other official sources, via standard data cleaning techniques with manual approaches, lying within the proposed agricultural environment protection system for the study case. Prior to these manual approaches, the anomaly detection and mitigation (ADAM) technique identifies erroneous measurements that a manual QA/QC may fail to detect [27].
Awareness of ecosystem services and their associated resources and services has increased in ICT production and consumption [28]. The installment, computation, maintenance, and energy requirements of these systems can have negative environmental impacts. Recently, numerous studies have indicated that balancing ICT usage with the potential negative environmental effects is essential for the development of ICTs [28,29,30]. This relatively new area of research, known as green ICT or green computing, attempts to develop environmental guidelines suitable for curbing the negative effects of ICTs [28,29]. Future research should expand and customize the determinants of green ICT adoption technologies [28]. Therefore, the implementation of educational programs in green ICT is important for ensuring further green ICT development around sustainability concerns [29].

4. Conclusions

This paper reviewed the utility of ICT systems in environmental monitoring, and demonstrated the applicability of ICT systems in the development of an agricultural environment monitoring system, which is also able to remotely control system equipment. The ICT agricultural environment protection system presented here consists of six electronic platforms (E-platform), three mobile devices, and a network of sensors, including WSNs, a mobile research vehicle, and a control center that maintains and controls the system. The continuous auto-monitoring devices provide real-time water quality and quantity data, through intelligently distributed sensors. Data collected from these sensors are continuously uploaded to the database. Here, the data undergo validation and storage, and are then available to all stakeholders who can use them in continuous or future analysis and modeling. By increasing the accuracy of modeling and analysis, the data can assist in the evaluation of agricultural environments [1]. Moreover, the system framework presented here supports public participation (e.g., farmer associations, individual farmers, and citizen scientists), and thereby further increases the potential of environmental monitoring coverage. We hope to explore the effectiveness of various data quality control tools in future work on this system. Finally, the results of this case study reveal that green ICT systems should be considered, not only as a means of improving agricultural system performance, but also as a means of reducing negative anthropogenic effects and ultimately increasing the long-term sustainability of ecosystems.

Acknowledgments

This study and the Agricultural Production and Environmental Safety Management R & D Project have been funded by the Council of Agriculture, Taiwan. The authors would like to thank Yung-Kai Kuan and Jason Yu for leading the Geographic Information Technology (GIT) company team in collaboration with the team of National Taiwan University. The authors thank Wei-Chih Lin and Jason Yu for drawing figures.

Author Contributions

The scope of this study was developed by Tsun-Kuo Chang, Yu-Pin Lin and Chihhao Fan. The system was developed by the project team. The first manuscript draft was written by Yu-Pin Lin and was substantially revised by Yu-Pin Lin, Johnathen Anthony, Joy R. Petway, Tsun-Kuo Chang, Chihhao Fan, Wan-Yu Lien, Chiu-Ping Liang, and Yi-Fong Ho.

Conflicts of Interest

The authors declare no conflict of interest.

References

  1. Gouveia, C.; Fonseca, A. New approaches to environmental monitoring: The use of ICT to explore volunteered geographic information. GeoJournal 2008, 72, 185–197. [Google Scholar] [CrossRef]
  2. Schimak, G.; Rizzoli, A.E.; Watson, K. Sensors and the environment—Modelling & ICT challenges. Environ. Model. Softw. 2010, 25, 975–976. [Google Scholar]
  3. Klug, H.; Kmoch, A. Operationalizing environmental indicators for real time multi-purpose decision making and action support. Ecol. Model. 2015, 295, 66–74. [Google Scholar] [CrossRef]
  4. Aqeel-ur-Rehman Abbasi, A.Z.; Islam, N.; Shaikh, Z.A. A review of wireless sensors and networks’ applications in agriculture. Comput. Stand. Interfaces 2014, 36, 263–270. [Google Scholar] [CrossRef]
  5. Cardell-Oliver, R.; Smettem, K.; Kranz, M.; Mayer, K. Field Testing a Wireless Sensor Network for Reactive Environmental Monitoring. In Proceedings of the 2004 IEEE Intelligent Sensors, Sensor Networks and Information Processing Conference, Melbourne, Australia, 14–17 December 2004; pp. 7–12.
  6. Řezník, T.; Charvát, K.; Lukas, V.; Charvát, K., Jr.; Horáková, Š.; Kepka, M. Open Data Model for (Precision) Agriculture Applications and Agricultural Pollution Monitoring. In Proceedings of the EnviroInfo and ICT for Sustainability—ACSR Advances in Computer Science Research, Copenhagen, Denmark, 7–9 September 2015; p. 22.
  7. Andreopoulou, Z. Green Informatics: ICT for green and Sustainability. Agrárinform. J. Agric. Inform. 2012, 3, 1–8. [Google Scholar] [CrossRef]
  8. Gouveia, C.; Fonseca, A.; Câmara, A.; Ferreira, F. Promoting the use of environmental data collected by concerned citizens through information and communication technologies. J. Environ. Manag. 2004, 71, 135–154. [Google Scholar] [CrossRef] [PubMed]
  9. Opara, L.U. Traceability in agriculture and food supply chain: A review of basic concepts, technological implications, and future prospects. J. Food Agric. Environ. 2003, 1, 101–106. [Google Scholar]
  10. Yoshida, K.; Tanaka, K.; Hariya, R.; Azechi, I.; Iida, T.; Maeda, S.; Kuroda, H. Contribution of ICT monitoring system in agricultural water management and environmental conservation. In Serviceology for Designing the Future; Springer: Tokyo, Japan, 2016; pp. 359–369. [Google Scholar]
  11. Mancuso, M.; Bustaffa, F. A Wireless Sensors Network for Monitoring Environmental Variables in a Tomato Greenhouse. In Proceedings of the IEEE International Workshop on Factory Communication Systems, Torino, Italy, 27 June 2006; pp. 107–110.
  12. Rao, N.H. A framework for implementing information and communication technologies in agricultural development in India. Technol. Forecast. Soc. Chang. 2007, 74, 491–518. [Google Scholar] [CrossRef]
  13. Reddy, P.K.; Ramaraju, G.V.; Reddy, G.S. Syamasundar eSagu™: A Data Warehouse Enabled Personalized Agricultural Advisory System. In Proceedings of the 2007 ACM SIGMOD International Conference on Management of Data, Beijing, China, 11–14 June 2007; ACM: New York, NY, USA, 2007; pp. 910–914. [Google Scholar]
  14. Jiang, P.; Xia, H.; He, Z.; Wang, Z. Design of a water environment monitoring system based on wireless sensor networks. Sensors 2009, 9, 6411–6434. [Google Scholar] [CrossRef] [PubMed]
  15. Adil, A.; Badarla, V.; Plappally, A.K.; Bhandari, R.; Sankhla, P.C. Development of Affordable ICT Solutions for Water Conservation in Agriculture. In Proceedings of the 2015 7th International Conference on Communication Systems and Networks (COMSNETS), Bangalore, India, 6–10 January 2015; pp. 1–6.
  16. Bartlett, A.C.; Andales, A.A.; Arabi, M.; Bauder, T.A. A smartphone app to extend use of a cloud-based irrigation scheduling tool. Comput. Electron. Agric. 2015, 111, 127–130. [Google Scholar] [CrossRef]
  17. Sesma, J.; Molina-Martínez, J.M.; Cavas-Martínez, F.; Fernández-Pacheco, D.G. A mobile application to calculate optimum drip irrigation laterals. Agric. Water Manag. 2015, 151, 13–18. [Google Scholar] [CrossRef]
  18. Pulido-Calvo, I.; Montesinos, P.; Roldán, J.; Ruiz-Navarro, F. Linear regressions and neural approaches to water demand forecasting in irrigation districts with telemetry systems. Biosyst. Eng. 2007, 97, 283–293. [Google Scholar] [CrossRef]
  19. Jagannathan, S.; Priyatharshini, R. Smart Farming System Using Sensors for Agricultural Task Automation. In Proceedings of the IEEE Technological Innovation in ICT for Agriculture and Rural Development (TIAR), Chennai, India, 10–12 July 2015; pp. 49–53.
  20. Perea, R.G.; García, I.F.; Arroyo, M.M.; Díaz, J.R.; Poyato, E.C.; Montesinos, P. Multiplatform application for precision irrigation scheduling in strawberries. Agric. Water Manag. 2016. [Google Scholar] [CrossRef]
  21. Lin, W.C.; Lin, Y.P.; Wang, Y.C. A decision-making approach for delineating sites which are potentially contaminated by heavy metals via joint simulation. Environ. Pollut. 2016, 211, 98–110. [Google Scholar] [CrossRef] [PubMed]
  22. Lin, Y.P.; Cheng, B.Y.; Shyu, G.S.; Chang, T.K. Combining a finite mixture distribution model with indicator kriging to delineate and map the spatial patterns of soil heavy metal pollution in Chunghua County, central Taiwan. Environ. Pollut. 2010, 158, 235–244. [Google Scholar] [CrossRef] [PubMed]
  23. Nemerow, N.L. Stream, Lake, Estuary, and Ocean Pollution; John Wiley & Sons Inc.: Hoboken, NJ, USA, 1991. [Google Scholar]
  24. Chen, H.; Teng, Y.; Lu, S.; Wang, Y.; Wang, J. Contamination features and health risk of soil heavy metals in China. Sci. Total Environ. 2015, 512, 143–153. [Google Scholar] [CrossRef] [PubMed]
  25. Zhou, J.; Feng, K.; Pei, Z.; Lu, M. Pollution assessment and spatial variation of soil heavy metals in Lixia River Region of Eastern China. J. Soils Sediments 2016, 16, 748–755. [Google Scholar] [CrossRef]
  26. Council of Agriculture. Evaluation Directions of Irrigation Water Quality; Council of Agriculture: Taipei, Taiwan, 2016.
  27. Hill, D.J.; Minsker, B.S. Anomaly detection in streaming environmental sensor data: A data-driven modeling approach. Environ. Model. Softw. 2010, 25, 1014–1022. [Google Scholar] [CrossRef]
  28. Radu, L.D. Determinants of Green ICT Adoption in Organizations: A Theoretical Perspective. Sustainability 2016, 8, 731. [Google Scholar] [CrossRef]
  29. Klimova, A.; Rondeau, E.; Andersson, K.; Porras, J.; Rybin, A.; Zaslavsky, A. An international Master’s program in green ICT as a contribution to sustainable development. J. Clean. Prod. 2016, 135, 223–239. [Google Scholar] [CrossRef]
  30. De Luis, M.M.; Cruz, A.J.A.; Arcia, A.V.U.; Márquez, C.Y. Green Information Technology influence on car owners’ behavior. Comput. Hum. Behav. 2015, 51, 792–802. [Google Scholar] [CrossRef]
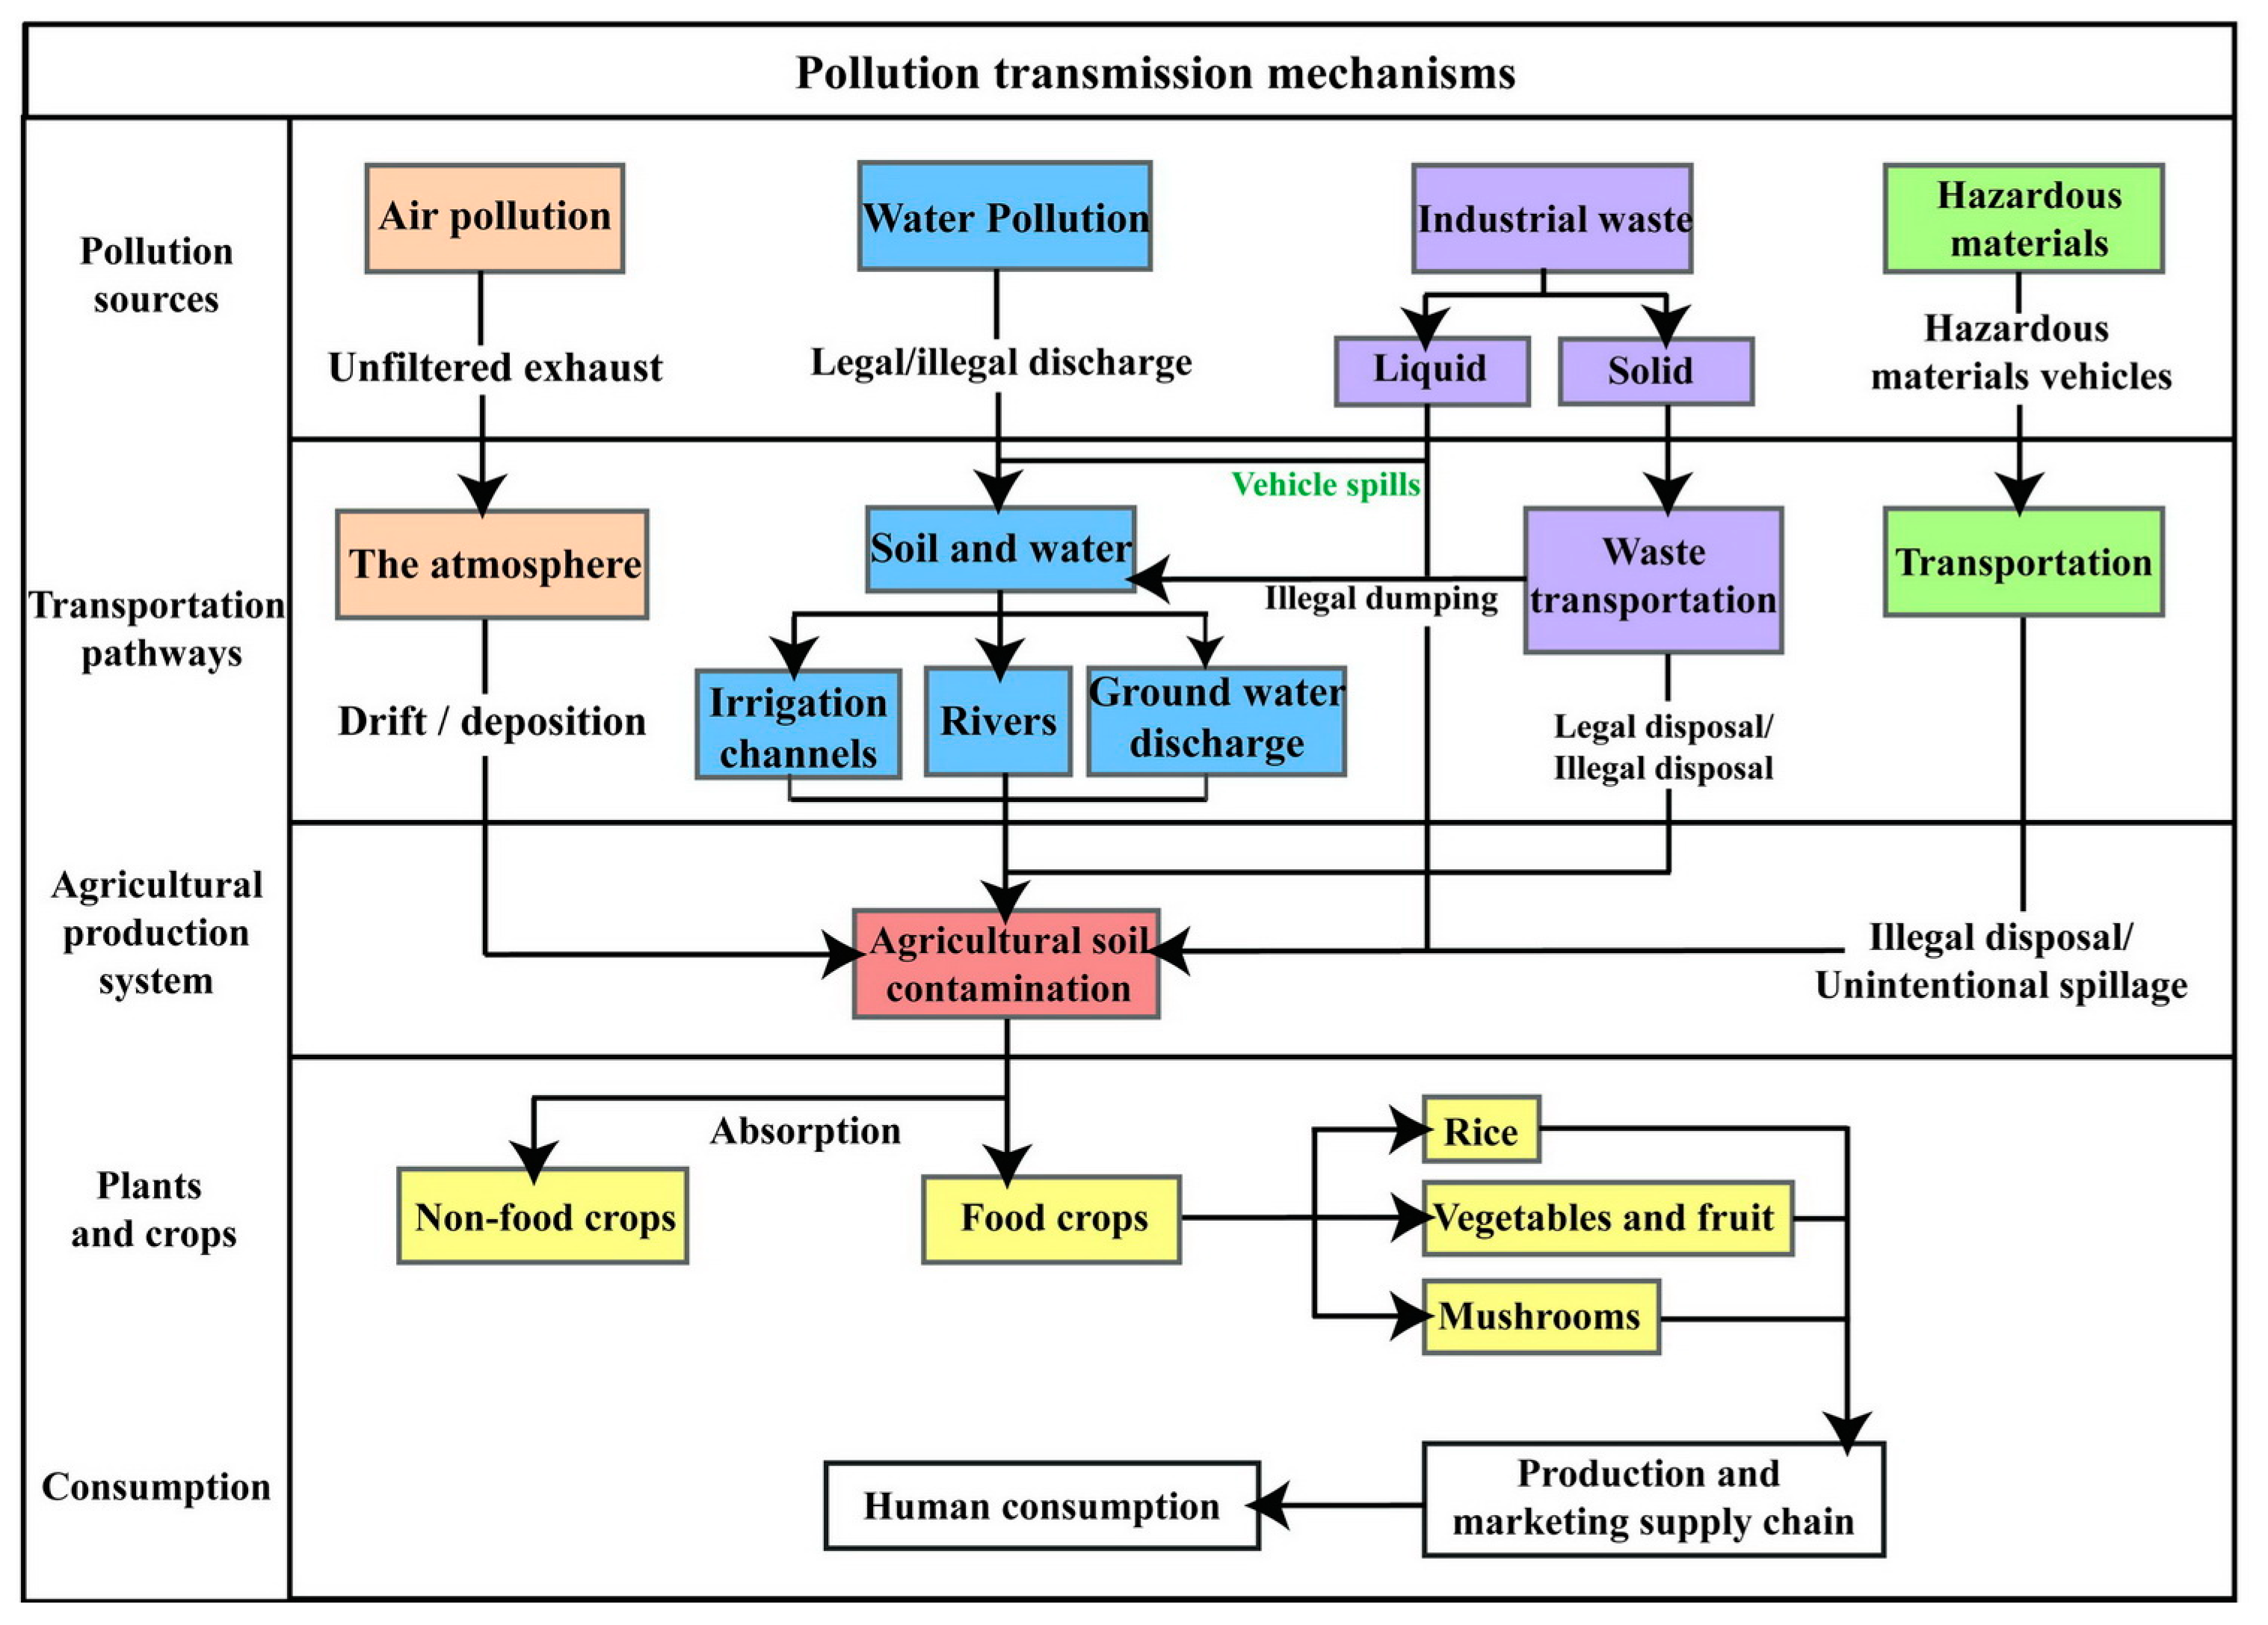
Figure 1. Pollution transmission mechanisms in agricultural environments in Taiwan.
Environments 04 00006 g001
Figure 2. The distribution of the pilot study area.
Environments 04 00006 g002
Figure 3. Conceptual framework of the agricultural environmental protection system.
Environments 04 00006 g003
Figure 4. Interconnections of the cloud system, database, platforms, mobile devices, and the mobile research vehicle. MOI: Ministry of the Interior; EPA: Environmental Protection Agency; COA: Council of Agriculture Executive Yuan; MOHW: Ministry of Health and Welfare. EC: Electrical Conductivity; CCTV: Closed-Circuit Television; GIS: Geographical Information System.
Environments 04 00006 g004
Figure 5. Map of monitoring stations, samples, and locations of water gates within the current agricultural environment protection system, along with the relative contamination risk of different areas in the pilot area (green low, yellow medium).
Environments 04 00006 g005
Figure 6. An example of classification results using the hierarchical management strategy in the pilot area. (red represents hazardous areas, yellow represents high alert areas and green represents safe areas). PN: Nemerow Pollution Index; IWQI: Irrigation Water Quality Index.
Environments 04 00006 g006
Table 1. Agricultural environmental key issues and adaptation strategies and technologies.
Agricultural EnvironmentKey Management IssueAdaptation Strategies and Technologies
Water ManagementIf classification is not implemented, it is difficult to maintain environmental and production safety standardsHierarchical management of agricultural and environmental water resources
Irrigation water qualityChannel pollutant transmission difficult to monitorCreate an agricultural irrigation water management center and implement heavy metal irrigation monitoring techniques
SedimentHeavy metal sediments can become exposed, thereby polluting areas for a second timeDevelop a pollutant mobility model, establish a water body carrying capacity
Agricultural SoilThe effectiveness of contaminated soil remediation is limitedIntegrate pollution management subsidy mechanisms
CropsHorticultural techniques are not being used in the safe management of cropsEstablish crop safety management and cultivation techniques
ProductionThere is a lack of environmental data concerning agricultural productionIntegrate environmental resources, increase traceability of products and associated value
Table 2. Irrigation water quality grade.
Channel IWQI Range100–50<50> Regulations of Heavy Metals
Irrigation water quality gradeIIIIII
Water Qaulitysafehazardouscontaminated
Irrigation Water Quality Index (IWQI).