Article

Source–Sink Relationships and Environmental Risks of Surface Soil Heavy Metals and Metalloids: Multi-Media Monitoring in a Southwest China County

1
School of Geographic Sciences, Hebei Normal University, Shijiazhuang 050024, China
2
The 4th Geological Brigade of Sichuan, Chengdu 611130, China
3
Xinjiang Uyghur Autonomous Region Geological Environment Monitoring Research Institute, Urumqi 830099, China
4
Institute of Mineral Resources, Chinese Academy of Geological Sciences, Beijing 100037, China
5
School of Environment, Tsinghua University, Beijing 100084, China
6
College of Mining Engineering, North China University of Science and Technology, Tangshan 063210, China
*
Author to whom correspondence should be addressed.
These authors contributed equally to this work.
Environments 2026, 13(9), 487; https://doi.org/10.3390/environments13090487
Submission received: 29 May 2026 / Revised: 27 August 2026 / Accepted: 28 August 2026 / Published: 31 August 2026
(This article belongs to the Section Environmental Monitoring and Management)

Abstract

The pollution of soil by potentially toxic elements in industrial–agricultural transition zones threatens global food security and public health owing to their persistence and bioaccumulation. This study focused on Miyi County, Sichuan (China), a typical region with intensive vanadium–titanium magnetite mining and modern agriculture, and systematically analyzed eight heavy metals and metalloids (Cd, Hg, As, Pb, Cr, Cu, Zn, and Ni) across the categories of atmospheric deposition, irrigation water, agricultural inputs, and soil–crop systems. A rigorous four-stage full-chain diagnosis (concentration–load–ecology–health) was executed to evaluate pollution levels and pathways. The single-factor pollution index identified cadmium (Cd) as the primary pollutant, exhibiting a maximum index of 32.63. The Håkanson potential ecological risk index (RI) demonstrated that Cd was the absolute dominant contributor, reaching a catastrophic single-element risk factor (Ei) of 2191.8 and contributing over 70% to the comprehensive ecological risk. Spatially, soils displayed a distinct point-source cluster diffusion pattern: the northern metallurgical zone was dominated by a Cr-Zn-Cu-Ni industrial assemblage, while the southern zone was enriched in Cd, Pb, As, and Hg. Positive matrix factorization (PMF) source apportionment quantitatively demonstrated that industrial emissions via atmospheric deposition were the primary driver, contributing 55–75% of the total soil exogenous inputs, while agricultural sources (livestock manure and legacy arsenic pesticides) exacerbated localized accumulation. While overlying irrigation water remained safe, channel sediments acted as historical pollution sinks. The human health risk model revealed that children in industrial core areas faced unacceptable carcinogenic hazards, with a lifetime carcinogenic risk (LCR) reaching 5.6 × 10⁻⁴. These highly specific multi-media findings support a macro spatial risk zoning and source interception strategy to decouple economic growth from regional food safety degradation in global transition economies.

1. Introduction

Heavy metal and metalloid contamination of soil in industrial–agricultural transition zones threatens global food security and public health owing to their persistence and bioaccumulation [1]. Even at low concentrations, toxic elements can disrupt soil microbial communities, reduce crop yields, and pose severe neurotoxic or carcinogenic risks to human health [2,3]. In China, rapid industrialization has led to pervasive accumulation in agricultural soils, with cadmium (Cd) identified as a particularly severe regional threat [4,5]. However, this issue is not confined to developing transition economies. Globally, regions with intensive resource extraction coexisting with high-intensity agriculture, such as the Ural industrial region in Russia (dominated by non-ferrous metallurgy and mining impact on soils) [6,7] or the Chernozem region in central Russia (facing heavy chemical input pressures) [8,9] experience similar multi-source contamination stresses. These industrial activities emit fine particulates and acidic/alkaline dusts that redistribute trace elements across regional atmospheric and aquatic watersheds. The environmental capacity and toxicity of these trace elements are governed not only by their total concentrations, but also by their bioavailable fractions, which enable them to displace essential nutrients in biological systems and lead to biomagnification within local food webs [10,11]. Understanding the driving factors and spatiotemporal patterns of toxic elements in multi-media environments is therefore essential for ensuring global food security and public health [12,13,14].
Current research has extensively utilized advanced modeling and monitoring techniques to address these complexities. Source apportionment methods, such as positive matrix factorization (PMF) and receptor simulations, have been effectively applied to distinguish between natural and anthropogenic inputs in diverse regions [15,16]. Furthermore, remote sensing technologies and predictive models like Maxent are increasingly used to monitor contamination over large spatial scales [17,18,19]. Despite these advances, a significant gap remains in understanding the synergistic transfer of metals within the soil–crop–environment continuum in complex industrial–agricultural interfaces. While strategies such as biochar addition or phytoremediation show promise for risk mitigation [20,21], precise management requires a holistic understanding of how specific industrial activities, such as vanadium–titanium smelting, interact with local agricultural practices to influence heavy metal environmental capacity [22,23,24].
Miyi County, located in the Panxi region of southwestern Sichuan Province, provides a representative case study for these challenges. The region features a robust agricultural system that coexists with a massive industrial base dominated by vanadium–titanium steel and nonferrous metal smelting [25,26,27]. To guide this investigation, we propose the following scientific hypotheses. (1) In intense industrial–agricultural transition zones, specific high-intensity industrial point sources (e.g., vanadium–titanium smelting) act as dominant drivers of soil accumulation via atmospheric pathways, creating distinct elemental clusters. (2) Traditional agricultural recycling inputs (e.g., metal-rich livestock manure) and legacy agrochemicals generate localized, synergistic “hotspots” that amplify crop uptake and human health risk vectors beyond natural geological background controls.
Therefore, based on a comprehensive multi-media monitoring framework, this study aims to (1) characterize the spatial distribution and accumulation levels of eight targeted trace elements (Cd, Hg, As, Pb, Cr, Cu, Zn, Ni) in the Quaternary surface cover of Miyi County (China); (2) quantify the precise percentage contributions of industrial, agricultural, and natural geological sources using the EPA PMF 5.0 model; and (3) evaluate the resulting ecological and human health risks using unified multi-pathway models. These findings are intended to provide a generalized, zoning-based strategic paradigm for risk management and sustainable land use in similar industrial-agricultural regions globally [28,29,30,31,32].

2. Materials and Methods

2.1. Overview of Miyi County

Miyi County is located in the southwestern region of Sichuan Province in China, covering a total area of approximately 2153 km2 with a permanent population of approximately 220,000. The region is characterized by a subtropical monsoon climate with an average annual temperature of 19.7 °C and a distinct seasonal rainfall pattern (averaging 1100 mm annually, concentrated primarily in the rainy season from June to October). The local agricultural soils are dominated by red soils and dry-hot valley soils, featuring predominantly silt loam to clay loam textures. Geographically, Miyi lies within the Panxi Rift Valley, a region renowned for its complex hydrogeological conditions and abundant mineral resources, particularly vanadium–titanium magnetite and rich iron–titanium (Fe-Ti) oxide background phases. The Quaternary surface cover in this area is shaped by intense tectonic activity and weathering, providing a unique geochemical background for trace element distribution. Economically, Miyi serves as a representative industrial–agricultural interface: it is a significant national base for nonferrous metal smelting and steel production, while simultaneously supporting a highly developed modern agricultural sector. This coexistence of intensive industrial point sources and traditional agricultural inputs (such as irrigation and fertilization) creates a complex environmental matrix, making it an ideal site for studying the interplay between natural mineralogical backgrounds and anthropogenic disturbances.

2.2. Sampling Design

(1) Sampling unit division and site layout
Based on high-resolution remote sensing imagery, a digital elevation model (DEM), soil type maps, and current land use maps, the entire county was divided into several sampling units according to the principle of representative differentiation. Within each unit, sampling points were established using a systematic random sampling method. First, a regular grid (e.g., 100 m × 100 m) was created. Subsequently, random coordinates were generated within each grid cell, and the final sampling locations were determined after verification using remote sensing imagery and field surveys (Figure 1). The sampling points covered the main types of agricultural land, including cultivated land (paddy fields and dry land), orchards, and tea plantations, while also considering areas surrounding industrial sources, both sides of transportation routes, and clean control zones.
(2) Sample types and quantities
The following types of monitoring sites were established.
Atmospheric Deposition: Atmospheric deposition is a critical pathway through which exogenous heavy metals can enter agroecosystems, and its flux magnitude and elemental composition directly reflect the impact intensity of regional industrial activities on the surrounding environment. A total of 90 monitoring sites (JC1–JC90) were established, comprising 20 long-term background sites (JC1–JC20), 64 sites surrounding industrial and mining pollution sources (JC21–JC84), and 6 sites near transportation pollution sources (JC85–JC90). Dry and wet deposition samples were collected quarterly (monthly during the rainy season) over a period of 1 year and 9 months, resulting in a total of eight sampling events.
Irrigation Water and Sediment: Irrigation water constitutes another primary pathway for heavy metal entry into agricultural soils, and its quality directly governs the immediate risk of soil contamination. A total of 39 monitoring sites (GG1–GG39) were established, comprising 30 zonal monitoring sites (GG1–GG30) and 9 sites surrounding industrial and mining pollution sources (GG31–GG39). Irrigation water was sampled during the irrigation period (twice a year, with an additional sampling during flood season), and sediment was collected simultaneously.
Agricultural Inputs: A total of 20 monitoring sites (NT1–NT20) were established. Fertilizers (straight fertilizers, compound fertilizers, and organic fertilizers) were collected semi-annually, for a total of four sampling events.
Livestock and Poultry Manure: A total of 25 monitoring sites (FW1–FW25) were established, including 20 from smallholder farms (FW1–FW20) and 5 from large-scale breeding farms (FW21–FW25). Sampling was conducted semi-annually, for a total of four events.
Crop Removal: A total of 225 sampling plots (ZW1-1 to ZW75-3) were established, comprising three main crop types per region × three replicate plots of 1 m2 each. Grains and straw were collected during the harvest period twice a year, for a total of four events.
Soil and Crop Synergistic Monitoring: A total of 45 topsoil sites (including 13 profile sites) and 15 clean control sites were established. Topsoil sites were coded TR1–TR45 (with profile sites designated as TRPM5-TRPM43), and clean control sites were coded TRCK1–TRCK15. Topsoil (0–20 cm depth) and corresponding agricultural products were collected once before the completion of the cause investigation.
Intensive Source Tracing Sampling: In areas with excessive pollution levels, such as Qingpi Village, 11 additional soil sites (coded TQ-1 to TQ-11) and 4 irrigation water sites with associated sediment (coded GQ-1 to GQ-4) were established for precise source tracing.
(3) Sample collection and preparation
Sample collection strictly adhered to relevant national technical specifications (e.g., HJ/T 166-2004, NY/T 395-2012, DZ/T 0295-2016). To ensure consistency and transparency, sample collection and preparation for each specific environmental medium were executed as follows.
Atmospheric Deposition: For atmospheric dry and wet deposition, cleaned customized polyethylene dustfall collectors were placed at heights of 8–15 m (or 1–1.5 m above roof platforms) to avoid local ground dust disturbance. Sampling was conducted quarterly during dry seasons and monthly during the rainy season over a total period of 1 year and 9 months. Upon recovery, the total volume of precipitation was recorded, and the collected mixtures were evaporated, concentrated, dried at 105 °C, and weighed to calculate the absolute deposition flux before chemical digestion.
Irrigation Water and Sediment: Irrigation water grab samples were collected during active irrigation periods from major inflow channels using pre-cleaned polyethylene bottles, filtered through 0.45 μm membrane filters, and acidified immediately with trace-metal-grade HNO3 to pH < 2. Bottom sediments were simultaneously collected using a stainless steel grab sampler from the upper 0–5 cm layer of the channel beds, transferred to polyethylene bags, and transported under refrigeration at 4 °C.
Agricultural Inputs and Livestock Manure: Fertilizers (straight, compound, and organic fertilizers) were collected semi-annually directly from local agricultural supply stores and farming households. For livestock and poultry manure, multi-point composite samples (1.0–1.5 kg each) were collected from smallholder farms and large-scale breeding facilities. All solid input samples were thoroughly homogenized in the laboratory before processing.
Crop Systems: Crop samples (grains and straw) were harvested during maturity synchronously with rhizosphere soils. Within each 1 m2 plot, 10–20 individual plants were collected using a diagonal or plum blossom pattern. The grain (edible parts) and straw fractions were separated immediately using stainless steel tools, washed with deionized water to remove surface dust, dried at 105 °C for 30 min for enzyme deactivation, and subsequently dried at 70 °C to a constant weight to record biomass parameters.
Rhizosphere and Surface Soils: Surface soil samples (0–20 cm depth) were collected using a wooden spade via a five-point plum blossom mixing protocol to form a 1.0 kg composite sample. Subsurface profile samples were collected layer by layer using a stainless steel soil drill, reaching depths of 100–150 cm depending on the terrain baseline. Upon arrival at the laboratory, all soil samples were air-dried in a clean, ventilated, dark room, crushed, and passed through 2 mm and 0.15 mm nylon sieves for subsequent physicochemical and total element analysis.

2.3. Laboratory Analysis

To accurately quantify the degree of environmental disturbance and evaluate associated risks, a series of standardized laboratory analyses were conducted on the collected multi-media samples. The monitoring parameters were tailored to each medium: soil and sediment were analyzed for pH, organic matter (OM), and eight heavy metals (Cd, Hg, As, Pb, Cr, Cu, Zn, and Ni), with available Cd additionally measured in topsoil; irrigation water, atmospheric deposition, livestock manure, and agricultural inputs were similarly tested for pH and heavy metal concentrations, alongside medium-specific metrics such as irrigation volume or dustfall. Crop samples (grains and straw) were analyzed for heavy metal content, moisture, and biomass. These analyses focused on identifying total metal concentrations and soil physicochemical properties while maintaining a rigorous quality assurance framework to ensure data integrity. The specific analytical methods and quality control protocols are detailed as follows (Table 1).
Total Heavy Metal Concentrations: Soil and sediment samples were digested using aqua regia or by microwave digestion. Subsequently, Cd, Pb, Cu, Zn, Ni, and Cr were determined by inductively coupled plasma mass spectrometry (ICP-MS, NexlON 350X) (Agilent Technologies, PerkinElmer, Santa Clara, CA, USA). Arsenic and Hg were determined by atomic fluorescence spectrometry (AFS) (Haiguang Instrument Co., Ltd., Beijing, China). Irrigation water samples were filtered through a 0.45 μm membrane filter and then directly analyzed using ICP-MS.
Physicochemical Parameters: Soil pH was measured using the electrode method. Soil organic matter content was determined using the potassium dichromate oxidation-external heating method.
Quality Control and Quality Assessment: Stringent quality control procedures were implemented to ensure data accuracy and reliability. Each batch of samples included method blanks, duplicates, and standard addition recovery tests. In the laboratory, data precision and accuracy were verified using Chinese National Certified Reference Materials (CRMs): GSS-8 and GSS-28 were utilized for soils and sediments, while GBW10011a was utilized for crop matrices. The analytical recovery rates for the targeted elements in these certified reference materials ranged strictly between 95% and 105%, and the duplicate sample analysis maintained a relative standard deviation (RSD) < 10%. A strict chain of custody procedure was maintained throughout.

2.4. Data Risk Assessment

(1) Pollution assessment
Single factor pollution index (Pi), calculated using Equation (1), was used to assess the pollution level.
P i = C i / S i
where C i is the measured concentration of heavy metal i , and S i is its corresponding risk screening value for agricultural land (GB 15618-2018) [33].
Subsequently, the Nemerow comprehensive pollution index ( P N ) is calculated using Equation (2):
P N = ( P i , avg ) 2 + ( P i , max ) 2 2
where P i , a v g and P i , m a x are the average and maximum values of the single factor indices for all evaluated metals, respectively.
Simultaneously, the pollution load index (PLI) is employed, as proposed by Tomlinson et al. [34], to determine enrichment levels based on regional geochemical background values:
PLI = i = 1 n ( C i / C ref , i ) n
where C r e f , i is the background value of heavy metal i in the A-layer soil of Sichuan Province, and n is the number of heavy metal species. Four pollution levels are defined: no pollution (PLI < 1), moderate pollution (1 < PLI < 2), heavy pollution (2 < PLI < 3), and extremely heavy pollution (3 < PLI).
(2) Ecological risk assessment
To address the limitation that chemical concentration indices cannot directly represent biological toxicity, the Håkanson potential ecological risk index ( R I ) is applied. Calculated using Equation (4) [34], this method converts concentration into ecological hazard by assigning toxic response factors to different heavy metals, highlighting the threat posed by highly toxic elements such as Hg and Cd.
RI = E i = ( T i C i / C ref , i )
where T i is the toxic response factor for heavy metal i (Hg = 40, Cd = 30, As = 10, Pb = Cu = Ni = 5, Cr = 2, Zn = 1) [24]. Four categories were classified by RI: low risk (RI < 120), moderate risk (150 ≤ RI < 300), considerable risk (300 ≤ RI < 600), and very high risk (600 ≤ RI).
(3) Human health risk assessment
To link environmental media with human health, the health risk model recommended by the USEPA was adopted [35]. This model calculates the non-carcinogenic hazard quotient ( H Q ) for individual pathways (Equation (5)), the hazard index ( H I ) for combined pathways (Equation (6)), and the lifetime carcinogenic risk ( L C R ) (Equation (7)). Four exposure pathways were considered: oral ingestion, inhalation, dermal contact, and agricultural product intake. Parameters were derived from the Exposure Factors Handbook of Chinese Population and the USEPA database, differentiating between adult and child recipients.
H Q ij = ADD ij / Rf D ij
HI = i j H Q ij
LCR = i A D D i × S F i
where A D D i j is the average daily dose of metal I via pathway j , R f D i j is the corresponding reference dose, and S F i is the cancer slope factor for metal i .
This methodological framework follows the logical progression from individual elements to composite contamination, and from environmental media to human exposure. Through a full-chain diagnosis of concentration–load–ecology–health, it systematically reveals the characteristics, structure, and potential hazards of soil heavy metal pollution.

2.5. Source Apportionment Analysis

A combination of multivariate statistical methods was employed for source identification. Principal component analysis (PCA) and hierarchical cluster analysis were applied to identify potential pollution source types. To quantitatively apportion the source contributions to the soil matrix, the positive matrix factorization (PMF) model (EPA PMF 5.0) was executed following the core non-negative factor optimization algorithm developed by Paatero and Tapper [36]. The uncertainty for each element input was calculated based on the method detection limit (MDL) and the corresponding error fraction to ensure mathematical stability. Geographic Information System (GIS) software (ArcGIS Pro 3.5), coupled with Inverse Distance Weighting (IDW) spatial interpolation, was utilized to generate visual layout maps of pollutants and risks.

3. Results

3.1. Spatial and Flux Characteristics of Atmospheric Deposition

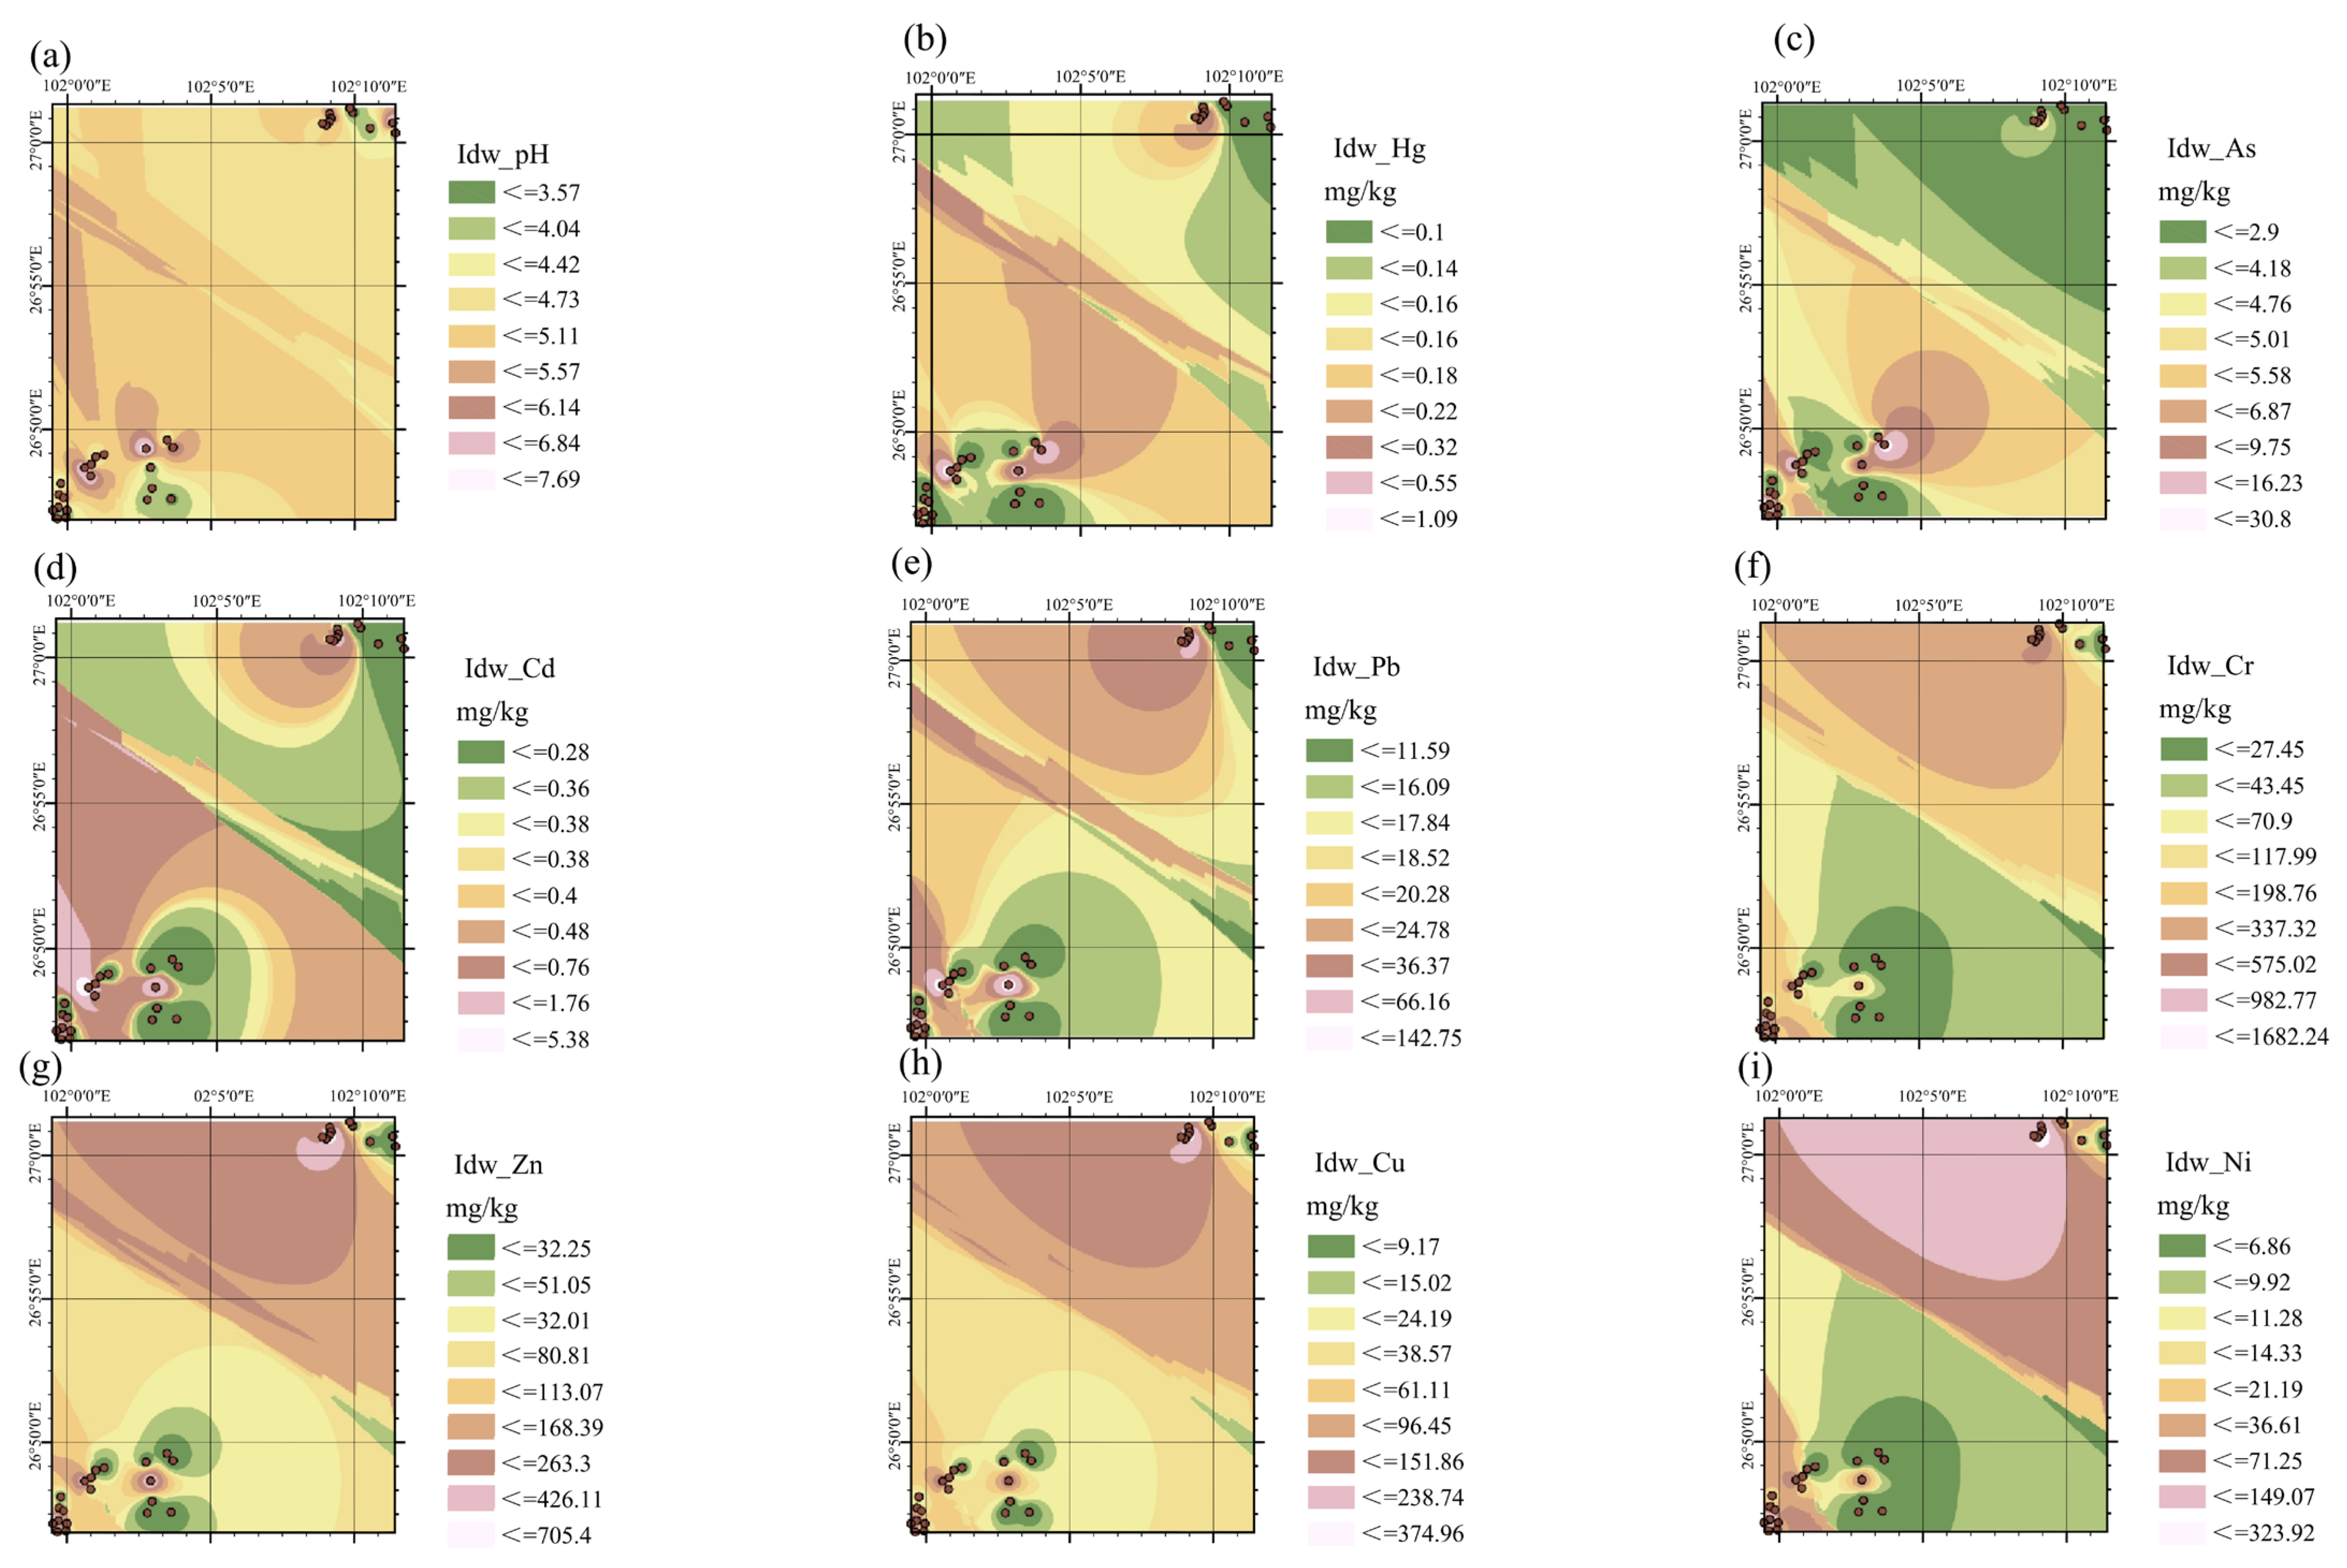
Systematic analysis of the 90 atmospheric deposition monitoring sites across Miyi County (Table S1) revealed a pronounced spatial pattern characterized by a clean background interspersed with highly localized pollution hotspots (Figure 2). Approximately two-thirds of the long-term background sites exhibited trace element concentrations near or below detection limits, showing acidic pH ranges reflecting the natural atmospheric baseline. Conversely, the remaining one-third of the monitoring sites, situated downwind of major industrial zones, displayed dry and wet deposition fluxes spiking by several orders of magnitude. Concurrently, the deposition pH at these contaminated sites increased synchronously to neutral or weakly alkaline ranges (pH 6.8–7.7). Statistical analysis revealed two major deposition clusters: the northern metallurgical cluster (Yonglang Town area) showed mean deposition fluxes of Cr ( 575.0   g h m 2 a 1 ), Zn ( 426.1   g h m 2 a 1 ), Cu ( 151.8   g h m 2 a 1 ), and Ni ( 149.0   g h m 2 a 1 ). The southern mixed cluster (Southern Valleys) exhibited peak concentration fluxes of Cd ( 5.38   g h m 2 a 1 ) and Pb ( 142.7   g h m 2 a 1 ), alongside As ( 30.8   g h m 2 a 1 ) and Hg ( 1.09   g h m 2 a 1 ).

3.2. Trace Element Concentrations in Irrigation Water and Channel Sediments

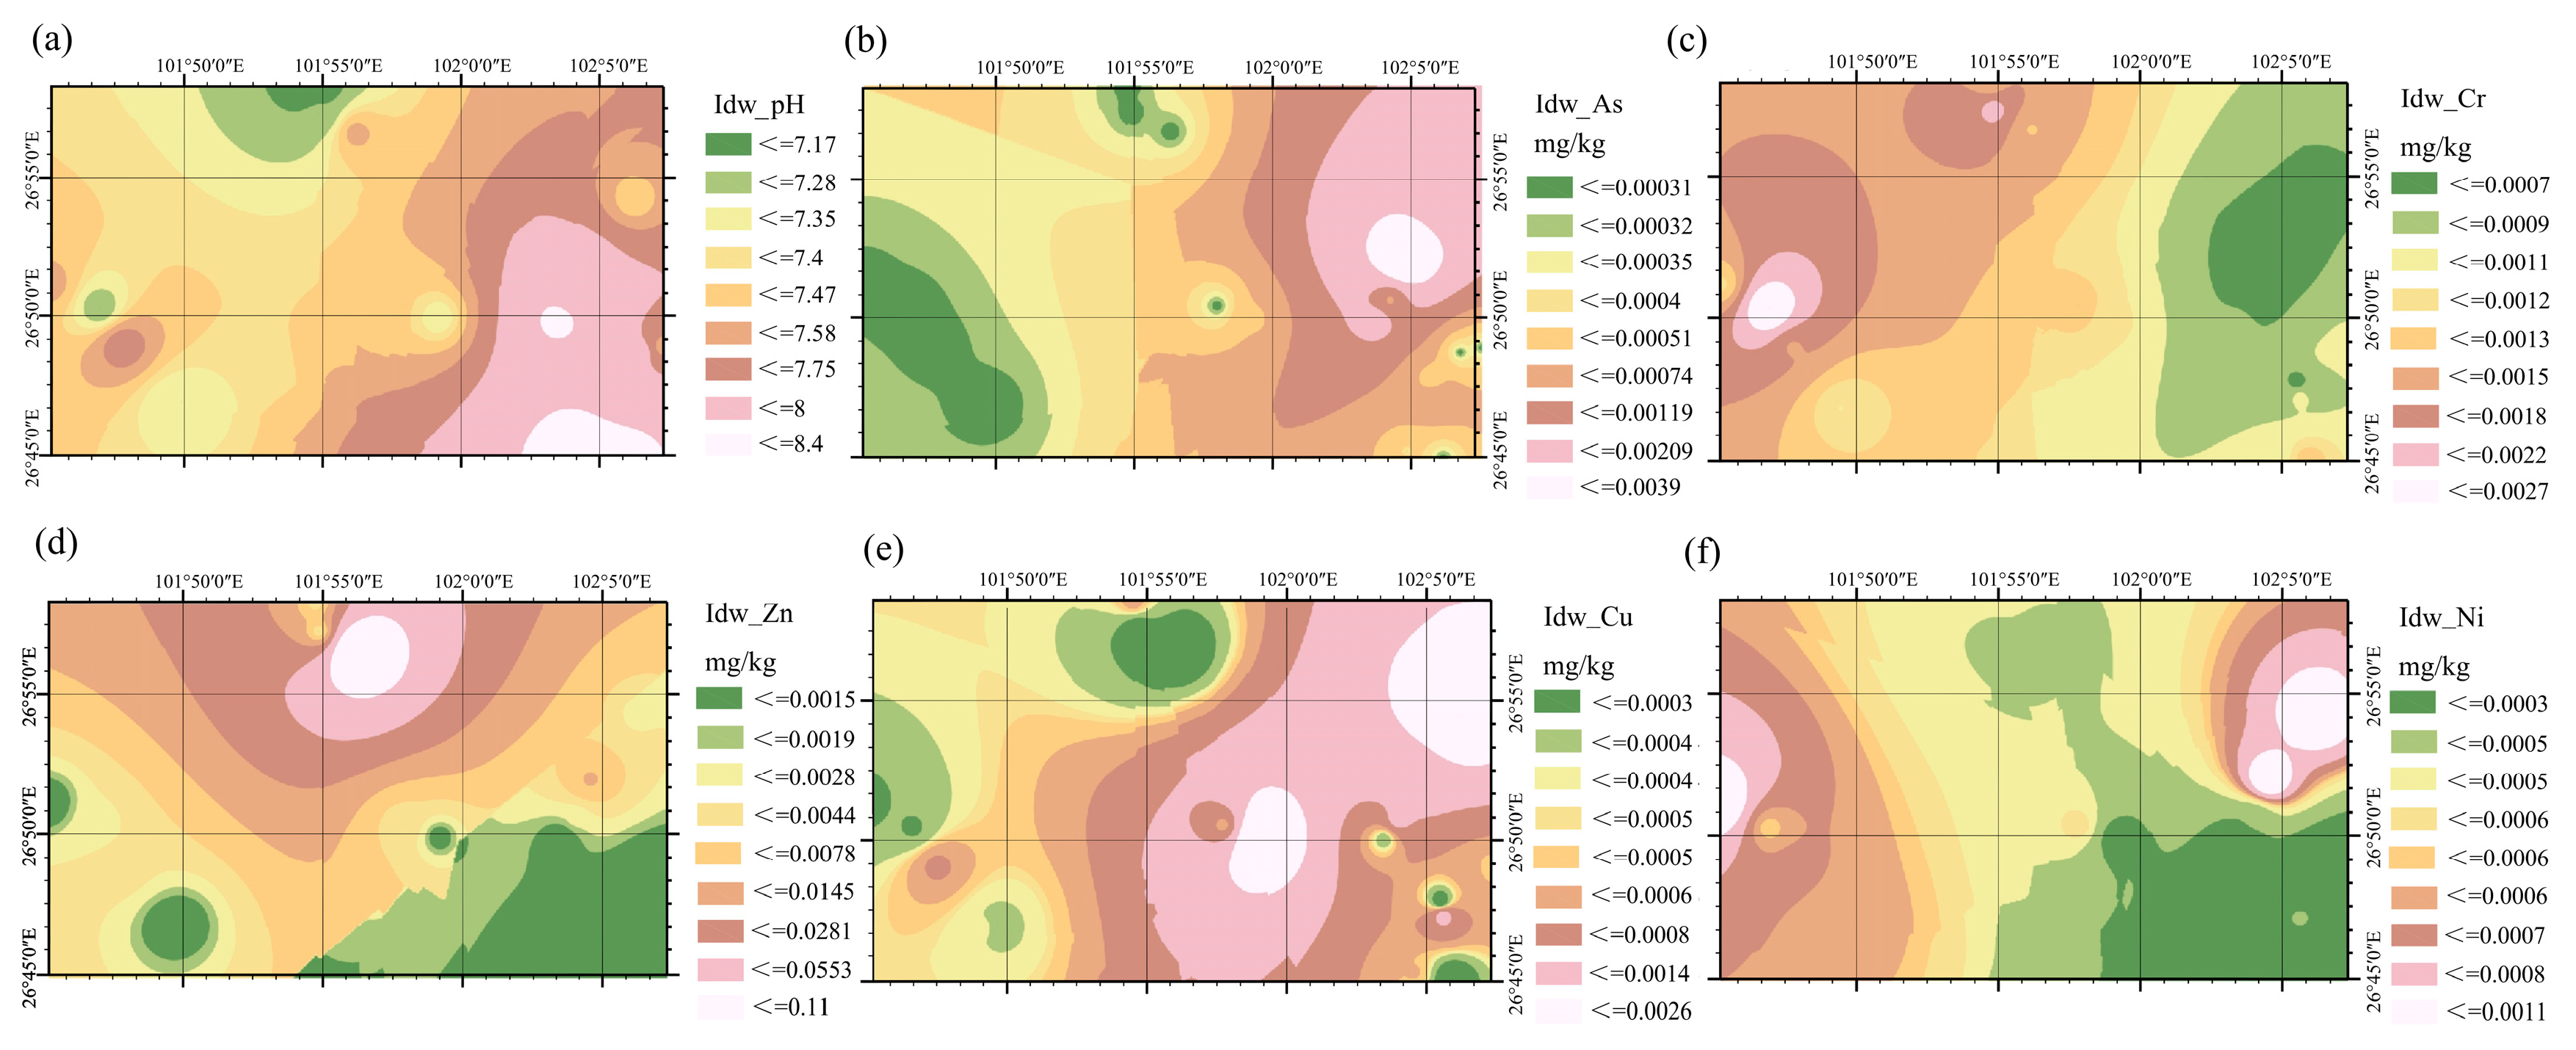
Analysis of the 39 paired irrigation water and sediment monitoring sites demonstrated that the current quality of overlying irrigation water was highly satisfactory (Figure 3). All elemental concentrations fell safely below the thresholds stipulated in the Chinese National Irrigation Water Quality Standard (GB 5084-2021) [37]. The water samples exhibited neutral to weakly alkaline pH values (7.17–8.40). In contrast, underlying channel sediments exhibited substantial element accumulation. Sediment Cd from the Eastern Industrial Channel Belt reached a maximum concentration of 6.33   m g k g 1 , and Zn reached 1188   m g k g 1 . Sediment from the Western Agricultural Channel Belt was enriched in As (up to 5.30   m g k g 1 ) and Cu (up to 72.1   m g k g 1 ).

3.3. Concentration Disparities in Agricultural Inputs and Livestock Manure

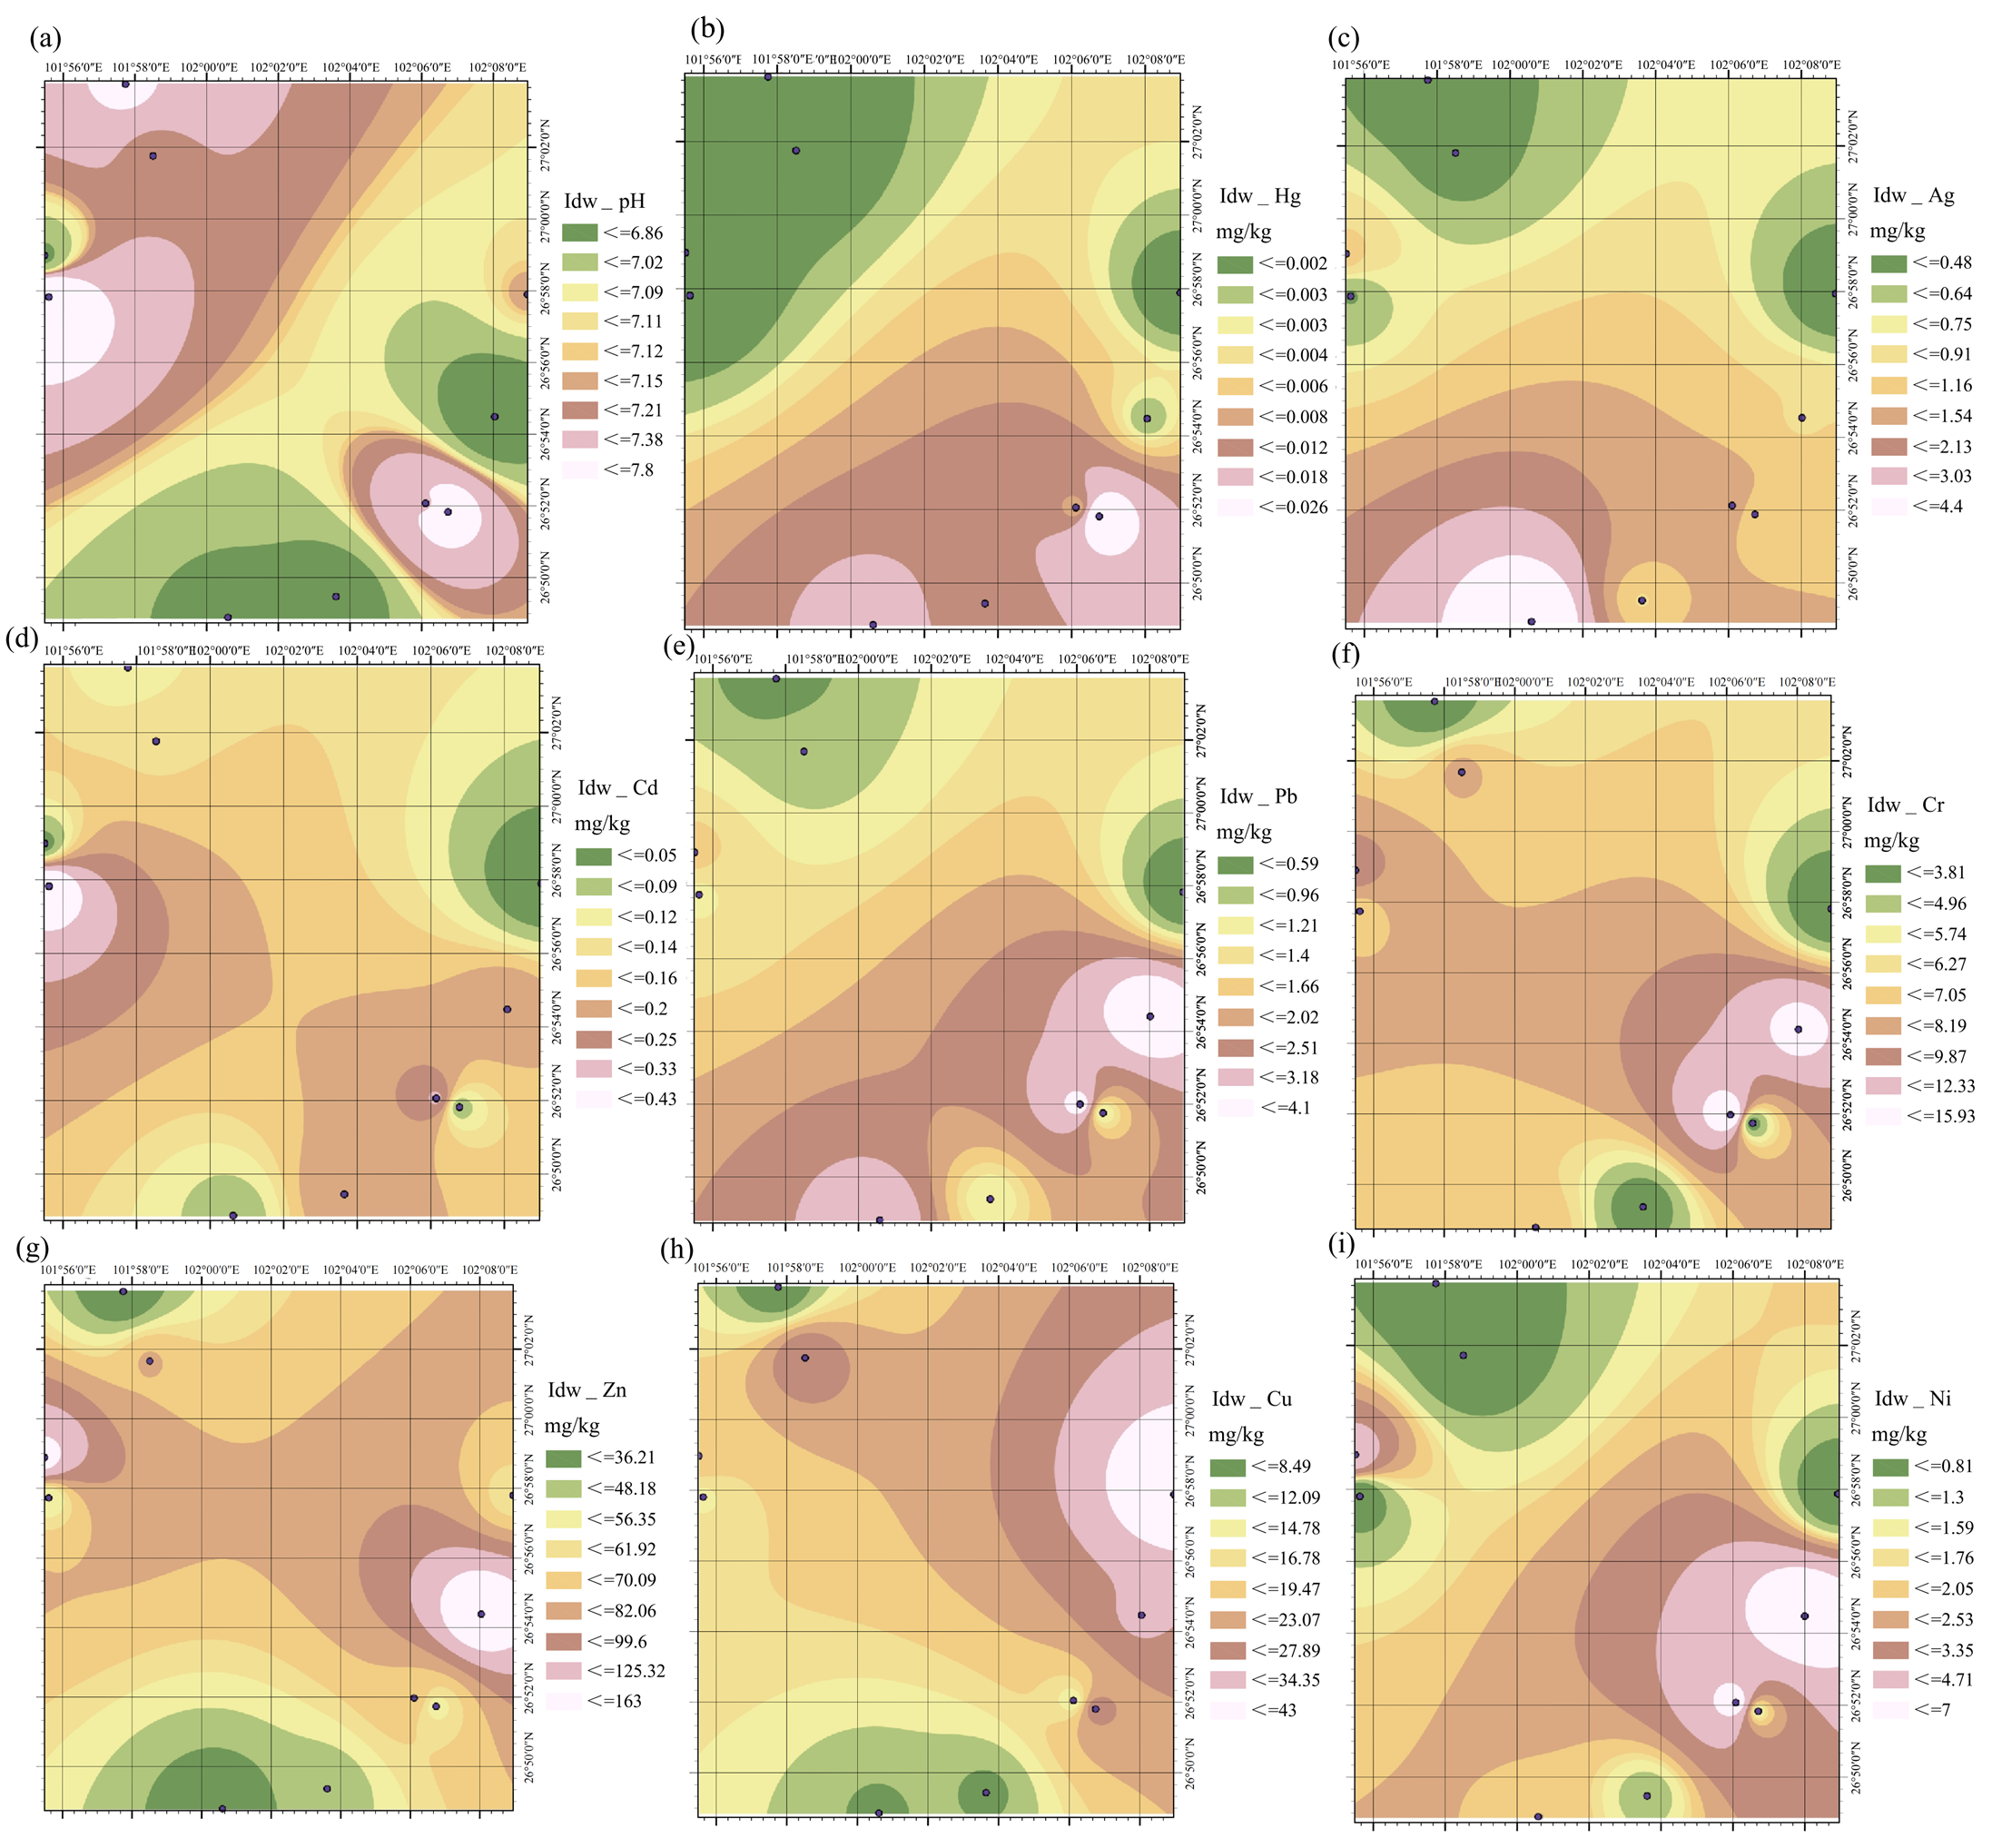
Systematic analysis of 20 conventional fertilizer samples and 25 livestock manure samples identified sharp internal variances and localized anomalies (Figure 4). While conventional nitrogen and phosphorus fertilizers remained within safe limits, three specific input samples exhibited distinct anomalies: one fertilizer sample showed extremely high As content ( 45.0   m g k g 1 ) , and another showed high Cu ( 46.6   m g k g 1 ). In the breeding sector, high concentrations of Cu and Zn were commonly detected in livestock manure, with maximum values reaching 27.33 m g k g 1 and 163.0   m g k g 1 , respectively (Figure 4).

3.4. Heavy Metal Accumulation in Soils and Translocation to Crops

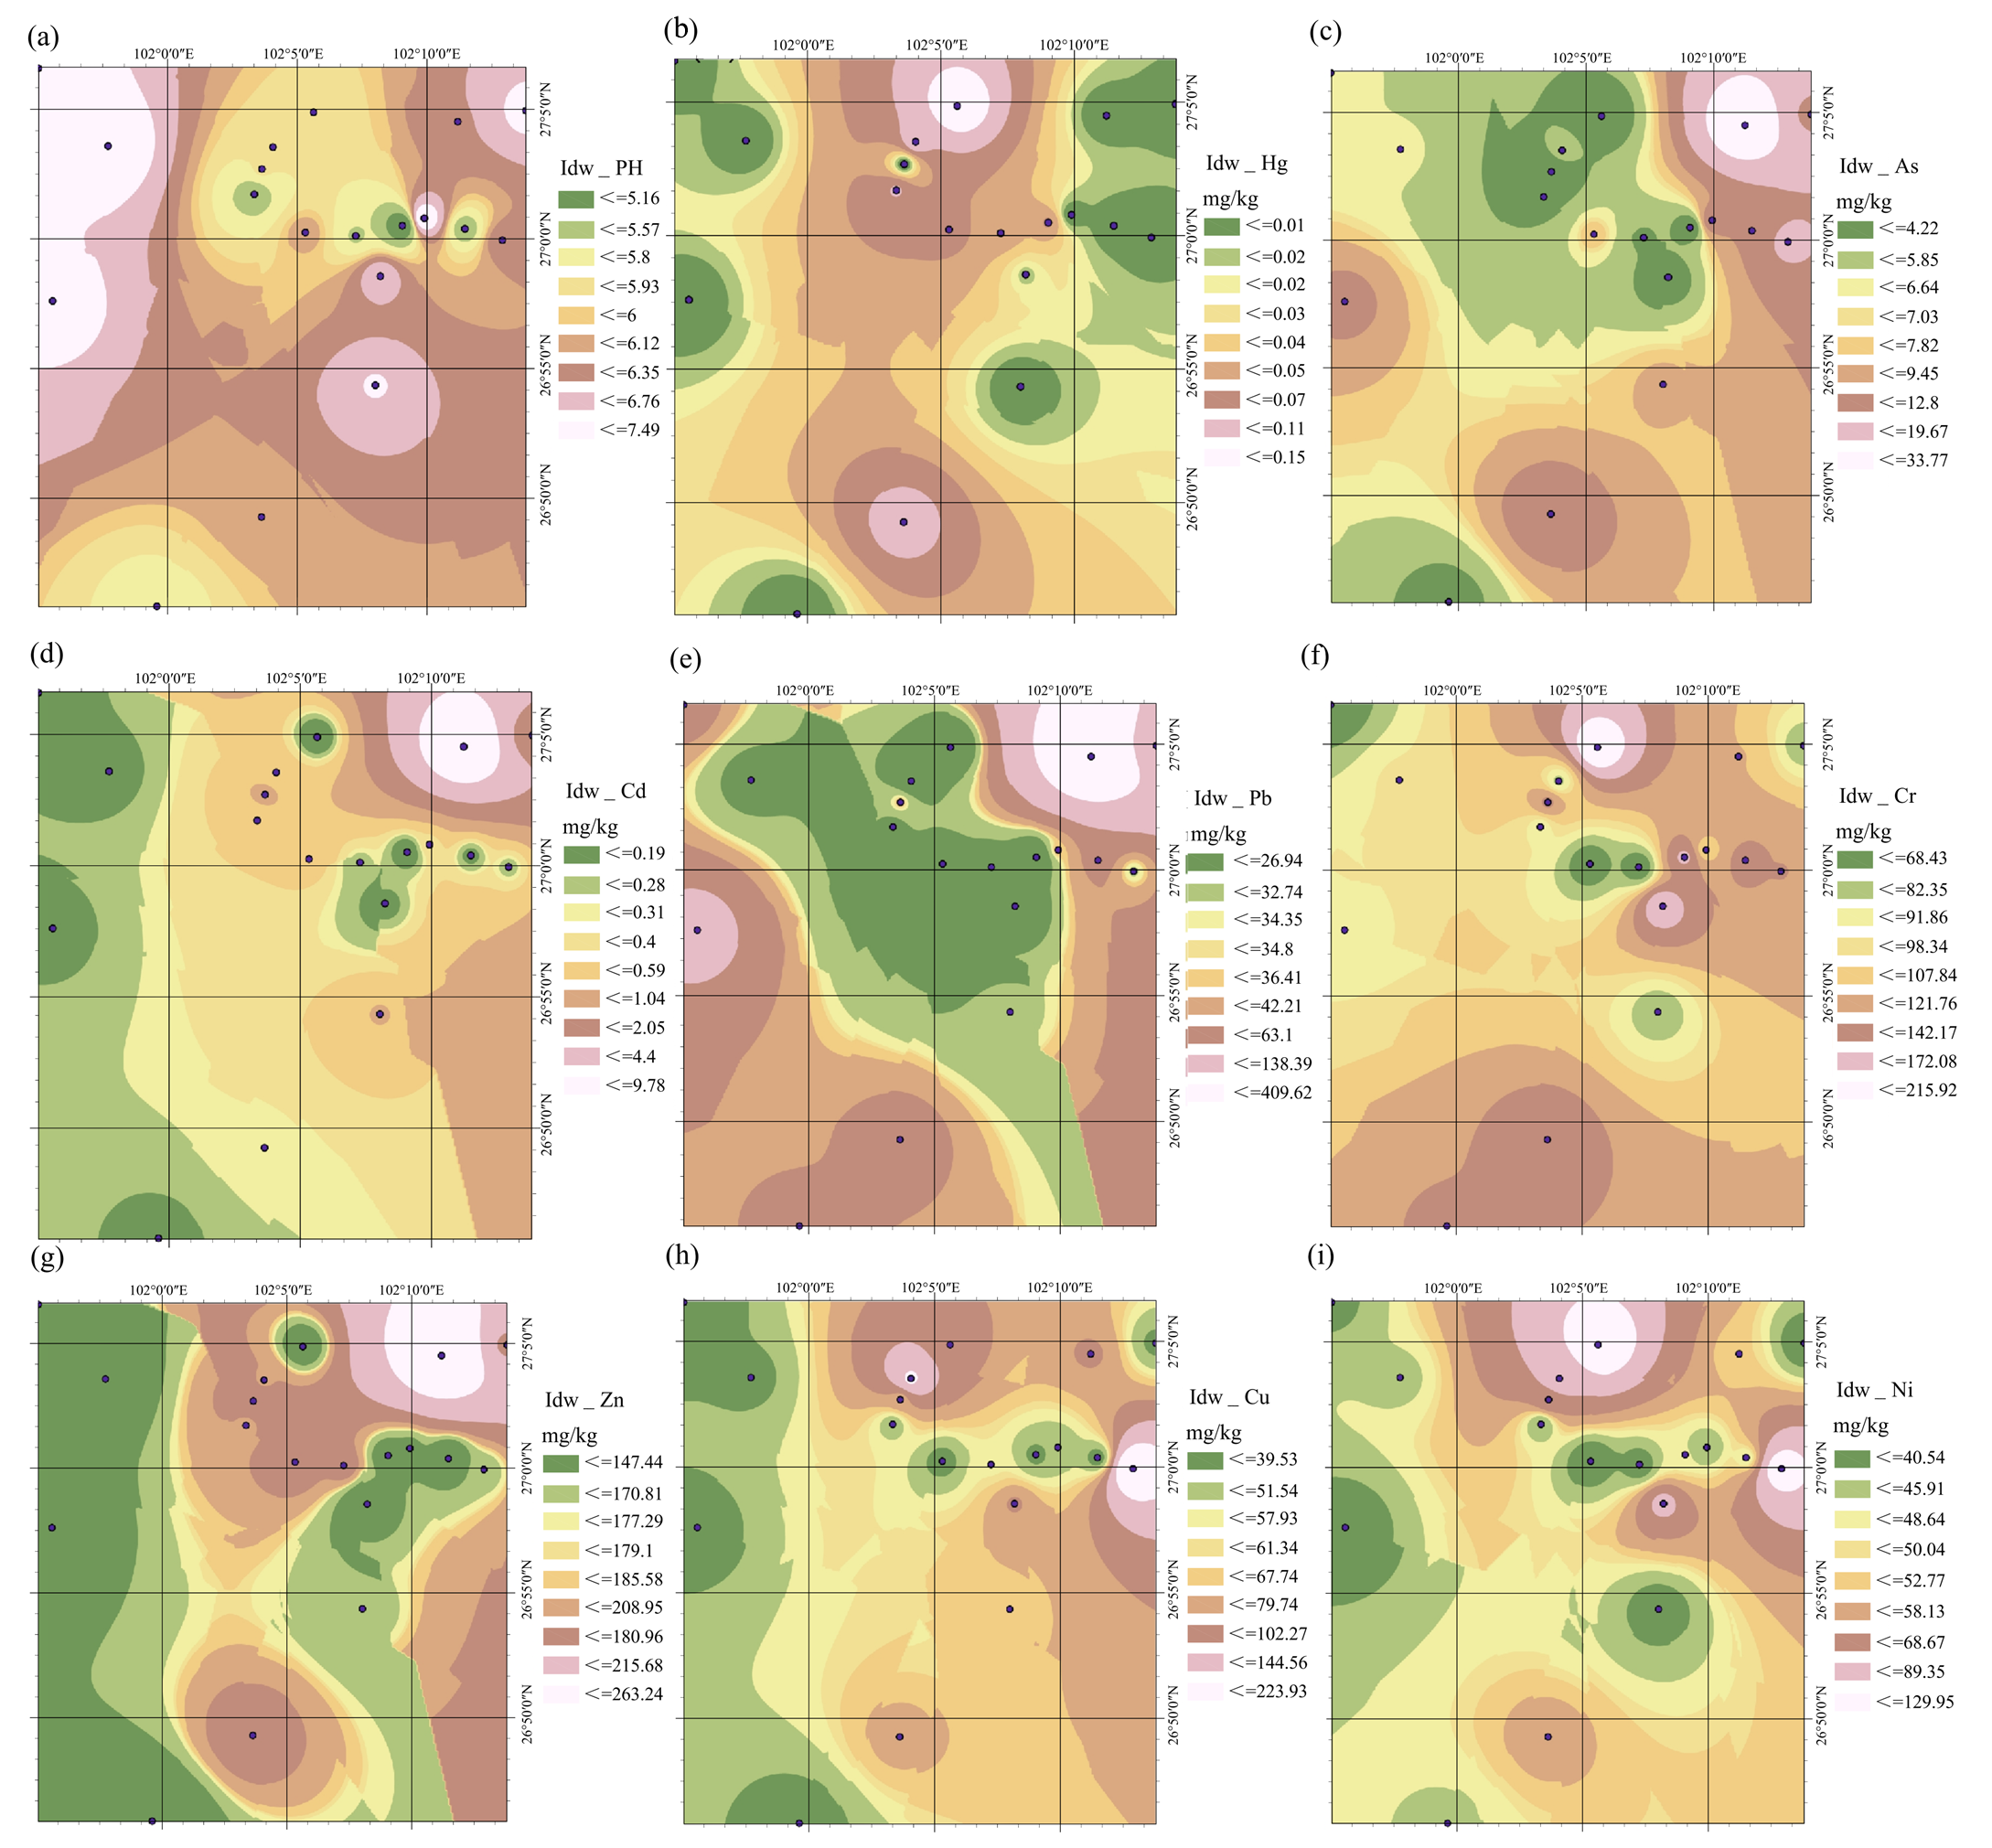
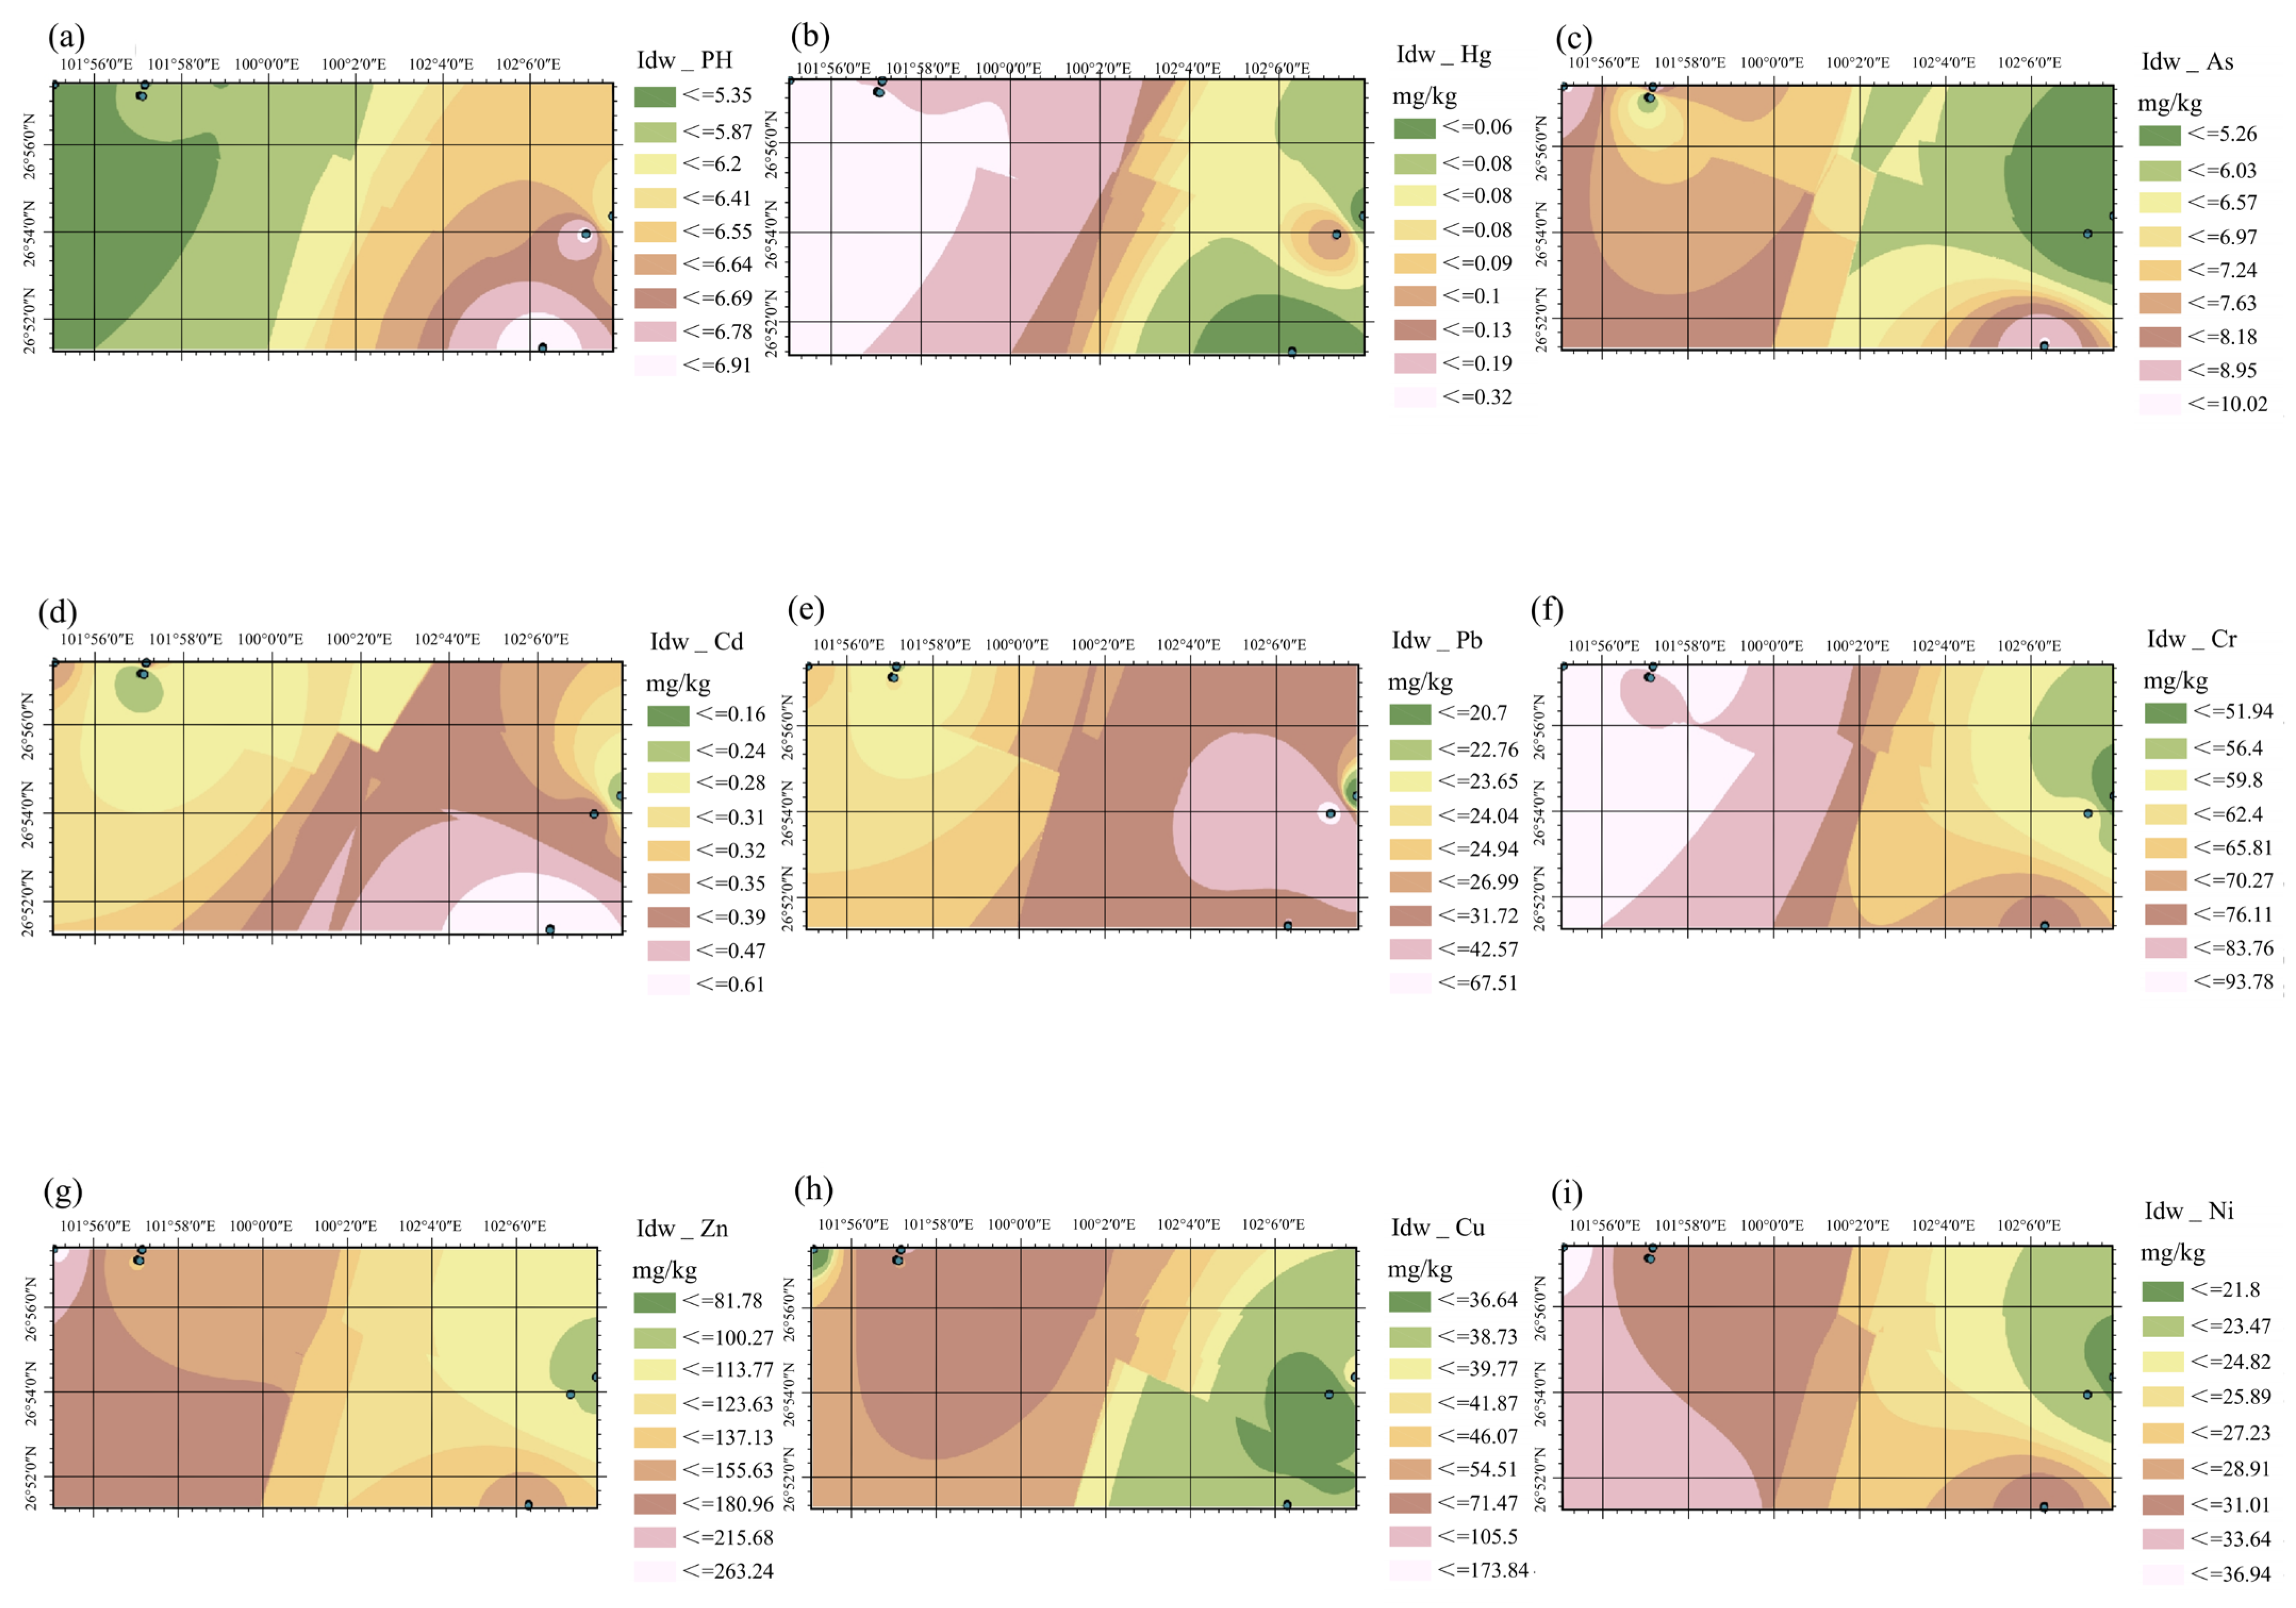
Paired analysis of the 225 crop plots and rhizosphere soils demonstrated a significant positive correlation between soil concentrations and crop tissue accumulation (Figure 5 and Figure 6). However, substantial differences were observed in the translocation capacity of individual elements. Cadmium (Cd) exhibited the highest biological activity and translocation factor. Even in soils with moderate Cd loading, grain Cd concentrations reached 0.14   m g k g 1 . Lead (Pb) and chromium (Cr) were primarily retained within non-edible vegetative tissues (straw), where concentrations were two to three times higher than in the grains. Arsenic (As) exhibited anomalous localized spikes, with grain As concentrations in specific plots reaching 1.28 1.83   m g k g 1 , exceeding the food safety limit.

3.5. Integrated Source Apportionment and Multi-Dimensional Risks

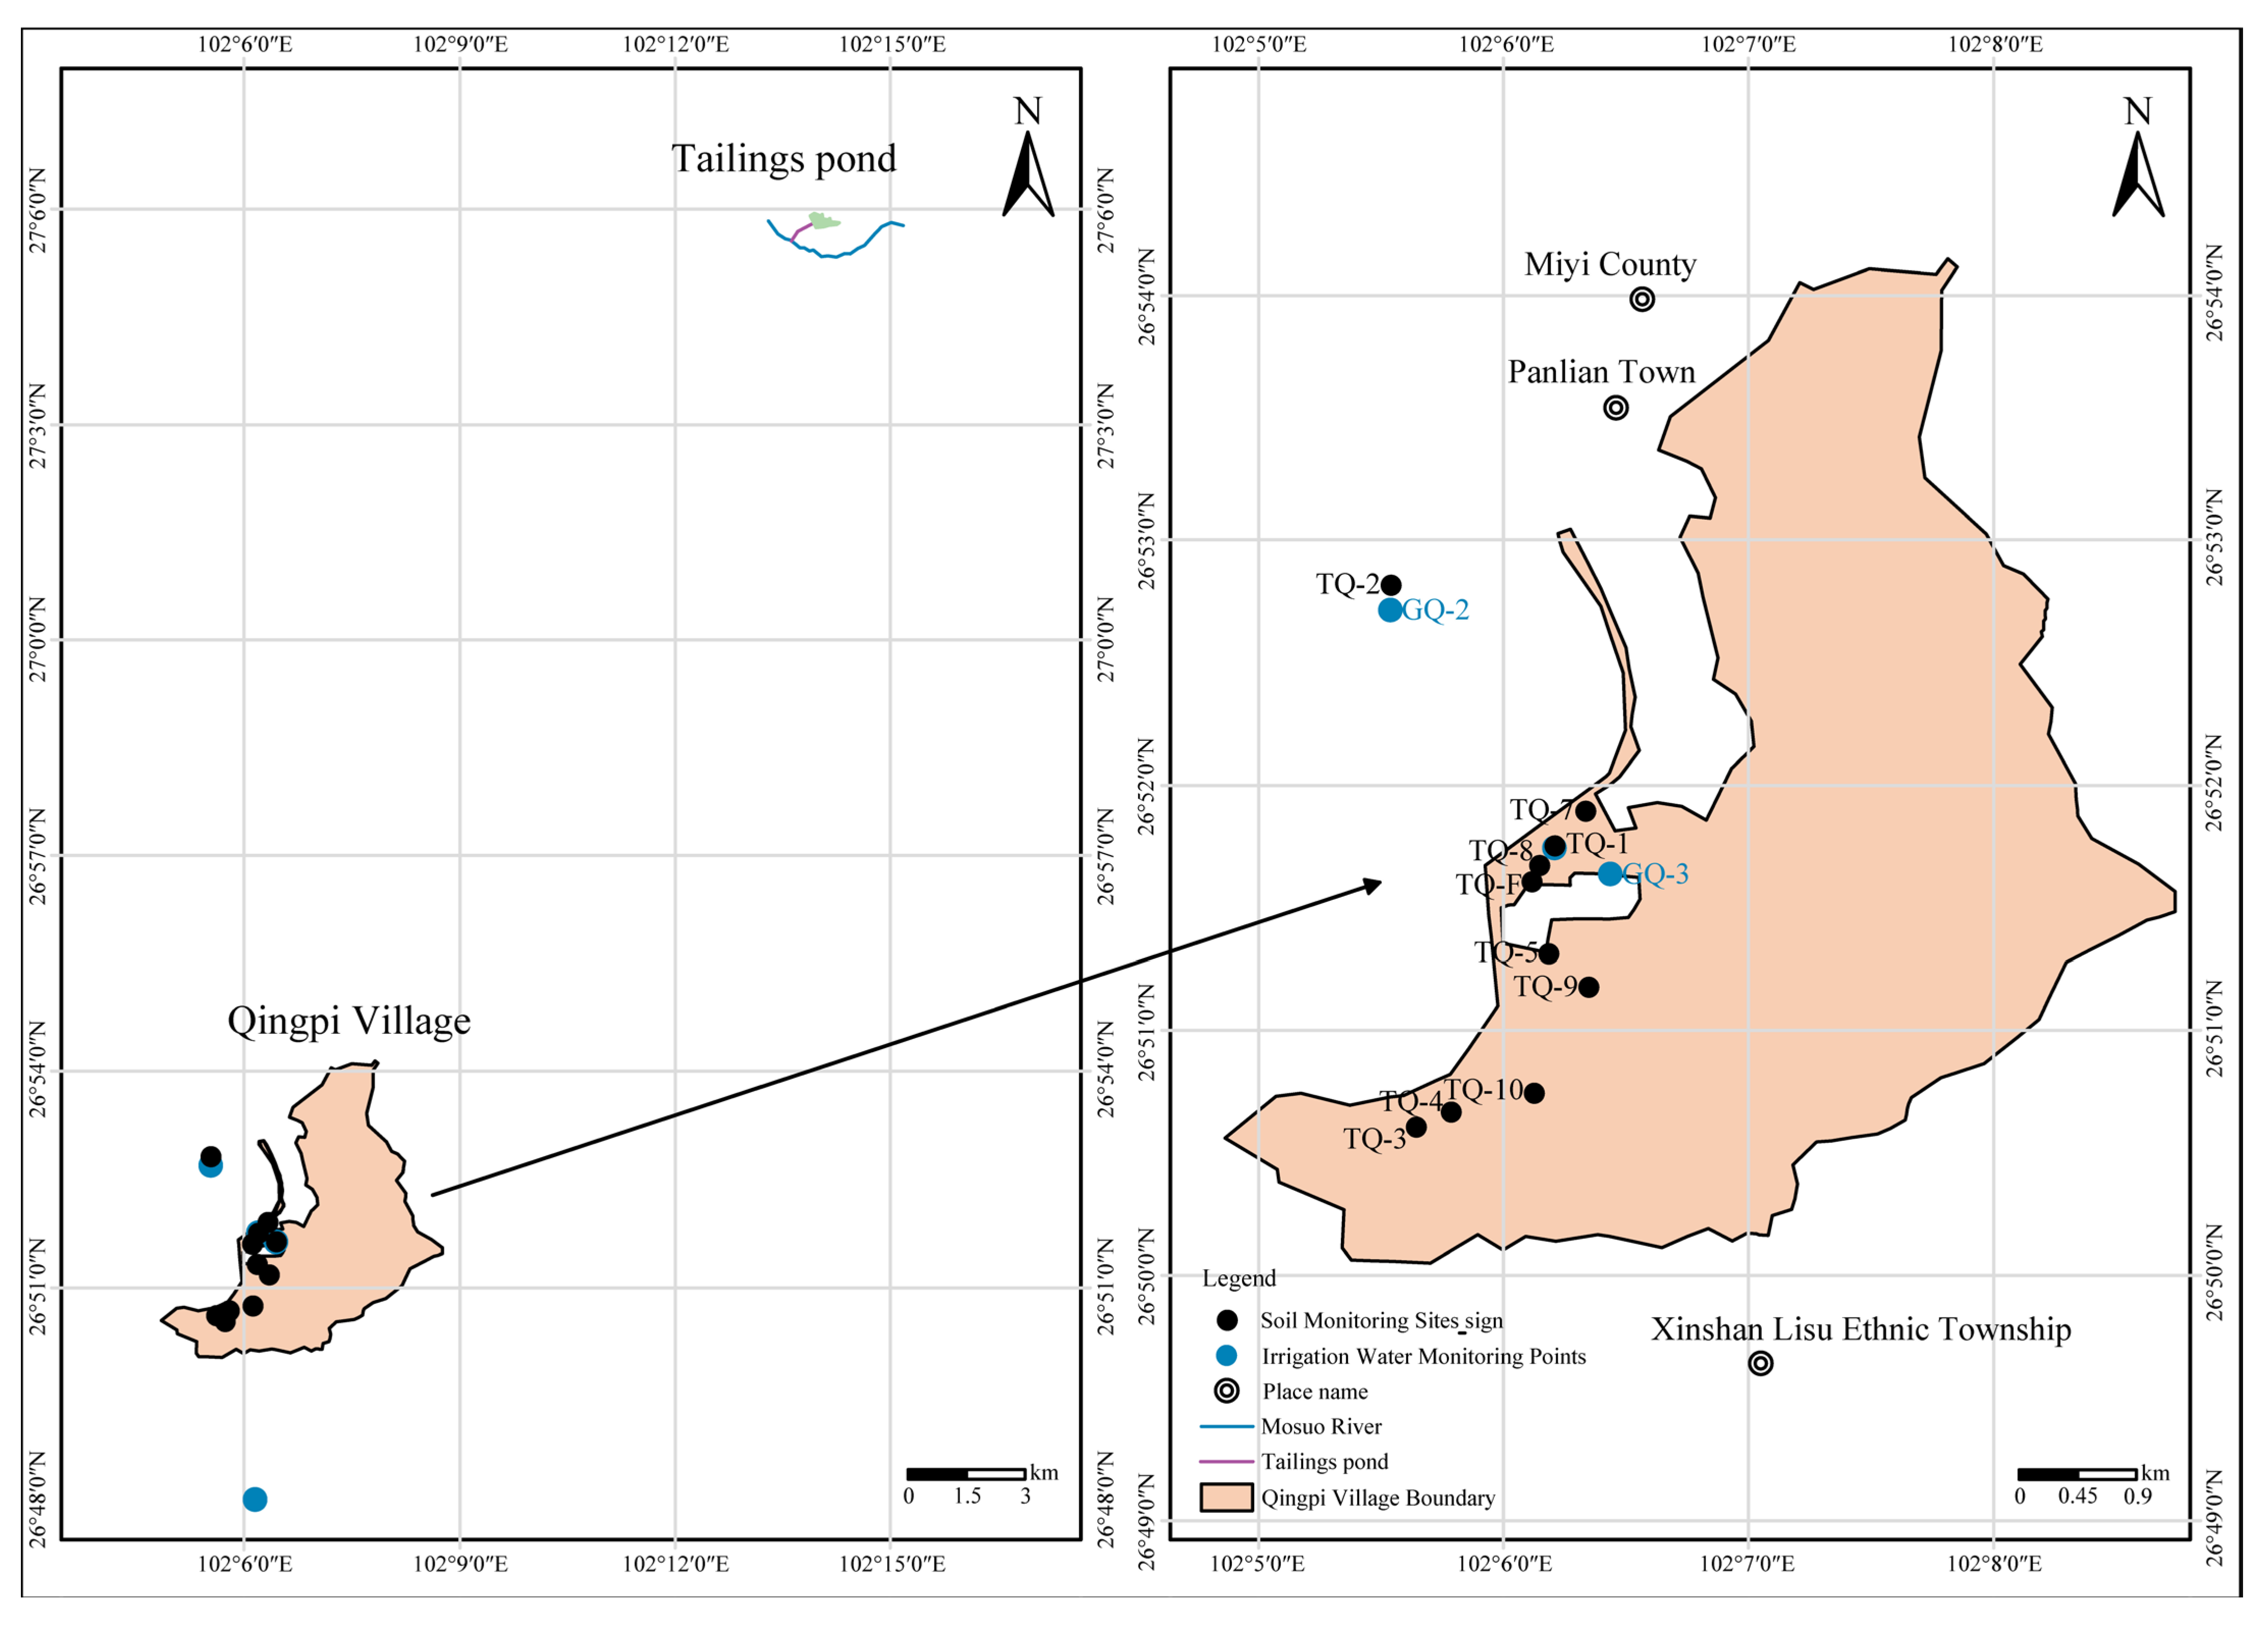
By integrating the multi-media monitoring data into the EPA PMF 5.0 model, the soil accumulation was quantitatively apportioned to four primary source factors (Figure 7): industrial point sources (atmospheric deposition contributing 55–75% of total soil input); agricultural non-point sources (manure and legacy pesticides); upstream watershed inputs via flood runoffs; and natural geological background. The Nemerow comprehensive pollution index ( P N ) identified a distinct clustered distribution pattern: the Northern Industrial Cluster reached a peak P N of 24.6, forming a steep outward diffusion gradient, while agricultural areas showed lower but non-negligible indices ( 1.5 5.0 ). The Håkanson potential ecological risk index ( R I ) demonstrated that Cd was the absolute dominant contributor, reaching a catastrophic single-element risk factor ( E i ) of 2191.8 in industrial cores, accounting for over 70% of the total risk. The USEPA human health risk model showed that oral ingestion was the dominant pathway (70–95%). The lifetime carcinogenic risk ( L C R ) for children residing within the industrial core zones reached an unacceptable level of 5.6 × 10 4 .
The source-to-risk modeling completely validates our primary research hypotheses. The pollution in the study area successfully completed full-chain risk transmission, originating from high-intensity industrial point sources, migrating through atmospheric and aquatic pathways, accumulating in rhizosphere soils, and ultimately bioaccumulating in agricultural crops and human receptors. The natural mineralogical background of the Panxi region provides an elevated baseline, but intensive anthropogenic points act as the decisive trigger driving ecological and public health indices into unacceptable zones, necessitating an immediate shift toward zoning-based remediation.
In summary, pollution in the study area has completed a full chain of risk transmission, originating from industrial sources, transferring through environmental media, and ultimately impacting agricultural products and human health. This has resulted in a complex pollution pattern characterized by Cd as the core risk element, dominated by a few industrial point sources, and exacerbated by agricultural sources and geological background. Remediation must adopt a precise strategy of zoning-based classification, source interception, and risk control. Through precise spatial zoning, stringent source reduction, science-based remediation, and robust long-term mechanisms, pollution spread can be progressively curbed, soil ecological functions restored, and the safety of agricultural products and public health safeguarded.

4. Discussion

4.1. Atmospheric Deposition Mechanisms and Geochemical Scavenging

The synchronous increase in deposition pH (6.8–7.7) and trace element fluxes indicates that exogenous alkaline industrial dust drives regional atmospheric enrichment. Particulates such as metal oxides, calcium-rich slag particles, and fly ash emitted during high-temperature vanadium–titanium magnetite smelting and sintering are inherently alkaline; they efficiently capture gaseous/particulate heavy metals and neutralize precipitation acidity during atmospheric transport [38,39]. The northern Cr-Zn-Cu-Ni elemental fingerprint reflects vanadium–titanium magnetite steel processing centered around Yonglang Town, matching point-source diffusion patterns observed in global metallurgy–mining hubs such as the Russian Ural region. Spatially, the steep outward decay gradient of atmospheric deposition flux suggests that coarse dust particles settle rapidly within a 3–5 km radius of the stack sources via gravitational settling, whereas sub-micron particulate matter carrying volatile Cd and Pb remain suspended longer, drifting downwind along the prevailing Panxi Rift valley winds.
Crucially, Miyi County is situated within the world-renowned Panxi vanadium–titanium magnetite metallogenic belt, where surface soils naturally inherit abundant iron (Fe), titanium (Ti), and vanadium (V) oxide minerals (e.g., ilmenite, magnetite, and secondary amorphous iron oxyhydroxides). These Fe-Ti oxide phases serve as powerful inorganic sorbents possessing exceptionally high specific surface areas and high densities of surface hydroxyl groups. They exert a strong geochemical scavenging effect via inner-sphere complexation of atmospherically deposited cationic metals, particularly Cd2+ and Pb2+, trapping them effectively within topsoil mineral matrices. This natural geochemical barrier plays a vital buffering role in preventing rapid vertical leaching of toxic elements into subsurface aquifers.
Furthermore, cadmium (Cd) emerges as the absolute primary risk factor ( E i 2191.8 ) across the multi-media system. This primary status stems from three synergistic factors: (1) high high-temperature volatility during smelting, leading to dominant enrichment in fine atmospheric dust; (2) high mobility (Cd2+) under acidic-to-neutral soil conditions compared to strongly lithophilic elements like Cr or Ni; and (3) exceptionally low screening baselines under Chinese food safety standards (GB 15618-2018, 0.3 0.6   m g k g 1 ) [33], where minor absolute inputs trigger massive index elevations. Seasonal dynamics further modulate this spatial distribution: the subtropical dry-hot valley climate yields distinct dry (winter/spring) and rainy (summer/autumn) seasons. Dry seasons favor continuous airborne dustfall accumulation on topsoils and foliar surfaces, whereas intense rainy season precipitation generates strong hydrological runoff that flushes accumulated surface deposits into aquatic channels, dynamically shifting the primary risk vector from atmospheric deposition to sediment–water interaction.

4.2. Aquatic Partitioning and Sediment Secondary Risk

The neutral to weakly alkaline hydrochemical regime (pH 7.17–8.40) of overlying irrigation water strongly promotes the chemical partitioning of dissolved metals from the water column onto suspended particulate matter, accelerating their sedimentation onto channel beds [40,41]. This explains why overlying irrigation water strictly complies with national safety standards while underlying sediments exhibit severe contamination. The spatial partitioning of sediments reveals distinct anthropogenic legacies: eastern channels captured historical industrial wastewater and mineral processing slurries (yielding peak Cd at 6.33   m g k g 1 and Zn at 1188   m g k g 1 ), whereas western agricultural ditches accumulated legacy runoffs of copper-based fungicides (e.g., copper sulfate) and historical arsenic-based pesticides (lead arsenate).
Importantly, these sequestered sediment metals do not represent permanent environmental sinks. In river–canal networks worldwide, contaminated sediments act as latent internal pollution sources. Under changing ambient conditions, such as sudden pH drops induced by acid rain, seasonal anaerobic redox shifts in sediment–water interfaces, or physical resuspension during high-discharge flood events, bound metals in acid-extractable or reducible fractions can rapidly remobilize back into the overlying water column. This secondary release poses sudden and severe toxicity threats to downstream agricultural fields irrigated during flood seasons.

4.3. Agricultural Input Recycling and Hotspot Generation

Systematic monitoring of agricultural inputs demonstrates that conventional chemical fertilizers (nitrogen and phosphorus) remain largely safe, whereas organic recycling pathways generate localized high-risk hotspots [42]. Elevated (Cu 27.33   m g k g 1 ) and Zn ( 163.0   m g k g 1 ) in livestock manure stem directly from the commercial overuse of organometallic feed additives (e.g., copper sulfate and zinc oxide) designed to promote growth and prevent disease in intensive swine and poultry production. When this metal-rich manure is applied to local farmland as organic fertilizer under traditional planting–breeding combined circular practices, feed additives originating from the industrial era are systematically unloaded onto agricultural topsoils, driving localized metal accumulation over successive cropping cycles. Concurrently, isolated As anomalies ( 45.0   m g k g 1 ) in commercial fertilizers highlight the unauthorized persistence or illegal compounding of historical arsenic-containing agrochemicals entering formal agricultural markets.

4.4. Physicochemical Controls on Soil–Crop Translocation

Soil physicochemical properties and element speciation exert critical regulatory controls over bioavailability and tissue translocation [43,44]. A fundamental geochemical contrast exists between cationic and anionic contaminants. Cationic species interact strongly with negative surface charges on clay minerals and organic matter (OM). Soil pH acts as the master variable: under acidic conditions (pH 5.1–5.9), high H+ concentrations competitively displace bound Cd2+ and Pb2+ from soil cation exchange sites, dramatically enhancing their effective mobility and root uptake even in soils with moderate total metal loading. Metalloid As and Cr(VI) exist primarily as oxyanions in aqueous environments. Under neutral to alkaline hydrochemical conditions (pH > 7.0), negative soil surface charges repel oxyanions, increasing As solubility and uptake via phosphate transporter channels in plant roots. This explains the anomalous As accumulation observed in rice grains ( 1.28 1.83   m g k g 1 ).

5. Conclusions and Recommendations

5.1. Conclusions

This study systematically unraveled the source-to-sink transmission of toxic elements in Miyi County (China). Cadmium (Cd) is the universal core risk element ( P i 32.63 , E i 2191.8 , accounting for >70% of ecological risks). Atmospheric deposition from industrial point sources is the primary driver (contributing 55–75% of soil inputs). The complete transmission chain poses unacceptable lifetime carcinogenic risks to children in industrial core zones ( L C R = 5.6 × 10 4 ), fully validating our hypotheses.

5.2. Recommendations for Global Transition Economies

To break the multi-media risk transmission chain and decouple industrial growth from regional food safety degradation in fast-developing transition economies worldwide, local environmental authorities must implement a macro spatial risk zoning strategy by legally classifying farmland into core eco-shield zones, where edible crop production is completely phased out in favor of non-food industrial timber or phytoremediation baselines; agronomic safe production zones, where soil pH is actively raised via in situ passivators alongside mandatory adoption of low-accumulation crop cultivars; and clean protection zones protected by strict industrial emission ceilings. Simultaneously, this macro-zoning policy must be combined with stack-level clean production upgrades to interrupt atmospheric dust deposition, targeted eco-dredging of contaminated canal sediments to eliminate internal secondary sinks, and strict heavy metal ceilings on livestock feed additives to halt the breeding-to-farmland transfer loop.

Supplementary Materials

The following supporting information can be downloaded at: https://www.mdpi.com/article/10.3390/environments13090487/s1, Table S1: Summary of heavy metal and Metalloids concentrations in different sample types.

Author Contributions

Conceptualization, X.H. and G.Y.; methodology, X.H., G.Y., and H.D.; validation, X.H. and G.Y.; formal analysis, G.L.; investigation, B.G. and W.C.; resources, H.D.; data curation, W.C., J.C., and P.W.; writing—original draft preparation, X.H. and G.Y.; writing—review and editing, H.D., G.L., J.C., and P.W.; supervision, H.D., J.C., and P.W.; project administration, G.L. and B.G.; funding acquisition, H.D. All authors have read and agreed to the published version of the manuscript.

Funding

This research was funded by the Sichuan Bureau of Geology and Mineral Resources 2025 Science and Technology Project (No. SCDZ-DH202504) and the Deep Earth Probe and Mineral Resources Exploration—National Science and Technology Major Project (NO. 2025ZD1010800).

Data Availability Statement

The authors confirm that all data generated or analyzed during this study are included in this article.

Conflicts of Interest

The authors declare no conflicts of interest.

References

  1. Qin, G.; Niu, Z.; Yu, J.; Li, Z.; Ma, J.; Xiang, P. Soil heavy metal pollution and food safety in China: Effects, sources and removing technology. Chemosphere 2021, 267, 129205. [Google Scholar] [CrossRef] [Scilit]
  2. Kumar, P.; Dipti Kumar, S.; Singh, R.P. Severe contamination of carcinogenic heavy metals and metalloid in agroecosystems and their associated health risk assessment. Environ. Pollut. 2022, 301, 118953. [Google Scholar] [CrossRef] [Scilit]
  3. Wei, M.; Pan, A.; Ma, R.; Wang, H. Distribution characteristics, source analysis and health risk assessment of heavy metals in farmland soil in Shiquan County, Shaanxi Province. Process Saf. Environ. Prot. 2023, 171, 225–237. [Google Scholar] [CrossRef] [Scilit]
  4. Liu, Z.; Bai, Y.; Gao, J.; Li, J. Driving factors on accumulation of cadmium, lead, copper, zinc in agricultural soil and products of the North China Plain. Sci. Rep. 2023, 13, 7429. [Google Scholar] [CrossRef] [Scilit]
  5. Yuan, X.; Xue, N.; Han, Z. A meta-analysis of heavy metals pollution in farmland and urban soils in China over the past 20 years. J. Environ. Sci. 2021, 101, 217–226. [Google Scholar] [CrossRef] [Scilit]
  6. Barsova, N.; Yakimenko, O.; Tolpeshta, I.; Motuzova, G. Current state and dynamics of heavy metal soil pollution in Russian Federation—A review. Environ. Pollut. 2019, 249, 200–207. [Google Scholar] [CrossRef] [Scilit]
  7. Suleymanov, R.; Dorogaya, E.; Gareev, A.; Minnegaliev, A.; Gaynanshin, M.; Zaikin, S.; Belan, L.; Tuktarova, I.; Suleymanov, A. Assessment of Chemical Properties, Heavy Metals, and Metalloid Contamination in Floodplain Soils under the Influence of Copper Mining: A Case Study of Sibay, Southern Urals. Ecologies 2022, 3, 530–538. [Google Scholar] [CrossRef] [Scilit]
  8. Medvedeva, A.; Buryukova, O.; Kucherenko, A.; Ilchenko, Y.; Chaplygin, V.; Rajput, V.D.; Kizilkaya, R. Content of heavy metals in Haplic Chernozem under conditions of agrogenesis. E3S Web Conf. 2020, 169, 01024. [Google Scholar] [CrossRef] [Scilit]
  9. Kolesnikov, S.; Minnikova, T.; Kazeev, K.; Akimenko, Y.; Evstegneeva, N. Assessment of the Ecotoxicity of Pollution by Potentially Toxic Elements by Biological Indicators of Haplic Chernozem of Southern Russia (Rostov region). Water Air Soil Pollut. 2022, 233, 18. [Google Scholar] [CrossRef] [Scilit]
  10. Cao, Z.; Guan, M.; Lin, X.; Zhang, W.; Xu, P.; Chen, M.; Zheng, X. Spatial and variety distributions, risk assessment, and prediction model for heavy metals in rice grains in China. Environ. Sci. Pollut. Res. 2023, 31, 7298–7311. [Google Scholar] [CrossRef] [Scilit]
  11. Zhang, C.; Li, J.; Dai, Y.; Gustave, W.; Zhai, W.; Zhong, Z.; Chen, J. Spatial and Temporal Variations of Heavy Metals’ Bioavailability in Soils Regulated by a Combined Material of Calcium Sulfate and Ferric Oxide. Toxics 2023, 11, 296. [Google Scholar] [CrossRef] [Scilit]
  12. Cai, B.; Tang, R.; Wang, H.; Sun, J.; Zhao, M.; Huang, X.; Song, X.; Han, Z.; Fan, Z. Impact of economic development on soil trace metal(loid)s pollution: A case study of China. Environ. Pollut. 2024, 344, 123319. [Google Scholar] [CrossRef] [Scilit]
  13. Wang, C.-C.; Zhang, Q.-C.; Yan, C.-A.; Tang, G.-Y.; Zhang, M.-Y.; Ma, L.Q.; Gu, R.-H.; Xiang, P. Heavy metal(loid)s in agriculture soils, rice, and wheat across China: Status assessment and spatiotemporal analysis. Sci. Total Environ. 2023, 882, 163361. [Google Scholar] [CrossRef] [Scilit]
  14. Wei, A.; Jia, J.; Chang, P.; Wang, S. Status of Sustainable Balance Regulation of Heavy Metals in Agricultural Soils in China: A Comprehensive Review and Meta-Analysis. Agronomy 2024, 14, 450. [Google Scholar] [CrossRef] [Scilit]
  15. Wang, H.; Li, W.; Zhu, C.; Tang, X. Analysis of Heavy Metal Pollution in Cultivated Land of Different Quality Grades in Yangtze River Delta of China. Int. J. Environ. Res. Public Health 2021, 18, 9876. [Google Scholar] [CrossRef] [Scilit]
  16. Xie, H.; Shi, Y.; Wang, L.; Yan, H.; Ci, M.; Wang, Z.; Chen, Y. Source and risk assessment of heavy metals in mining-affected areas in Jiangxi Province, China, based on Monte Carlo simulation. Environ. Sci. Pollut. Res. 2024, 31, 21765–21780. [Google Scholar] [CrossRef] [Scilit]
  17. Dai, X.; Wang, Z.; Liu, S.; Yao, Y.; Zhao, R.; Xiang, T.; Fu, T.; Feng, H.; Xiao, L.; Yang, X.; et al. Hyperspectral imagery reveals large spatial variations of heavy metal content in agricultural soil—A case study of remote-sensing inversion based on Orbita Hyperspectral Satellites (OHS) imagery. J. Clean. Prod. 2022, 380, 134878. [Google Scholar] [CrossRef] [Scilit]
  18. Yu, H.; Xie, S.; Liu, P.; Hua, Z.; Song, C.; Jing, P. Estimation of Pb and Cd Content in Soil Using Sentinel-2A Multispectral Images Based on Ensemble Learning. Remote Sens. 2023, 15, 2299. [Google Scholar] [CrossRef] [Scilit]
  19. Zhang, B.; Zhao, Y. Modeling and interpreting the probability of soil heavy metal contamination in China. Hum. Ecol. Risk Assess. Int. J. 2025, 31, 1020–1039. [Google Scholar] [CrossRef] [Scilit]
  20. Xu, W.; Xu, H.; Delgado-Baquerizo, M.; Gundale, M.J.; Zou, X.; Ruan, H. Global meta-analysis reveals positive effects of biochar on soil microbial diversity. Geoderma 2023, 436, 116528. [Google Scholar] [CrossRef] [Scilit]
  21. Chen, Q.; Wang, L.; Li, B.; He, S.; Li, Y.; He, Y.; Liang, X.; Zhan, F. Remediation of Cadmium and Lead in Mine Soil by Ameliorants and Its Impact on Maize (Zea mays L.) Cultivation. Agronomy 2024, 14, 372. [Google Scholar] [CrossRef] [Scilit]
  22. Adnan, M.; Xiao, B.; Ali, M.U.; Xiao, P.; Zhao, P.; Wang, H.; Bibi, S. Heavy metals pollution from smelting activities: A threat to soil and groundwater. Ecotoxicol. Environ. Saf. 2024, 274, 116189. [Google Scholar] [CrossRef] [Scilit]
  23. Mao, X.; Sun, J.; Shaghaleh, H.; Jiang, X.; Yu, H.; Zhai, S.; Hamoud, Y.A. Environmental Assessment of Soils and Crops Based on Heavy Metal Risk Analysis in Southeastern China. Agronomy 2023, 13, 1107. [Google Scholar] [CrossRef] [Scilit]
  24. Pan, Y.; Ding, L.; Xie, S.; Zeng, M.; Zhang, J.; Peng, H. Spatiotemporal simulation, early warning, and policy recommendations of the soil heavy metal environmental capacity of the agricultural land in a typical industrial city in China: Case of Zhongshan City. J. Clean. Prod. 2021, 285, 124849. [Google Scholar] [CrossRef] [Scilit]
  25. Zeng, Q.; Wang, Z.; Luo, Y.; Zhang, Z.; Zhang, J.; Feng, X.; Tian, D.; Li, C.; Cheng, Q.; Yi, F. Evaluation and Source Apportionment on Potentially Toxic Elements Pollution of Agricultural Soil in Mango Planting Areas in Panzhihua City, China. Soil Sediment Contam. Int. J. 2024, 34, 104–126. [Google Scholar] [CrossRef] [Scilit]
  26. Zeng, Y.; Liu, X.; Li, Y.; Jin, Z.; Shui, W.; Wang, Q. Analysis of driving factors for potential toxic metals in major urban soils of China: A geodetetor-based quantitative study. Environ. Geochem. Health 2024, 46, 389. [Google Scholar] [CrossRef] [Scilit]
  27. Liu, Y.; Cao, X.; Hu, Y.; Cheng, H. Pollution, Risk and Transfer of Heavy Metals in Soil and Rice: A Case Study in a Typical Industrialized Region in South China. Sustainability 2022, 14, 10225. [Google Scholar] [CrossRef] [Scilit]
  28. Wang, Y.; Duan, X.; Wang, L. Spatial distribution and source analysis of heavy metals in soils influenced by industrial enterprise distribution: Case study in Jiangsu Province. Sci. Total Environ. 2020, 710, 134953. [Google Scholar] [CrossRef] [Scilit]
  29. Peng, Y.; Yu, G.I. Assessment of heavy metal pollution on agricultural land in Chengdu city under different anthropogenic pressures based on APCS-MLR modelling. Ecol. Indic. 2024, 165, 112183. [Google Scholar] [CrossRef] [Scilit]
  30. Gong, J.; Gao, J.; Wu, H.; Lin, L.; Yang, J.; Tang, S.; Wang, Z.; Duan, Z.; Fu, Y.; Cai, Y.; et al. Heavy metal spatial distribution, source analysis, and ecological risks in the central hilly area of Hainan Island, China: Results from a high-density soil survey. Environ. Geochem. Health 2024, 46, 210. [Google Scholar] [CrossRef] [Scilit]
  31. Liu, Y.; Yin, T.; Shi, R.; Li, Y.; Ma, J.; Li, H.; Yang, K.; Ding, S.; Li, X. Risk Assessment and Source Apportionment of Heavy Metals in Agricultural Soil Across Yinchuan, China. Agronomy 2025, 15, 2726. [Google Scholar] [CrossRef] [Scilit]
  32. Liu, Y.; Shen, W.; Fan, K.; Pei, W.; Liu, S. Spatial Distribution, Source Analysis, and Health Risk Assessment of Heavy Metals in the Farmland of Tangwang Village, Huainan City, China. Agronomy 2024, 14, 394. [Google Scholar] [CrossRef] [Scilit]
  33. GB 15618-2018; Soil Environmental Quality-Risk Control Standard for Soil Contamination of Agricultural Land (Trial). China Environmental Science Press: Beijing, China, 2018. (In Chinese)
  34. Hakanson, L. An ecological risk index for aquatic pollution control. A sedimentological approach. Water Res. 1980, 14, 975–1001. [Google Scholar] [CrossRef] [Scilit]
  35. USEPA (United States Environmental Protection Agency). Risk Assessment Guidance for Superfund, Volume I: Human Health Evaluation Manual (Part A); EPA/540/1-89/002; USEPA: Washington, DC, USA, 1989. [Google Scholar]
  36. Paatero, P.; Tapper, U. Positive matrix factorization: A non-negative factor model with optimal utilization of error estimates of data values. Environmetrics 1994, 5, 111–126. [Google Scholar] [CrossRef] [Scilit]
  37. GB 5084-2021; Standards for Irrigation Water Quality. China Environmental Science Press: Beijing, China, 2021. (In Chinese)
  38. Liu, H.-L.; Zhou, J.; Li, M.; Hu, Y.; Liu, X.; Zhou, J. Study of the bioavailability of heavy metals from atmospheric deposition on the soil-pakchoi (Brassica chinensis L.) system. J. Hazard. Mater. 2019, 362, 9–16. [Google Scholar] [CrossRef] [Scilit]
  39. Yu, E.; Liu, H.; Tu, Y.; Gu, X.; Ran, X.; Yu, Z.; Wu, P. Superposition Effects of Zinc Smelting Atmospheric Deposition on Soil Heavy Metal Pollution Under Geochemical Anomaly. Front. Environ. Sci. 2022, 10, 777894. [Google Scholar] [CrossRef] [Scilit]
  40. Liang, H.-Y.; Zhang, Y.-H.; Du, S.-L.; Cao, J.-L.; Liu, Y.-F.; Zhao, H.; Ding, T.-T. Heavy metals in sediments of the river-lake system in the Dianchi basin, China: Their pollution, sources, and risks. Sci. Total Environ. 2024, 957, 177652. [Google Scholar] [CrossRef] [Scilit]
  41. Zhang, X.; Zhang, S.; Wei, X.; Liu, Z.; Wang, C.; Mu, H.; Han, Y.; Liu, C. Identification of sources and analysis of spatial distribution of soil heavy metals in northern China coal mining areas. Environ. Geochem. Health 2024, 46, 94. [Google Scholar] [CrossRef] [Scilit]
  42. Zhou, H.; Chen, Y.; Yue, X.; Ren, D.; Liu, Y.; Yang, K. Identification and hazard analysis of heavy metal sources in agricultural soils in ancient mining areas: A quantitative method based on the receptor model and risk assessment. J. Hazard. Mater. 2023, 445, 130528. [Google Scholar] [CrossRef] [Scilit]
  43. Liu, H.; Rong, X.; Zhao, H.; Xia, R.; Li, M.; Wang, H.; Cui, H.; Wang, X.; Zhou, J. Bioaccumulation of Atmospherically Deposited Cadmium in Soybean: Three-Year Field Experiment Combined with Cadmium Isotopes. Environ. Sci. Technol. 2024, 58, 17703–17716. [Google Scholar] [CrossRef] [Scilit]
  44. Wen, M.; Ma, Z.; Gingerich, D.B.; Zhao, X.; Zhao, D. Heavy metals in agricultural soil in China: A systematic review and meta-analysis. Eco-Environ. Health 2022, 1, 219–228. [Google Scholar] [CrossRef] [Scilit]
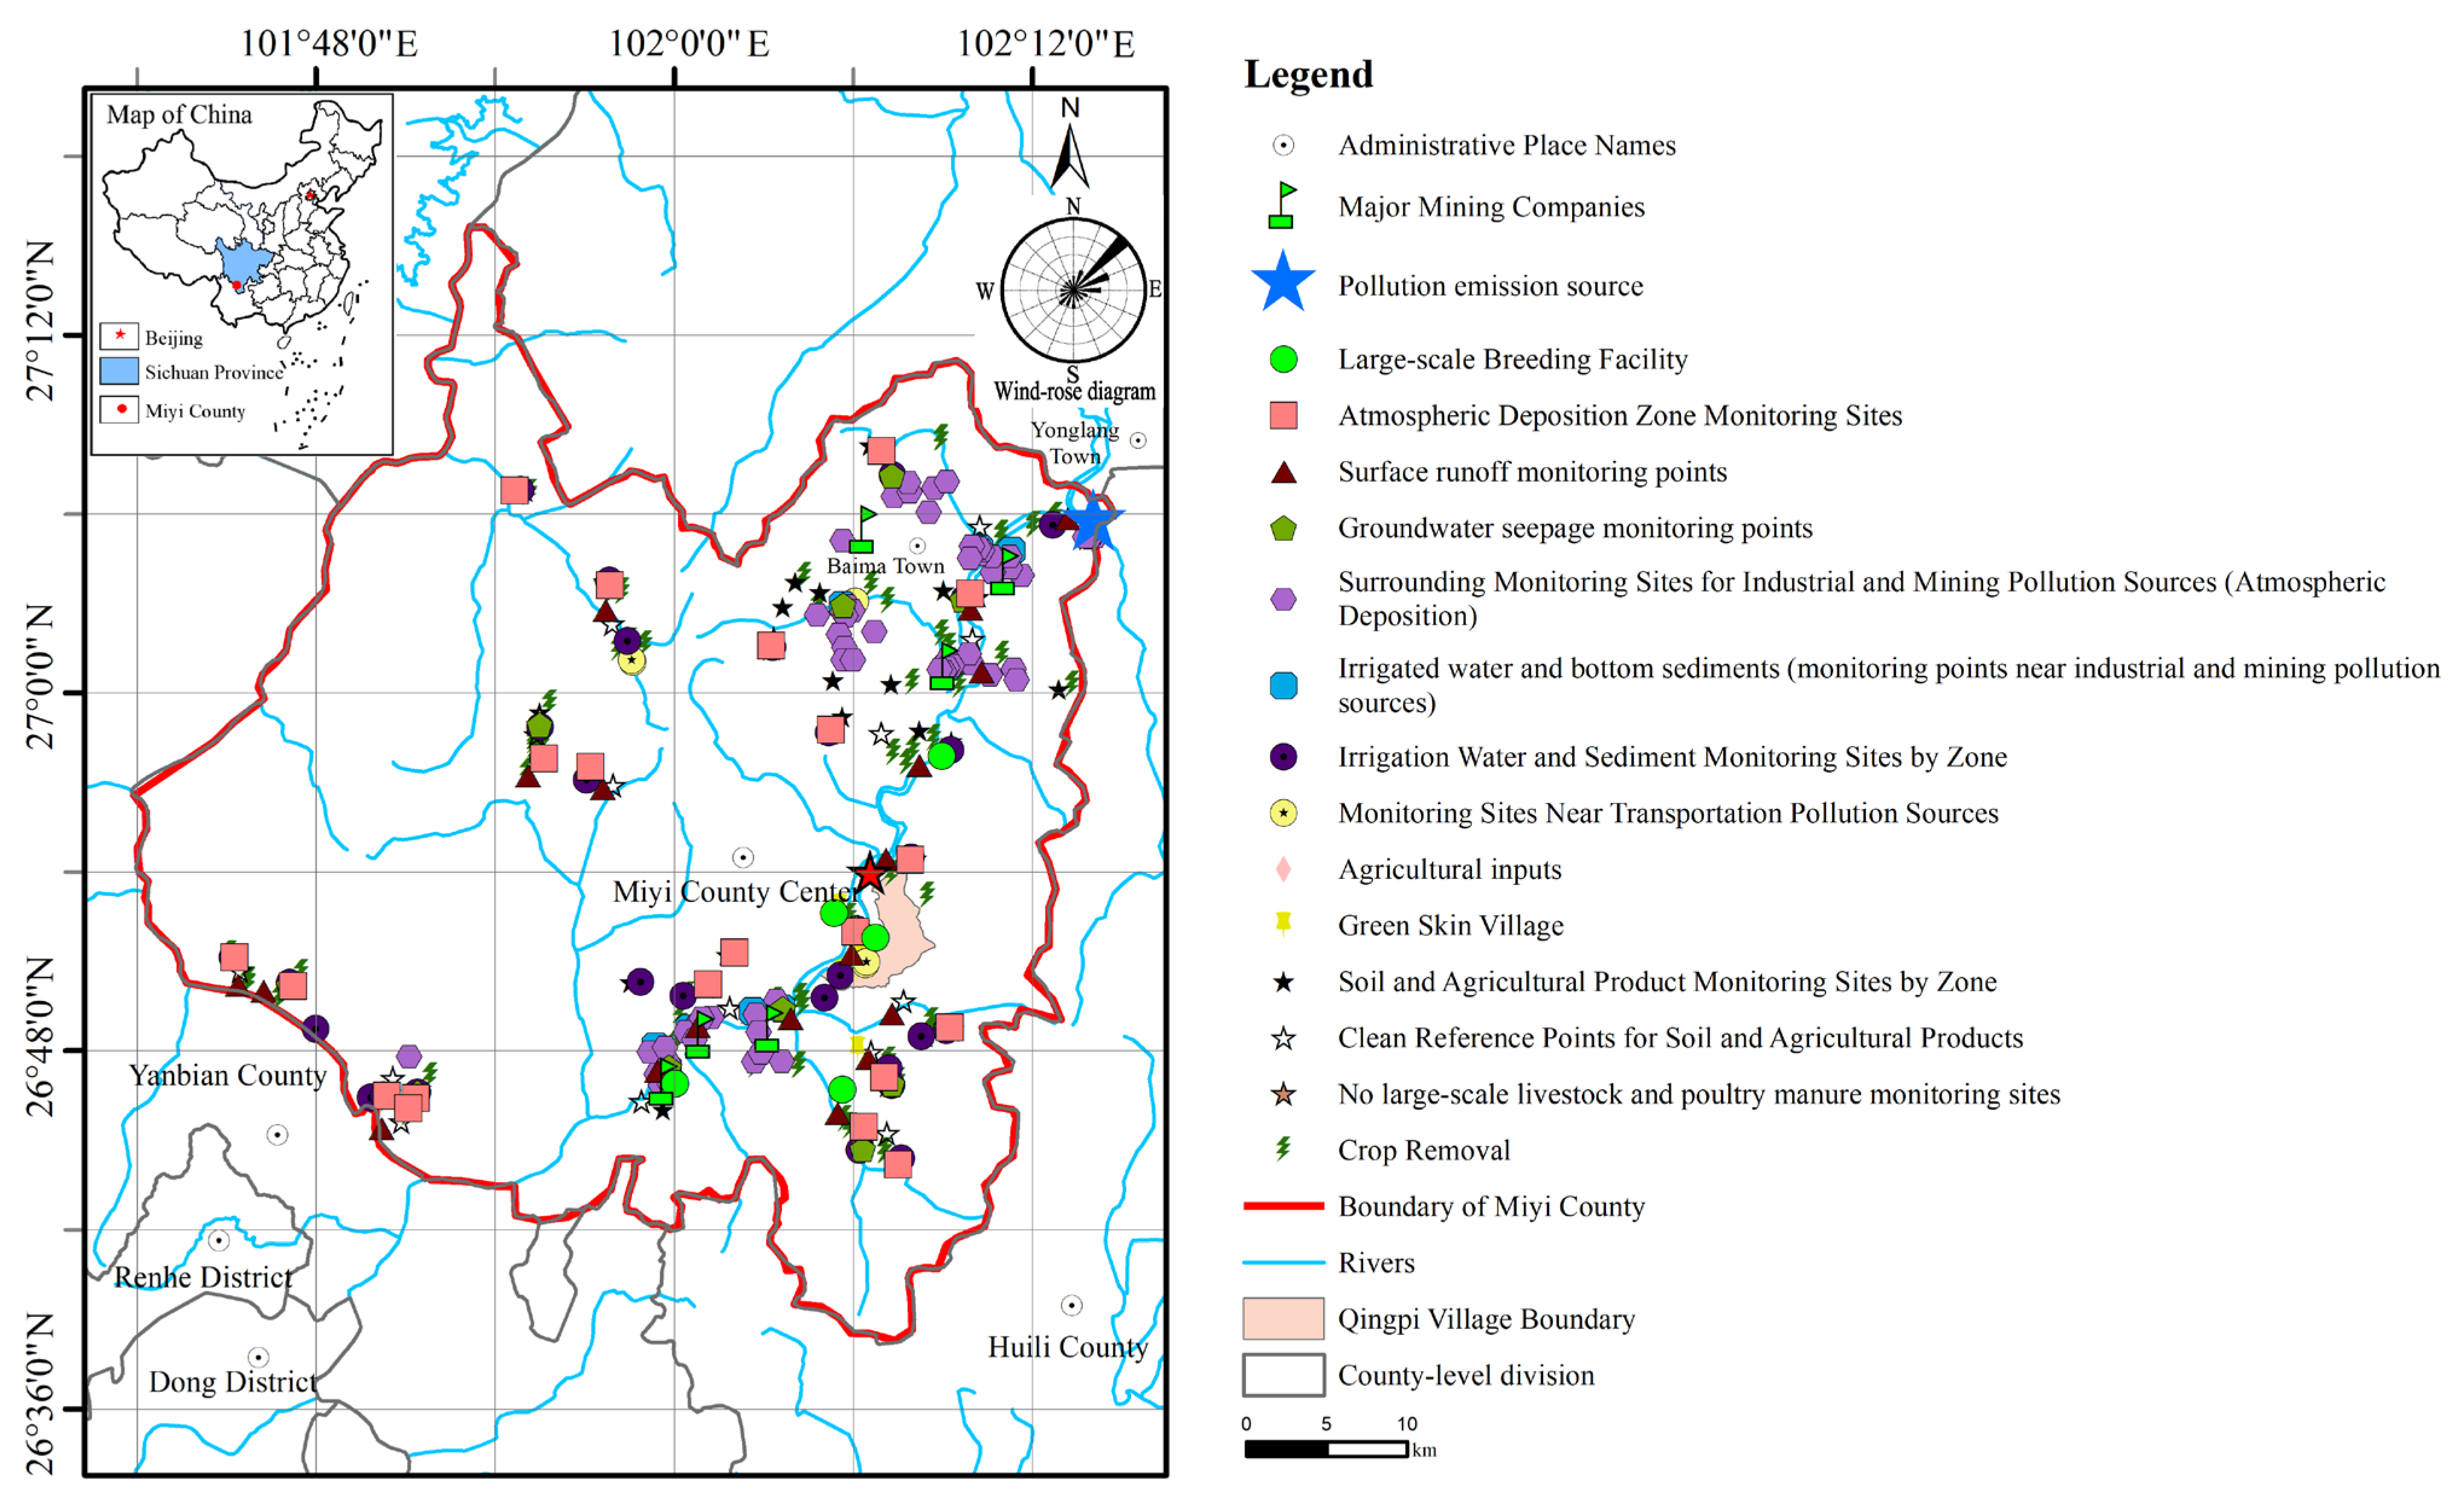
Figure 1. Spatial layout of sampling sites in the study area.
Environments 13 00487 g001
Figure 2. Spatial distribution of heavy metal contents in atmospheric deposition based on Inverse Distance Weighting (IDW) interpolation. Units are g h m 2 a 1 for deposition fluxes. Sub-panel (a) displays atmospheric precipitation pH. 101°45′E–102°15′ E, 26°36′ N–27°18′ N. (b) Hg; (c) As; (d) Cd; (e) Pb; (f) Cr; (g) Zn; (h) Cu; (i) Ni.
Environments 13 00487 g002
Figure 3. Spatial distribution of trace element concentrations in irrigation water based on Inverse Distance Weighting (IDW) interpolation. Units are μ g L 1 for water concentrations. Sub-panel (a) displays irrigation water pH. 101°45′ E–102°15′ E, 26°36′ N–27°18′ N. (b) As; (c) Cr; (d) Zn; (e) Cu; (f) Ni.
Environments 13 00487 g003
Figure 4. Spatial distribution of trace element loading in livestock manure based on Inverse Distance Weighting (IDW) interpolation. Concentrations are expressed in m g k g 1 dry weight. Sub-panel (a) displays manure pH. 101°45′ E–102°15′ E, 26°36′ N–27°18′ N. (b) Hg; (c) As; (d) Cd; (e) Pb; (f) Cr; (g) Zn; (h) Cu; (i) Ni.
Environments 13 00487 g004
Figure 5. Spatial variability of trace element contents in rhizosphere soil based on Inverse Distance Weighting (IDW) interpolation. Concentrations are expressed in m g k g 1 . Sub-panel (a) displays soil pH. 101°45 ′E–102°15′ E, 26°36′ N–27°18′ N. (b) Hg; (c) As; (d) Cd; (e) Pb; (f) Cr; (g) Zn; (h) Cu; (i) Ni.
Environments 13 00487 g005
Figure 6. Spatial distribution of trace element contents in soil at synergistic monitoring sites based on Inverse Distance Weighting (IDW) interpolation. Concentrations are expressed in   m g k g 1 . Sub-panel (a) displays soil pH. 101°45′ E–102°15′ E, 26°36′ N–27°18′ N. (b) Hg; (c) As; (d) Cd; (e) Pb; (f) Cr; (g) Zn; (h) Cu; (i) Ni.
Environments 13 00487 g006
Figure 7. Geographical boundary of the investigation zone for source apportionment of environmental pollutants.
Environments 13 00487 g007
Table 1. Overview of multi-media sample sources, monitoring parameters, and data volume in the study area.
Environmental MediumSampling SitesCode RangeParameters Tested per SampleNumber of Samples
Atmospheric Deposition90JC1–JC90Dustfall volume, precipitation volume, pH, Cd, Hg, As, Pb, Cr, Cu, Zn, Ni806
Irrigation Water and Sediment39GG1–GG39Irrigation volume, pH, Cd, Hg, As, Pb, Cr, Cu, Zn, Ni324
Agricultural Inputs20NT1–NT20pH, Cd, Hg, As, Pb, Cr, Cu, Zn, Ni593
Livestock and Poultry Manure25FW1–FW25Application rate, pH, Cd, Hg, As, Pb, Cr, Cu, Zn, Ni121
Crop Removal225ZW1-1–ZW75-3Crop biomass (including yield weight and straw weight), moisture content, Cd, Hg, As, Pb, Cr, Cu, Zn, Ni; soil parameters: pH, Organic Matter (OM), Cd, Hg, As, Pb, Cr, Cu, Zn, Ni880
Soil and Crop Synergistic Monitoring45TR1–TR45
TRCK1–TRCK15
pH, Organic Matter (OM), Cd, Hg, As, Pb, Cr, Cu, Zn, Ni, plus available Cd in topsoil113
Intensive Source Tracing (Soil)11TQ1–TQ11pH, Organic Matter (OM), Cd, Hg, As, Pb, Cr, Cu, Zn, Ni, plus available Cd in topsoil11
Intensive Source Tracing (Irrigation Water)4GQ1–GQ4Irrigation volume, pH, Cd, Hg, As, Pb, Cr, Cu, Zn, Ni4
The measurement units for the tested parameters are as follows: heavy metals and metalloids (Cd, Hg, As, Pb, Cr, Cu, Zn, Ni) in solid media (soil, sediment, agricultural inputs, crop biomass, manure) are expressed in mg·kg−1; concentrations in irrigation water are expressed in μg·L−1; atmospheric deposition fluxes are expressed in g·hm−2·a−1; liquid and solid volumes/weights are measured in L and kg, respectively; and pH is a dimensionless metric.
Disclaimer/Publisher’s Note: The statements, opinions and data contained in all publications are solely those of the individual author(s) and contributor(s) and not of MDPI and/or the editor(s). MDPI and/or the editor(s) disclaim responsibility for any injury to people or property resulting from any ideas, methods, instructions or products referred to in the content.