Article

Determining the Invasive Status of Alien Tree Species Based on Their Phenological Characteristics

by
Boris L. Kozlovsky
1,
Pavel A. Dmitriev
1,*,
Olga I. Fedorinova
1,
Mikhail V. Kuropyatnikov
1,
Anastasiya A. Dmitrieva
1,
Mikhail M. Sereda
2 and
Valeriy K. Tokhtar
3
1
Botanical Garden, Academy of Biology and Medicine, Southern Federal University, Rostov-on-Don 344006, Russia
2
Department of Botany and Bioresources, Don State Technical University, Rostov-on-Don 344000, Russia
3
Botanical Garden, Belgorod State National Research University, Belgorod 308015, Russia
*
Author to whom correspondence should be addressed.
Environments 2026, 13(4), 224; https://doi.org/10.3390/environments13040224
Submission received: 2 March 2026 / Revised: 10 April 2026 / Accepted: 17 April 2026 / Published: 19 April 2026

Abstract

Invasive plants represent a significant global threat to natural ecosystems and biodiversity. The aim of this study was to classify alien woody plants according to their invasion status based on their phenological characteristics using machine learning. Data from phenological observations of 63 tree species, including both native and alien (introduced and invasive) species, were used for the analysis. The dataset contains information on long-term (1977–2024) observations of the timing of 18 phenological phases and the duration of 6 interphase intervals. The F1-score values for identifying the ‘introduced plant’ class in the ‘Native–Introduced’ pair were 81.3%. The values of this same indicator for identifying the ‘invasive plants’ class in the ‘Native–Invasive’ and ‘Introduced–Invasive’ pairs were 85.0% and 71.2% respectively. It has been shown that the invasive status of alien tree species can be predicted based on their phenological characteristics using machine learning algorithms. It has also been shown that information on six phenological phases may be sufficient for such predictions.

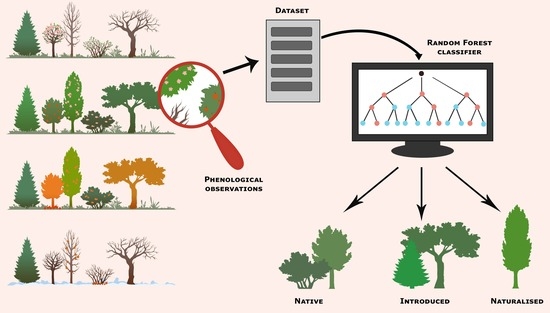
Graphical Abstract

1. Introduction

Alien plant invasions are a global threat to the ecology and economy [1,2]. Therefore, developing effective measures to monitor and control the spread of alien species is considered a biosecurity priority [3,4,5].
The study of the naturalisation processes of alien species belonging to woody biomorphs is of particular importance in determining the specifics of the regional strategy for the prevention and control of plant invasions in the steppe zone of southern Russia.
The invasion of alien trees into steppe communities during the implementation of large-scale land reclamation programmes is a well-established fact [6,7,8]. The encroachment of woody plants into herbaceous communities has been demonstrated to result in a decline in species diversity [9,10], herbaceous biomass [9], groundwater resources [11], and loss of animal habitat [12]. The fundamental problem of invasion ecology is to determine the factors of transition of an alien species into the category of invasive species [13,14].
The conceptual framework for understanding this transition is provided by the work of Richardson et al. [15], which introduces standardised terminology identifying three key stages along the ‘introduction–naturalisation–invasion’ continuum. Introduced species—taxa of alien plants in a particular area, which are present as a result of deliberate or accidental introduction through human activity. Naturalised species—alien plants that reproduce continuously and maintain populations over many life cycles without direct human intervention; they often produce offspring freely, usually near adult plants, and do not necessarily intrude into natural, semi-natural or man-made ecosystems. Invasive species are naturalised plants that produce reproductive offspring at significant distances from the parent plants and have the potential to spread over a wide area [15]. Among invasive species, those that cause significant changes to the nature, condition or appearance of ecosystems across large areas are referred to as transformers [15]. Subsequently, this three-part structure was expanded by Blackburn et al. [16], who proposed a unified classification system for biological invasions based on a series of barriers (geographical, ecological, reproductive) that a species must overcome to progress from introduction to invasion. Their system identifies four stages: transport, introduction, establishment (corresponding to naturalisation) and spread (corresponding to invasion) [16]. The main route of introduction of alien woody plants into new territories is deliberate introduction for economic, ornamental or land improvement purposes [17,18,19].
The position of an alien species along the ‘introduction–naturalisation–invasion’ gradient is subject to change over time, with the potential for naturalised species to become invasive [20,21,22]. However, not all naturalised species inevitably become invasive. As shown in a number of studies, only a proportion of naturalised species subsequently become invasive [23,24]. Moreover, the transition from naturalisation to invasion often does not occur immediately, but after a prolonged lag phase, which can last for decades or even centuries [20,25]. This phenomenon is described by the concept of ‘invasion debt’, according to which modern invasions are the consequence of introductions carried out in the past [26]. Thus, naturalised species should be regarded as potential invasive species [13], which requires preventive monitoring but does not imply that they will necessarily become invasive.
Naturalised alien species are considered a key component of plant invasion in any region [26]. The transition of a species from introduction to naturalisation is influenced by a reduced number of factors when compared to the transition from naturalisation to invasion. Consequently, the prediction of naturalisation may be more reliable than that of invasion [13]. Furthermore, the distinction between naturalised and invasive species is not always clear-cut [18].
Despite considerable progress in the field of invasion research, there remains a paucity of clarity regarding the factors that facilitate the successful invasion of alien species [27,28]. In this regard, it is of interest to study the phenological characteristics of alien plants in comparison with native species.
In modern invasion ecology, the phenological characteristics of alien plants are regarded as one of the predictors of their successful naturalisation and invasion [29,30,31]. Wolkovich and Cleland [32] proposed a concept combining four phenological strategies that contribute to invasive success: (1) occupation of temporarily vacant phenological niches (the vacant niche hypothesis), (2) priority access to resources through an earlier start to the growing season (the priority effect hypothesis), (3) a broader phenological niche compared to native species (the niche breadth hypothesis), and (4) increased phenological plasticity, allowing adaptation to changing climatic conditions (the plasticity and climate hypothesis). Empirical studies confirm that many invasive tree species are characterised by a longer growing season compared to native species. In a large-scale study covering more than 150 sites across the eastern United States, Maynard-Bean et al. [33] demonstrated that invasive shrubs retain their leaves for an average of 30–77 days longer than native species, with the greatest differences observed in the southern part of the range. This advantage allows invasive species to accumulate additional photoassimilates and creates shading during periods when native species are dormant [34]. Similar results have been obtained for invasive species in Europe: for example, McEwan et al. [35] found that Lonicera tatarica unfolds its leaves earlier and retains them longer than native competitors, giving it a competitive advantage in the forest-steppe zone.
Phenological plasticity—the ability of species to alter the timing of their phenological phases in response to variations in abiotic factors—is also a key mechanism underpinning invasive success. A meta-analysis conducted by Liao et al. [36] demonstrated the importance of genetically determined phenological plasticity in the adaptation of invasive species to new conditions. In the context of global climate change, phenological plasticity takes on particular significance: Dawson-Glass et al. [37] found in a recent review that, on average, alien species shift the timing of leaf emergence and flowering more significantly in response to warming compared to native species, which may enhance their competitive advantage.
The two dominant conceptual models of biological invasion, the vacant niche model [38] and the invader plasticity model [39], which explain features of invasive species interactions with abiotic and biotic factors, are well realised in the phenological cycle of invasive species [34,40]. However, despite significant progress in research into invasions, there remains a lack of clarity regarding which specific phenological characteristics are most informative for predicting the invasive status of alien tree species, particularly in regions with a continental climate, such as the steppe zone of southern Russia.
Another area of phenological research involves using digital proxy metrics of calendar dates to model phenological processes. One of the simplest methods of digitisation of phenological information is the translation of phenological dates into a continuous series of numbers representing the ordinal numbers of days in the year (day of year, DOY). This method has undergone a number of modifications [41]. More common and informative numerical proxy metrics in phenology are sums of temperatures, including the sum of active and the sum of effective temperatures (SAT and SET), which are widely used in modelling phenological processes [42,43]. Thermal time models, which are based on the summation of temperatures above a threshold value, are a standard tool in phenological research [44,45]. A distinction is made between ‘ecological’ thermal time models, in which the base temperature is estimated during the process of fitting the model to the data, and ‘climatological’ models, where the threshold is fixed a priori (usually at +5 °C) [43]. The first approach allows for a more accurate approximation of the true physiological response of plants, whereas the second, despite its physiological simplicity, can be useful for the comparative analysis of the thermal requirements of different species for climatological purposes.
A comparative analysis of various types of phenological models was carried out by Mehdipoor et al. [46], who analysed and compared phenological models based on the extended spring index, thermal time and photothermal time. The results show that the root mean square error (RMSE) of the extended spring index and thermal time models is similar and approximately 2 days lower than that of the other models.
In recent years, machine learning (ML) has been used in the assessment of plant phenological traits, which greatly enhances the understanding of the nature of phenological phenomena [47,48,49]. As shown in the systematic review by Katal et al. [47], various ML algorithms are used in phenological modelling, including Random Forest (RF), Gradient Boosting (GB), Support Vector Machines (SVM) and Convolutional Neural Networks (CNN). Most studies applying ML to phenology focus on the community level using remote sensing data and aim to predict vegetation indices or ecosystem productivity [50]. There are significantly fewer studies dedicated to the species-level phenology using ground-based phenological observations [47]. The study by Garnot et al. [49] presented a direct comparison of deep learning (the PhenoFormer architecture), traditional ML methods (RF, GBM) and process models for predicting phenology at the species level. The authors demonstrated that, under conditions of similar climatic distribution between the training and test samples, traditional ML methods exhibit performance comparable to deep learning (the difference in RMSE is less than 0.1 days). The RF algorithm possesses the following characteristics, which make it suitable for classifying native, introduced and invasive tree species based on phenological differences:
(1)
Accuracy comparable to that of deep learning when trained on historical climate data;
(2)
The ability to interpret results (assessment of the contribution of features), which is critical for identifying specific phenological phases that determine invasive success;
(3)
Robustness to overfitting when working with limited data;
(4)
Suitability for classification tasks rather than regression.
If sufficient phenological data are available, the use of ML may allow the identification of specific features that contribute to plant invasion.
The presented study used data from long-term phenological observations of native and alien woody plants in the Southern Federal University (SFedU) Botanical Garden. The following questions and hypotheses were formulated:
Question 1. Is it possible to predict the invasive status of alien tree species based on their phenological characteristics using machine learning methods?
Hypothesis 1.
The phenological characteristics of alien tree species allow their invasive status to be classified with high accuracy using machine learning algorithms, with the classification accuracy being significantly higher than the random level. This assumption is based on theoretical concepts suggesting that successful invasion is linked to phenological characteristics such as earlier leaf emergence, a longer growing season, or a shift in flowering times [32,34].
Question 2. Which phenological phases of alien tree species are most informative for predicting their invasive status?
Hypothesis 2.
The phenological phases most significant for distinguishing between invasive and non-invasive species are those associated with generative development (flowering, fruit ripening) and the length of the growing season. Conversely, senescence phases (leaf fall) make the smallest contribution to classification, as in temperate climates they are strictly determined by abiotic factors [30,33].
Question 3. Which of the two methods for quantifying phenological dates—day of the year (DOY) or sum of active temperatures (SAT)—provides greater accuracy in classifying invasive status?
Hypothesis 3.
The use of the SAT as a proxy metric for phenological dates provides higher classification accuracy compared to the use of calendar dates (DOY), as SAT smooths out interannual climatic variability and reflects the physiological timing of plant development [42,43].

2. Materials and Methods

2.1. Study Area

Phenological observations were carried out in the Botanical Garden of the Southern Federal University (SFedU Botanical Garden, Rostov-on-Don, Russia, 47°13′ N; 39°39′ E). The process of invasion by alien woody plants was studied in the Rostov Region (Russia).
The Rostov Region is situated in the south of the East European Plain and partly in the Ciscaucasia, within the Lower Don basin. It covers an area of 100,967 km2. The region’s terrain consists of a plain criss-crossed by river valleys and ravines. The maximum elevation above sea level is 253 m [51]. The Rostov Region is situated in a zone with a temperate continental climate.
The city of Rostov-on-Don experiences an arid climate, with moderately mild winters and hot summers [52]. The annual sum of active temperatures ranges from 3200 to 3400 °C. The annual average monthly air temperature ranges from a minimum of −5 °C in January to a maximum of +23.2 °C in July. The absolute minimum recorded was −31.9 °C, whilst the absolute maximum was recorded at +40.1 °C. The average annual precipitation is 569 mm. The mean sum of precipitation during the frost-free period is 323 mm. The average duration of the growing season in Rostov-on-Don is 216 days, extending from 1 April to 4 November [53]. Dates on which the average daily temperature crosses key thresholds in spring (rise) and autumn (fall) [54]:
-
The crossing of +5 °C occurs on 1 April (start of the growing season) and 4 November (end of the growing season);
-
The crossing of +10 °C occurs on 17 April and 12 October;
-
The temperature crosses +15 °C on 4 May and 2 October.
The region lies within two soil zones: the steppe zone of ordinary and southern chernozems, and the dry steppe zone of dark chestnut and chestnut soils [51]. The main agricultural land is situated on ordinary and southern chernozems, which are characterised by high natural fertility. Alluvial meadow soils form in river floodplains, whilst sod-sand soils are found on sandy terraces. The region lies entirely within the steppe zone of Northern Eurasia. The zonal vegetation type consists of mixed-grass, fescue and feather grass steppes, which are now preserved only in fragments on land unsuitable for ploughing. The forest cover of the territory is only 2.4%, with 62% of forested areas consisting of artificial plantations (protective forest strips, forest parks, and field-protective plantations). Natural forests are represented by three types: ravine, floodplain and arid. The Rostov Region is one of the most intensively farmed regions in Russia. Agricultural land accounts for 87.7% of the region’s land fund (8,857,000 ha out of 10,096,700 ha). Currently, arable land covers more than 60% of the region’s territory.

2.2. Objects of the Study

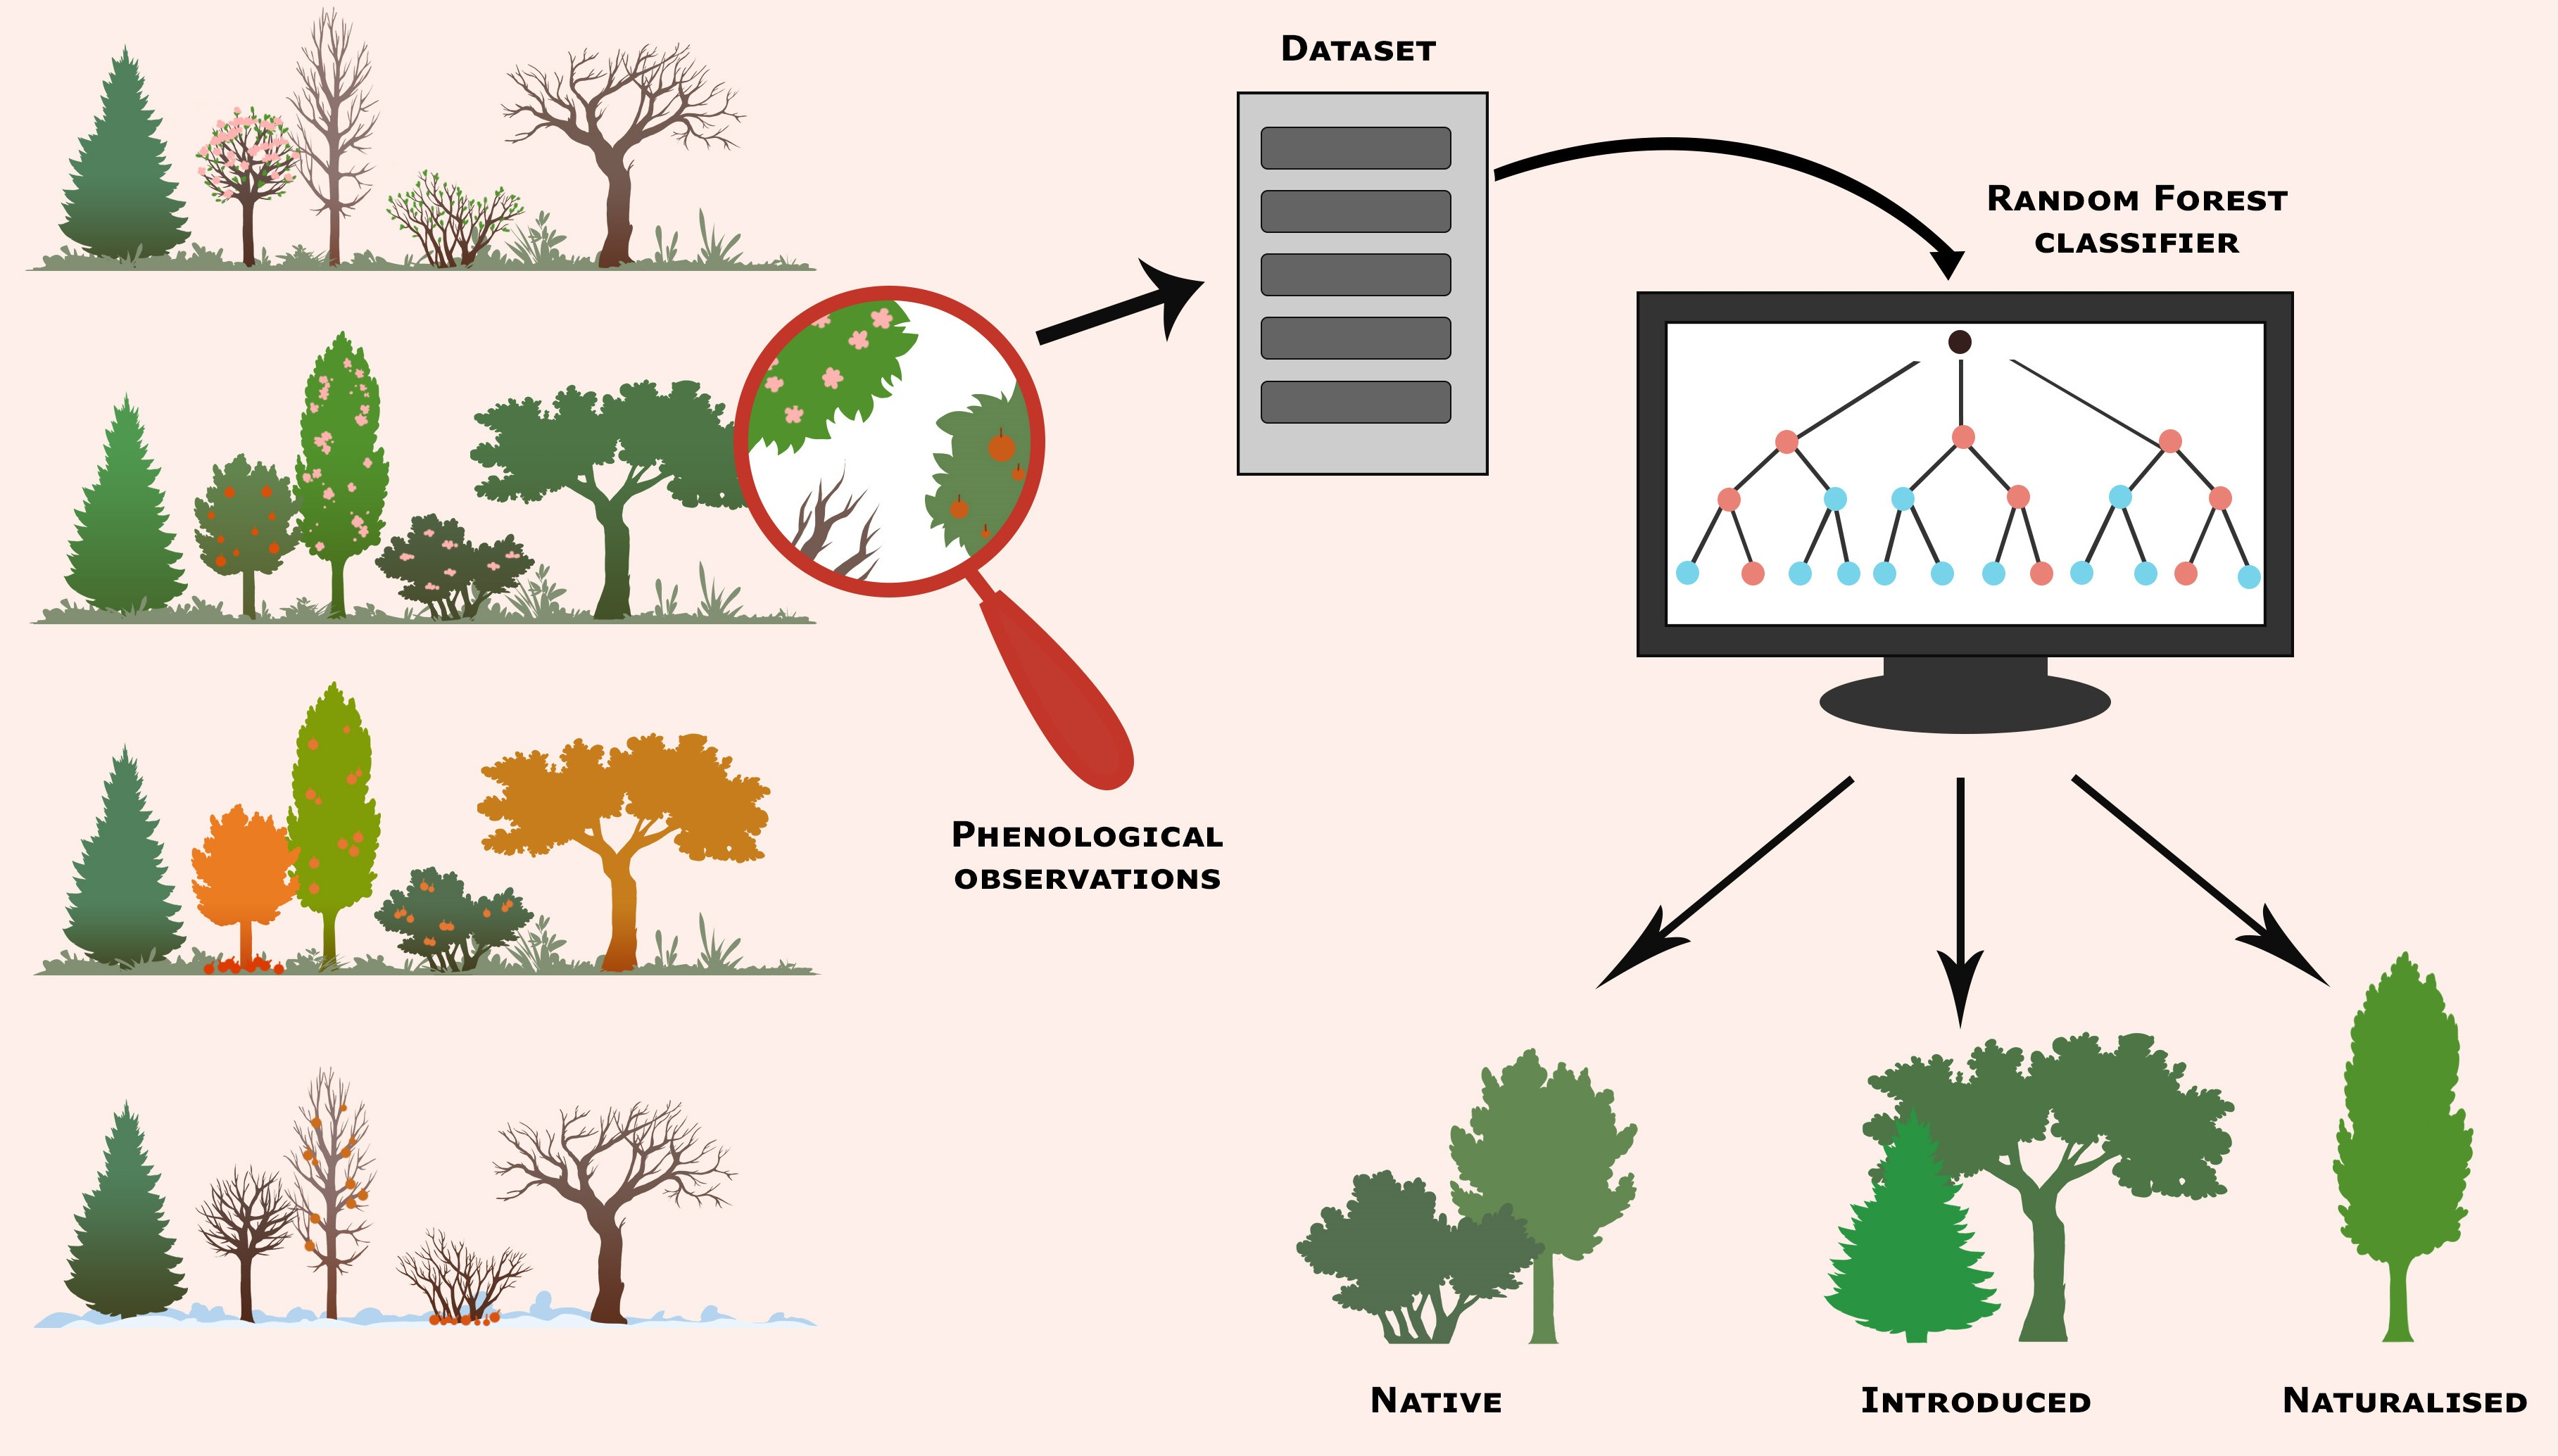
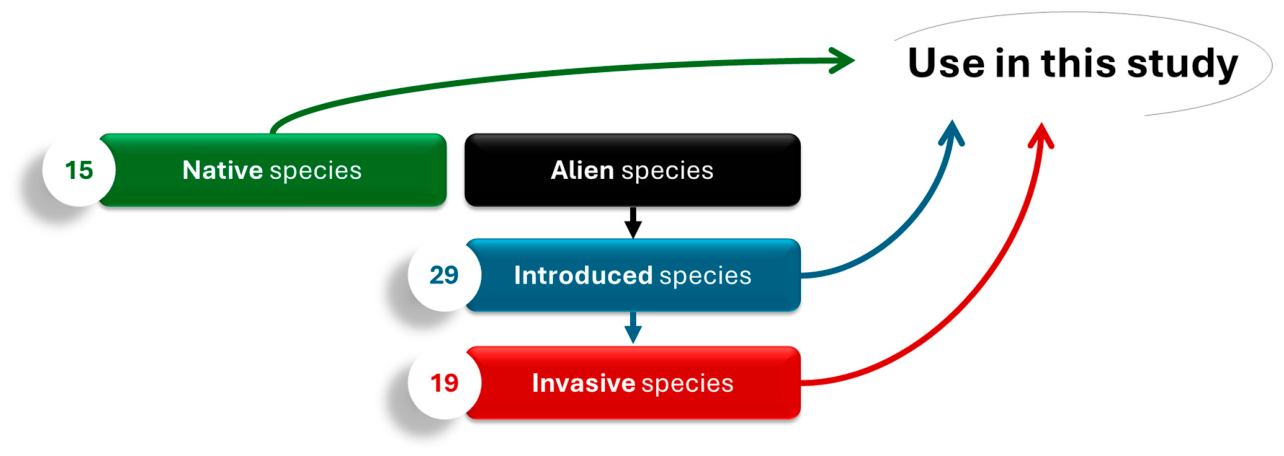
The objects of the study were native and alien species of woody plants growing on the territory of the Rostov region. The class ‘Native species’ includes 15 species. Among alien species, two categories have been classified: ‘Introduced species’ and ‘Invasive species’. The ‘Introduced species’ assemblage includes 29 species. These introduced alien species have been cultivated in the Rostov Region for a long time, but have not yet become naturalised. The ‘Invasive species’ group includes 19 alien species. The phenological characteristics of naturalised species were not studied in the research. This is because the phenological database contains systematic phenological observations for only four naturalised alien tree species (Clematis vitalba L., Colutea arborescens L., Fraxinus angustifolia subsp. oxycarpa Willd., Lonicera tatarica L.). The number of species is insufficient to generalise the phenological characteristics of this class of plants. The classification scheme for the tree species used in the study is shown in Figure 1. Lists of native, introduced and invasive species are provided in Supplementary Table S1.

2.3. Phenological Observation Methodology

The study used the results of phenological observations of woody plants carried out by the dendrology division of the SFedU Botanical Garden since 1977 [53]. Phenological observations were carried out according to the methodology standardised for botanical gardens of the USSR [55].
The protocol of phenological observations of woody plant species in botanical gardens of the USSR, compared with the BBCH system (Biologische Bundesanstalt, Bundessortenamt und CHemische Industrie) [56], is presented in Table 1.
In general, the protocol of phenological observations of woody plants, which was used in botanical gardens of the USSR, coincides with the BBCH system in terms of key phenological phases. The protocol lacks the Principal Growth Stage (PGS) ‘fruit development’. However, the PGS ‘fruit ripening’ phases are more important for successful naturalisation of alien species and are present in the protocol (Table 1).

2.4. Preprocessing of Phenological Observation Data

For further processing, calendar dates of phenological phases were converted to DOY [57]. In addition, the method of expressing phenological dates through their corresponding SAT values was used.
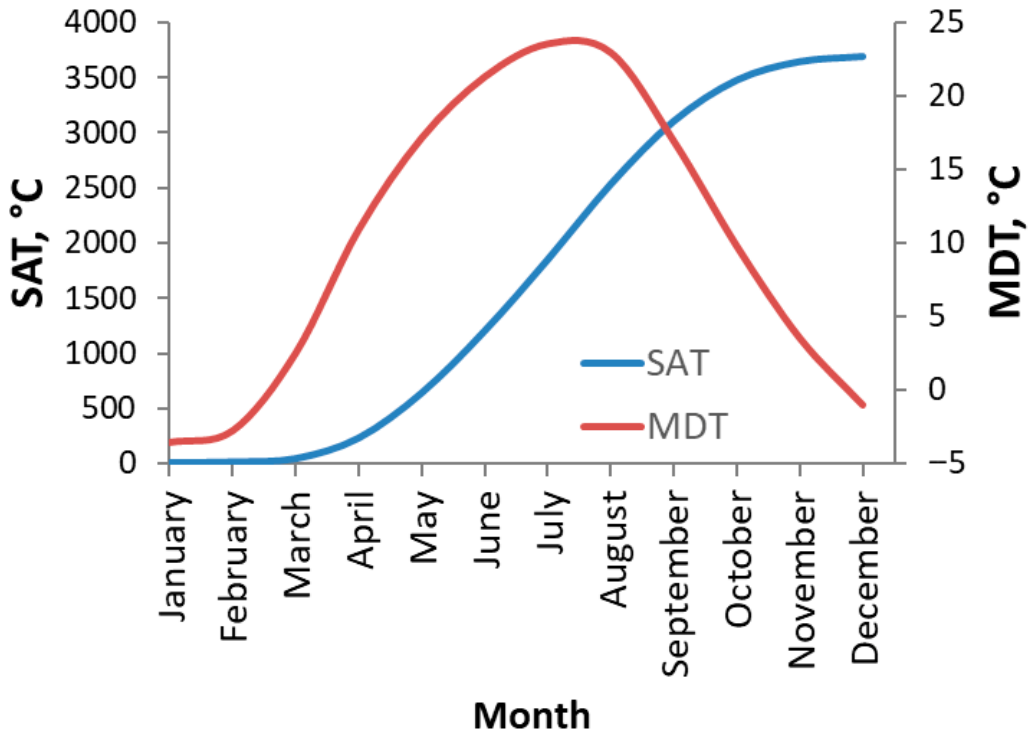
The sum of active temperatures was defined as the sum of average daily temperatures above 5 °C starting from 1 January. This temperature threshold is commonly used in phenological studies for regions with a temperate continental climate [42,43,58]. The dynamics of the averaged values of mean daily air temperatures (MDT) and SAT are presented in Figure 2.
The following interphase intervals were calculated: EF–MFR; BB–MFR; SSG–ESG (shoot growth duration); SSG–PSM; SF–EF (flowering duration); and BB–MLF (vegetation duration).

2.5. Data Processing

For data processing, a dataset was constructed, encompassing information on 18 phenological phases and 6 interphase intervals for a total of 63 species of woody plants. Phenological cycles with missing data for certain phenological phases were excluded from the dataset. The total dataset encompasses 938 individual vegetation periods (species and year of observation) and 22,512 values of phenological metrics. For each class of plants, independent training (70%) and test (30%) samples were created by randomly and irreversibly selecting growing seasons.
In the present study, Random Forest (RF) and Principal Component Analysis (PCA) were used. When using the PCA method, the raw data were standardised. The RF model utilised 100 trees and 5 node splits. A total of 100 iterations of RF modelling were performed. In each iteration of the RF model, 200 individual growing seasons were randomly selected from each class of woody plant species. This ensured the RF requirement for equality of samples between classes. Precision and the F1-score were used as performance metrics for the model. SHapley Additive exPlanations (SHAP) were used to assess the contribution of phenological characteristics to the model predictions.

3. Results

3.1. Assessment of Multicollinearity of Phenological Phases of Woody Plants

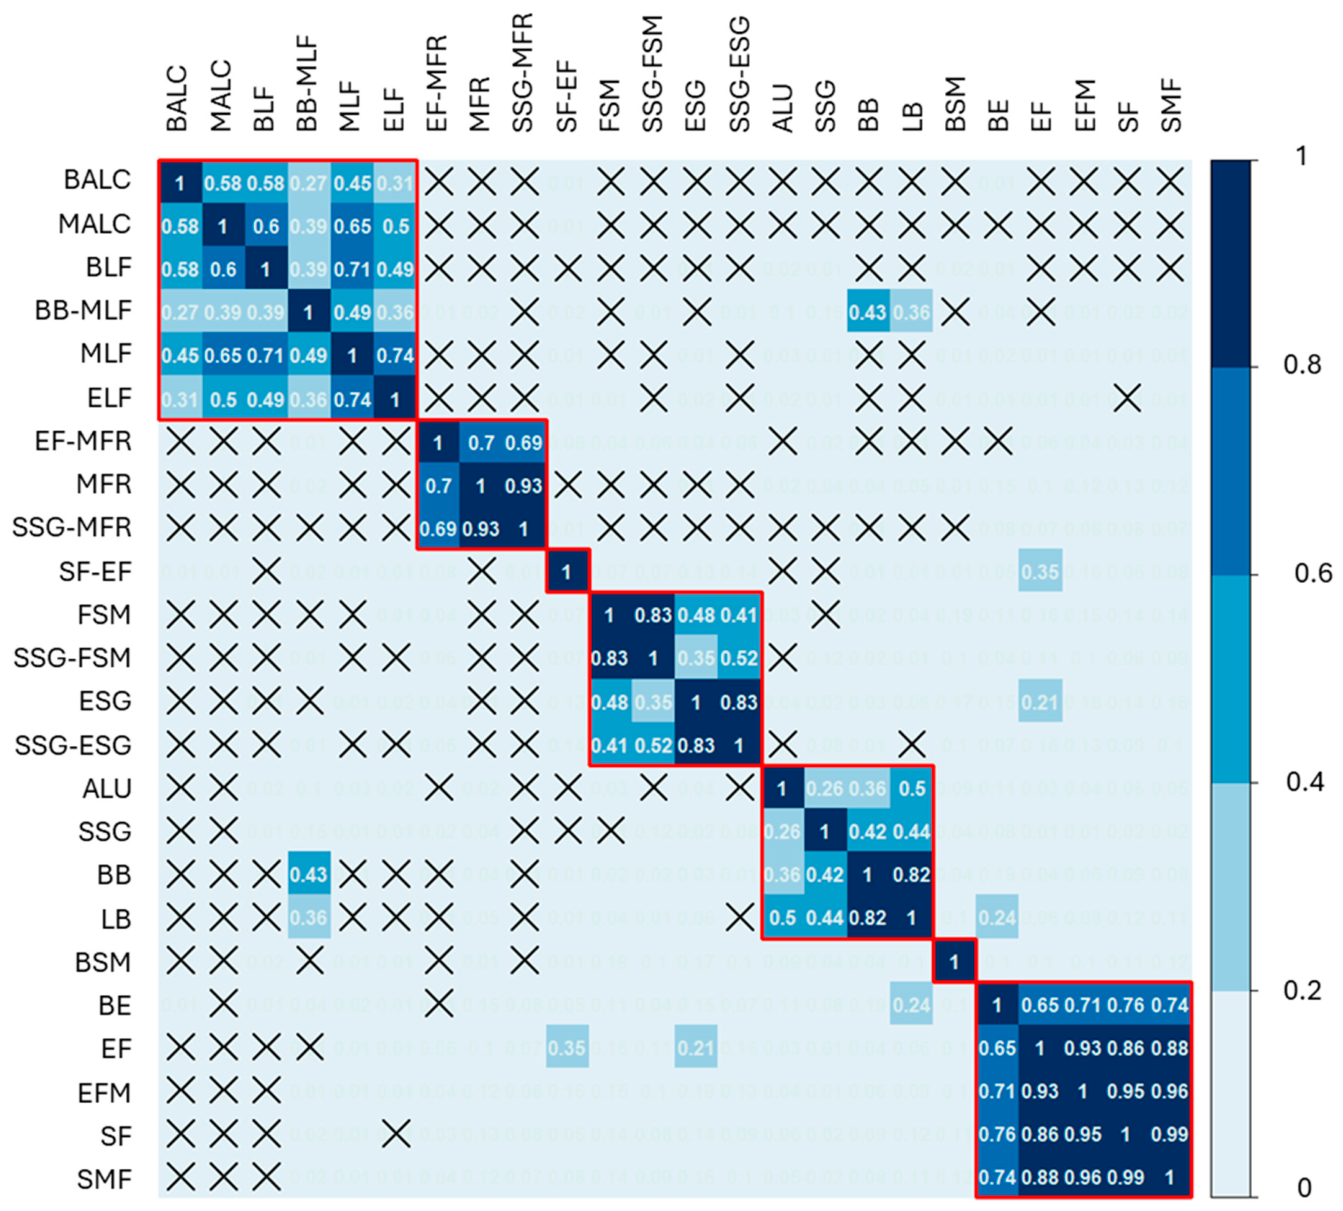
Independent variables are deemed collinear when there is a strong relationship between them (r > 0.70 or R2 > 0.49). As illustrated in Figure 3, the determination coefficient (R2) matrix of phenological phases and interphase intervals, the calendar dates of which were transformed into DOY, was used to assess the relationship between the variables. The analysis of this matrix enabled the identification of five groups of phenological metrics that exhibited strong correlation. The first group comprises phenological metrics that describe the final stage of leaf development (from the beginning of leaf colouring to the end of leaf fall). The second group combines phenological metrics that describe the cycle of seed (or fruit) development. The third group encompasses phenological metrics of shoot formation. The fourth group encompasses the initial stages of leaf development and shoot growth. The fifth group encompasses phenological metrics that delineate the flowering period. Two phenological indicators (BS, SF–EF) do not show a strong correlation with the other phenological phases and the intervals between them.
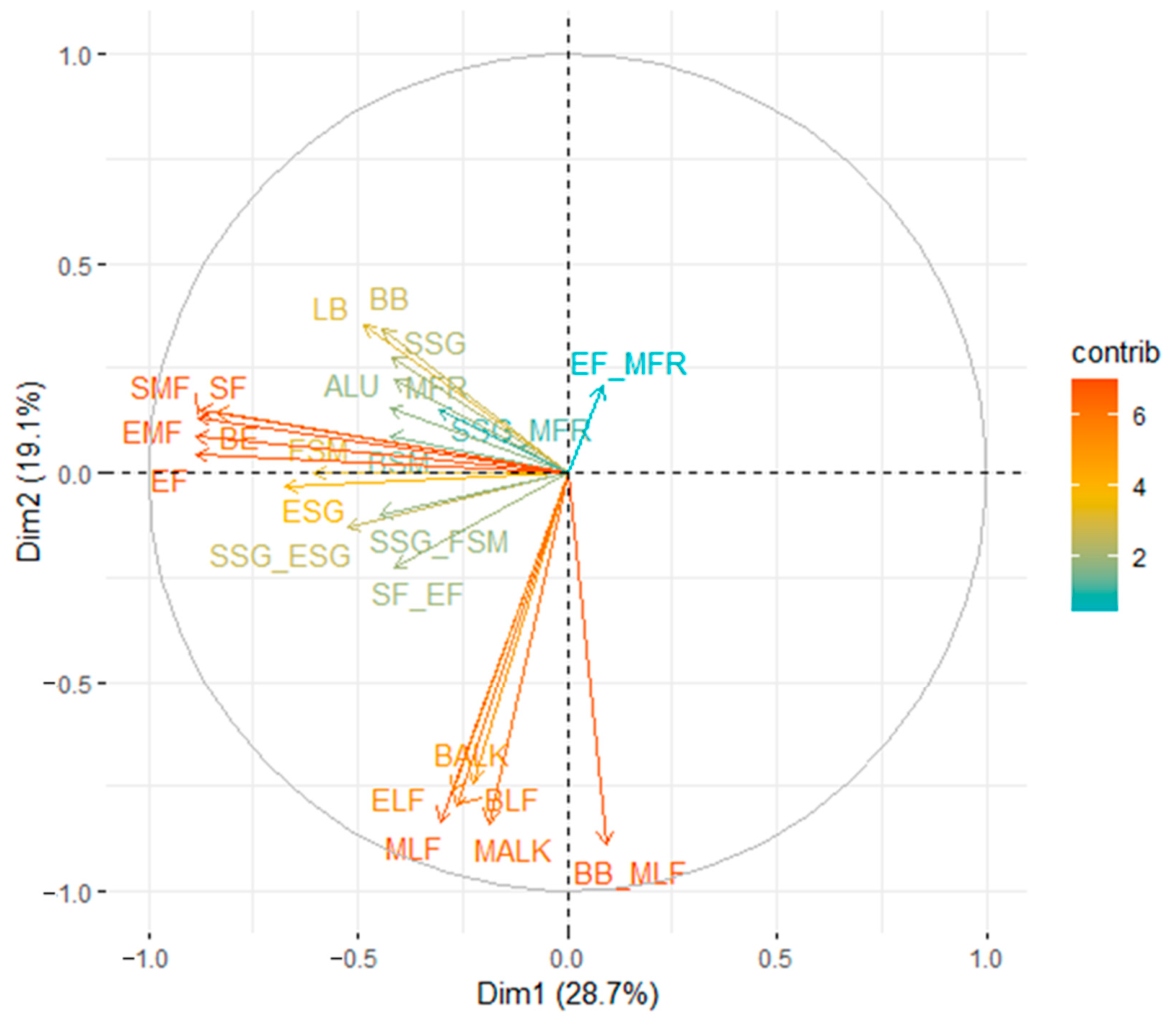
The PCA results clearly demonstrate these closely correlated groups of phenological metrics in the projection of the two principal components (Figure 4).
Thus, the number of phenological metrics that can be used as independent variables in ML algorithms can be reduced from 24 to 6. For example, the dates of the phenological phases of MLF, MFR, ESG, BB, SF and the interphase interval between SF–EF, which have the highest loadings on the first two components within their respective groups, can be used as independent variables for RF.

3.2. Results of RF Species Classification Using DOY

The results of classification for native, introduced and invasive woody plant species using the RF model are presented in Table 2.
The results of RF classification demonstrate that invasive tree species differ from native species in their phenological characteristics. The F1-score for the combination of native and invasive species classes was 79.02%. For the combination of introduced and invasive species classes: 74.85%. In this combination, invasive species are classified with moderate accuracy (F1-score = 68.7%), which may indicate their phenological heterogeneity or partial similarity to non-invasive introduced species. This, on the one hand, indicates that there is a greater similarity of phenological phases between introduced species than between native and invasive species (Table 2). On the other hand, the results highlight the presence of specific features in the phenology of invasive species, irrespective of which plant group of origin they are compared with. Thus, native, introduced and invasive plant species can be identified by phenological metrics with sufficient accuracy that is acceptable for complex biological tasks.
Reducing the number of phenological metrics from 24 to 6 by excluding closely correlated metrics slightly reduces the effectiveness of classifying invasive species (Table 3).
Reducing the number of variables in the RF model led to an average decrease in the F1 score of 3%. The results obtained (Table 3, Figure 3 and Figure 4) may serve as a basis for correction of the phenological observation protocol for invasive species.

3.3. Results of RF Species Classification Using SAT

Results of RF Model Testing

The results of RF classification of native, introduced and invasive woody plant species by SAT values corresponding to the dates of phenological phases are presented in Table 4.
Overall, the classification performance using SAT was higher than that using DOY (Table 2). The classification accuracy for the ‘Native–Invasive’ pair has improved. A convergence in accuracy across classes was observed in the ‘Introduced–Invasive’ pair.
Despite the fact that phenological features of plants are species-specific, they probably share common characteristic features for the invasive species class. This is confirmed by the results of the binary RF classification (100 modelling iterations) of specific plant species into ‘Native’ and ‘Invasive’, and ‘Introduced’ and ‘Invasive’ classes (Table 5 and Table 6).
In binary classification, 10 invasive species were classified with high accuracy (Precision ˃ 96%) (Table 5). Six invasive species were classified with medium accuracy (86 ˃ Precision ˃ 71%). Prunus armeniaca, P. cerasifera and Fraxinus pennsylvanica were classified with low accuracy (Precision < 60%). Syringa vulgaris has been classified as a native species in all iterations.
In the binary classification of invasive and introduced species, most of the invasive species were classified with high accuracy (Table 6). Juglans regia, Prunus cerasifera, P. armeniaca, P. mahaleb, Syringa vulgaris, and Ulmus pumila were classified with low accuracy. Based on the results of binary RF classifications of species of different classes, attention should be paid to Acer negundo, Ailanthus altissima, Amorpha fruticosa, Cotinus coggygria, Caragana halodendron, Morus alba, Ptelea trifoliata, Parthenocystis inserta, and Robinia pseudoacacia, which are identified as invasive species with high accuracy both in the group ‘Native–Invasive’ and in the group ‘Introduced–Invasive’. These species likely share common phenological characteristics that contribute to the success of their invasion.

3.4. Phenological Phases and Interphase Intervals Significant for Identification of Invasive Species

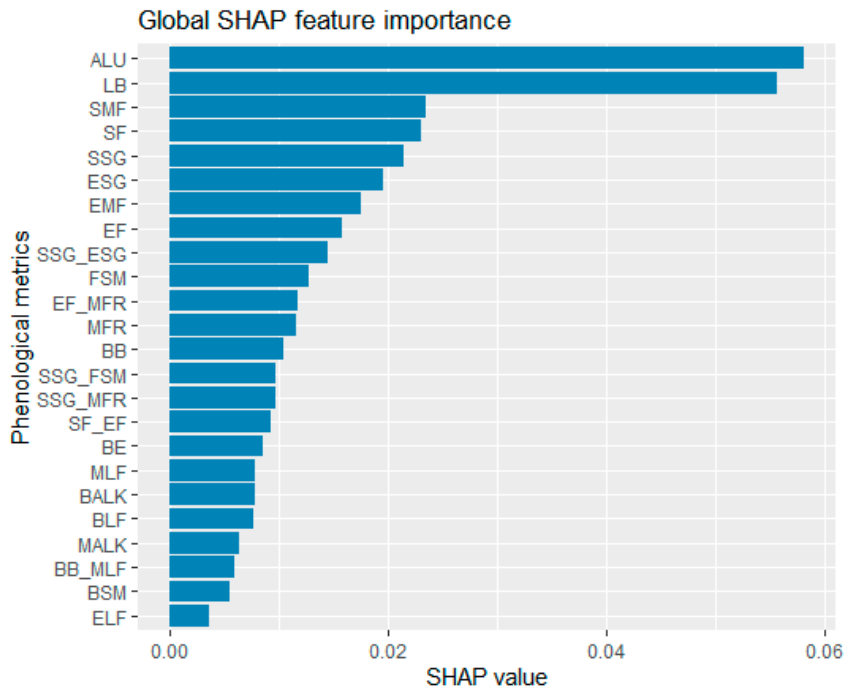
Phenological metrics significant for the identification of invasive woody plant species were determined based on the results of binary RF classification of invasive species by SHAP (Figure 5).
The ALU and LB phenological phases made the greatest contribution to the model’s forecast. The timing of leaf budding (LB) and all leaves unfolded (ALU) determines the lower boundary of the window of opportunity for plant growth and development, as well as resistance to return spring frosts. The timing (SSG, ESG) and duration (SSG–ESG) of shoot growth are also important characteristics that can ensure the success of an invasion by promoting the formation of greater biomass. Differences in the timing of the onset of flowering (SF and SMF) may reduce competition for pollinators.
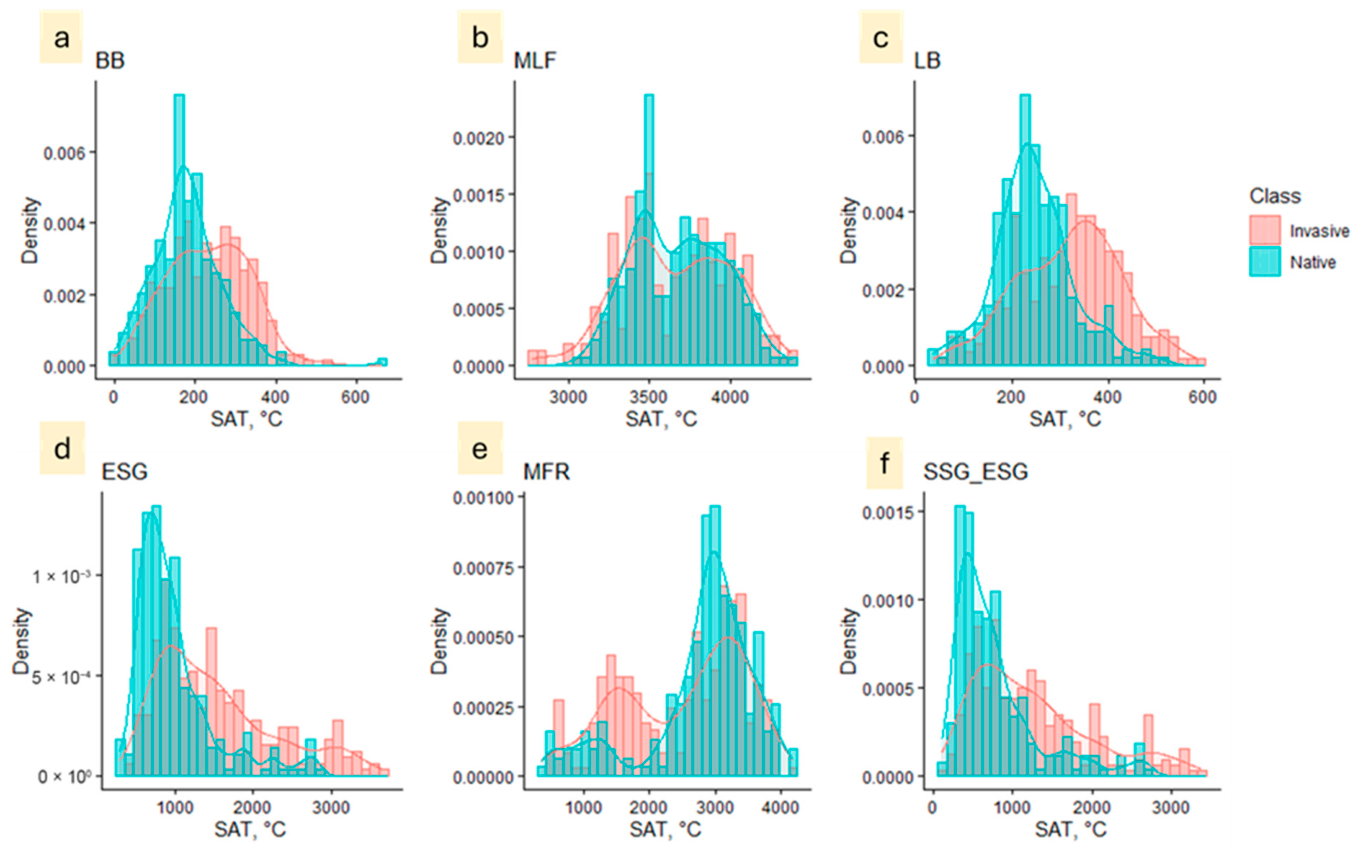
To understand the differences in phenology of native and alien species of woody plants, it is advisable to compare their requirements for heat supply during the growing season. The values of the sums of active temperatures (SAT) required for the start of vegetation (BB phenological phase) and its completion (MLF phenological phase), determine the temperature window of opportunity for the phenological development of native and invasive species. The boundaries and size of this window for native species should obviously be taken as optimal. Invasive species are more diverse in terms of the SAT requirement for the beginning of vegetation, with higher average SAT values corresponding to the phenological phase of BB than native species (Figure 6a, Table 7).
The distribution of MLF phase in native and invasive species is virtually identical and has a relatively wide SAT range (Figure 6b, Table 7).
The LB phase in invasive species is more variable than in native species and is shifted towards higher SAT and correspondingly later calendar dates. This gives invasive species a better chance to avoid damage by return frosts and spring frosts (Figure 6c). Thus, the temperature window of opportunity in invasive species is smaller than in native species due to the greater SAT required to initiate vegetation (BB).
Shoot growth (SSG–ESG) in invasive species occurs over a wider SAT range, with the range being extended by higher values (Figure 6d,f). This indicates that invasive species are more resistant to high summer temperatures than native species.
The SAT interval required for fruit ripening is the same for native and invasive species. In the composition of native and invasive species, two groups with early and late ripening dates are distinguished (Figure 6e).
In general, the average SAT values required for the realisation of phenological phases within the temperature window of opportunity and their variability (standard deviation) are higher in invasive species than in native species (Table 7). According to this characteristic, the introduced species occupy a middle position between native and invasive species.
Thus, major differences in SAT requirements between these species assemblages are observed in phases BB, LB, ALU, SSG, ESG, BE, SF, SMF, EMF, EF, and MFR, and interphase intervals BB-MFR, SSG-ESG, and EF-MFR (Table 7). These results are similar to the results of assessing the significance of phenological metrics for RF classification (Figure 5). The pattern of distribution (Figure 6) and variation in phenological metrics suggest that invasive species are more plastic to SAT than native species.

4. Discussion

Based on the results obtained in the study, it is appropriate to discuss the following issues:
  • Can ML be used to reliably predict the invasiveness of alien plant species based on phenological indicators?
  • Which phenological phases and interphase intervals are most relevant in classifying woody plants into native, introduced and invasive species?
  • Which of the two proxy metrics, DOY or SAT, is best to use in ML for classifying species by invasion status?
(1) It is suggested [32,34] that phenological differences between native and alien species may contribute to their invasion success. Four phenological strategies for the invasion of alien species have been proposed, based on differences in their phenological cycles [32]. Alien species may be more successful than native species because they occupy temporarily vacant phenological niches (vacant niche hypothesis); displace resources by being active earlier in the growing season than natives (priority effects hypothesis); have wider phenological niches than natives (niche breadth hypothesis); and/or have greater phenological plasticity that allows them to respond to climate change (plasticity hypothesis). It should also be noted that there are opposing views. Park et al. [59] and Schuster et al. [60] have shown that invasive species do not necessarily have to possess unique phenology.
In recent decades, phenological data have become widely used for models via ML and deep ML (DML). Predominantly, such models are developed to predict future phenological responses of plants to global climate change, focusing on individual phenological phases [61,62]. Modelling the phenology of agricultural plants to predict their yields and stresses of different natures is widespread [47,63].
Although the ability to predict the invasion status of alien species from their phenology based on ML and DML models is of great scientific and practical interest, such studies are currently lacking. In general, ML and DML have reached a very high level, and the reason for the absence of such studies is most likely the lack of phenological information with appropriate structure and volume. In this respect, the processes of globalisation and unification of phenological observations offer great prospects [64]. Botanical gardens, where a very large number of plant species are concentrated and, as a rule, a system of phenological observations exists, have valuable information [65]. The authors of this study managed to form a local phenological database based on observations in the SFedU Botanical Garden for 63 species of woody plants, structured by classes of native, introduced, and invasive species, 18 phenological phases, 6 interphase intervals, as well as by years of observation.
The study showed that native, introduced and invasive tree species can be classified using RF with a level of accuracy that is acceptable for complex biological tasks (Table 2 and Table 4). Based on the results of RF binary classifications, both in the “Native–Invasive” and “Introduced–Invasive” groups, species with a status confirmed by field studies as invasive for the region, such as Morus alba, Ptelea trifoliata, Parthenocystis inserta, and Robinia pseudoacacia, were identified as invasive with high accuracy (Precision ˃ 96%). Invasive species are united by a specific phenological cycle (Table 7, Figure 6). To initiate their growing season and flowering period, they require a higher SAT than native species; this enables them to avoid late spring frosts and competition for pollinators (the theory of free niche). Invasive species require a lower SAT for fruit ripening, suggesting a more efficient use of temperature resources (plasticity hypothesis). Furthermore, higher values of the standard deviation of SAT for most phenological phases indicate greater plasticity in invasive species (Table 7). Invasive species require a higher SAT for shoot growth to be completed (broad ecological niche theory). The end of the growing season occurs at the same SAT for both invasive and native species (phenological similarity theory). Thus, it can be said that the study shows that it is fundamentally possible to predict the invasion status of an alien woody plant using ML based on phenological metrics. However, the model has certain limitations due to its reliance on phenological traits common to the main group of invasive species. For example, Syringa vulgaris is incorrectly classified as a native species. We believe this is due to the fact that this invasive species has very early dates for leaves budding (LB) and all leaves unfolded (ALU), which are characteristic of most native species but not of most invasive species.
(2) There is currently no clear understanding of how many and which phenological phases should be fixed in order to explain the invasion of alien species. At the same time, most researchers focus their attention on individual phenological phases. These are predominantly phenological phases that characterise generative development [34,66]. Data on leaf development phenology are less frequently used [31].
Flowering timing is a very important but not unambiguous characteristic for separating native and alien species. Several studies have shown that alien species flower earlier and for a longer period of time [34,66]. Other studies have shown the opposite, that alien invasive species flower at the same time or later than native species [67,68,69]. In either case, the non-coincidence of flowering dates with native species is an advantage for invasive species because it increases the likelihood of successful pollination [70].
The timing of fruit formation and ripening may also be a predictor of invasive species. For ornithochore species with succulent fruits, the duration of the period from the phenological phase MFR to mass fruit falling is of great importance. The longer this interphase period, the more opportunities for dispersal of alien species [30,71]. It should be noted that in the conditions of the Rostov region, the prolonged fruiting in Morus alba (more than two months) and the very long period from MFR to their mass fall in Celtis occidentalis (from October to February), strongly beyond the capabilities of native species, are of great importance for the spread of these invasive species by birds. A very long fruit dispersal period was noted in the region for the anemochoric invasive species Acer negundo, Ailanthus altissima, Clematis vitalba, Fraxinus pennsylvanica, Ptelea trifoliata, Robinia pseudoacacia and Syringa vulgaris.
Phenological phases of leaf development are also important for the successful naturalisation of alien plants. Invasive species often have earlier leaf opening periods and longer leaf duration than native species. This results in an increased potential for solar energy gain and competitive advantage [31,35]. However, in temperate climates where the winter season is characterised by negative air temperatures, the growing season of woody plants cannot extend beyond the temperature window of opportunity for plant growth and development. Early start and late end of the growing season create a risk of damage by negative temperatures for alien species. The phases of bud dormancy and leaf development of alien species whose ranges are south of their point of introduction are later than those of native species (Figure 6, Table 6 and Table 7). In temperate climates, the phases of senescence are the least divergent between native and alien species because they are strictly regulated by climatic conditions [59].
Using RF, the elementary unit of classification is the individual phenological cycle of a specific species in a specific year. In this study, 6 out of 24 phenological metrics describing the individual phenological cycle were sufficient to classify RF (Table 3). This coincides with the Conclusion that the need to reduce the number of observed phenological phases when developing a standardised protocol for monitoring phenological responses of herbaceous plants to climate change in botanical gardens based on regression analysis was made by Nordt et al. [65]. The phenology of the invasive species Broussonetia papyrifera (L.) L’Hér. ex Vent. can be fully characterised by eight PGS [29]. Near-surface phenological observations with the Global PhenoCam usually record no more than nine phenological phases of the three PGSs [64].
(3) Two approaches are widely used in phenological data analytics of digitising calendar dates of phenological phase onset into a continuous series of numbers by translating them into DOY [72,73] or representing them as SAT [43,74].
When modelling using phenological data, it is appropriate to use SAT rather than DOY as proxy metrics for calendar dates of phenological phase onset. This approach to numerically expressing phenological metrics has several advantages:
-
SAT is a specific meteorological metric;
-
SAT is simultaneously a transformed indicator of the annual dynamics of temperatures and the timing of phenological phases;
-
The use of SAT as a numerical characteristic of phenological metrics allows, to some extent, levelling the limitations arising when comparing the phenology of different species, which are associated with the mismatch of observation periods for them;
-
Using this approach in expressing the values of phenological metrics, it is possible to assess the contribution of the temperature factor to the separation of plants with different ecological and biological properties.
In this regard, SAT can be called ‘physiological time’, which determines the total amount of heat that an organism needs to acquire to reach the subsequent developmental stages [75].
The study showed the advantage of using SAT as a proxy metric over DOY for RF classification of native, introduced and naturalised woody plant species [76,77]. The F1-score values for the identification of the class ‘invasive’ in the group ‘Native–Invasive’ were 80.7% when SAT was used and 85.0% when DOY was used, respectively. Several authors [42,74] have also shown that the use of SAT improves the accuracy of phenological models.

4.1. Limitations of the Study

The following factors may have influenced the result of the study:
For a number of species, phenological observations do not completely coincide by year (this is offset to some extent by the use of SAT as a proxy metric). There is also variation in the duration of phenological observations for species.
Phenological observations were not made for all native species. There are no data for Ulmus minor Mill. and Ulmus laevis Pall. with a characteristic early phenology of flowering and fruiting.

4.2. Further Perspectives for the Study

Further research will involve increasing the set of ML algorithms and bringing in DML techniques to classify species by their naturalisation status. Expansion of research objects, both by attracting new species and new territories. It is intended to use data from publicly available phenological databases.

5. Conclusions

The study showed that the invasive status of alien tree species can be predicted with reasonable accuracy on the basis of their phenological characteristics using an RF algorithm. The accuracy of RF classification based on phenological metrics represented as SAT is higher than when phenological metrics are expressed as DOY. The F1 scores for identifying the ‘invasive plants’ class in the ‘Native–Invasive’ and ‘Introduced–Invasive’ pairs were 85.0% and 71.2% respectively.
According to the results of binary RF classification, among alien species in both the ‘Native–Invasive’ and ‘Introduced–Invasive’ groups, species that are invasive in the region, such as Morus alba, Ptelea trifoliata, Parthenocystis inserta, and Robinia pseudoacacia, are identified with high accuracy (Precision ˃ 96%) as invasive species in the region.
According to an analysis using the SHAP method, the phenological phases ALU, LB, SMF, SF, SSG, ESG, SMF, EF, and the inter-phase interval SSG–ESG are significant for distinguishing between introduced and invasive tree species.
In the study region, invasive tree species are characterised by the following phenological features:
-
The stages of leaf development occur later, whilst the stages of leaf senescence coincide with those of native species;
-
Flowering occurs later;
-
Fruit ripening occurs simultaneously with that of native species;
-
The period from mass fruit ripening to mass fruit drop is usually very long.

Supplementary Materials

The following supporting information can be downloaded at: https://www.mdpi.com/article/10.3390/environments13040224/s1.

Author Contributions

Conceptualization, B.L.K.; Data curation, B.L.K., O.I.F. and M.V.K.; Formal analysis, B.L.K., A.A.D., P.A.D. and V.K.T.; Investigation, B.L.K., O.I.F., M.V.K., M.M.S., A.A.D., P.A.D. and V.K.T.; Methodology, B.L.K. and P.A.D.; Project administration, B.L.K. and P.A.D.; Software, A.A.D.; Writing—original draft, B.L.K., O.I.F., M.V.K., M.M.S., A.A.D., P.A.D. and V.K.T.; Writing—review and editing, B.L.K., O.I.F., M.V.K., M.M.S., A.A.D., P.A.D. and V.K.T. All authors have read and agreed to the published version of the manuscript.

Funding

The research was financially supported by the Ministry of Science and Higher Education of the Russian Federation (no. FENW-2026-0019).

Data Availability Statement

The original contributions presented in the study are included in the article; further inquiries can be directed to the corresponding author.

Acknowledgments

The authors acknowledge the support from the Strategic Academic Leadership Programme of the Southern Federal University (‘Priority 2030’).

Conflicts of Interest

The authors declare no conflicts of interest.

References

  1. Theoharides, K.A.; Dukes, J.S. Plant invasion across space and time: Factors affecting nonindigenous species success during four stages of invasion. New Phytol. 2007, 176, 256–273. [Google Scholar] [CrossRef] [Scilit]
  2. Vilà, M.; Espinar, J.L.; Hejda, M.; Hulme, P.E.; Jarošík, V.; Maron, J.L.; Pergl, J.; Schaffner, U.; Sun, Y.; Pyšek, P. Ecological impacts of invasive alien plants: A meta-analysis of their effects on species, communities and ecosystems. Ecol. Lett. 2011, 14, 702–708. [Google Scholar] [CrossRef] [Scilit]
  3. Barker, F.D.M.K.; Francis, R.A. Routledge handbook of biosecurity and invasive species. Biol. Invasions 2022, 24, 891–893. [Google Scholar] [CrossRef] [Scilit]
  4. Raffini, F.; Bertorelle, G.; Biello, R.; D’Urso, G.; Russo, D.; Bosso, L. From nucleotides to satellite imagery: Approaches to identify and manage the invasive pathogen Xylella fastidiosa and its insect vectors in Europe. Sustainability 2020, 12, 4508. [Google Scholar] [CrossRef] [Scilit]
  5. Rainford, J.; Crowe, A.; Jones, G.; van den Berg, F. Early warning systems in biosecurity; translating risk into action in predictive systems for invasive alien species. Emerg. Top. Life Sci. 2020, 4, 453–462. [Google Scholar] [CrossRef] [Scilit] [PubMed]
  6. Tokhtar, V.K.; Kurskoy, A.Y. Invasive plant species of steppe sites in the south-west of the Central Russian Upland (Belgorod region). In Steppes of Northern Eurasia: Proceedings of the X International Symposiu; IOP Publishing: Bristol, UK, 2024. [Google Scholar] [CrossRef]
  7. Sudnik-Wójcikowska, B.; Moysiyenko, I.; Slim, P.; Moraczewski, I. Impact of the invasive species Elaeagnus angustifolia L. on vegetation in pontic desert steppe ZONE (Southern Ukraine). Pol. J. Ecol. 2009, 57, 269–281. [Google Scholar]
  8. Lepeshkina, L.A.; Klevtsova, M.A. The Ecological and Coenotic Role of Invasive Woody Plants in Forest-Steppe Ecosystems. Ecosystems 2024, 38, 113–123. [Google Scholar] [CrossRef] [Scilit]
  9. Soto-Shoender, J.R.; McCleery, R.A.; Monodjem, A.; Gwinn, D.C. The importance of grass cover for mammalian diversity and habitat associations in bush encroached savanna. Biol. Conserv. 2018, 221, 127–136. [Google Scholar] [CrossRef] [Scilit]
  10. Pinheiro, L.F.P.; Kansbock, L.; Rossato, D.R.; Kolb, R.M. Woody plant encroachment constrains regeneration of ground-layer species in a neotropical savanna from seeds. Austral Ecol. 2022, 47, 674–684. [Google Scholar] [CrossRef] [Scilit]
  11. Acharya, B.S.; Kharel, G.; Zou, C.B.; Wilcox, B.P.; Halihan, T. Woody plant encroachment impacts on groundwater recharge: A review. Water 2018, 10, 1466. [Google Scholar] [CrossRef] [Scilit]
  12. Cuellar-Soto, E.; Johnson, P.J.; Macdonald, D.W.; Barrett, G.A.; Segundo, J. Woody plant encroachment drives habitat loss for a relict population of a large mammalian herbivore in South America. Therya 2020, 11, 484–494. [Google Scholar] [CrossRef] [Scilit]
  13. Richardson, D.M.; Pyšek, P. Naturalization of introduced plants: Ecological drivers of biogeographical patterns. New Phytol. 2012, 196, 383–396. [Google Scholar] [CrossRef] [Scilit]
  14. Rojas-Sandoval, J.; Acevedo-Rodríguez, P. Naturalization and invasion of alien plants in Puerto Rico and the Virgin Islands. Biol. Invasions 2015, 17, 149–163. [Google Scholar] [CrossRef] [Scilit]
  15. Richardson, D.M.; Pyšek, P.; Rejmánek, M.; Barbour, M.G.; Panetta, F.D.; West, C.J. Naturalization and invasion of alien plants: Concepts and definitions. Divers. Distrib. 2000, 6, 93–107. [Google Scholar] [CrossRef] [Scilit]
  16. Blackburn, T.M.; Pyšek, P.; Bacher, S.; Carlton, J.T.; Duncan, R.P.; Jarošı’k, V.; Wilson, J.R.U.; Richardson, D.M. A proposed unified framework for biological invasions. Trends Ecol. Evol. 2011, 26, 333–339. [Google Scholar] [CrossRef] [Scilit]
  17. Reichard, S.H.; White, P. Horticulture as a pathway of invasive plant introductions in the United States: Most invasive plants have been introduced for horticultural use by nurseries, botanical gardens, and individuals. Bioscience 2001, 51, 103–113. [Google Scholar] [CrossRef] [Scilit]
  18. Dong, B.-C.; Yang, Q.; Kinlock, N.L.; Pouteau, R.; Pyšek, P.; Weigelt, P.; Yu, F.-H.; van Kleunen, M. Naturalization of introduced plants is driven by life-form-dependent cultivation biases. Divers. Distrib. 2024, 30, 55–70. [Google Scholar] [CrossRef] [Scilit]
  19. Kozlovsky, B.L.; Dmitriev, P.A.; Kuropyatnikov, M.V.; Fedorinova, O.I. Woody flora of the Northern city cemetery of the Rostovon-Don city, Russia. Ecosyst. Transform. 2025, 8, 108–122. [Google Scholar] [CrossRef] [Scilit]
  20. Kowarik, I. Time lags in biological invasions with regard to the success and failure of alien species. In Plant Invasions: General Aspects and Special Problems; Pyšek, P., Prach, K., Rejma’nek, M., Wade, M., Eds.; SPB Academic Publishers: Amsterdam, The Netherlands, 1995; pp. 15–38. [Google Scholar]
  21. Bertolino, S.; Sciandra, C.; Bosso, L.; Russo, D.; Lurz, P.W.; Di Febbraro, M. Spatially explicit models as tools for implementing effective management strategies for invasive alien mammals. Mammal Rev. 2020, 50, 187–199. [Google Scholar] [CrossRef] [Scilit]
  22. Daly, E.Z.; Chabrerie, O.; Massol, F.; Facon, B.; Hess, M.C.; Tasiemski, A.; Grandjean, F.; Chauvat, M.; Viard, F.; Forey, E. A synthesis of biological invasion hypotheses associated with the introduction–naturalisation–invasion continuum. Oikos 2023, 5, e09645. [Google Scholar] [CrossRef] [Scilit]
  23. Caley, P.; Groves, R.H.; Barker, R. Estimating the invasion success of introduced plants. Biol. Invasions 2008, 10, 161–173. [Google Scholar] [CrossRef] [Scilit]
  24. Milbau, A.; Stout, J.C. Factors associated with alien plants transitioning from casual, to naturalized, to invasive. Conserv. Biol. 2008, 22, 308–317. [Google Scholar] [CrossRef] [Scilit]
  25. Bufford, J.L.; Dawes, T.N.; Hulme, P.E. Species that invade natural areas have shorter lag times than other naturalized ornamental species. Ecography 2025, 7, 1–9. [Google Scholar] [CrossRef] [Scilit]
  26. Essl, F.; Dullinger, S.; Rabitsch, W.; Hulme, P.E.; Hülber, K.; Jarošı’k, V.; Kleinbauer, I.; Krausmann, F.; Kühn, I.; Nentwig, W.; et al. Socioeconomic legacy yields an invasion debt. Proc. Natl. Acad. Sci. USA 2011, 108, 203–207. [Google Scholar] [CrossRef] [Scilit]
  27. Van Kleunen, M.; Dawson, W.; Maurel, N. Characteristics of successful alien plants. Mol. Ecol. 2014, 24, 1954–1968. [Google Scholar] [CrossRef] [Scilit]
  28. El-Barougy, R.F.; Dakhil, M.A.; Abdelaal, M.; El-Keblawy, A.; Bersier, L.-F. Trait-Environment Relationships Reveal the Success of Alien Plants Invasiveness in an Urbanized Landscape. Plants 2021, 10, 1519. [Google Scholar] [CrossRef] [Scilit]
  29. Maan, I.; Kaur, A.; Singh, H.P.; Batish, D.R.; Kohli, R.K. Evaluating the role of phenology in managing urban invasions: A case study of Broussonetia papyrifera. Urban For. Urban Green. 2020, 48, 126583. [Google Scholar] [CrossRef] [Scilit]
  30. Ferreras, A.E.; Ashworth, L.; Giorgis, M.A. Uncoupled flowering and fruiting phenology as the strategy of non-native invasive woody species in seasonally dry ecosystems. Biol. Invasions 2023, 25, 365–377. [Google Scholar] [CrossRef] [Scilit]
  31. Woods, M.J.; Bauer, J.T.; Schaeffer, D.; McEwan, R.W. Pyrus calleryana extracts reduce germination of native grassland species, suggesting the potential for allelopathic effects during ecological invasion. PeerJ 2023, 11, e15189. [Google Scholar] [CrossRef] [Scilit] [PubMed]
  32. Wolkovich, E.M.; Cleland, E.E. The phenology of plant invasions: A community ecology perspective. Front. Ecol. Environ. 2011, 9, 287–294. [Google Scholar] [CrossRef] [Scilit]
  33. Maynard-Bean, E.; Kaye, M.; Wagner, T.; Burkhart, E. Citizen scientists record novel leaf phenology of invasive shrubs in eastern U.S. forests. Biol. Invasions 2020, 22, 3325–3337. [Google Scholar] [CrossRef] [Scilit]
  34. Zettlemoyer, M.A.; Schultheis, E.H.; Lau, J.A. Phenology in a warming world: Differences between native and non-native plant species. Ecol. Lett. 2019, 22, 1253–1263. [Google Scholar] [CrossRef] [Scilit]
  35. Mcewan, R.W.; Birchfield, M.K.; Schoergendorfer, A.; Arthur, M.A. Leaf phenology and freeze tolerance of the invasive shrub Amur honeysuckle and potential native competitors. J. Torrey Bot. Soc. 2009, 136, 212–221. [Google Scholar] [CrossRef] [Scilit]
  36. Liao, H.; D’Antonio, C.M.; Chen, B.; Huang, Q.; Peng, S. How much do phenotypic plasticity and local genetic variation contribute to phenotypic divergences along environmental gradients in widespread invasive plants? A meta-analysis. Oikos 2016, 125, 905–917. [Google Scholar] [CrossRef] [Scilit]
  37. Dawson-Glass, E.; Schiafo, R.; Stuble, K.L. Toward a comprehensive understanding of the phenological responses of nonnative plants to climate warming: A review. Ann. Bot. 2025, 135, 6. [Google Scholar] [CrossRef] [Scilit] [PubMed]
  38. Elton, C.S. The Ecology of Invasions by Animals and Plants, 2000th ed.; University of Chicago Press: Chicago, IL, USA, 1958. [Google Scholar]
  39. Richards, C.L.; Bossdorf, O.; Muth, N.Z.; Gurevitch, J.; Pigliucci, M. Jack of all trades, master of some? On the role of phenotypic plasticity in plant invasions. Ecol. Lett. 2006, 9, 981–993. [Google Scholar] [CrossRef] [Scilit] [PubMed]
  40. Wolkovich, E.M.; Davies, T.J.; Schaefer, H.; Cleland, E.E.; Cook, B.I.; Travers, S.E.; Willis, C.G.; Davis, C.C. Temperature-dependent shifts in phenology contribute to the success of exotic species with climate change. Am. J. Bot. 2013, 100, 1407–1421. [Google Scholar] [CrossRef] [Scilit]
  41. Ivlev, I.V. On the statistical processing of phenological dates in botanical research. Izv. Nats Acad. Sci. Repub. Kazakhstan Ser. Biol. Med. 2014, 1, 49–65. [Google Scholar]
  42. Ocokoljić, M.; Petrov, D.; Galečić, N.; Skočajić, D.; Košanin, O.; Simović, I. Phenological Flowering Patterns of Woody Plants in the Function of Landscape Design: Case Study Belgrade. Land 2023, 12, 706. [Google Scholar] [CrossRef] [Scilit]
  43. Zhang, R.; Wang, F.; Zheng, J.; Chen, L.; Hänninen, H.; Wu, J. Temperature sum models in plant spring phenology studies: Two commonly used methods have different fields of application. J. Exp. Bot. 2024, 75, 6011–6016. [Google Scholar] [CrossRef] [Scilit]
  44. Schwartz, M.D. Phenology: An Integrative Environmental Science, 2nd ed.; Springer: Berlin/Heidelberg, Germany, 2013. [Google Scholar] [CrossRef] [Scilit]
  45. Picornell, A.; Caspersen, L.; Luedeling, E. The influence of calibration data diversity on the performance of temperature-based spring phenology models for forest tree species in Central Europe. Agric. For. Meteorol. 2025, 360, 110302. [Google Scholar] [CrossRef] [Scilit]
  46. Mehdipoor, H.; Zurita-Milla, R.; Izquierdo-Verdiguier, E. Exploring differences in spatial patterns and temporal trends of phenological models at continental scale using gridded temperature time-series. Int. J. Biometeorol. 2020, 64, 409–421. [Google Scholar] [CrossRef] [Scilit]
  47. Katal, N.; Rzanny, M.; Mäder, P.; Wäldchen, J. Deep Learning in Plant Phenological Research: A Systematic Literature Review. Front. Plant Sci. 2022, 13, 805738. [Google Scholar] [CrossRef] [Scilit] [PubMed]
  48. Gao, C.; Wang, H.; Ge, Q. Interpretable machine learning algorithms to predict leaf senescence date of deciduous trees. Agric. For. Meteorol. 2023, 340, 109623. [Google Scholar] [CrossRef] [Scilit]
  49. Garnot, V.S.F.; Spafford, L.; Lever, J.; Sigg, C.; Pietragalla, B.; Vitasse, Y.; Gessler, A.; Wegner, J.D. Deep learning meets tree phenology modelling: PhenoFormer versus process-based models. Methods Ecol. Evol. 2025, 16, 1489–1506. [Google Scholar] [CrossRef] [Scilit]
  50. Cao, M.; Sun, Y.; Jiang, X.; Li, Z.; Xin, Q. Identifying leaf phenology of deciduous broadleaf forests from phenocam images using a convolutional neural network regression method. Remote Sens. 2021, 13, 2331. [Google Scholar] [CrossRef] [Scilit]
  51. Krasavin, S.V.; Kushnareva, A.V.; Grinev, A.I.; Kovtun, N.N.; Tolcheeva, S.V.; Anpilogova, E.V.; Larina, N.V.; Astashov, V.D.; Khaustov, A.Y.; Nikitina, S.A.; et al. On the state of the environment and natural resources of the Rostov region in 2024. Ecol. Bull. Don 2024, 370. [Google Scholar]
  52. Ruseeva, Z.M.; Narodetskaya, S.S.; Molodkin, P.F. Agroclimatic Resources of Rostov Region; Gidrometeoizdat: Leningrad, Russia, 1972; p. 251. [Google Scholar]
  53. Kozlovsky, B.L.; Kuropyatnikov, M.V.; Fedorinova, O.I. Phenology of Woody Introducers of the Botanical Garden of SFU; Rostov-on-Don-Taganrog Southern Federal University: Rostov-on-Don, Russia, 2020. [Google Scholar]
  54. Shver, T.A.; Ivanchenko, T.E. Climate of Rostov-on-Don; Nauka: Moscow, Russia, 1987; p. 233. [Google Scholar]
  55. Aleksandrova, M.S.; Bulygin, N.E.; Voroshilov, V.N. Methodology of Phenological Observations in Botanical Gardens of the USSR; M Izd-vo GBS AS USS: Moscow, Russia, 1975; p. 28. [Google Scholar]
  56. Meier, U.; Bleiholder, H.; Buhr, L.; Feller, C.; Hack, H.; Hess, M.; Lancashire, P.D.; Schnock, U.; Stauß, R.; van den Boom, T.; et al. The BBCH system to coding the phenological growth stages of plants—History and publications. J. Kult. 2009, 61, 41–52. [Google Scholar]
  57. Zaitsev, G.N. Phenology of Woody Plants; Nauka: Moscow, Russia, 1981; 120p. [Google Scholar]
  58. Richardson, A.D.; Keenan, T.F.; Migliavacca, M.; Ryu, Y.; Sonnentag, O.; Toomey, M. Climate change, phenology, and phenological control of vegetation feedbacks to the climate system. Agric. For. Meteorol. 2013, 169, 156–173. [Google Scholar] [CrossRef] [Scilit]
  59. Park, D.S.; Huynh, K.M.; Feng, X. Phenological similarity and distinctiveness facilitate plant invasions. Glob. Ecol. Biogeogr. 2024, 33, e13839. [Google Scholar] [CrossRef] [Scilit]
  60. Schuster, M.J.; Wragg, P.D.; Reich, P.B. Phenological niche overlap between invasive buckthorn and native woody species. For. Ecol. Manag. 2021, 498, 119568. [Google Scholar] [CrossRef] [Scilit]
  61. Dai, W.; Jin, H.; Zhang, Y.; Liu, T.; Zhou, Z. Detecting temporal changes in the temperature sensitivity of spring phenology with global warming: Application of machine learning in phenological model. Agric. For. Meteorol. 2019, 279, 107702. [Google Scholar] [CrossRef] [Scilit]
  62. Dai, W.; Jin, H.; Zhou, L.; Liu, T.; Zhang, Y.; Zhou, Z.; Fu, Y.; Jin, G. Testing machine learning algorithms on a binary classification phenological model. Glob. Ecol. Biogeogr. 2022, 1, 32. [Google Scholar] [CrossRef] [Scilit]
  63. Pearson, K.D.; Nelson, G.; Aronson, M.F.J.; Bonnet, P.; Brenskelle, L.; Davis, C.C.; Denny, E.G.; Ellwood, E.R.; Goëau, H.; Heberling, J.M.; et al. Machine Learning Using Digitized Herbarium Specimens to Advance Phenological Research. Bioscience 2020, 70, 610–620. [Google Scholar] [CrossRef] [Scilit] [PubMed]
  64. Jose, K.; Chaturvedi, R.K.; Jeganathan, C.; Behera, M.D.; Singh, C.P. Plugging the Gaps in the Global PhenoCam Monitoring of Forests—The Need for a PhenoCam Network across Indian Forests. Remote Sens. 2023, 15, 5642. [Google Scholar] [CrossRef] [Scilit]
  65. Nordt, B.; Hensen, I.; Bucher, S.F.; Freiberg, M.; Primack, R.B.; Stevens, A.-D.; Bonn, A.; Wirth, C.; Jakubka, D.; Plos, C.; et al. The PhenObs initiative: A standardised protocol for monitoring phenological responses to climate change using herbaceous plant species in botanical gardens. Funct. Ecol. 2021, 35, 821–834. [Google Scholar] [CrossRef] [Scilit]
  66. Pyšek, P.; Sadlo, J.; Mandak, B.; Jarosik, V. Czech alien flora and the historical pattern of its formation: What came first to Central Europe? Oecologia 2003, 135, 122–130. [Google Scholar] [CrossRef] [Scilit] [PubMed]
  67. Celesti-Grapow, L.; Di Marzio, P.; Blasi, C. Temporal niche separation of the alien flora of Rome. In Plant Invasions: Ecological Threats and Management Solutions Leiden Backhuys; Backhuys Publishers: Leiden, The Netherlands, 2003; pp. 101–111. [Google Scholar]
  68. Lloret, F.; Medail, F.; Brundu, G.; Camarda, I.; Moragues, E.; Rita, J.; Lambdon, P.; Hulme, P.E. Species attributes and invasion success by alien plants on Mediterranean islands. J. Ecol. 2005, 93, 512–520. [Google Scholar] [CrossRef] [Scilit]
  69. Godoy, O.; Richardson, D.M.; Valladares, F.; Castro-Díez, P. Flowering phenology of invasive alien plant species compared with native species in three Mediterranean-type ecosystems. Ann. Bot. 2009, 103, 485–494. [Google Scholar] [CrossRef] [Scilit]
  70. Sargent, R.D.; Ackerly, D.D. Plant–pollinator interactions and the assembly of plant communities. Trends Ecol. Evol. 2008, 23, 123–130. [Google Scholar] [CrossRef] [Scilit]
  71. Lediuk, K.D.; Damascos, M.A.; Puntieri, J.G.; Svriz, M. Differences in phenology and fruit characteristic between invasive and native woody species favor exotic species invasiveness. Plant Ecol. 2014, 215, 1455–1467. [Google Scholar] [CrossRef] [Scilit]
  72. Geissler, C.; Davidson, A.; Niesenbaum, R.A. The influence of climate warming on flowering phenology in relation to historical annual and seasonal temperatures and plant functional traits. PeerJ 2023, 11, 15188. [Google Scholar] [CrossRef] [Scilit]
  73. Guralnick, R.; Crimmins, T.; Grady, E.; Campbell, L. Phenological response to climatic change depends on spring warming velocity. Commun. Earth Environ. 2024, 5, 634. [Google Scholar] [CrossRef] [Scilit]
  74. Xu, Z.; Liu, Q.; Du, W.; Zhou, G.; Qin, L.; Sun, Z. Modelling leaf phenology of some trees with accumulated temperature in a temperate forest in northeast China. For. Ecol. Manag. 2021, 489, 119085. [Google Scholar] [CrossRef] [Scilit]
  75. Łysiak, G.P.; Szot, I. The Use of Temperature Based Indices for Estimation of Fruit Production Conditions and Risks in Temperate Climates. Agriculture 2023, 13, 960. [Google Scholar] [CrossRef] [Scilit]
  76. Kozlovsky, B.L.; Fedorinova, O.I.; Kuropyatnikov, M.V.; Sereda, M.M.; Dmitrieva, A.A.; Dmitriev, P.A. Introduction Policy of the Botanical Garden of Southern Federal University and Problems of Managing Invasive Woody Plants. J. Zool. Bot. Gard. 2025, 6, 63. [Google Scholar] [CrossRef] [Scilit]
  77. Kozlovsky, B.L.; Kuropyatnikov, M.V.; Fedorinova, O.I.; Sereda, M.M.; Kapralova, O.A.; Dmitriev, P.A.; Varduni, T.V. Adventive tree species in urban flora of Rostov-on-Don. Ukr. J. Ecol. 2016, 6, 430–437. [Google Scholar] [CrossRef]
Figure 1. Classification scheme of woody plant species used in the study.
Environments 13 00224 g001
Figure 2. Dynamics of mean MDT and SAT values over the period of phenological observations (1977–2023, data from the archives of the ‘North Caucasus Directorate for Hydrometeorology and Environmental Monitoring’).
Environments 13 00224 g002
Figure 3. The coefficient of determination matrix for the phenological metrics in DOY. The cross indicates a non-significant correlation. The red frame indicates groups of phenological metrics obtained as a result of hierarchical clustering.
Environments 13 00224 g003
Figure 4. Projection of phenological metrics values onto the first two principal components.
Environments 13 00224 g004
Figure 5. Results of the assessment of the contribution of phenological characteristics to the model’s forecast using SHAP.
Environments 13 00224 g005
Figure 6. Histogram of SAT values of native and naturalised species at the onset of phenological phases BB (a), MLF (b), LB (c), ESG (d), MFR (e) and interphase interval SSG–ESG (f).
Environments 13 00224 g006
Table 1. Protocol of phenological observations of woody plant species in botanical gardens of the USSR in comparison with BBCH.
Protocol of Phenological Observations of Woody Plant Species During the Introduction TrialBiologische Bundesanstalt, Bundessortenamt und CHemische Industrie (BBCH)
Principal Growth StagePhenological PhasePhenological PhasePrincipal Growth Stage
Leaf development Bud swelling *01 Beginning of bud swell0 Bud dormancy
Buds budding (BB)07 Beginning of bud break
Leaves budding (LB)11 First leaves unfolded1 Leaf development
All leaves unfolded (ALU)19 All leaves unfolded
Beginning of autumn leaf colouring (BALC)90 A few leaves on a tree turned yellow9 Senescence
Massive autumn leaf colouring (MALC)92 Onset of autumn colouring of leaves
Beginning of the leaf fall (BLF)93 Beginning of leaf fall
Mass leaf fall (MLF)95 Fifty percent leaf fall
End of the leaf fall (ELF)99 End of leaf fall
Shoot formationStart of shoot growth (SSG)31 Ten percent final shoot extension3 Main stem elongation
End of shoot growth (ESG)39 Maximum shoot length
Beginning of shoot maturation (BSM)
Full maturation of shoots (FSM)
Secondary growth of shoots *
BloomingBud emergence (BE)51 Buds are uncovered and start to swell5 Inflorescence development
Flowering of buds *59 The first petals are visible outside the sepals, but all flowers are still closed
Start of Flowering (SF)60 First flowers opened6 Flowering
Start of mass flowering (SMF)65–50% Full flowering
End of mass flowering (EMF)67–70% Of flowers opened, with early opened flowers dried out
End of flowering (EF)69 Flower fading, with most of the flowers dried out
FruitingStart of fruit ripening *81 Beginning of ripening8 Fruit ripening
Mass of fruit ripening (MFR)85 The fruits are brown in colour and fully ripened
Mass fruit falling *89–90% of seeds have dispersed
Note: * These phenological phases were not used in the classification of species by ML because they are recorded with a large error, and the data are not complete.
Table 2. Results of RF classification for native, introduced and invasive woody plant species by DOY using 24 phenological metrics.
GroupsMean F1-Score After 100 Iterations, %
NativeIntroducedInvasiveMean Value for Group
Native–Introduced–Invasive56.48 *
55.58–57.39 **
71.40
70.85–71.95
62.15
61.39–62.92
63.35
62.79–63.91
Native–Introduced64.01
63.45–64.57
84.06
83.62–84.50
74.03
73.36–74.71
Native–Invasive77.35
76.64–78.05
80.70
80.09–81.30
79.02
78.41–79.64
Introduced–Invasive81.05
80.58–81.52
68.65
67.94–69.35
74.85
74.30–75.40
Note: * Mean F1-score. ** Confidence interval for the F1-score, at a significance level of p = 0.05.
Table 3. Results of RF classification for native, introduced and invasive woody plant species by DOY using 6 phenological metrics.
GroupsMean F1-Score After 100 Iterations, %
NativeIntroducedInvasiveMean Value for Group
Native–Introduced–Invasive52.75 *
51.82–53.69 **
66.55
66.02–67.08
57.73
57.03–58.43
59.01
58.56–59.46
Native–Introduced58.66
57.76–59.56
81.20
80.82–81.58
69.93
69.35–70.51
Native–Invasive76.66
75.95–77.37
79.93
79.36–80.50
78.30
77.71–78.89
Introduced–Invasive78.83
78.43–79.24
63.44
62.77–64.11
71.14
70.67–71.61
Note: * Mean F1-score. ** Confidence interval for the F1-score, at a significance level of p = 0.05.
Table 4. Results of RF classification for native, introduced and invasive woody plant species by SAT using 24 phenological metrics.
GroupsMean F1-Score After 100 Iterations, %
NativeIntroducedInvasiveMean Value for Group
Native–Introduced–Invasive57.89 *
56.96–58.83 **
71.84
71.30–72.39
69.26
68.54–69.98
66.33
65.78–66.88
Native–Introduced59.12
58.15–60.08
81.31
80.86–81.76
70.21
69.57–70.86
Native–Invasive82.51
81.94–83.07
85.03
84.54–85.52
83.77
83.28–84.27
Introduced–Invasive80.83
80.38–81.29
71.18
70.57–71.79
76.01
75.52–76.49
Note: * Mean F1-score. ** Confidence interval for the F1-score, at a significance level of p = 0.05.
Table 5. Results of binary RF classification for native and invasive woody plant species by SAT using 24 phenological metrics. Test sample.
SpeciesClassifiedPrecision, %Class
TotalCorrectIncorrect
Cotinus coggygria7217210100.0Invasive species
Morus alba6776770100.0
Parthenocissus inserta5325320100.0
Ptelea trifoliata3793790100.0
Robinia pseudoacacia2742740100.0
Caragana halodendron353352199.7
Ailanthus altissima413408598.8
Ribes aureum518511798.6
Amorpha fruticosa5255131297.7
Prunus mahaleb4344221297.2
Prunus armeniaca170161994.7
Ulmus pumila4724304291.1
Lycium barbarum2482212789.1
Acer negundo82464617878.4
Celtis occidentalis59045713377.5
Juglans regia1601174373.1
Prunus cerasifera45328117262.0
Fraxinus pennsylvanica4667639016.3
Syringa vulgaris12901290.0
Ligustrum vulgare428427199.8Native species
Crataegus monogyna392390299.5
Sambucus nigra475468798.5
Tilia cordata4974861197.8
Acer tataricum7477093894.9
Euonymus europaeus3793582194.5
Pyrus communis4294052494.4
Acer platanoides8988386093.3
Acer campestre6025455790.5
Populus × canescens4123238978.4
Populus alba43733410376.4
Quercus robur66949117873.4
Fraxinus excelsior62030831249.7
Salix alba1732914416.8
Summary15,49613,289220782.8
Table 6. Results of binary RF classification for introduced and invasive woody plant species by SAT using 24 phenological metrics. Test sample.
SpeciesClassifiedPrecision, %Class
TotalCorrectIncorrect
Parthenocissus inserta550541998.4Invasive species
Robinia pseudoacacia249243697.6
Morus alba6916731897.4
Ptelea trifoliata3173051296.2
Cotinus coggygria7707195193.4
Amorpha fruticosa4814166586.5
Ailanthus altissima4353696684.8
Fraxinus pennsylvanica4784037584.3
Caragana halodendron3703036781.9
Acer negundo85165919277.4
Celtis occidentalis56041414673.9
Lycium barbarum2421786473.6
Ribes aureum50635415270.0
Prunus cerasifera47721026744.0
Prunus armeniaca138498935.5
Juglans regia1604911130.6
Prunus mahaleb44512132427.2
Ulmus pumila479324476.7
Syringa vulgaris15901590.0
Acer tataricum subsp. ginnala5925920100.0Introduced species
Aesculus hippocastanum5955950100.0
Lonicera chrysantha5775770100.0
Lonicera demissa2532530100.0
Lonicera ruprechtiana3673670100.0
Lonicera xylosteum5115110100.0
Prunus serotina3643640100.0
Lonicera maackii379378199.7
Pyrus elaeagnifolia436428898.2
Lonicera korolkovii4864731397.3
Tilia europea4063941297.0
Cotoneaster lucidus4223972594.1
Lonicera trichosantha6615946789.9
Crataegus submollis5174635489.6
Acer pseudoplatanus5715086389.0
Cornus alba5244665888.9
Betula pendula subsp. pendula5214348783.3
Acer saccharinum72359313082.0
Cerasus vulgaris4403469478.6
Ulmus glabra43130312870.3
Acer monspessulanum subsp. ibericum60741918869.0
Colutea media27817010861.2
Catalpa bignonioides40020219850.5
Cotoneaster roseus147697846.9
Prunus tomentosa37314522838.9
Gymnocladus dioicus44611133524.9
Celtis australis3816831317.8
Summary20,76616,258450874.5
Table 7. Statistical values for SAT by phenological phase and interphase intervals for native, introduced and invasive species.
Phenological PhaseNativeIntroducedInvasive
Mean ± Standard DeviationMedianMean ± Standard DeviationMedianMean ± Standard DeviationMedian
BB181.0 ± 85.1173.5169.8 ± 89.8161.0232.6 ± 99.3234.0
LB246.6 ± 82.8241.0238.1 ± 96.6225.0319.9 ± 106.4330.0
ALU410 ± 218.6373.5388.2 ± 135.7360.0501.5 ± 154.1507.0
BALC3419.4 ± 3583412.03425.2 ± 349.43391.03395.8 ± 4363398.5
MALC3592.2 ± 3173576.03591.2 ± 324.23571.03581.3 ± 352.13570.5
BLF3533.1 ± 305.33530.03499.7 ± 346.63463.03497.7 ± 388.53479.0
MLF3676.3 ± 276.33687.03643.2 ± 319.83654.03663.1 ± 333.73655.0
ELF3756.2 ± 272.93767.53722.8 ± 311.33740.03750.1 ± 311.93749.0
SSG210.0 ± 85.4204.0204.5 ± 136.4189.0274.9 ± 133.5270.5
ESG985.7 ± 512.5836.01087.8 ± 569930.01521.3 ± 765.11355.0
BSM648.1 ± 267.2592.0704.2 ± 300.4614.0780.7 ± 329.4686.5
FSM2040.7 ± 651.62022.52023.2 ± 639.21947.02365.4 ± 728.92351.5
BE241.5 ± 131.1211.5265.5 ± 178.3241.0323 ± 216.5284.0
SF460.6 ± 286.6371.5490.9 ± 259.1464.0543.3 ± 337.5448.5
SMF495.7 ± 299.2398.0532.9 ± 268.8503.0590.6 ± 358.5483.5
EMF597.5 ± 344.4478.0652.9 ± 342.5609.0718.1 ± 442.7584.0
EF675.2 ± 379561.0733.9 ± 350.3678.0807.5 ± 496.4658.5
MFR2780.6 ± 840.42960.52447.4 ± 938.52730.02496 ± 934.42761.5
BB–MLF3495.4 ± 289.93467.03473.4 ± 327.13471.03430.4 ± 326.43405.0
SSG–ESG775.7 ± 545.8612.5883.3 ± 547.2711.01246.5 ± 755.81079.5
SSG–FSM1830.7 ± 683.51803.51818.7 ± 6251748.02090.6 ± 716.62079.5
SF–EF214.6 ± 127.8176.0243.1 ± 143.7211.0264.2 ± 249.5204.5
EF–MFR2105.4 ± 858.12214.01713.5 ± 827.51846.01688.6 ± 901.11675.0
BB–MFR2570.7 ± 830.12742.52242.9 ± 917.52514.02221.2 ± 930.72525.0
Disclaimer/Publisher’s Note: The statements, opinions and data contained in all publications are solely those of the individual author(s) and contributor(s) and not of MDPI and/or the editor(s). MDPI and/or the editor(s) disclaim responsibility for any injury to people or property resulting from any ideas, methods, instructions or products referred to in the content.