Article

How Altitude Affects the Phenolic Potential of the Grapes of cv. ‘Fokiano’ (Vitis vinifera L.) on Ikaria Island

Laboratory of Viticulture, Department of Crop Science, School of Plant Sciences, Agricultural University of Athens, 75 Iera Odos Street, GR-11855 Athens, Greece
*
Author to whom correspondence should be addressed.
Environments 2025, 12(9), 320; https://doi.org/10.3390/environments12090320
Submission received: 8 July 2025 / Revised: 8 September 2025 / Accepted: 9 September 2025 / Published: 11 September 2025

Abstract

Climate is one of the main factors that significantly impacts the terroir of vineyards by directly affecting vine growth, yield, and berry composition, which, in turn, are key to the quality characteristics of the wines produced. Climate change poses new challenges, especially in insular regions where changing grapevine varieties is limited due to Protected Designation of Origin (PDO) rules. Cultivating vines at higher altitudes may prove to be a potential solution. This study aimed to investigate the phenolic potential of the skins and seeds of cv. ‘Fokiano’, cultivated at two different altitudes, namely, 200 m and 800 m, on the Greek island of Ikaria, during 2019–2021. The results showed that grapes from 200 m exhibited higher values for weight, length, and width, while those from 800 m exhibited higher berry water content and higher skin-to-grape ratios. In addition, higher values of anthocyanins, enhancing the grapes’ color and phenolic composition, were recorded in grapes harvested at 800 m. It is, therefore, evident that higher altitudes can help grapes exhibit higher anthocyanin content and titratable acidity. Consequently, the choice of an altitude can counteract the phenomenon of early ripening caused by climate change. Adaptation strategies based on the present study’s observations may constitute viable long-term recommendations for vineyard establishment, especially in insular regions where it is not possible to move geographically to northern latitudes.

1. Introduction

The grapevine is a crop that can be cultivated in many regions around the world. Be that as it may, its growth and productivity are significantly influenced by abiotic stresses, such as heat, drought, salinity, and increases in temperature. Those parameters are becoming more extreme worldwide due to the repercussions of climate change [1]. To a large extent, the quality characteristics of the grapes are affected by the interaction of the vine with the terroir where it is cultivated. The so-called climate change is currently introducing the need to apply novel methods in viticultural practice. Consequently, vine growers worldwide need to access scientific data for a better understanding of all the factors affecting berry development and quality. The past few decades have seen a continuous increase in both air temperature and CO2 concentration, together with lengthier periods of drought. Moreover, these changes have a significant impact on the physiology and biochemistry of the vines and, subsequently, on the berries’ composition and quality [2,3].
What is needed is a deeper understanding of how higher temperatures affect the phenological stages of the grapevine. More specifically, through that understanding, winegrowers will better understand timing and duration, which will enable them to implement more accurate temperature reduction methods as needed [4]. A possible long-term solution could be to move vineyards to higher geographical latitudes, where average temperatures favor vines, and which, subsequently, may gradually become more suitable for grapevine cultivation [5]. However, in insular regions of various countries, a change of this type may prove challenging to implement. In the case of Greece, shifting the location to a higher geographical latitude to avoid the effects of climate change could be a challenging task: the limited size of the Greek islands, as well as the need to protect Protected Designation of Origin (PDO) wines produced in specific areas of those regions, may inhibit such projects. Thus, higher altitudes may be characterized as the minimum level where vine growth is affected in a different manner [6]. Great thermal fluctuations and strong solar radiation, particularly ultraviolet-B (UV-B) radiation, are the main characteristics of such altitudes [7].
The main organoleptic wine characteristics, namely, color and aroma, are associated with the biochemical characteristics of the berries at technological maturity [2,3]. At the same time, the main chemical compounds found in grapes and berries destined for winemaking are sugars, organic acids, and phenolic compounds [2,8,9]. Hot and dry climate areas have been known to affect berry primary metabolism: the accumulation of sugars, such as glucose and fructose, the accumulation and degradation of organic acid (malic acid), and certain amino acids, such as phenylalanine, can be affected by high temperatures [10,11,12,13,14,15,16].
Moreover, sugars are indirectly affected by the size of the berries as well as their water content. Increased sugar accumulation per berry is a result of smaller berry size, as found in grapes that come from high altitudes. That is caused by the increased oxidative stress resulting from UV-B radiation [5]. Berry ripening at such altitudes appears to be delayed due to the prevailing lower temperatures. Sugar accumulation is also delayed due to reduced photosynthetic activity caused by increased UV-B radiation [5]. Still, sugar concentration may increase indirectly due to moisture loss caused by evaporation [6].
Solar radiation and temperature are the main environmental parameters affecting the synthesis of phenolic compounds [17]. Several studies have shown a positive correlation between altitude and the production of anthocyanins and flavonols [7,18,19]. That relationship is linked to the enhancement of berry defense against oxidative stress through the increase in phenolic compounds with antioxidant action [7,20]. These compounds are synthesized under stress conditions, such as injury or increased exposure to UV-B radiation [21]. A study on wines of the ‘Merlot’ and ‘Cabernet Sauvignon’ grapevine varieties at three altitudes (2282, 2435, and 2608 m, respectively) revealed that wines from higher altitudes exhibited integrated taste and more intense aroma [22]. In another study assessing the effect of increased temperatures, UV-B radiation, and CO2 on the development of berries of the grapevine cultivar ‘Tempranillo’, it was revealed that grape ripening was accelerated due to increased carbon fixation. Nevertheless, UV-B radiation moderated those effects [23]. What is more, the biosynthetic pathway of anthocyanins seemed to have been activated because of increased UV-B radiation, leading to a higher concentration of anthocyanins in the berries [24]. However, UV-B radiation reduced oxidative damage caused by increased temperatures by triggering antioxidant responses [23]. Still, it is worth noting that high levels of UV-B radiation before veraison may cause sunburn damage to the grapes [25].
At the same time, as is the case with higher altitudes, when lower temperatures prevail, anthocyanins in leaves decrease the level of oxidative damage and increase the photosynthetic rate [26]. As a result, the degree of abiotic stress tolerance can often be predicted on the basis of anthocyanin presence [1]. Evaluation of the effects of cooler night temperatures at higher altitudes revealed that those cooler temperatures contribute to the reduced breakdown of malic acid and increased anthocyanin concentration, leading to better quality grapes at harvest [27].
The aim of the present study was to assess the effect of altitude on berry quality. To our knowledge, the current study provides important information regarding the potential establishment of vineyards at higher altitudes, especially in insular regions, considering the continually fluctuating climate conditions. This could constitute a solution to mitigating the effects of climate change on the earlier ripening of many varieties and the associated impact on acidity.

2. Materials and Methods

2.1. Plant Material, Vineyard Information, and Climatic Data

The experiment was carried out during three consecutive cultivation periods (2019, 2020, and 2021) on vines of the grape cultivar ‘Fokiano’ (Vitis vinifera L.).
Grapevine cultivar ‘Fokiano’ (Figure 1) is a red grapevine cultivar of the Eastern Mediterranean Basin. Its possible place of origin is the small Asia Minor town of Fokea (Phocaea), after which ‘Fokiano’ is most likely named [28]. There are many regions in Greece where ‘Fokiano’ is grown, but its main cultivation center is the island of Ikaria. There, the cultivar occupies more than 70% of the cultivation areas devoted to vineyards. It is a vigorous and productive variety and is quite resistant to drought. It can adapt perfectly to dry and warm areas, producing grapes with a rich aroma. In view of the ramifications of climate change, it is important to mention that ‘Fokiano’ preserves its acidity levels during technological maturity [28].
It is known that the quality and quantity characteristics of grapes, independently of their final use (wine grapes, table grapes, raisins), are affected by terroir. In viticulture, the term terroir refers to the sum of interactions between the basic components of an ecosystem in a given area. These components include climate, soil properties, altitude, grapevine cultivar and rootstock used, the age of the vines, pruning and training systems, and others [6].
Given that in insular regions, the areas for grapevine cultivation are characterized by limited geography, it is not always possible to locate multiple sites that share the same properties in terms of the above-mentioned components of terroir.
For the purposes of the current experiment, to isolate the effect of altitude and minimize all other variability factors between the different possible locations, the vineyards were selected on the basis of their uniformity.
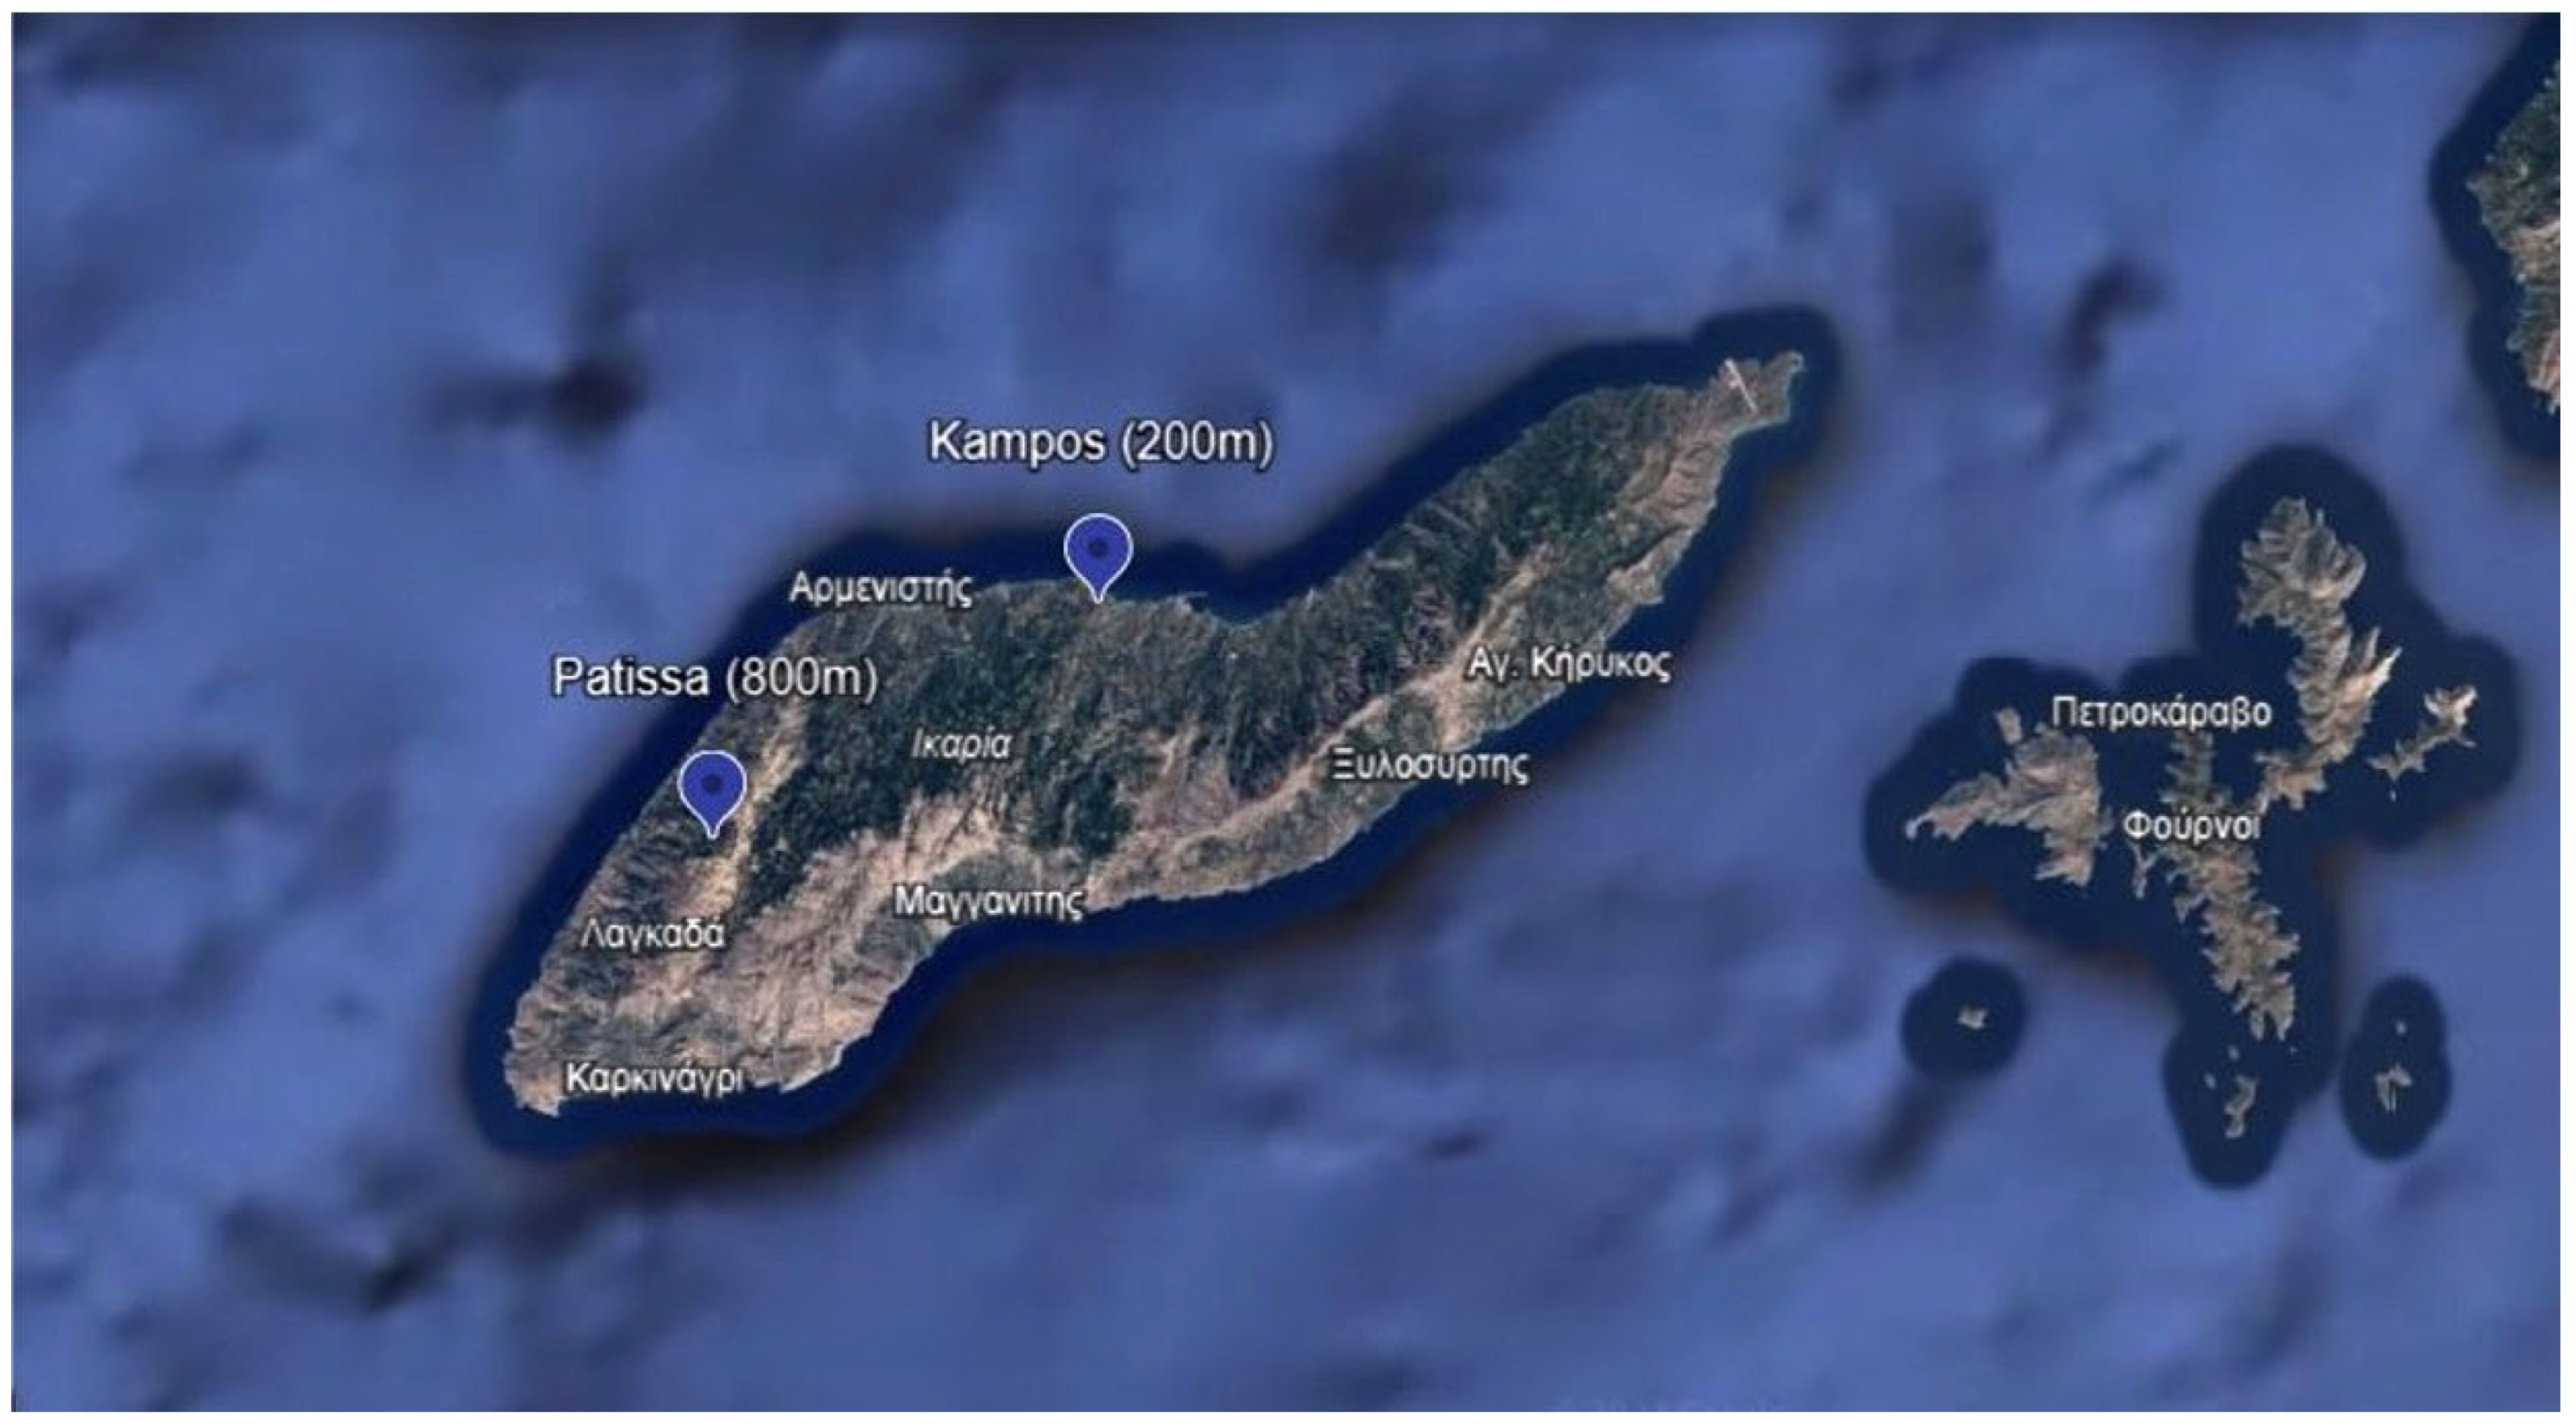
The vineyards are currently utilized for commercial application, and they are located in the northern part of Ikaria Island (37.5967° N, 26.1123° E), in the eastern Aegean Sea region of Greece (Figure 2).
The two vineyards where the samples were collected, as well as their characteristics, are shown in Table 1. More specifically, both vineyards (V800P and V200K) share the same soil properties, the same cultivation and training systems, with their only difference being the altitude of their location. One vineyard (V800P) is located in Patissa at an altitude of 800 m, and the other one (V200K) is located lower, in Kampos, at an altitude of 200 m. The vines under study were all grafted on rootstock Richter 110. They were head-trained in the goblet/bush vine form, with 1–2 node spurs per arm (3–5 arms). Neither of the two vineyards was irrigated.
The meteorological data were collected from weather stations located in proximity to the selected vineyards on the island of Ikaria and are presented in Appendix A. The meteorological parameters involved in the data collection were maximum, minimum, and average air temperature (°C), as well as monthly precipitation (mm).
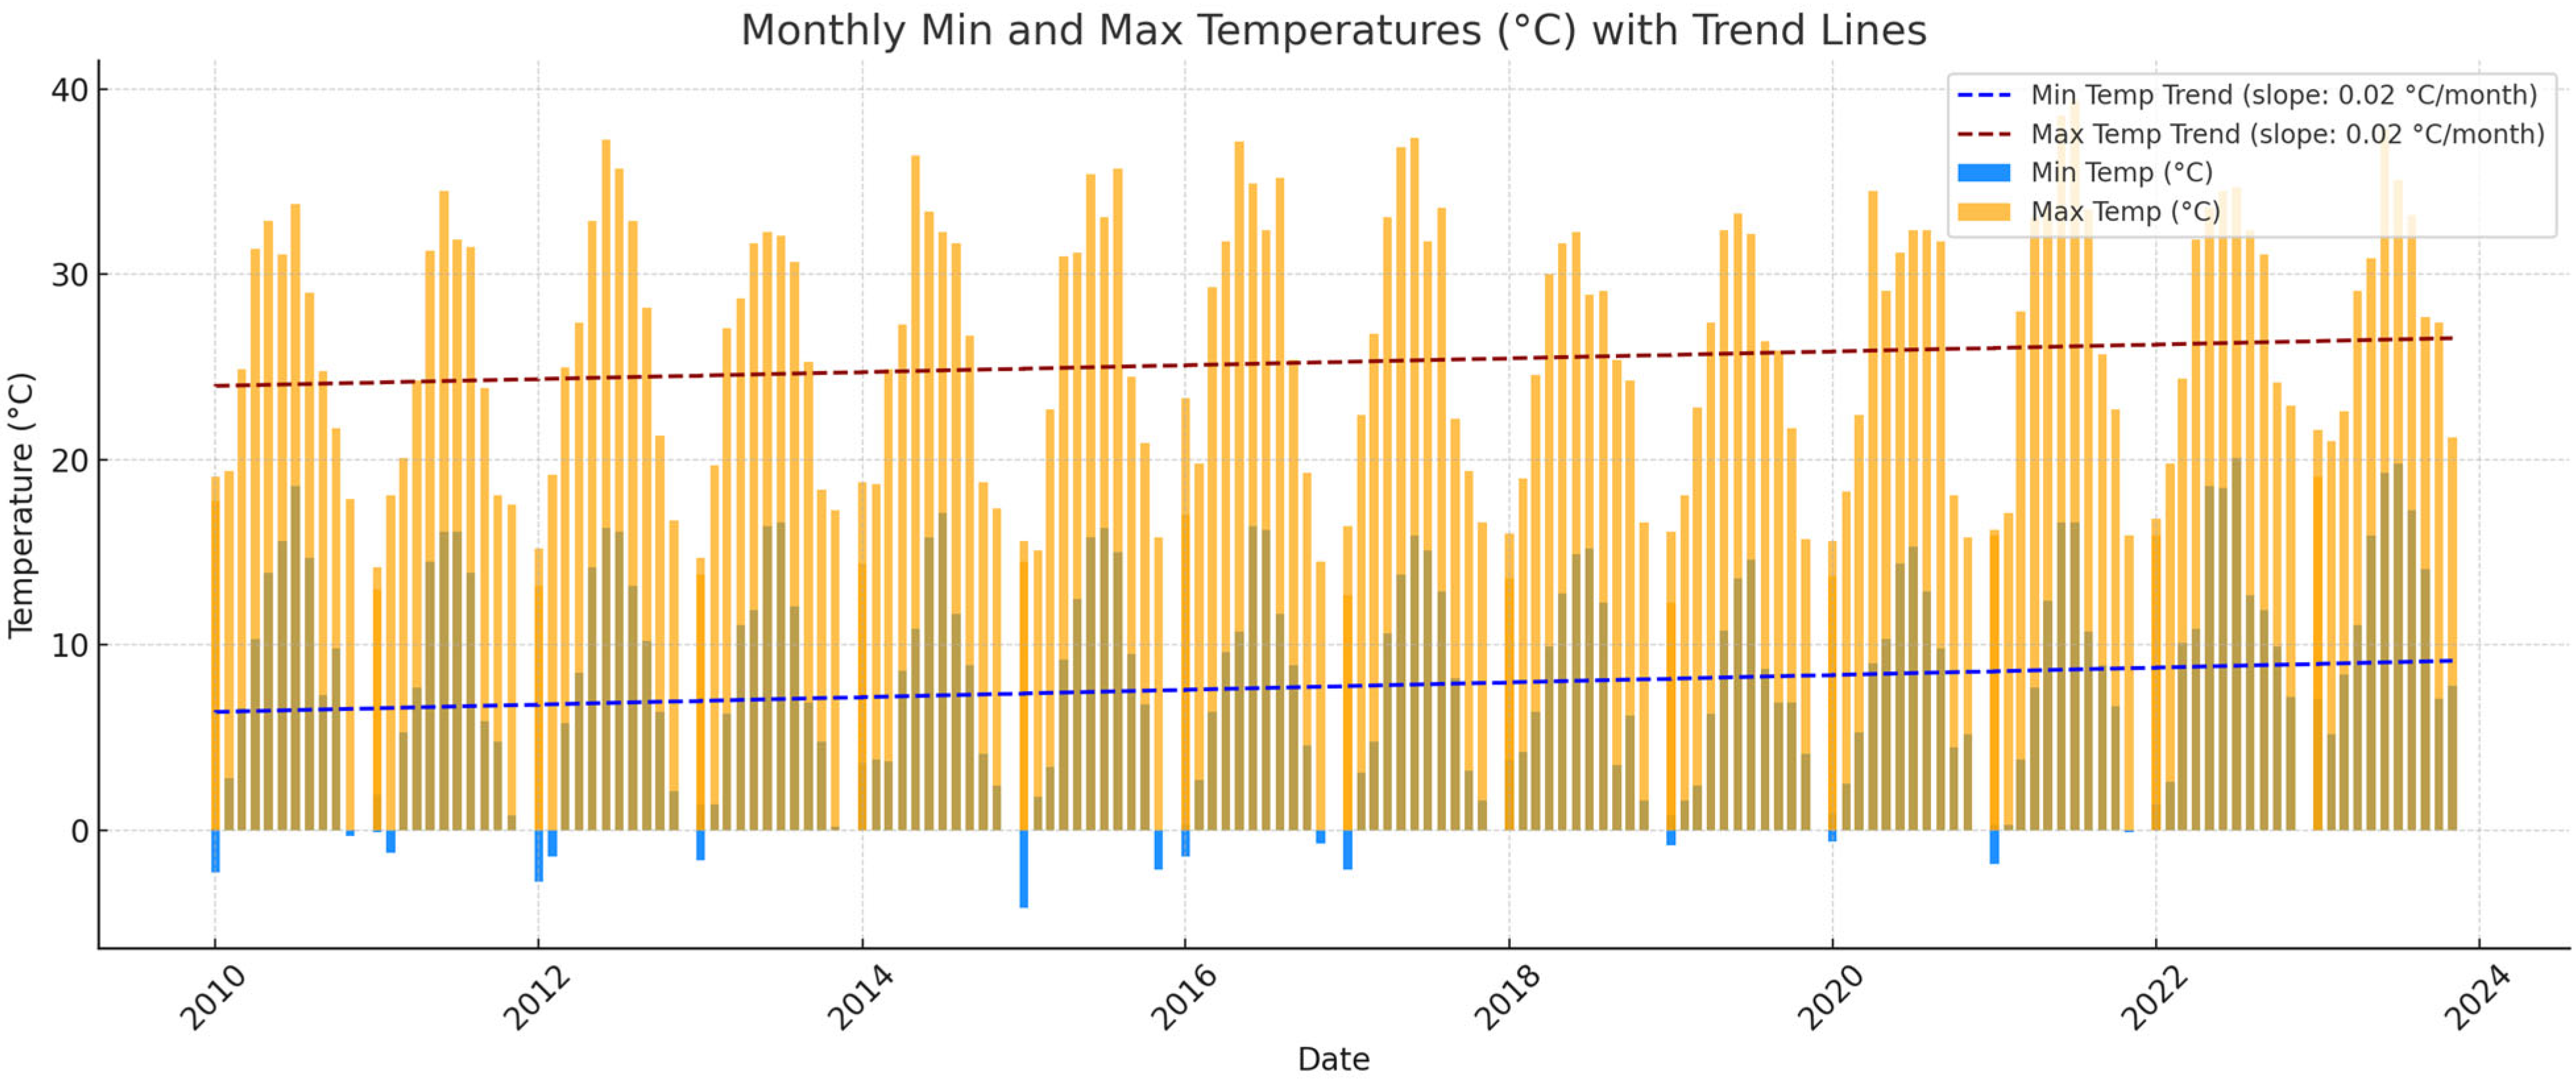
More specifically, Figure A1 shows the annual variation in the maximum and minimum temperatures during the years 2010–2023 on the island of Ikaria. The annual variation shown indicates that both maximum and minimum temperatures exhibit a slight yet steady upward trend. That aligns with general global warming patterns, in which average temperatures tend to increase over time. More specifically, the meteorological data for the island of Ikaria during the period 2020–2023 (Figure A1) highlight this steadily increasing trend, especially in maximum summer temperatures.
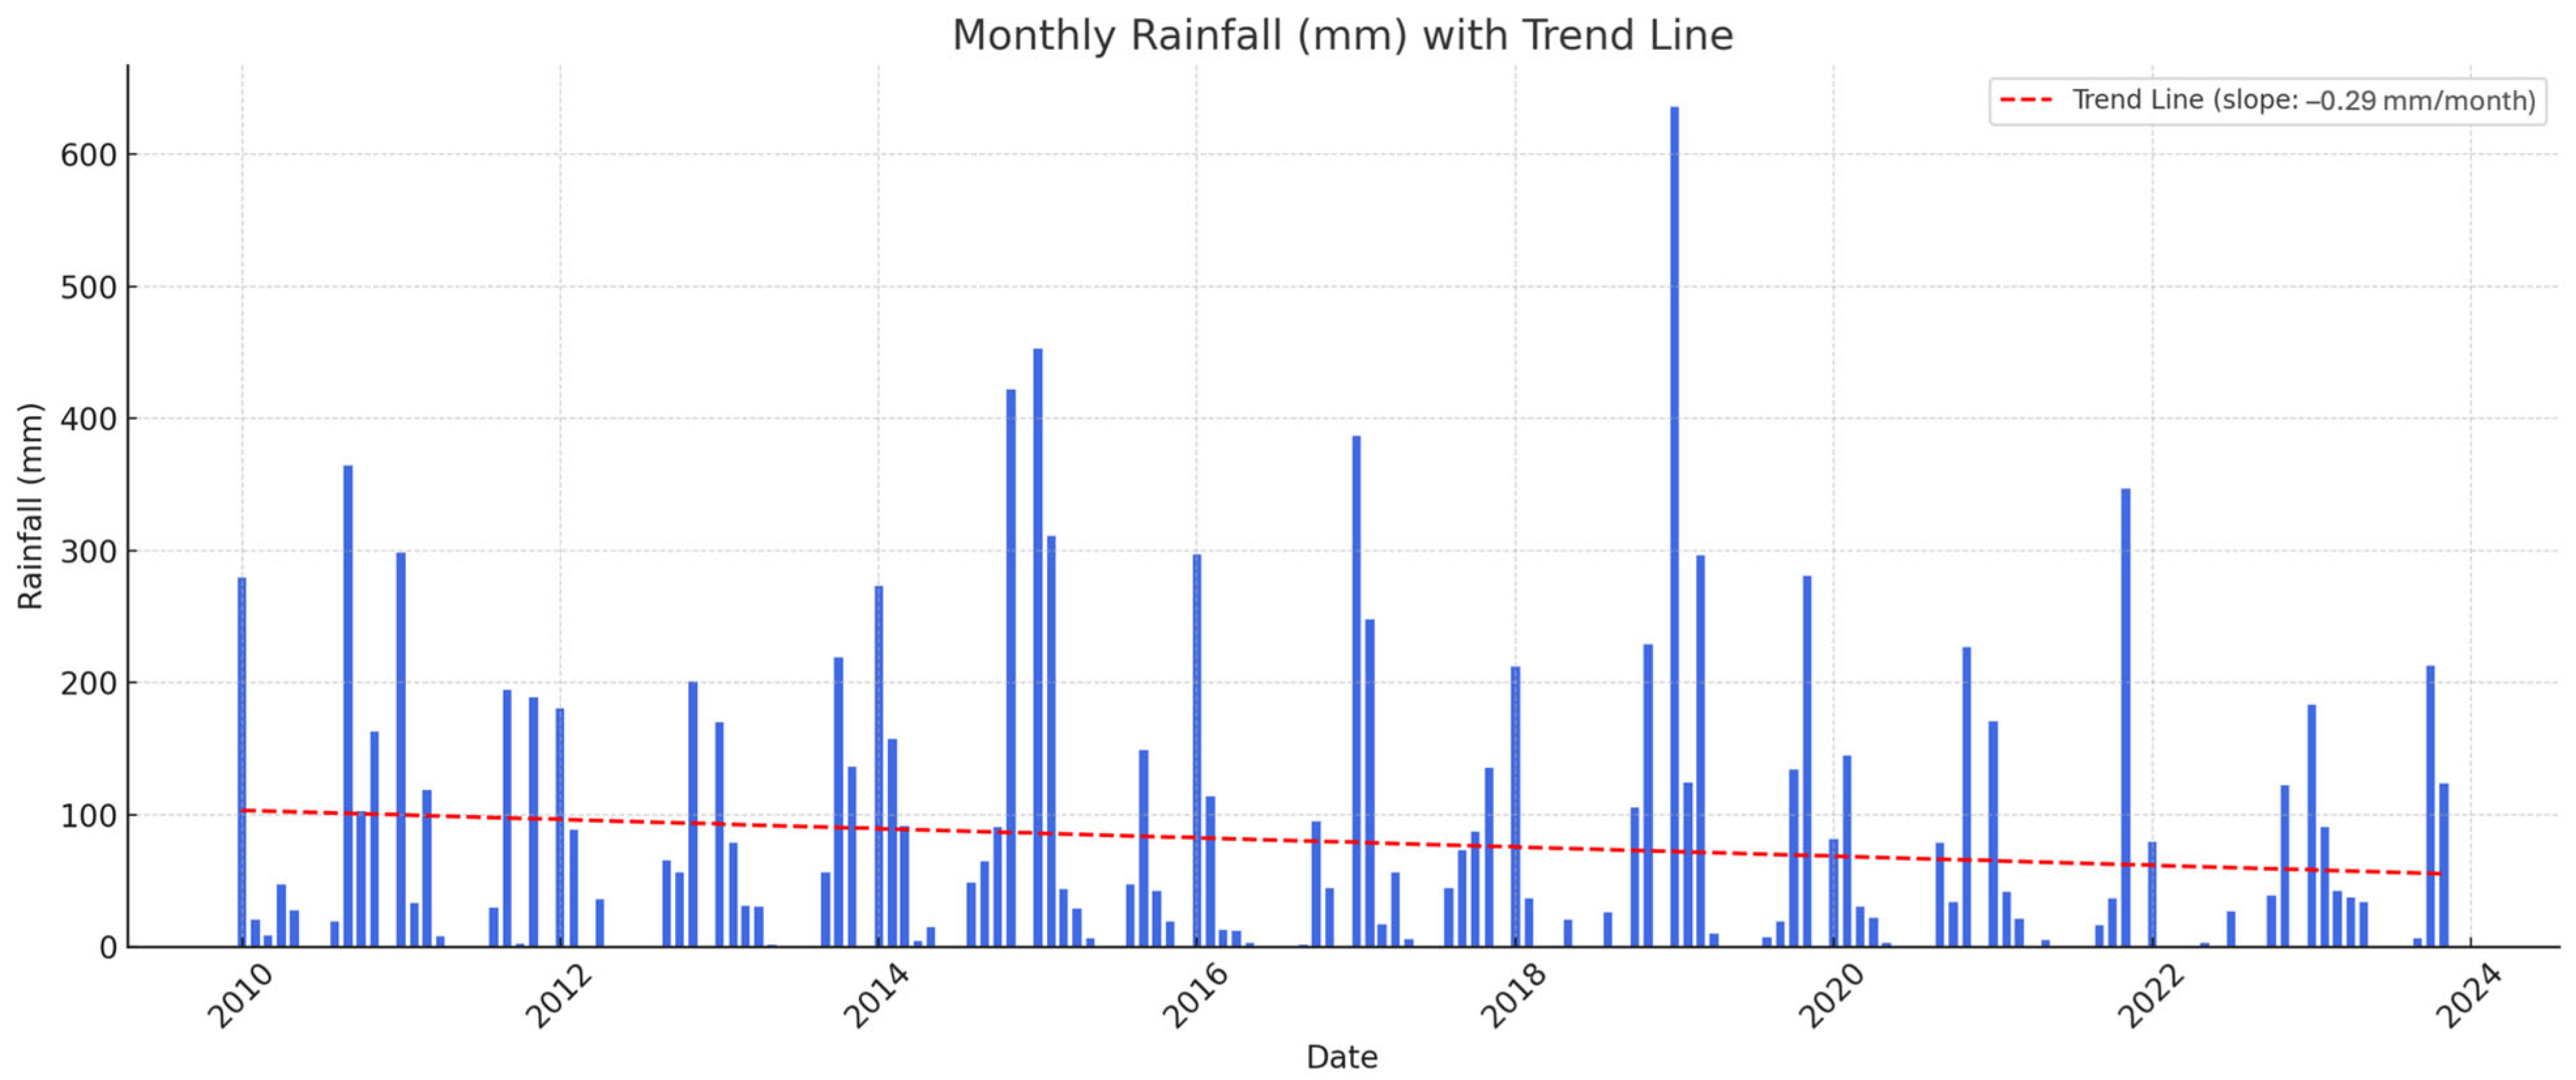
Figure A2 shows the monthly rainfall data for the period between January 2010 and December 2023 on Ikaria Island. There are significant fluctuations in rainfall over the years, with a great deal of peaks and valleys indicating periods of heavy rainfall followed by dry months. The trend appears to be quite variable, with certain periods showing significant rainfall (especially in 2010, 2014, 2016, and 2018), while the years 2019–2023 show a rainfall trend that appears to be declining.
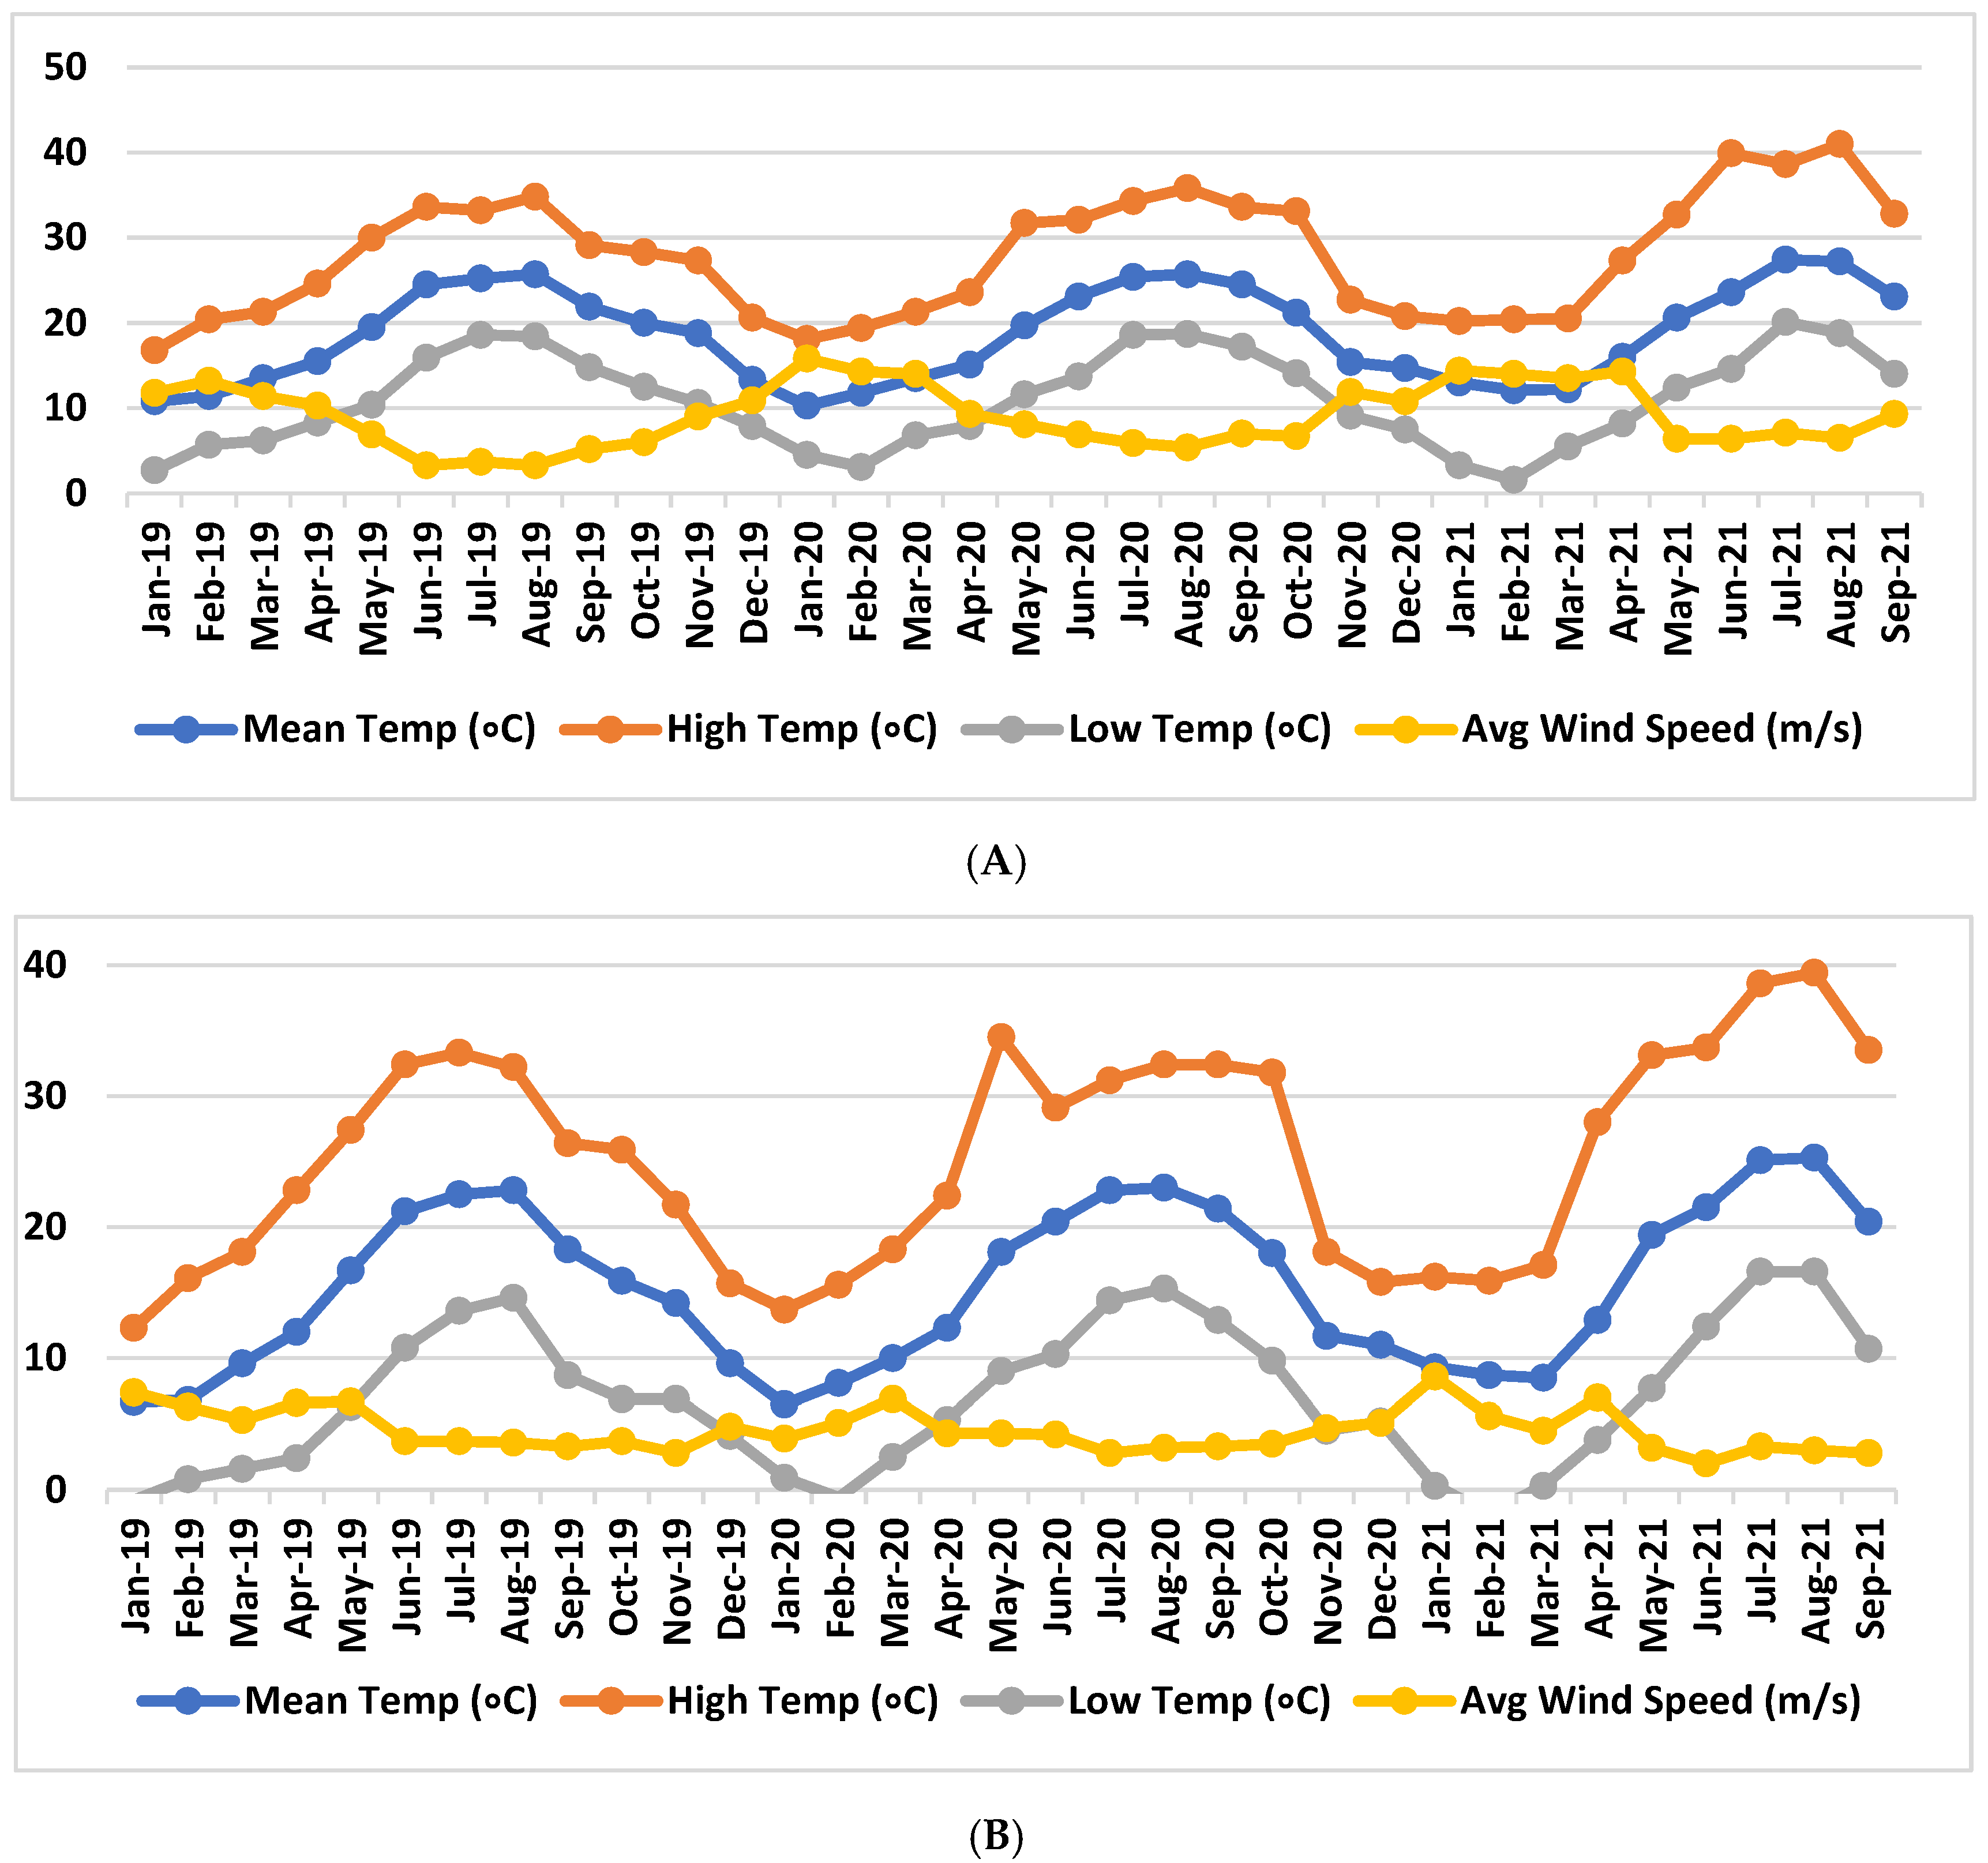
Regarding the vineyards selected for the current experiment, Figure A3 presents the average, maximum, and minimum temperatures, together with the average wind speed for the two discrete vineyards (V800P and V200K), over the period January 2019–September 2021. In vineyard V200K, the average maximum and minimum temperatures exhibit seasonal variation. The average temperature ranges between 10 °C and 30 °C. The average wind speed remains relatively stable, at approximately 1–3 m s−1, without significant changes. A similar seasonal trend, albeit slightly declining, is observed in vineyard V800P. The average temperature ranges from 5 °C to 25 °C. At V800P, the average wind speed remains stable and registers slightly lower than V200K, fluctuating between approximately 1 m s−1 and 2 m s−1.
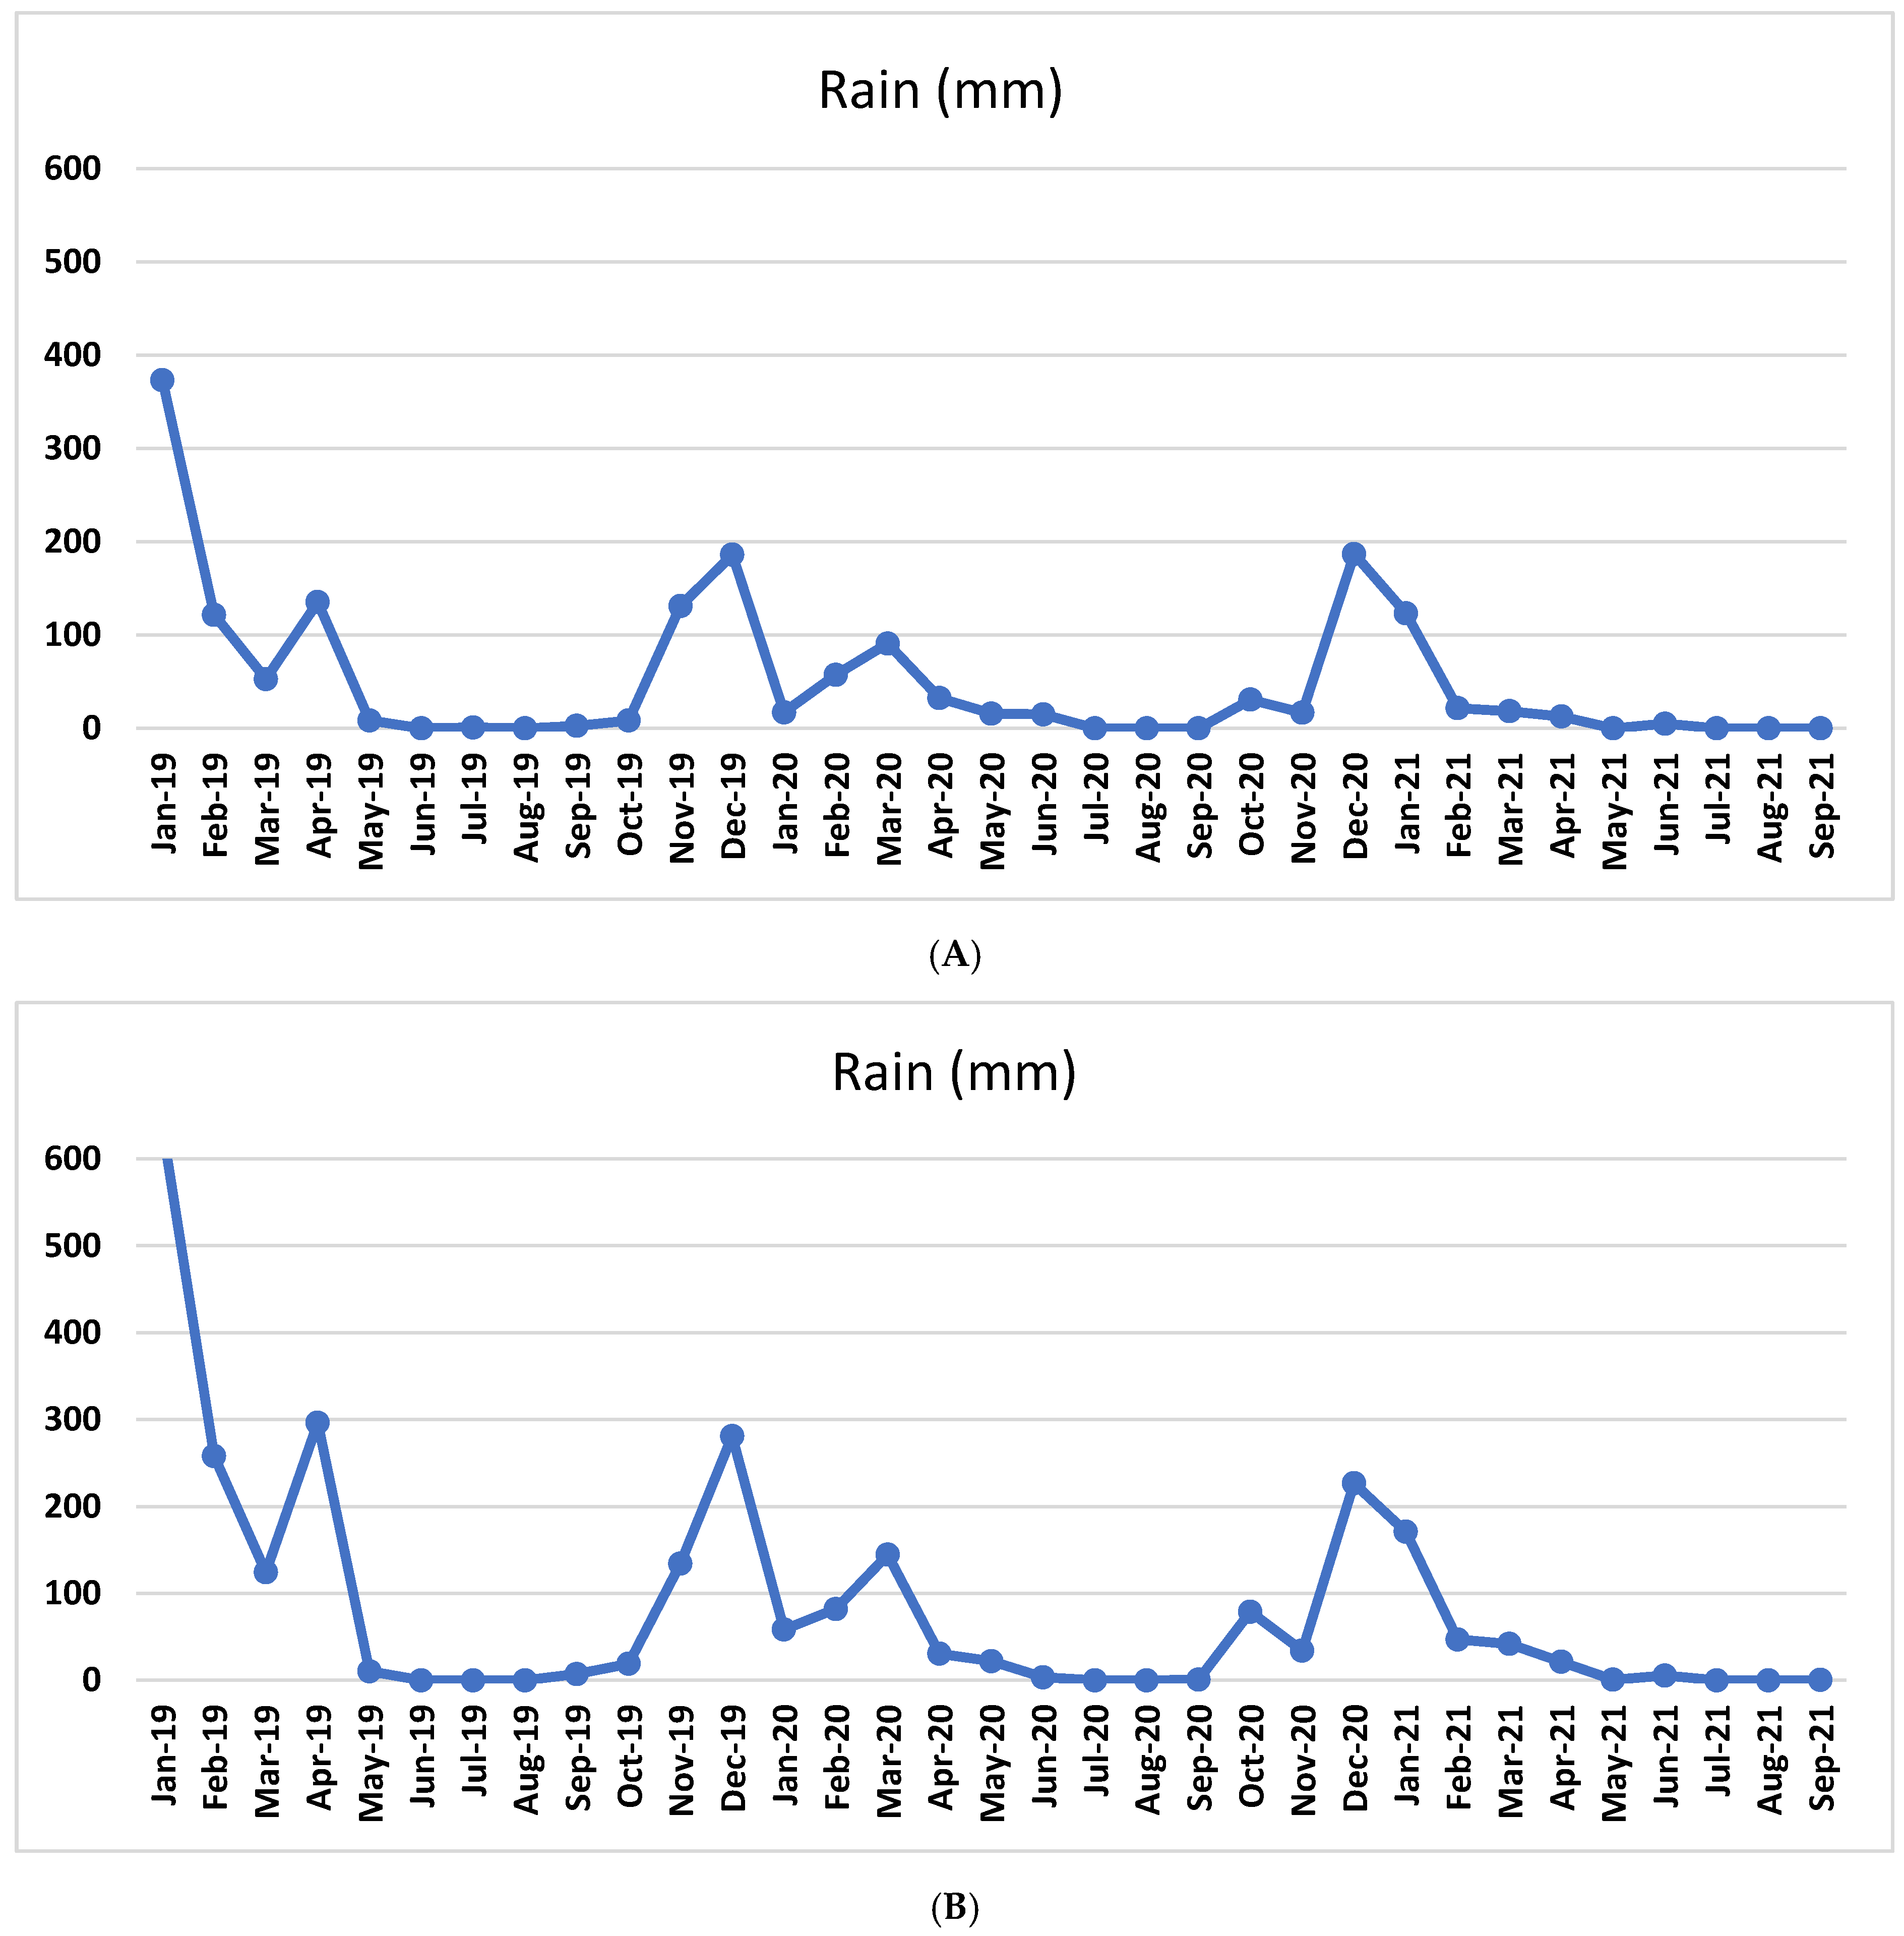
For the period January 2019–September 2021, the monthly rainfall (in millimeters) at the two discrete altitudes (800 and 200 m, respectively) is presented in Figure A4. Both vineyards exhibit similar seasonal rainfall patterns. Still, V800P seems to receive slightly more rainfall during certain periods, particularly during the peak rainfall months (January 2018 and December 2019).
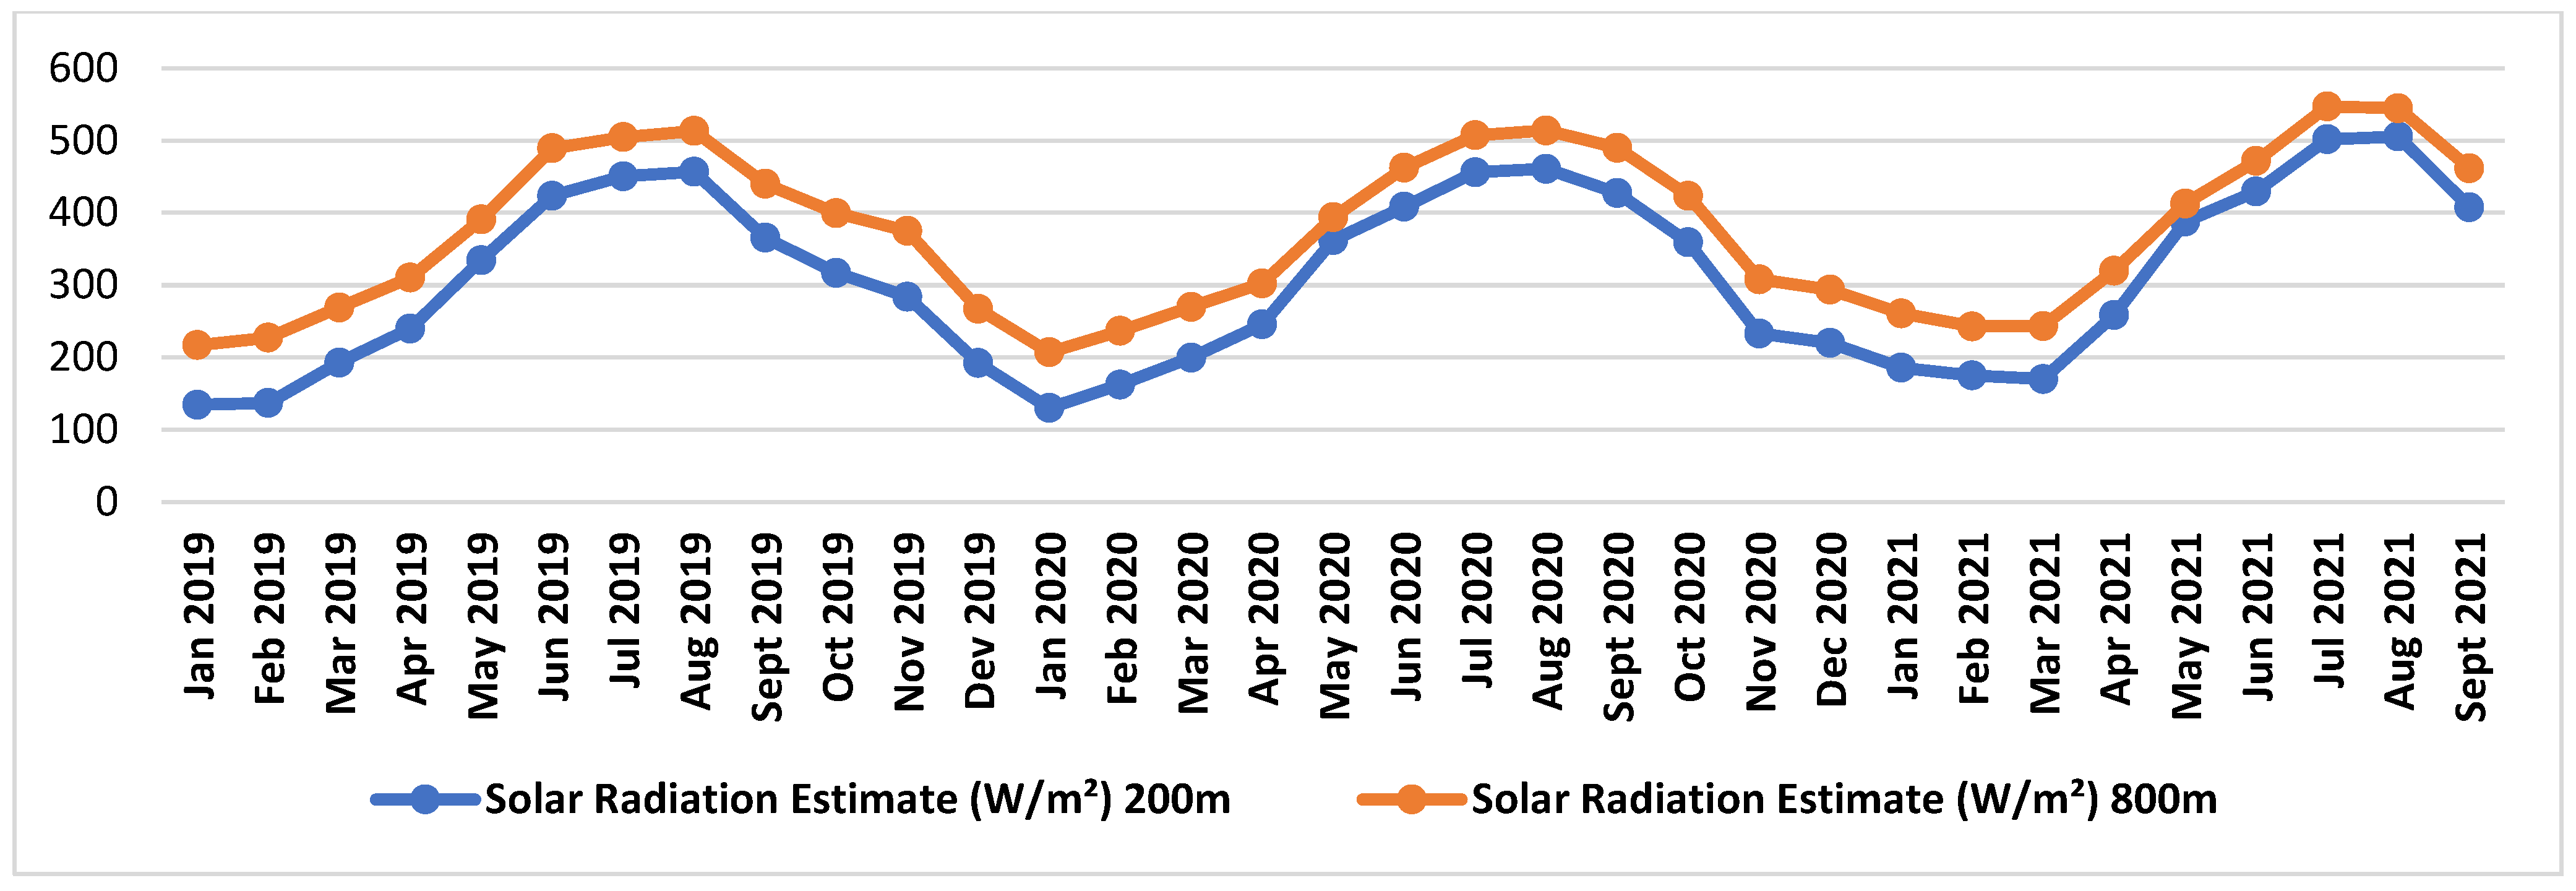
In Figure A5, for the period January 2019–September 2021, the estimation of solar radiation at the two discrete altitudes (800 m and 200 m) is presented. It can be observed that solar radiation is higher at the location of V800P. As there were no actual solar radiation measurements collected, the intensity of solar radiation was calculated by employing the following data: (a) latitude; (b) date and time series; (c) atmospheric conditions, i.e., humidity, atmospheric pressure, and cloud cover (indirectly through humidity); and (d) solar radiation angle (calculated from the data) [29,30,31]. Those data were obtained from NASA Earth Science Division (2020) and the European Joint Research Centre (JRC) [32]. Subsequently, the intensity of solar radiation was calculated based on the following equation:
I = I0 · cos (θ) · Τα
where Ι0 ≈ 1361 W(m2)−1 (solar constant);
θ = solar zenith angle (depends on the latitude and day of the year);
Τα = atmospheric permeability (estimated from humidity and pressure).

2.2. Grape Sampling and Sample Preparation

At harvest time each year of the experiment, grapes were randomly selected from each of the two vineyards during technological maturity. The sampling process, described in a previous study [33], involved the random selection of three (3) grape clusters from different vines of each vineyard and three (3) sampling processes. The clusters were collected from main shoots positioned randomly on the vine. Each sampling counted as one (1) replication. To separate the seeds and skins from their respective berries, samples from each replication were prepared for spectrophotometric and HPLC analyses according to the same study [33].

2.3. Grape and Berry Mechanical Properties—Characteristics of the Must

Random clusters from different vines of ‘Fokiano’ from the two vineyards were collected, comprising a total of nine (9) clusters per vineyard. For each cluster collected, the mechanical properties of the grapes and berries (length, width, weight) were assessed as described in [34]. Berry water content was determined according to [35]. The characteristics of the must were determined as described in [36]. The grape must was obtained by direct pressing of the grapes. The harvest date for the two vineyards was determined when the first vineyard reached the technological maturity of 23 °Brix. The degree of ripeness was calculated by dividing the total soluble solids by the titratable acidity.

2.4. Determination of Phenolic Compounds

Total phenols and total anthocyanins were measured using the Somers and Evans method [37], with some modifications as described in [33]. The total flavonoid content was determined using a colorimetric method as described in [38], while the total flavanol content was estimated using the p-dimethylaminocinnamaldehyde (DMACA) method [39]. Moreover, the flavone and flavonol content was determined using the method of [40], as described in [36]. The determination of the total (condensed) tannins was carried out following the method using methyl cellulose, as described in [41]. The determination of total orthodiphenols was carried out following the method described in [42].

2.5. Determination of Antioxidant Activity

The antioxidant activity was determined via the free radical scavenging activity provided by DPPH. The study made use of a modified colorimetric method [43] and of the ferric reducing antioxidant power (FRAP), adhering to the protocol described in [44].

2.6. HPLC Analyses

The HPLC method was used to analyze individual anthocyanins of the berries’ skins. It was also employed to separate and determine the organic acids of grape musts, in compliance with the processes described in [36].
The determination of individual sugars was carried out in the grape must. Initially, 0.1 mL of must was diluted with 1.9 mL of HPLC-grade water. This was followed by vortex mixing and centrifugation at 10,000 rpm for 10 min. Then, 1.5 mL was filtered through a 0.45 μm membrane before proceeding to the HPLC analysis. Identification and quantification of individual sugars were then performed using HPLC. HPLC analysis was performed with a 250 × 4.6 mm ID, 5 μm, Waters (Milford, MA, USA) SPHERISORB® NH2 column operating at 20 °C under isocratic conditions (mobile phase flow rate 1 mL min−1), and a refractive index detector was used. The mobile phase consisted of acetonitrile and water in an 80:20 ratio. For each sample, three (3) replicates were carried out. Standard compounds of glucose and fructose were used for the identification of sugars. Calibration curves were generated for the quantification of sugar concentrations. A calibration curve was created with concentrations ranging from 10 to 300 μg mL−1 of glucose and fructose. The identification in the unknown samples was performed by comparing retention times (tR).

2.7. Statistical Analysis

The statistical analyses and correlations were obtained using the JMP v.10 statistical software (SAS Institute Inc., Cary, NC, USA). The significance of the results was tested by analysis of variance (ANOVA). The means of the values were compared using Tukey’s range test (Tukey-HSD) at p ≤ 0.05. In order to reduce the dimensionality of the data and study the relationships between and among all measurements, pooled data were subjected to principal component analysis (PCA). The partial least squares (PLS) analysis was obtained using the Statgraphics Centurion v.17 statistical package (Stagraphics Technologies, Inc., The Plains, VA, USA). The PLS analysis followed the SIMPLS method and autoscaling for X and Y axes. The number of components was selected by k-fold cross-validation. It should be noted that the three years of the experiment (2019, 2020, 2021) were statistically analyzed separately, and the comparisons involved both vineyards.

3. Results

3.1. Results on the Various Measurements

The results of the mechanical properties of the grapes and berries in the two vineyards for the three years of the experiment are shown in Table 2.
From a statistical point of view, when considering all years of the experiment, the average grape bunch weight observed in V200K was significantly higher than that observed in V800P. No significant differences were observed in the average grape bunch length (cm) between grapes from either V200K or V800P. Values were more or less similar for all three years of the experiment. For all three years of the experiment, the average berry length in V200K was significantly higher than that in V800P. No significant differences were observed in the average grape (cluster) length between grapes from either of the two vineyards.
For all three years, the weight tested was that of thirty (30) berries. That weight differed significantly and was higher in V200K than in V800P. The percentage of average skin weight per berry was higher in V800P than it was in V200K, especially in 2019 and 2020. The difference in that percentage between the berries from V800P and those from V200K was significant. In 2019, the berries from V800P had significantly higher moisture content than those from V200K. Nevertheless, the differences observed in the years 2020 and 2021 were not significant (Table 2).
In Table 3, the extracted experimental values of the main characteristics of the must, i.e., titratable acidity, total soluble solids, pH, individual sugars, and degree of ripeness, are listed accordingly. It should be noted that the included results are derived from three years of experimental monitoring in both vineyards of interest.
For all three years, the titratable acidity was observed to be higher at V800P than at V200K, with a significant difference. Vineyard V200K exhibited higher Brix values, indicating higher sugar concentration. In other words, grape maturity at V200K was far more advanced than at V800P. The increased pH values in the same vineyard indicate a less acidic must. When pH increases, the acidity decreases. In detail, in 2020, the pH values at V200K were approximately 3.94. The corresponding pH values for V800P were measured at 3.63. The resulting difference was statistically significant.
Regarding the fructose levels, they were relatively similar in the two vineyards, with slight variations over the three years. In 2020, fructose concentration in vineyard V200K was 149.2 g L−1 compared to the fructose concentration of 128.7 g L−1 at vineyard V800P. Owing to the higher Brix values and fructose content, the difference was significant, with the degree of ripeness being higher at the lower-altitude V200K vineyard. In 2020, the degree of ripeness was 4.67 at V200K, and 3.21 at the higher-altitude V800P vineyard. As a result, the difference was significant.
The phenolic profile of the berries collected from both vineyards over all three years is presented in Table 4. Seed total phenolics were overall higher in V200K than in V800P. However, skin total phenolics were higher in V800P. Moreover, the differences observed in 2019 were significant.
Seed total flavanols were higher in V200K in 2019 and 2020, with significant differences. The concentration of total flavonoid compounds in the skins was significantly higher in V200K than in V800P. It should be noted that, depending on the year, a number of fluctuations were observed, while skin orthodiphenol values in V800P were higher than those in V200K.
The antioxidant capacity (determined by using both the FRAP and DPPH methods) was generally higher in V800P than in V200K (Table 4).
The concentrations of total and individual anthocyanins in the skins of the berries, as well as the concentrations of the major acids in the must, are presented in Table 5 and include both vineyards and all three years of the experiment. It should be noted that the individual anthocyanins identified were the most dominant ones.
In 2019 and 2020, the concentrations of total anthocyanins were higher in the Patissa vineyard (alt. 800 m). However, in 2021, the values in both vineyards were similar. Higher concentrations of individual anthocyanins, such as delphinidin, cyanidin, and peonidin, were observed in the vineyards of Patissa, a village at a higher elevation.
In the same higher-altitude vineyard, tartaric, malic, and ascorbic acids were found in higher concentrations than those detected in Kampos, the lower-altitude (200 m) vineyard. That held true for all years of the experiment, and the differences were significant. The opposite pattern was observed in the case of succinic acid, which, overall, was higher in Kampos (alt. 200 m).

3.2. Principal Component Analysis (PCA)

PCA transforms an original data set, all measurements included, into a smaller set of uncorrelated new variables (principal components, where eigenvalues are >1). The PCA was carried out on the measurements under study. It produced five components, in declining order of importance. Those five components accounted for and explained 90.71% of the total variability between and among the different measurements (Table 6). All measurements grouped under the same principal component show a strong correlation among them.
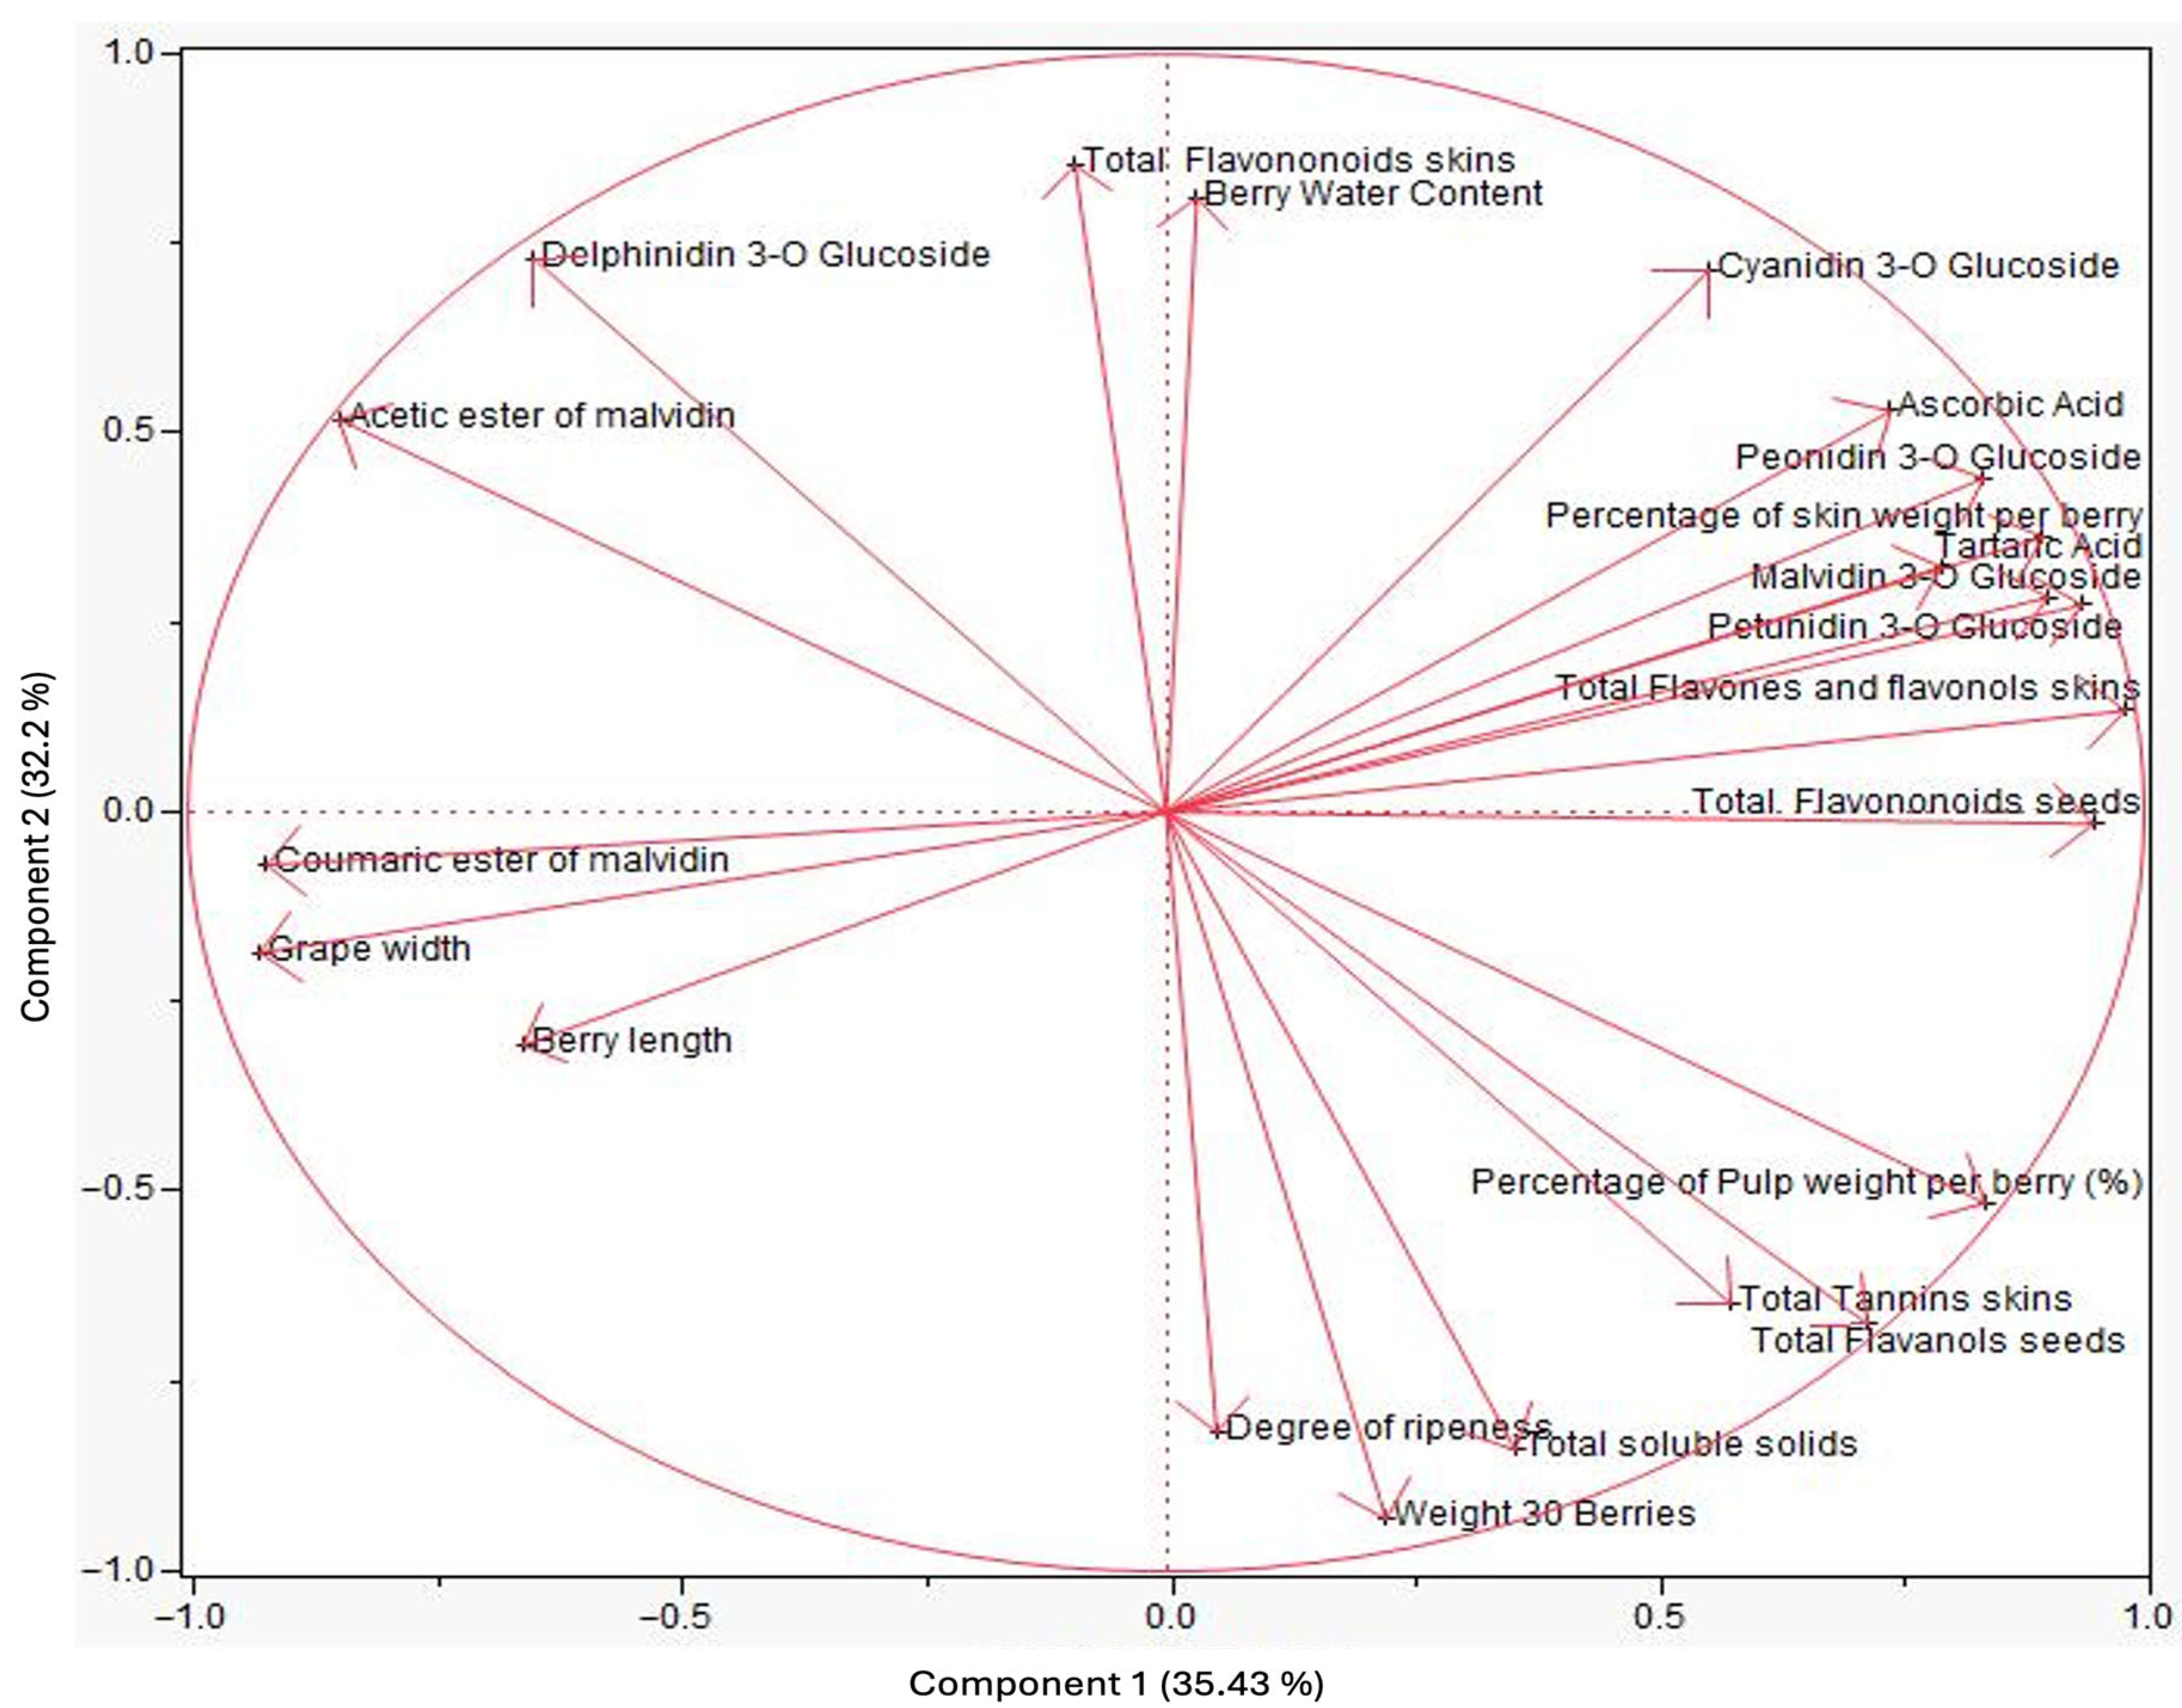
The first principal component (PC1) accounted for 35.43% of the total variability: it mainly represents the chemical composition of the grape, especially the antioxidant and phenolic profile. Variables such as total flavonoids, anthocyanins, and ascorbic acid have high loadings, indicating that PC1 separates samples based on bioactivity. The second principal component (PC2) explained another 30.27% of the total variability. It is related to ripening and sweetness indices, as variables such as degree of ripeness, Brix, and weight of 30 berries show strong positive loadings. The positive correlation between Brix and ripeness index was expected, as the latter is partly based on sugar content. The third principal component (PC3) explained another 16.49% of the total variability. It mainly includes mechanical properties of the berries, such as length and width, which seem to separate the samples according to fruit size rather than chemical composition (Table 6, Figure 3).
The PCA analysis plot illustrates the distribution of various grape-related parameters across the first two principal components, which explain 35.4% and 30.27% of the total variance, respectively (Figure 3). PCA analysis revealed clear clusters of variables that are correlated with each other. For example, high concentrations of phenolic compounds and anthocyanins are associated with samples that have high antioxidant potential. In contrast, variables related to the physical structure of the fruit (e.g., size) move in the opposite direction, indicating that “larger” grapes may have lower concentrations of bioactive compounds (Figure 3).

3.3. Correlation of Weighted Variables Pairwise

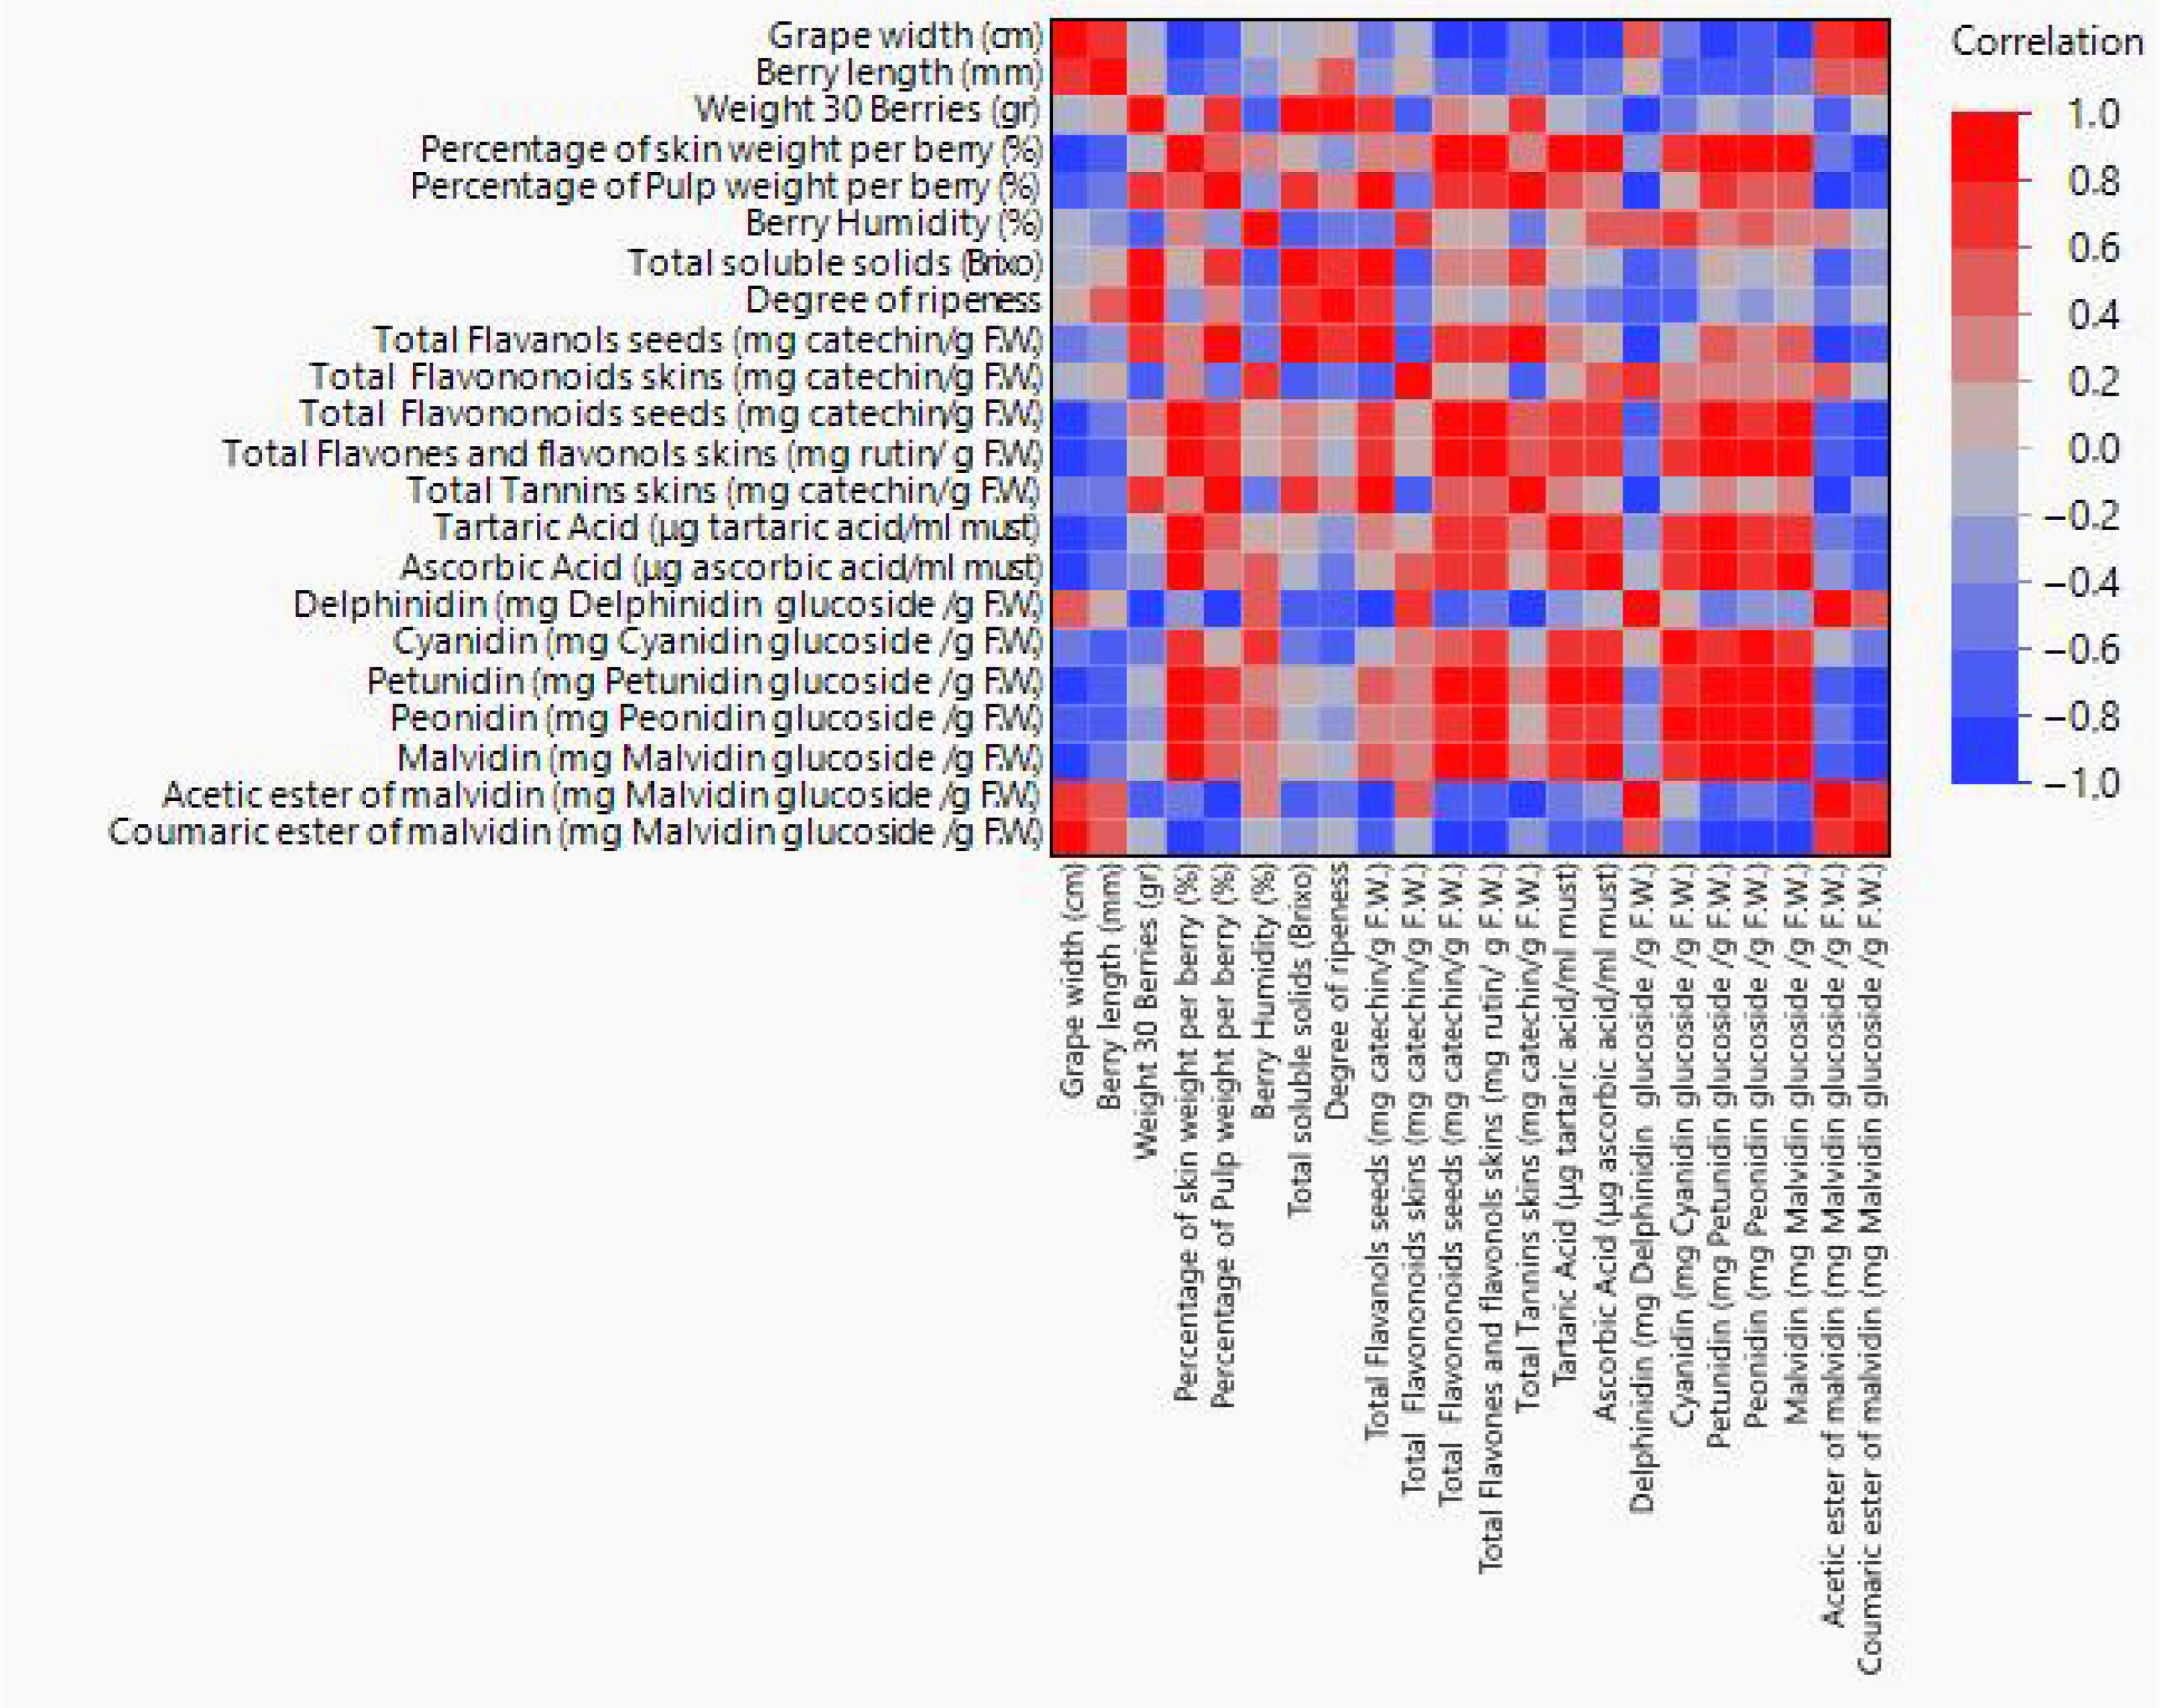
The most important correlations between certain pairs of variables considered to be of significant viticultural importance are presented in Figure 4. All the correlations shown are the result of paired comparison analysis, with the selection of those correlations that exhibit a strong positive or negative relationship (p < 0.0001). Positive correlations are indicated in red, while negative correlations are indicated in blue. Color intensity indicates the strength of the correlation.
The correlation matrix illustrates the pairwise relationships between the evaluated grape characteristics, including size-related traits, berry water content, sugar content, and a broad range of phenolic compounds. As expected, a strong positive correlation is observed between total soluble solids (°Brix) and the degree of ripeness, due to the way ripeness was calculated. Interestingly, berry water content shows a strong negative correlation with °Brix. This suggests a higher concentration of total soluble solids (higher °Brix) when the berries have a lower water content at ripening. The strong positive correlations between anthocyanins, flavonoids, and antioxidant indices confirm the coordinated behavior of these compounds during ripening and/or in response to environmental stress.
The negative correlations with size and acidity parameters highlight the complex balance between fruit development and chemical component concentration. These results complement PCA and enhance the utility of phenolic profiles as indicators of grape quality and physiological ripeness. The analysis of two-way correlations revealed significant relationships between phenolic compounds and ripening indices. Regarding the chemical composition, phenolic compounds, such as flavonoids, flavonols, tannins, and anthocyanins, display high positive correlations with each other, highlighting the coordinated biosynthesis of secondary metabolites during grape development. This pattern suggests that samples rich in one class of phenolics are likely to be rich in others, reinforcing their value as chemical markers of grape quality and ripeness.

3.4. Partial Least Squares (PLS) Analysis

The partial least squares (PLS) analysis with two components had the minimum root mean PRESS (0.317) and, according to van der Voet’s T2 test, the models with 0 or 1 component were significantly lower (p < 0.0001). The analysis explained 59.7% of the variance in X and 94.5% in Y. Variables with VIP > 1 were used to identify the variables that are significantly affected. The PLS analysis with two factors captured 59.7% of X and 94.5% of Y variance and minimized the cross-validated error (root mean PRESS ≈ 0.318).
The results revealed two clear axes of variation (Table 7). In the first component, the cultivation period (year) has a substantial positive weight (+0.254), whereas altitude is near zero (−0.015), indicating that this component reveals mainly differences between the cultivation periods (years). Positive weights on the first component are correlated with higher weights of organic acids and skin phenolics, i.e., ascorbic acid (+0.184), tartaric acid (+0.195), malvidin (+0.206), peonidin (+0.202), petunidin (+0.219), and a larger percentage of skin weight per berry (+0.218). Negative weights appear on grape berry and bunch mechanical properties (berry length −0.169, berry width −0.147, bunch width −0.219) and on the antioxidant capacity of seeds using the DPPH method (−0.175). In other words, Component 1 separates the cultivation periods (years) into more acidic, skin-driven phenolic profiles compared to those with larger grapes.
The second component relates to altitude, which carries a strong positive weight (+0.298), while the cultivation period (year) is close to zero (+0.040). As elevation increases, so do the variables having a positive weight on the second component, i.e., total acidity (+0.220), malic acid (+0.171), total anthocyanins (+0.232), as well as antioxidant capacity in seeds and skins using the FRAP method (+0.217 and +0.213, respectively) and the DPPH method (+0.100 and +0.165, respectively). Variables with negative weight decrease with elevation, including maturity indicators such as total soluble solids (−0.201) and consequently the degree of ripeness (−0.247), as well as size indicators such as grape bunch weight (−0.199).
Altogether, altitude shifts the grape profile towards greater acidity and enhanced phenolic and antioxidant potential, especially in skins, while reducing sugars and grape berry and bunch size.

4. Discussion

Climate change is expected to have a significant impact on viticulture, as grape cultivation is sensitive to soil and climate conditions, and terroir is of the utmost importance when it comes to producing specific wine styles. Viticulture is facing emerging challenges not only because of the effect of global warming on yield and the composition of berries, but also because of social demand for environmentally friendly agricultural management. Consequently, the number of studies focusing on the role of climate change in combination with terroir regarding grapevine tolerance to abiotic stress has been steadily increasing.
The results of the present study demonstrate that the higher altitude of V800P affected the quality characteristics of the berries. More specifically, the size of the berries tended to decrease as altitude increased. This can be explained by the higher oxidative stress stemming from the higher UV-B radiation [5]. The pH of the must determines the balance between different forms of anthocyanin. In highly acidic conditions, the flavylium cation (red) is the main anthocyanin structure. However, as the pH increases, that structure is progressively replaced by the cyanidin base (blue) [45]. It is therefore evident that the higher titratable acidity and lower pH, which are characteristic of the musts from vines grown at an altitude of 800 m, seem to help the wine produced retain its red hue. Be that as it may, it suffices that the titratable acidity of the must can be increased when a higher altitude’s lower temperatures lead to a greater concentration of malic acid, which is temperature dependent [46]. That is consistent with the results of the present study, although the relationship between titratable acidity and temperature seems to depend largely on the variety [47]. The berries from the grapes originating from the higher-altitude V800P exhibited a lower concentration of total soluble solids. That is confirmed and explained by [5]: lower temperatures at higher altitudes significantly delay berry ripening.
Additionally, the lower photosynthesis rate of the leaves from vines exposed to higher UV-B radiation (higher altitude) resulted in reduced sugar accumulation in the berries. The berries at 800 m had higher concentrations of total phenolic compounds, total condensed tannins, total flavonols, and total anthocyanins. They also had higher concentrations of all the identified and quantified individual anthocyanins, together with higher antioxidant capacity in the skins. These results are consistent with several previous studies, in which a positive correlation between altitude and the production of both anthocyanins and flavonols has been reported [7,18,19]. However, findings from several studies conducted at the bunch level are in agreement with the results of the current study, revealing that changes in total anthocyanin concentrations have been concomitant with changes in anthocyanin profile [4].
Overall, the findings of the present study highlight that, under high temperatures, anthocyanins are significantly affected and, more specifically, they decrease as temperatures increase. In addition, the dominant anthocyanin of the grapevine varieties belonging to the species Vitis vinifera L. is malvidin and its derivatives [48]. Still, the present study’s results reveal that, despite the fact that the grapevine variety Fokiano belongs to Vitis vinifera L. sp., it does not have malvidin as its dominant anthocyanin, regardless of the altitude (200 and 800 m, respectively) at which samples were collected and evaluated. This is likely explained by the excessive abiotic stress to which vines are exposed, and which is brought about by the extreme warm and dry conditions prevalent on the island of Ikaria.
Prolonged exposure to temperatures above 40 °C, as repeatedly recorded in Ikaria (Figure A1), probably contributes to the suppression of the biosynthesis of malvidin and other end-products of the phenolic pathway. It is worth mentioning that malvidin is the last in the biosynthetic pathway of anthocyanins; therefore, this pathway could likely be interrupted due to severe abiotic stress. Temperature appears to show a negative correlation with flavonoid concentration [49].
The results also suggest that the ratio of the anthocyanins, except for malvidin, becomes balanced as altitude increases. In this study, the dominant anthocyanin was found to be cyanidin. According to the literature, higher altitudes tend to promote cyanidin and non-acylated anthocyanins in general [50,51,52]. UV-B radiation increases as altitude increases [53]. UV-B radiation has been identified as the main cause of this effect through the direct activation of the flavonoid 3′-hydroxylase (F3′H) pathway, which is part of the larger phenylpropanoid pathway in berry skins, producing 3′, 5′-hydroxylated flavonoids such as quercetin-type flavonols, cyanidin-type anthocyanins, catechin, and epicatechin [5,50,54]. This could be explained by the fact that temperatures above 40 °C inhibit the enzyme phenylalanine ammonia lyase (PAL) and stilbene synthase, key enzymes in the phenylpropanoid pathway [49,55]. For optimal anthocyanin accumulation, grapes should be exposed during ripening to nighttime temperatures of 15 °C and daytime temperatures of 25 °C [56]. Consequently, lower anthocyanin accumulation was found in Malbec grapes grown at lower-altitude locations in Mendoza [635 m above sea level (a.s.l.)], where the number of days with temperatures above 33 °C was significantly higher compared to higher-altitude locations (1500 m a.s.l.) [52]. This phenomenon was directly associated with the inhibition of mRNA biosynthesis and gene activation of peroxidases during heat stress, which causes anthocyanin degradation [57]. In an experiment with a 2–3 °C warmer climate than the control, a significant decrease (28–41%) in total anthocyanins was found in grape skins of the grape cultivars Malbec and Bonarda [58]. That is contrary to the results of the present study. This result was correlated with lower expression of regulatory and structural anthocyanin genes. It should be mentioned that many MYB transcription factors are involved in the complex regulation of the phenylpropanoid pathway, controlling different parts of the pathway [59].
Furthermore, high altitude is generally considered to promote an increase in several phenolic groups (e.g., total flavonols) due to exposure to higher UV-B radiation intensity. The present study’s experiment confirms those results. Moreover, the berries of the grape cultivar Tempranillo at an altitude of 371 m showed a positive correlation between UV-B exposure and the concentration of quercetin and kaempferol flavonols [60]. It is also worth noting that a small-sized berry, a result of high-altitude conditions, has a higher skin-to-pulp ratio and, therefore, a higher concentration of polyphenols [5]. That is again confirmed by the results of the present study: grape berries at an altitude of 800 m exhibited a smaller size and a subsequent higher concentration of skin total phenolics. The grapevine cultivars Touriga Nacional and Touriga Francesa, when grown at 300–350 m a.s.l., exhibited 59% more total anthocyanins when compared to cultivars growing at 100–150 m a.s.l., with a temperature difference of 5 °C between the two altitudes [61,62].
The results obtained by previous researchers agree with the findings of the present study. In particular, the berries originating in V800P had a higher concentration of total and individual anthocyanins, in 2019 as well as in 2020, with the total anthocyanin concentrations being nearly double that of the berries originating in V200K. The average temperature during the ripening months (July–September) was consistently higher in the 200 m zone compared to the 800 m zone; more specifically, in 2019 the average July–September temperatures were 24.3 °C at 200 m and 21.2 °C at 800 m, in 2020 they were 25.2 °C at 200 m and 22.4 °C at 800 m, while in 2021 they were 25.9 °C at 200 m and 23.6 °C at 800 m. A similar pattern was observed in the maximum temperatures. These thermal differences may have had a decisive impact on the composition of the grapes, with the 800 m zone exhibiting higher anthocyanin concentrations in certain years, which is consistent with the literature on the effects of temperature on the expression of phenolic compounds. Incorporating these elements enhances the understanding of differences between zones and makes the results more comparable with studies from other regions and varieties.
Anthocyanins, interacting with the flavanols, catechin, and procyanidin, all in higher concentration as well, improve the color stability and aging potential of wine made from grapes grown at higher altitudes [63]. Contrary to most of the literature, the grape cultivars Vranac, Kratosija, and Cabernet Sauvignon, where grapes are grown at 400 m a.s.l., exhibited a lower concentration of total polyphenols and of monomeric and polymeric proanthocyanidins when compared to grapes grown at 25 m a.s.l. [64]. Those results may well be attributed to grape cultivation in an area of cooler temperatures, which are detrimental to secondary metabolism.

5. Conclusions

The results of the present study confirm the significant impact of altitude on grapevine growth and grape and berry composition, even with a small vineyard sample. Undoubtedly, such in-field studies would benefit from the use of more vineyard samples and locations, in order to further substantiate the results and the conclusions drawn, but at the same time, it is essential to maintain the uniformity of the locations selected and minimize all other variability factors.
Based on the findings of the present study, altitude and its associated climatic factors tend to overall delay the grapevine growth cycle, reduce vegetative growth, and decrease size, as well as increase the accumulation of phenolic compounds. Grapes from the lower-altitude V200K exhibit greater weight and length compared to the higher-altitude grapes from V800P, while berry water content and skin percentage per berry are usually higher in the higher-altitude location of Patissa. Furthermore, altitude significantly affects the characteristics of the must. In terms of phenolic compound composition, anthocyanin biosynthesis, antioxidant properties, as well as sugar and titratable acidity concentration, differences were recorded between the two altitudes, which are influenced by geographical location and experiment year. Individual acid concentrations (tartaric, malic, and ascorbic), as well as anthocyanin concentrations in the skins of grapes from the higher altitude, are higher, suggesting that high altitudes favor the development of these compounds, contributing to the color and phenolic properties of the grapes. Changes in anthocyanin composition were found to be associated with temperature intensity. Additionally, at higher altitudes, grapes exhibit higher anthocyanin content and titratable acidity, reducing the effects of conditions caused by climate change, which lead to early and premature ripening.
However, especially in the case of Mediterranean vineyards, where wine production is above all a tradition, such adaptation strategies could have a significant impact on the local economy and cultural values, which must be considered when future decisions are made.

Author Contributions

Conceptualization, I.D., M.S. and K.B.; methodology, I.D. and K.B.; supervision: M.S. and K.B.; validation, I.D., M.S., D.B. and K.B.; formal analysis, I.D., K.V., S.N., S.K. and T.G.; data curation, I.D., K.V., S.N., S.K. and T.G.; writing—original draft preparation, I.D., M.S. and D.B.; writing—review and editing, I.D., M.S., D.B. and K.B. All authors have read and agreed to the published version of the manuscript.

Funding

This research received no external funding.

Data Availability Statement

The data presented in this study are available on request from the corresponding author.

Acknowledgments

The authors would like to thank Afianes Wines for allowing the use of their vineyards for this research.

Conflicts of Interest

The authors declare no conflicts of interest.

Appendix A

Figure A1. Annual variation in maximum and minimum temperatures during the years 2010–2023, Ikaria Island.
Environments 12 00320 g0a1
Figure A2. Monthly rainfall data (in millimeters) during the years 2010–2023, Ikaria Island.
Environments 12 00320 g0a2
Figure A3. Monthly data for average, maximum, and minimum temperatures of the two vineyards during the years 2019–2021, where (A) corresponds to vineyard V200K (alt. 200 m) and (B) corresponds to vineyard V800 (alt. 800 m).
Environments 12 00320 g0a3
Figure A4. Monthly rainfall data for the two vineyards during the years 2019–2021, where (A) corresponds to vineyard V200K (alt. 200 m) and (B) corresponds to vineyard V800 (alt. 800 m).
Environments 12 00320 g0a4
Figure A5. Estimation of solar radiation for the two vineyards V200K and V800P during the years 2019–2021.
Environments 12 00320 g0a5

References

  1. Naing, A.-H.; Kim, C.-K. Abiotic stress-induced anthocyanins in plants: Their role in tolerance to abiotic stresses. Physiol. Plant. 2021, 172, 1711–1723. [Google Scholar] [CrossRef]
  2. Garrido, J.; Borges, F. Wine and grape polyphenols—A chemical perspective. Food Res. Int. 2013, 54, 1844–1858. [Google Scholar] [CrossRef]
  3. Wang, Q.-J.; Spence, C. Wine complexity: An empirical investigation. Food Qual. Pref. 2018, 68, 238–244. [Google Scholar] [CrossRef]
  4. Gouot, J.; Smith, J.P.; Holzapfel, B.P.; Walker, A.R.; Barril, C. Grape berry flavonoids: A review of their biochemical responses to high and extreme high temperatures. J. Exp. Bot. 2019, 70, 397–423. [Google Scholar] [CrossRef]
  5. Berli, F.J.; Fanzone, M.; Piccoli, P.; Bottini, R. Solar UV-B and ABA are involved in phenol metabolism of Vitis vinifera L. increasing biosynthesis of berry skin polyphenols. J. Agric. Food Chem. 2011, 59, 4874–4884. [Google Scholar] [CrossRef]
  6. Keller, M. Managing grapevines to optimize fruit development in a challenging environment: A climate change primer for viticulturists. Aust. J. Grape Wine Res. 2010, 16, 56–69. [Google Scholar] [CrossRef]
  7. Berli, F.J.; Moreno, D.; Piccoli, P.; Hespanhol-Viana, L.; Silva, M.F.; Bressan-Smith, R.; Bottini, R. Abscisic acid is involved in the response of grape (Vitis vinifera L.) cv. Malbec leaf tissues to ultraviolet-B radiation by enhancing ultraviolet-absorbing compounds, antioxidant enzymes, and membrane sterols. Plant Cell Environ. 2010, 33, 1–10. [Google Scholar] [CrossRef]
  8. do Nascimento Silva, F.L.; Schmidt, E.M.; Messias, C.L.; Eberlin, M.N.; Sawaya, A.C.H.F. Quantitation of organic acids in wine and grapes by direct infusion electrospray ionization mass spectrometry. Anal. Methods 2015, 7, 53–62. [Google Scholar] [CrossRef]
  9. González-Barreiro, C.; Rial-Otero, R.; Cancho-Grande, B.; Simal-Gándara, J. Wine aroma compounds in grapes: A critical review. Crit. Rev. Food Sci. Nutr. 2015, 55, 202–218. [Google Scholar] [CrossRef]
  10. Pillet, J.; Egert, A.; Pieri, P.; Lecourieux, F.; Kappel, C.; Charon, J.; Gomès, E.; Keller, F.; Delrot, S.; Lecourieux, D. VvGOLS1 and VvHsfA2 are involved in the heat stress responses in grapevine berries. Plant Cell Physiol. 2012, 53, 1776–1792. [Google Scholar] [CrossRef] [PubMed]
  11. Sweetman, C.; Sadras, V.O.; Hancock, R.D.; Soole, K.L.; Ford, C.M. Metabolic effects of elevated temperature on organic acid degradation in ripening Vitis vinifera fruit. J. Exp. Bot. 2014, 65, 5975–5988. [Google Scholar] [CrossRef]
  12. Pillet, J.; Berdeja, M.; Guan, L.; Delrot, S. Berry response to water, light and heat stresses. In Grapevine in a Changing Environment: A Molecular and Ecophysiological Perspective; Géros, H., Chaves, M.M., Medrano Gil, H., Delrot, S., Eds.; John Wiley & Sons, Inc.: Hoboken, NJ, USA, 2015; pp. 223–257. [Google Scholar]
  13. Murcia, G.; Pontin, M.; Reinoso, H.; Baraldi, R.; Bertazza, G.; Gómez-Talquenca, S.; Bottini, R.; Piccoli, P.N. ABA and GA3 increase carbon allocation in different organs of grapevine plants by inducing accumulation of non-structural carbohydrates in leaves, enhancement of phloem area and expression of sugar transporters. Physiol. Plant. 2016, 156, 323–337. [Google Scholar] [CrossRef]
  14. Rienth, M.; Torregrosa, L.; Sarah, G.; Ardisson, M.; Brillouet, J.M.; Romieu, C. Temperature desynchronizes sugar and organic acid metabolism in ripening grapevine fruits and remodels their transcriptome. BMC Plant Biol. 2016, 16, 164. [Google Scholar] [CrossRef]
  15. Lecourieux, F.; Kappel, C.; Pieri, P.; Charon, J.; Pillet, J.; Hilbert, G.; Renaud, C.; Gomès, E.; Delrot, S.; Lecourieux, D. Dissecting the biochemical and transcriptomic effects of a locally applied heat treatment on developing Cabernet Sauvignon grape berries. Front. Plant Sci. 2017, 8, 53. [Google Scholar] [CrossRef] [PubMed]
  16. Mansour, G.; Ghanem, C.; Mercenaro, L.; Nassif, N.; Hassoun, G.; Del Caro, A. Effects of altitude on the chemical composition of grapes and wine: A review. OENO One 2022, 56, 227–239. [Google Scholar] [CrossRef]
  17. Sun, R.-Z.; Cheng, G.; Li, Q.; He, Y.-N.; Wang, Y.; Lan, Y.-B.; Li, S.-Y.; Zhu, Y.-R.; Song, W.-F.; Zhang, X.; et al. Light-induced variation in phenolic compounds in Cabernet Sauvignon grapes (Vitis vinifera L.) involves extensive transcriptome reprogramming of biosynthetic enzymes, transcription factors, and phytohormonal regulators. Front. Plant Sci. 2017, 8, 547. [Google Scholar] [CrossRef]
  18. Li, Z.; Pan, Q.; Jin, Z.; Mu, L.; Duan, C. Comparison on phenolic compounds in Vitis vinifera cv. Cabernet Sauvignon wines from five wine-growing regions in China. Food Chem. 2011, 125, 77–83. [Google Scholar] [CrossRef]
  19. Liang, N.-N.; Zhu, B.-Q.; Han, S.; Wang, J.-H.; Pan, Q.-H.; Reeves, M.J.; Duanm, C.-Q.; He, F. Regional characteristics of anthocyanin and flavonol compounds from grapes of four Vitis vinifera varieties in five wine regions of China. Food Res. Int. 2014, 64, 264–274. [Google Scholar] [CrossRef] [PubMed]
  20. Coklar, H. Antioxidant capacity and phenolic profile of berry, seed, and skin of Ekşikara (Vitis vinifera L.) grape: Influence of harvest year and altitude. Ιnt. J. Food Prop. 2017, 20, 2071–2087. [Google Scholar] [CrossRef]
  21. Gil, M.; Pontin, M.; Berli, F.; Bottini, R.; Piccoli, P. Metabolism of terpenes in the response of grape (Vitis vinifera L.) leaf tissues to UV-B radiation. Phytochemistry 2012, 77, 89–98. [Google Scholar] [CrossRef]
  22. Jin, X.-D.; Wu, X.; Liu, X. Phenolic characteristics and antioxidant activity of Merlot and Cabernet Sauvignon wines increase with vineyard altitude in a high-altitude region. S. Afr. J. Enol. Vitic. 2017, 38, 132–143. [Google Scholar] [CrossRef]
  23. Martínez-Lüscher, J.; Morales, F.; Sánchez-Díaz, M.; Delrot, S.; Aguirreolea, J.; Gomès, E.; Pascual, I. Climate change conditions (elevated CO2 and temperature) and UV-B radiation affect grapevine (Vitis vinifera cv. Tempranillo) leaf carbon assimilation, altering fruit ripening rates. Plant Sci. 2015, 236, 168–176. [Google Scholar] [CrossRef]
  24. Martínez-Lüscher, J.; Sánchez-Díaz, M.; Delrot, S.; Aguirreolea, J.; Pascual, I.; Gomès, E. Ultraviolet-B alleviates the uncoupling effect of elevated CO2 and increased temperature on grape berry (Vitis vinifera cv. Tempranillo) anthocyanin and sugar accumulation. Aust. J. Grape Wine Res. 2016, 22, 87–95. [Google Scholar] [CrossRef]
  25. Van Leeuwen, C.; Destrac-Irvine, A. Modified grape composition under climate change conditions requires adaptations in the vineyard. OENO One 2017, 51, 147–154. [Google Scholar] [CrossRef]
  26. Zhu, H.; Zhang, T.-J.; Zheng, J.; Huang, X.-D.; Yu, Z.-C.; Peng, C.-L. Anthocyanins function as a light attenuator to compensate for insufficient photoprotection mediated by nonphotochemical quenching in young leaves of Acmena acuminatissima in winter. Photosynthetica 2018, 56, 445–454. [Google Scholar] [CrossRef]
  27. Gaiotti, F.; Pastore, C.; Filippetti, I.; Lovat, L.; Belfiore, N.; Tomasi, D. Low night temperature at veraison enhances the accumulation of anthocyanins in Corvina grapes (Vitis vinifera L.). Sci. Rep. 2018, 8, 8719. [Google Scholar] [CrossRef]
  28. Stavrakakis, M.N. Ampelography; Embryo Publications: Athens, Greece, 2021. [Google Scholar]
  29. Iqbal, M. An Introduction to Solar Radiation, 1st ed.; Academic Press: Cambridge, MA, USA; Elsevier: Amsterdam, The Netherlands, 1983. [Google Scholar]
  30. Liou, K.N. An Introduction to Atmospheric Radiation, 2nd ed.; Academic Press: Cambridge, MA, USA; Elsevier: Amsterdam, The Netherlands, 2002. [Google Scholar]
  31. Duffie, J.A.; Beckman, W.A. Solar Engineering of Thermal Processes, 4th ed.; Wiley: Hoboken, NJ, USA, 2013. [Google Scholar]
  32. European Commission Joint Research Centre (JRC). (n.d.). Photovoltaic Geographical Information System (PVGIS). Available online: https://re.jrc.ec.europa.eu/pvg_tools/en/ (accessed on 10 May 2023).
  33. Biniari, K.; Gerogiannis, O.; Daskalakis, I.; Bouza, D.; Stavrakaki, M. Study of some qualitative and quantitative characters of the grapes of indigenous Greek grapevine varieties (Vitis vinifera L.) using HPLC and spectrophotometric analyses. Not. Bot. Horti Agrobo. 2018, 46, 97–106. [Google Scholar] [CrossRef]
  34. Stavrakaki, M.; Biniari, K.; Daskalakis, I.; Bouza, D. Polyphenol content and antioxidant capacity of the skin extracts of berries from seven biotypes of the Greek grapevine cultivar Korinthiaki Staphis (Vitis vinifera L.). Aust. J. Crop Sci. 2018, 12, 1927–1936. [Google Scholar] [CrossRef]
  35. Bouza, D.; Tsavala, A.; Lappa, M.; Biniari, K.; Daskalakis, I.; Stavrakaki, M. The effect of rootstock on grape quality characters, phenolic and antioxidant potential of a biotype of cv ‘Korinthiaki Staphis’ (Vitis vinifera L.). Acta Hortic. 2024, 1418, 111–118. [Google Scholar] [CrossRef]
  36. Biniari, K.; Xenaki, M.; Daskalakis, I.; Rusjan, D.; Bouza, D.; Stavrakaki, M. Polyphenolic compounds and antioxidants of skin and berry grapes of Greek Vitis vinifera cultivars in relation to climate conditions. Food Chem. 2020, 307, 125518. [Google Scholar] [CrossRef] [PubMed]
  37. Somers, T.C.; Evans, M.E. Spectral evaluation of young red wines: Anthocyanin equilibria, total phenolic, free and molecular SO2, ‘chemical age’. J. Sci. Food Agric. 1977, 28, 279–287. [Google Scholar] [CrossRef]
  38. Dewanto, V.; Wu, X.; Adom, K.K.; Liu, R.H. Thermal processing enhances the nutritional value of tomatoes by increasing total antioxidant activity. J. Agric. Food Chem. 2002, 50, 3010–3014. [Google Scholar] [CrossRef]
  39. Vivas, N.; Nonier, M.F.; de Gaulejac, N.V.; Absalon, C.; Bertrand, A.; Mirabel, M. Determination of proanthocyanidins in wine and oak wood using p-dimethylaminocinnamaldehyde. J. Sci. Food Agric. 1994, 64, 153–160. [Google Scholar]
  40. Bonvehi, J.S.; Coll, F.V.; Jorda, R.E. The composition, active components, and bacteriostatic activity of propolis in dietetics. J. Am. Oil Chem. Soc. 1994, 71, 529–532. [Google Scholar] [CrossRef]
  41. Sarneckis, C.J.; Dambergs, R.G.; Jones, P.; Mercurio, M.; Herderich, M.J.; Smith, P.A. Quantification of condensed tannins by precipitation with methyl cellulose: Development and validation of an optimized tool for grape and wine analysis. Aust. J. Grape Wine Res. 2006, 12, 39–49. [Google Scholar] [CrossRef]
  42. Roussos, P.A.; Pontikis, C.A. Phenolic compounds in olive explants and their contribution to browning during the establishment stage in vitro. Eur. J. Hortic. Sci. 2001, 66, 298–303. [Google Scholar] [CrossRef]
  43. Brand-Williams, W.; Cuvelier, M.E.; Berset, C. Use of a free radical method to evaluate antioxidant activity. LWT-Food Sci. Technol. 1995, 28, 25–30. [Google Scholar] [CrossRef]
  44. Benzie, I.F.F.; Strain, J.J. The ferric reducing ability of plasma (FRAP) as a measure of ‘antioxidant power’: The FRAP assay. Anal. Biochem. 1996, 239, 70–76. [Google Scholar] [CrossRef]
  45. Kontoudakis, N.; González, E.; Gil, M.; Esteruelas, M.; Fort, F.; Canals, J.M.; Zamora, F. Influence of wine pH on changes in color and polyphenol composition induced by micro-oxygenation. J. Agric. Food Chem. 2011, 59, 1974–1984. [Google Scholar] [CrossRef]
  46. Koundouras, S.; Marinos, V.; Gkoulioti, A.; Kotseridis, Y.; van Leeuwen, C. Influence of vineyard location and vine water status on fruit maturation of non-irrigated cv. Agiorgitiko (Vitis vinifera L.). Effects on wine phenolic and aroma components. J. Agric. Food Chem. 2006, 54, 5077–5086. [Google Scholar] [CrossRef] [PubMed]
  47. Sadras, V.O.; Petrie, P.R.; Moran, M.A. Effects of elevated temperature in grapevine. II. Juice pH, titratable acidity and wine sensory attributes. Aust. J. Grape Wine Res. 2013, 19, 107–115. [Google Scholar] [CrossRef]
  48. Acevedo, D.C.A.; Hilbert, G.; Rivière, C.; Mengin, V.; Ollat, N.; Bordenave, L.; Decroocq, S.; Delaunay, J.-C.; Delrot, S.; Mérillon, J.-M.; et al. Anthocyanin identification and composition of wild Vitis spp. accessions by using LC–MS and LC–NMR. Anal. Chim. Acta 2012, 732, 145–152. [Google Scholar] [CrossRef]
  49. Pastore, C.; Dal Santo, S.; Zenoni, S.; Movahed, N.; Allegro, G.; Valentini, G.; Filippetti, I.; Tornielli, G.B. Whole plant temperature manipulation affects flavonoid metabolism and the transcriptome of grapevine berries. Front. Plant Sci. 2017, 8, 929. [Google Scholar] [CrossRef] [PubMed]
  50. Xing, R.-R.; He, F.; Xiao, H.-L.; Duan, C.-Q.; Pan, Q.-H. Accumulation pattern of flavonoids in Cabernet Sauvignon grapes grown in a low-latitude and high-altitude region. S. Afr. J. Enol. Vitic. 2016, 36, 32–43. [Google Scholar] [CrossRef]
  51. Muñoz, F.A.; Urvieta, R.A.; Buscema, F.; Rasse, M.; Fontana, A.R.; Berli, F.J. Phenolic characterization of Cabernet Sauvignon wines from different geographical indications of Mendoza, Argentina: Effects of plant material and environment. Trends Plant Sci. 2021, 5, 1523. [Google Scholar] [CrossRef]
  52. Urvieta, R.; Jones, G.; Buscema, F.; Bottini, R.; Fontana, A. Terroir and vintage discrimination of Malbec wines based on phenolic composition across multiple sites in Mendoza, Argentina. Sci. Rep. 2021, 11, 2863. [Google Scholar] [CrossRef]
  53. Piazena, H.; Häder, D.P. Solar UV-B and UV-A irradiance in arid high-mountain regions: Measurements on the island of Tenerife as compared to previous tropical Andes data. J. Geophys. Res.-Biogeosci. 2009, 114, 37–52. [Google Scholar] [CrossRef]
  54. Martínez-Lüscher, J.; Torres, N.; Hilbert, G.; Richard, T.; Sánchez-Díaz, M.; Delrot, S.; Aguirreolea, J.; Pascual, I.; Gomès, E. Ultraviolet-B radiation modifies the quantitative and qualitative profile of flavonoids and amino acids in grape berries. Phytochemistry 2014, 102, 106–114. [Google Scholar] [CrossRef]
  55. Ferrandino, A.; Lovisolo, C. Abiotic stress effects on grapevine (Vitis vinifera L.): Focus on abscisic acid-mediated consequences on secondary metabolism and berry quality. Environ. Exp. Bot. 2014, 103, 138–147. [Google Scholar] [CrossRef]
  56. Drappier, J.; Thibon, C.; Rabot, A.; Geny-Denis, L. Relationship between wine composition and temperature: Impact on Bordeaux wine typicity in the context of global warming—Review. Crit. Rev. Food Sci. Nutr. 2019, 59, 14–30. [Google Scholar] [CrossRef]
  57. Movahed, N.; Pastore, C.; Cellini, A.; Allegro, G.; Valentini, G.; Zenoni, S.; Cavallini, E.; D’Incà, E.; Tornielli, G.B.; Filippetti, I. The grapevine VviPrx31 peroxidase as a candidate gene involved in anthocyanin degradation in ripening berries under high temperature. J. Plant Res. 2016, 129, 513–526. [Google Scholar] [CrossRef] [PubMed]
  58. de Rosas, I.; Ponce, M.T.; Malovini, E.; Deis, L.; Cavagnaro, B.; Cavagnaro, P. Loss of anthocyanins and modification of the anthocyanin profiles in grape berries of Malbec and Bonarda grown under high temperature conditions. Plant Sci. 2017, 258, 137–145. [Google Scholar] [CrossRef] [PubMed]
  59. Azuma, A. Genetic and environmental impacts on the biosynthesis of anthocyanins in grapes. Hort. J. 2018, 87, 1–17. [Google Scholar] [CrossRef]
  60. Del-Castillo-Alonso, M.Á.; Diago, M.P.; Tomás-Las-Heras, R.; Monforte, L.; Soriano, G.; Martínez-Abaigar, J.; Núñez-Olivera, E. Effects of ambient solar UV radiation on grapevine leaf physiology and berry phenolic composition along one entire season under Mediterranean field conditions. Plant Physiol. Biochem. 2016, 109, 374–386. [Google Scholar] [CrossRef]
  61. Mateus, N.; Marques, S.; Gonçalves, A.C.; Machado, J.M.; De Freitas, V. Proanthocyanidin composition of red Vitis vinifera varieties from the Douro Valley during ripening: Influence of cultivation altitude. Am. J. Enol. Vitic. 2001, 52, 115–121. [Google Scholar] [CrossRef]
  62. Mateus, N.; Machado, J.M.; De Freitas, V. Development changes of anthocyanins in Vitis vinifera grapes grown in the Douro Valley and concentration in respective wines. J. Sci. Food Agric. 2002, 82, 1689–1695. [Google Scholar] [CrossRef]
  63. Mateus, N.; Proença, S.; Ribeiro, P.; Machado, J.M.; De Freitas, V. Grape and wine polyphenolic composition of red Vitis vinifera varieties concerning vineyard altitude. CYTA J. Food 2001, 3, 102–110. [Google Scholar] [CrossRef]
  64. Pajovic, R.; Raicevic, D.; Popovic, T.; Sivilotti, P.; Lisjak, K.; Vanzo, A. Polyphenolic characterization of Vranac, Kratosija and Cabernet Sauvignon (Vitis vinifera L. cv.) grapes and wines from different vineyard locations in Montenegro. S. Afr. J. Enol. Vitic. 2014, 35, 139–148. [Google Scholar] [CrossRef]
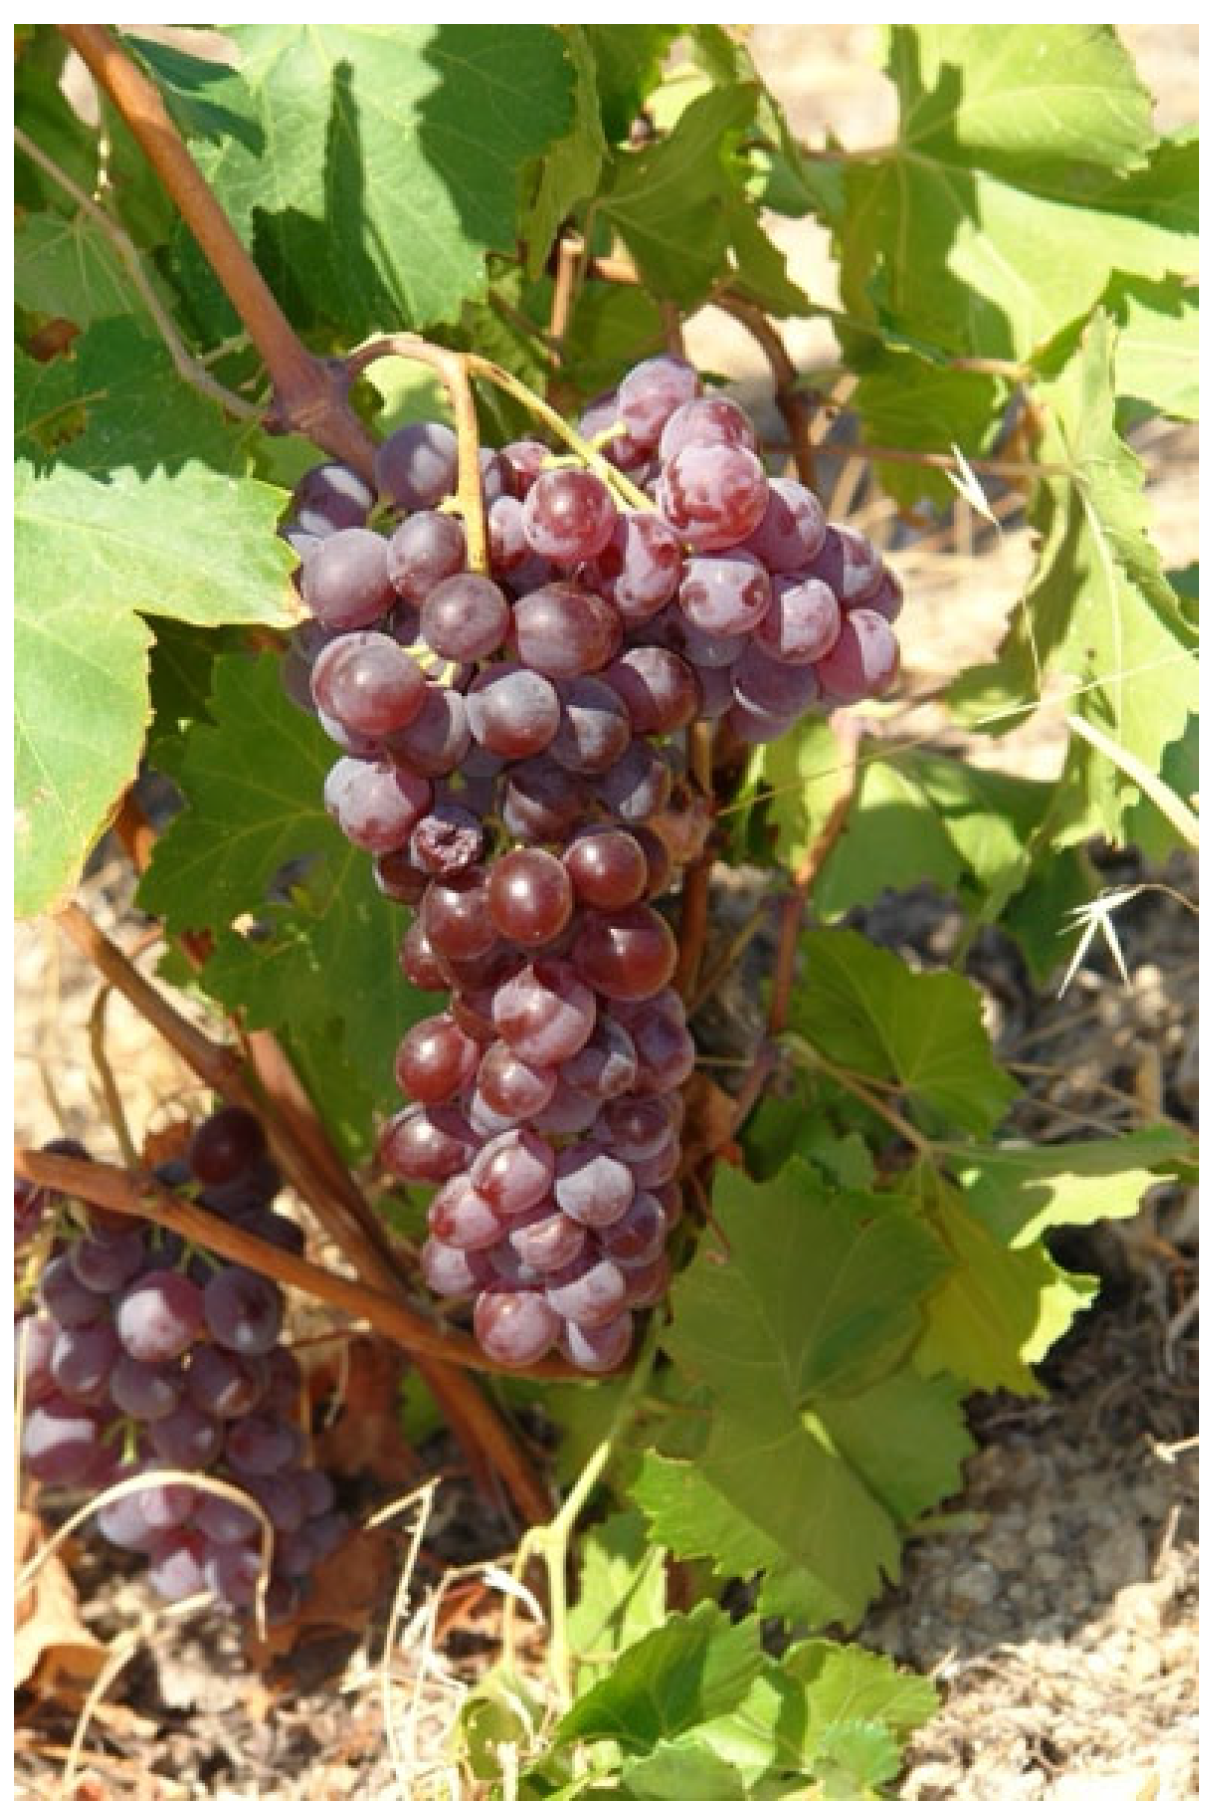
Figure 1. Typical cluster of the grapevine cultivar ‘Fokiano’.
Environments 12 00320 g001
Figure 2. Location of the vineyards, Ikaria Island.
Environments 12 00320 g002
Figure 3. PCA analysis plot. The figure shows the distribution of variables in the first two principal components (PC1 and PC2), which explain 65.7% of the total variance. The variables are displayed as vectors (arrows), whose direction and length indicate the degree and type of their contribution to each component. Variables that have a similar direction show a positive correlation, while those with an opposite direction are negatively correlated. The longer the length of the vector, the more important the contribution of the variable in shaping the corresponding component.
Environments 12 00320 g003
Figure 4. Paired comparison analysis of the variables evaluated.
Environments 12 00320 g004
Table 1. Experimental vineyards: characteristics.
CodeVineyard NameVineyard Characteristics
V800PPatissaAltitude 800 m, organic vineyard, 20-year-old vines, grafted on R110 rootstock, head-trained
V200KKamposAltitude 200 m, organic vineyard, 20-year-old vines, grafted on R110 rootstock, head-trained
Table 2. Mechanical properties of the grapes, berries, skins, and seeds on technological maturity in relation to the two vineyards for the years 2019, 2020, and 2021.
Years201920202021
MeasurementsV800PV200KV800PV200KV800PV200K
Grape bunch
weight (g)
131 ± 20 b229 ± 20 a107 ± 4 b241 ± 4 a148 ± 5 b274 ± 7 a
Grape bunch
length (cm)
14 ± 1 a13.2 ± 0.5 a7.1 ± 0.7 a7.1 ± 0.7 a9 ± 1 a9.6 ± 0.3 a
Grape bunch
width (cm)
7.11 ± 1 b8.2 ± 0.4 a11.5 ± 0.8 b16.9 ± 0.9 a16 ± 1 b21.3 ± 0.3 a
Berry length
(mm)
14 ± 3 b18 ± 2 a16.4 ± 0.5 a17.9 ± 0.4 a18 ± 1 a18.9 ± 0.4 a
Berry width
(mm)
15 ± 2 b17 ± 1 a14.9 ± 0.2 b16.5 ± 0.3 a16.95 ± 0 b18.5 ± 0.5 a
Weight of 30
berries (g)
119 ± 6 b142 ± 1 a143 ± 13 b163 ± 2 a112 ± 2 b121 ± 5 a
Percentage of skin weight per berry (%)14.1 ± 0.5 a12.3 ± 0.3 b10.3 ± 0.6 a8.7 ± 0.6 b9.7 ± 0.3 a7.1 ± 0.2 b
Percentage of seed weight per berry (%)1.49 ± 0.14 b1.94 ± 0.04 a1.64 ± 0.07 b1.96 ± 0.17 a1.55 ± 0.05 b2.41 ± 0.13 a
Percentage of pulp weight per berry (%)84.4 ± 0.6 a85.8 ± 0.2 a88.1 ± 0.5 a89.3 ± 0.8 a88.7 ± 0.3 a90.5 ± 0.3 a
Berry water content
(%)
73.2 ± 0.5 a68 ± 1 b64 ± 2 a63 ± 4 a72 ± 1 a70.2 ± 0.3 a
The statistical analysis comparing the two vineyards was conducted separately for each year. Values are the means of measurements in triplicate. According to Tukey’s range test at p ≤ 0.05, mean values (Mean ± SE) in the same row (assigned different letters from a to b) show significant differences.
Table 3. Must characteristics on technological maturity in relation to the two vineyards for the years 2019, 2020, and 2021.
Years201920202021
MeasurementsV800PV200KV800PV200KV800PV200K
Titratable acidity
(g tartaric L−1 must)
7.6 ± 0.3 a5.75 ± 0.01 b7.1 ± 0.2 a5.6 ± 0.2 b6.9 ± 0.2 a5.8 ± 0.2 b
Total soluble solids (°Brix)20.90 ± 0.06 b24.67 ± 0.07 a22.86 ± 0.06 b26.20 ± 0.01 a20.01 ± 0.03 a20.00 ± 0.05 a
pH3.77 ± 0.01 b3.95 ± 0.03 a3.63 ± 0.01 b3.94 ± 0.02 a3.31 ± 0.01 b3.64 ± 0.00 a
Fructose
(g L−1 must)
121.7 ± 0.9 b131 ± 3 a129 ± 20 b149.2 ± 17 a123 ± 44 a121 ± 75 a
Glucose
(g L−1 must)
127.6 ± 0.9 a134 ± 3 a139 ± 5 a142 ± 6 a127 ± 1 a125.2 ± 0.5 a
Degree of ripeness2.7 ± 0.1 b4.29 ± 0.02 a3.2 ± 0.1 b4.7 ± 0.2 a2.9 ± 0.2 a3.4 ± 1.8 a
The statistical analysis was conducted separately for each year, comparing both vineyards. Values are the means of measurements in triplicate. According to Tukey’s range test at p ≤ 0.05, mean values (Mean ± SE) in the same row (assigned different letters from a to b) show significant differences.
Table 4. Phenolic profile and antioxidant capacity of berry skins and seeds at technological harvest in relation to the two vineyards for the years 2019, 2020, and 2021.
Years201920202021
MeasurementsV800PV200KV800PV200KV800PV200K
Total phenolics, seeds (mg gallic acid g−1 F.W.)20.9 ± 0.4 b24.4 ± 1.5 a22.6 ± 0.3 a20.3 ± 0.1 b24.22 ± 0.05 22.9 ± 0.1 b
Total phenolics, skins (mg gallic acid g−1 F.W.)4.5 ± 0.1 a2.2 ± 0.1 b3.9 ± 0.1 a3.6 ± 0.2 b3.9 ± 1.9 a2.1 ± 1.3 b
Total flavanols, skins (mg catechin g−1 F.W.)4.5 ± 0.1 b4.9 ± 0.3 a10.8 ± 0.1 a10.3 ± 0.2 a5.4 ± 0.2 a4.9 ± 0.2 b
Total flavanols, seeds (mg catechin g−1 F.W.)20.14 ± 0.04 b24.7 ± 0.4 a20.9 ± 0.1 b30.7 ± 1.7 a22.3 ± 0.1 a16.50 ± 0.01 b
Total flavonoids, skins
(mg catechin g−1 F.W.)
25.09 ± 0.16 a26.7 ± 0.6 a17.9 ± 0.2 a12.9 ± 0.3 b29.1 ± 1.6 a25.4 ± 0.2 b
Total flavonoids, seeds
mg catechin g−1 F.W.)
84 ± 2 a62.8 ± 0.4 b80.0 ± 0.2 a69.2 ± 0.9 b82.2 ± 0.1 a61.65 ± 0.01 b
Total flavones and flavonols, skins
(mg rutin g−1 F.W.)
1.56 ± 0.04 a1.20 ± 0.01 b0.92 ± 0.01 a0.80 ± 0.02 b0.52 ± 0.01 a0.45 ± 0.01 b
Total flavones and flavonols, seeds
(mg rutin g−1 F.W.)
0.39 ± 0.02 b0.59 ± 0.02 a0.42 ± 0.01 a0.25 ± 0.02 b0.54 ± 0.01 b0.75 ± 0.01 a
Τotal orthodiphenols, skins
(mg caffeic acid g−1 F.W.)
0.63 ± 0.01 a0.57 ± 0.02 b0.50 ± 0.01 a0.42 ± 0.03 b0.55 ± 0.03 a0.56 ± 0.02 a
Τotal orthodiphenols, seeds
(mg caffeic acid g−1 F.W.)
1.87 ± 0.03 b2.19 ± 0.07 a1.19 ± 0.02 a1.13 ± 0.01 a1.36 ± 0.57 a1.35 ± 0.29 a
Τotal tannins, skins
(mg catechin g−1 F.W.)
11.13 ± 0.03 a9.8 ± 0.6 a13.83 ± 0.03 a12.9 ± 0.1 a6.0 ± 0.1 b7.2 ± 0.2 a
Τotal tannins, seeds
(mg catechin g−1 F.W.)
35.8 ± 0.4 b37 ± 4 a39 ± 1 a38.8 ± 0.1 a35 ± 1 b36.8 ± 0.1 a
FRAP, skins
(mg Trolox g−1 F.W.)
57.82 ± 0 6 a42.6 ± 0.7 b63 ± 4 a43.8 ± 0.3 b60 ± 1 b63 ± 2 a
FRAP, seeds
(mg Trolox g−1 F.W.)
91.3 ± 0.4 a80 ± 2 b90.01 ± 0.17 a84.5 ± 0.4 b93.9 ± 0.2 a85 ± 5 b
DPPH, skins
(mg Trolox g−1 F.W.)
16.9 ± 0.2 a15 ± 1 b14.4 ± 0.3 a11.6 ± 0.9 b17 ± 2 a11 ± 3 b
DPPH, seeds
(mg Trolox g−1 F.W.)
67.6 ± 0.8 a71 ± 1 a86 ± 1 a78.48 ± 0.17 b90 ± 1 a84.7 ± 0.9 b
The statistical analysis was conducted separately for each year, comparing both vineyards. Values are the means of measurements in triplicate. According to Tukey’s range test at p ≤ 0.05, mean values (Mean ± SE) in the same row (assigned different letters from a to b) show significant differences.
Table 5. Anthocyanidin profile of berry skins and individual acids of the must at technological harvest in relation to the two vineyards for the years 2019, 2020, and 2021.
Years201920202021
MeasurementsV800PV200KV800PV200KV800PV200K
Total anthocyanins
(mg malvidin g−1 F.W.)
5.6 ± 0.4 a2.3 ± 0.1 b4.89 ± 0.03 a2.13 ± 0.01 b4.51 ± 0.02 a4.43 ± 0.03 a
Delphinidin
(mg delphinidin
glucoside g−1 F.W.)
0.25 ± 0.01 a0.17 ± 0.01 b0.17 ± 0.03 a0.13 ± 0.05 b0.49 ± 0.01 a0.38 ± 0.01 b
Cyanidin (mg cyanidin glucoside g−1 F.W.)1.55 ± 0.11 a0.53 ± 0.05 b0.48 ± 0.03 a0.35 ± 0.01 b0.75 ± 0.02 a0.46 ± 0.03 b
Petunidin
(mg petunidin
glucoside g−1 F.W.)
0.09 ± 0.002 a0.08 ± 0.001 b0.05 ± 0.005 a0.03 ± 0.001 b0.03 ± 0.001 a0.02 ± 0.001 b
Peonidin (mg peonidin glucoside g−1 F.W.)0.77 ± 0.06 a0.42 ± 0.04 b0.20 ± 0.01 a0.23 ± 0.01 a0.21 ± 0.01 a0.16 ± 0.01 b
Malvidin (mg malvidin glucoside g−1 F.W.)0.58 ± 0.03 a0.49 ± 0.01 b0.092 ± 0.004 a0.089 ± 0.002 a0.015 ± 0.001 b0.024 ± 0.003 a
Acetic ester of malvidin (mg malvidin
glucoside g−1 F.W.)
0.021 ± 0.001 a0.020 ± 0.001 a0.025 ± 0.002 a0.018 ± 0.002 b0.059 ± 0.007 a0.055 ± 0.024 a
Coumaric ester of malvidin (mg malvidin
glucoside g−1 F.W.)
0.211 ± 0.064 a0.151 ± 0.064 b0.75 ± 0.026 a0.61 ± 0.057 b0.83 ± 0.013 b0.92 ± 0.012 a
Tartaric acid
(μg mL−1 must)
9379 ± 37 a8758 ± 29 b8426 ± 19 a7698 ± 15 b8088 ± 16 a7245 ± 15 b
Malic acid
(μg mL−1 must)
5476 ± 28 a4804 ± 30 b5801 ± 16 a4702 ± 12 b5425 ± 13 a4231.5 ± 14 b
Ascorbic acid
(μg mL−1 must)
164 ± 6 a150 ± 3 b137 ± 1 a116.2 ± 0.1 b131.5 ± 0.02 a123.7 ± 0.01 b
Succinic acid
(μg mL−1 must)
15.5 ± 0.4 b19.5 ± 0.6 a22.08 ± 0.04 a21.37 ± 0.08 a14.39 ± 0.23 b18.07 ± 0.24 a
Fumaric acid
(μg mL−1 must)
3.42 ± 0.14 b3.56 ± 0.22 a2.35 ± 0.22 a2.2 ± 0.1 a3.20 ± 0.01 a2.82 ± 0.03 b
The statistical analysis was conducted separately for each year, comparing both vineyards. Values are the means of measurements in triplicate. According to Tukey’s range test at p ≤ 0.05, mean values (Mean ± SE) in the same row (assigned different letters from a to b) show significant differences.
Table 6. Principal components (PCs) of the variables evaluated.
Variables/MeasurementsEigenvectors/Principal Components
PC1PC2PC3PC4PC5
Acetic ester of malvidin
(mg malvidin glucoside g−1 F.W.)
−0.119−0.2370.0060.033−0.047
Ascorbic acid
(μg ascorbic acid mL−1 must)
0.223−0.0250.0370.0720.158
Berry water content (%)0.101−0.1740.091−0.178−0.068
Berry length (mm)−0.189−0.0120.1720.189−0.012
Berry width (mm)−0.139−0.0770.199−0.113−0.096
Coumaric ester of malvidin
(mg malvidin glucoside g−1 F.W.)
−0.202−0.111−0.148−0.0160.077
Cyanidin
(mg cyanidin glucoside g−1 F.W.)
0.211−0.089−0.050−0.219−0.070
Degree of ripeness−0.0960.2050.1590.039−0.157
Delphinidin
(mg delphinidin glucoside g−1 F.W.)
−0.046−0.257−0.0050.008−0.173
DPPH, seeds (mg Trolox g−1 F.W.)−0.171−0.105−0.1430.1990.002
DPPH, skins (mg Trolox g−1 F.W.)0.191−0.085−0.0930.239−0.229
FRAP, seeds (mg Trolox g−1 F.W.)0.051−0.123−0.246−0.104−0.131
FRAP, skins (mg Trolox g−1 F.W.)−0.021−0.185−0.191−0.0910.342
Fructose (g L−1 must)−0.0740.212−0.010−0.016−0.309
Fumaric Acid
(μg fumaric acid mL−1 must)
0.159−0.1170.2000.101−0.095
Glucose (g L−1 must)−0.0350.159−0.0660.2800.086
Grape length (cm)0.196−0.0480.206−0.0650.015
Grape weight (g)−0.1400.0390.276−0.170−0.026
Grape width (cm)−0.227−0.0780.004−0.148−0.053
Malic acid
(μg malic acid mL−1 must)
0.131−0.014−0.2590.2330.005
Malvidin
(mg malvidin glucoside g−1 F.W.)
0.2230.0580.140−0.0450.041
Peonidin
(mg peonidin glucoside g−1 F.W.)
0.2330.0150.047−0.186−0.039
Percentage of pulp weight per berry (%)0.1200.232−0.0470.0210.059
Percentage of seed weight per berry (%)−0.1650.0150.220−0.1680.248
Percentage of skin weight per berry (%)0.2410.0360.0070.063−0.035
Petunidin
(mg petunidin glucoside g−1 F.W.)
0.2350.0590.0600.0670.128
pH0.0400.1930.143−0.2140.016
Succinic acid
(μg succinic acid mL−1 must)
−0.0890.209−0.0300.1110.345
Tartaric acid
(μg tartaric acid mL−1 must)
0.2160.028−0.0320.077−0.038
Total flavonoids, seeds
(mg catechin g−1 F.W.)
0.1980.1310.1240.0650.072
Total flavonoids, skins
(mg catechin g−1 F.W.)
0.083−0.2160.1500.165−0.033
Total acidity (g tartaric L−1 must)0.154−0.100−0.231−0.0140.065
Total anthocyanins
(mg malvidin g−1 F.W.)
0.091−0.172−0.190−0.1440.260
Total flavanols, seeds
(mg catechin g−1 F.W.)
0.0730.256−0.0080.004−0.037
Total flavanols, skins
(mg catechin g−1 F.W.)
−0.0960.178−0.2250.0770.064
Total flavones and flavonols, seeds
(mg rutin g−1 F.W.)
−0.057−0.1790.2040.1000.272
Total flavones and flavonols, skins
(mg rutin g−1 F.W.)
0.2280.1010.023−0.0810.059
Total phenolics, seeds
(mg gallic acid g−1 F.W.)
−0.012−0.1120.1110.5380.080
Total phenolics, skins
(mg gallic acid g−1 F.W.)
0.1110.005−0.294−0.087−0.236
Total soluble solids (°Brix)−0.0270.2430.0450.090−0.167
Weight of 30 berries (g)−0.0670.246−0.0020.0550.025
Τotal orthodiphenols, skins
(mg caffeic acid g−1 F.W.)
0.168−0.1610.108−0.0280.183
Τotal orthodiphenols, seeds
(mg caffeic acid g−1 F.W.)
0.180−0.0060.2410.1180.034
Τotal tannins, seeds
(mg catechin g−1 F.W.)
−0.0580.145−0.059−0.0930.248
Τotal tannins, skins
(mg catechin g−1 F.W.)
0.0500.226−0.151−0.0730.195
Eigenvalue15.9413.627.422.121.69
Individual variation explained35.4330.2716.494.723.77
Cumulative variation explained35.4365.7182.286.9390.71
Table 7. Component weights for grape variables (dependent) and predictors (independent: altitude, year) on Components 1–2 from partial least squares (PLS) analysis. Variables were autoscaled using the SIMPLS method.
Independent Variables
12
Altitude−0.0150.298
Cultivation period (Year)0.2540.040
Dependent Variables
12
Acetic ester of malvidin −0.1750.137
Ascorbic acid0.1840.062
Berry water content0.0300.109
Berry length −0.169−0.120
Berry width−0.147−0.077
Coumaric ester of malvidin−0.2040.093
Cyanidin0.1530.142
Degree of ripeness−0.024−0.247
Delphinidin−0.1190.178
DPPH, seeds −0.1750.100
DPPH, skins 0.1410.165
FRAP, seeds 0.0110.217
FRAP, skins −0.0700.213
Fructose 0.079−0.029
Fumaric acid0.0970.038
Glucose 0.043−0.059
Grape length 0.149−0.009
Grape weight−0.116−0.199
Grape width−0.219−0.011
Malic acid0.1150.171
Malvidin0.206−0.048
Peonidin0.2020.028
Percentage of pulp weight per berry0.176−0.113
Percentage of seed weight per berry−0.143−0.165
Percentage of skin weight per berry0.2180.039
Petunidin 0.219−0.006
pH0.091−0.201
Succinic acid −0.010−0.163
Tartaric acid 0.1950.056
Total flavonoids, seeds0.209−0.097
Total flavonoids, skins0.0030.112
Total acidity 0.1070.220
Total anthocyanins0.0300.232
Total flavanols, seeds 0.141−0.161
Total flavanols, skins −0.022−0.049
Total flavones and flavonols, seeds−0.1060.017
Total flavones and flavonols, skins0.226−0.023
Total phenolics, seeds −0.0440.036
Total phenolics, skins 0.1020.165
Total soluble solids 0.051−0.201
Total orthodiphenols, skins 0.0930.109
Total orthodiphenols, seeds 0.148−0.057
Τotal tannins, seeds −0.003−0.096
Total tannins, skins0.116−0.082
Weight of 30 berries 0.018−0.194
Disclaimer/Publisher’s Note: The statements, opinions and data contained in all publications are solely those of the individual author(s) and contributor(s) and not of MDPI and/or the editor(s). MDPI and/or the editor(s) disclaim responsibility for any injury to people or property resulting from any ideas, methods, instructions or products referred to in the content.