Article

Biogenic CO2, CH4, and N2O Emissions from Abalone Culture in Tidal Ponds

1
Department of Aquaculture, National Taiwan Ocean University, Keelung City 202-24, Taiwan
2
Institute of Marine Environment and Ecology, National Taiwan Ocean University, Keelung City 202-24, Taiwan
3
Center of Excellence for the Oceans, National Taiwan Ocean University, Keelung City 202-24, Taiwan
*
Author to whom correspondence should be addressed.
Environments 2025, 12(9), 313; https://doi.org/10.3390/environments12090313
Submission received: 7 August 2025 / Revised: 1 September 2025 / Accepted: 2 September 2025 / Published: 4 September 2025

Abstract

Abalone is among the most highly prized seafoods, valued for its delicate flavor and texture. As abalone aquaculture continues to expand, addressing its environmental impacts has become increasingly important. Although aquaculture is recognized as a contributor to greenhouse gas (GHG) emissions, the specific mechanisms and pathways of GHG emissions—particularly in abalone farming—remain poorly understood. To clarify the patterns and drivers of GHG emissions in abalone (Haliotis discus) culture systems, this study was conducted in three aquaculture ponds located in Gongliao District, New Taipei City, Taiwan. We measured CO2, CH4, and N2O fluxes along with key environmental parameters to assess variation across sampling locations, times, and seasons. The results showed that sampling time had no significant effect on GHG flux variations, whereas seasonal changes influenced all three gases, and sampling location significantly affected N2O flux only. During the culture period, average fluxes were 2.19 ± 10.83 mmol m−2 day−1 for CO2, 2.11 ± 2.81 µmol m−2 day−1 for CH4, and 1.65 ± 2.73 µmol m−2 day−1 for N2O, indicating that the abalone ponds served as net sources of these GHGs. When converted to CO2-equivalents (CO2-eq), the total average CO2-eq flux from the ponds was 0.02 ± 0.09 mg CO2-eq m−2 day−1, calculated using global warming potential (GWP20 and GWP100) metrics. This study provides the first comprehensive assessment of GHG emissions in abalone pond systems and offers valuable insights into their emission dynamics. The findings contribute to the scientific basis needed to improve aquaculture GHG inventories.

1. Introduction

Abalone is one of the most highly prized seafoods, known for its delicate flavor and texture. Historically, abalone was primarily sourced through fisheries and illegal catches, leading to overexploitation and depletion of natural populations [1]. In recent decades, however, farmed abalone production has steadily increased, surpassing fishery production since 2008 [1]. This shift has not only supported human food supply but also contributed to the conservation of ocean resources [2]. Currently, the top ten producers of farmed abalone are China, South Korea, South Africa, Chile, Australia, Taiwan, Japan, the USA, New Zealand, and Mexico. Total farmed production has reached 243,506 metric tons, significantly higher than the 4510 metric tons from fisheries [1].
Anthropogenic greenhouse gas (GHG) emissions—particularly carbon dioxide (CO2), methane (CH4), and nitrous oxide (N2O)—are a major environmental challenge in the 21st century due to their role in global climate change. Among these, CH4 and N2O have significantly higher global warming potentials (GWP100), at 29.8 and 273, respectively, based on the IPCC Sixth Assessment Report [3]. Aquaculture, as a human activity, has been shown to contribute substantially to absolute GHG emissions at the global scale [4,5,6]. Aquaculture accounts for 0.49% of total greenhouse gas (GHG) emissions [7]. Although this share is lower than that from commercial activities (15.3%), transportation (28.5%), and industry (30.1%), reducing GHG emissions from aquaculture remains crucial for slowing the pace of climate change [8]. Although the specific mechanisms and pathways are not yet fully understood, GHG output appears to be influenced by several factors such as pond size, environmental conditions, culture types, bacterial communities, and management practices in certain species, including Sinonovacula constricta [9]; Eriocheir sinensis [10]; Litopenaeus vannamei [11]; Marsupenaeus japonicus and Ruditapes philippinarum [12]; Crassostrea virginica [13]; and Oreochromis niloticus [14].
Previous studies have shown that different GHGs are produced through distinct processes in aquaculture systems. CO2 is primarily generated through biological activities such as respiration, gut digestion, and shell calcification [15,16,17]. It is also linked to bacterial metabolism, chemical oxygen demand, and biological oxygen demand [13,18]. CH4 is produced in anoxic environments, mediated by microbes through the degradation of organic matter [19]. N2O is generated either through gut digestion or environmental processes via microbial nitrification or denitrification, which occurs under both oxic and anoxic conditions [20]. Although GHG emissions from aquaculture have been estimated, they have demonstrated relatively low emissions compared to the production of an equivalent amount of livestock [13,21]. However, the mechanisms behind these emissions remain poorly understood, particularly in abalone farming, posing challenges for further industry development.
While previous studies have often focused on energy use and life-cycle assessments of aquaculture systems, direct measurements of biogenic greenhouse gas (GHG) fluxes at the pond scale remain scarce. To address this gap, our study quantified CO2, CH4, and N2O fluxes derived solely from pond water–sediment–biota interactions, thereby providing a more precise understanding of the biogenic contribution of abalone aquaculture to GHG emissions. Specifically, we monitored the air–water fluxes of these gases during routine water exchange cycles in three culture ponds in Taiwan, the world’s sixth-largest producer of abalone [1]. The objectives of this study were to (1) determine the spatio-temporal variation of CO2, CH4, and N2O emissions across different locations, times, and seasons; (2) assess the effect of environmental factors on GHG fluxes; and (3) quantify the carbon dioxide equivalent (CO2-eq) emissions from abalone culture. The findings will contribute to a better understanding of GHG dynamics in abalone aquaculture and offer insight relevant to the aquaculture industry.

2. Materials and Methods

2.1. Study Area

This study was conducted in the Gongliao District of New Taipei City, Taiwan (25°04′23″ N, 121°55′12″ E), home to the largest tidal aquaculture facility in the country (Figure 1). The region has a subtropical monsoonal climate, with an average annual precipitation of 2800 mm and a mean annual air temperature of 21 °C. Air temperatures reach a peak of 29 °C in July and August and drop to around 15 °C in January and February. The mean annual water temperature is 23.2 °C, with values peaking at 28.1 °C in August and declining to around 18.8 °C in February. Rainfall is concentrated between September and March, with the plum rain season in May and June. The area is affected by a semidiurnal tide, with a tidal range of approximately 1.0–1.5 m. Meteorological data were obtained from the Central Weather Administration.

2.2. Pond Management

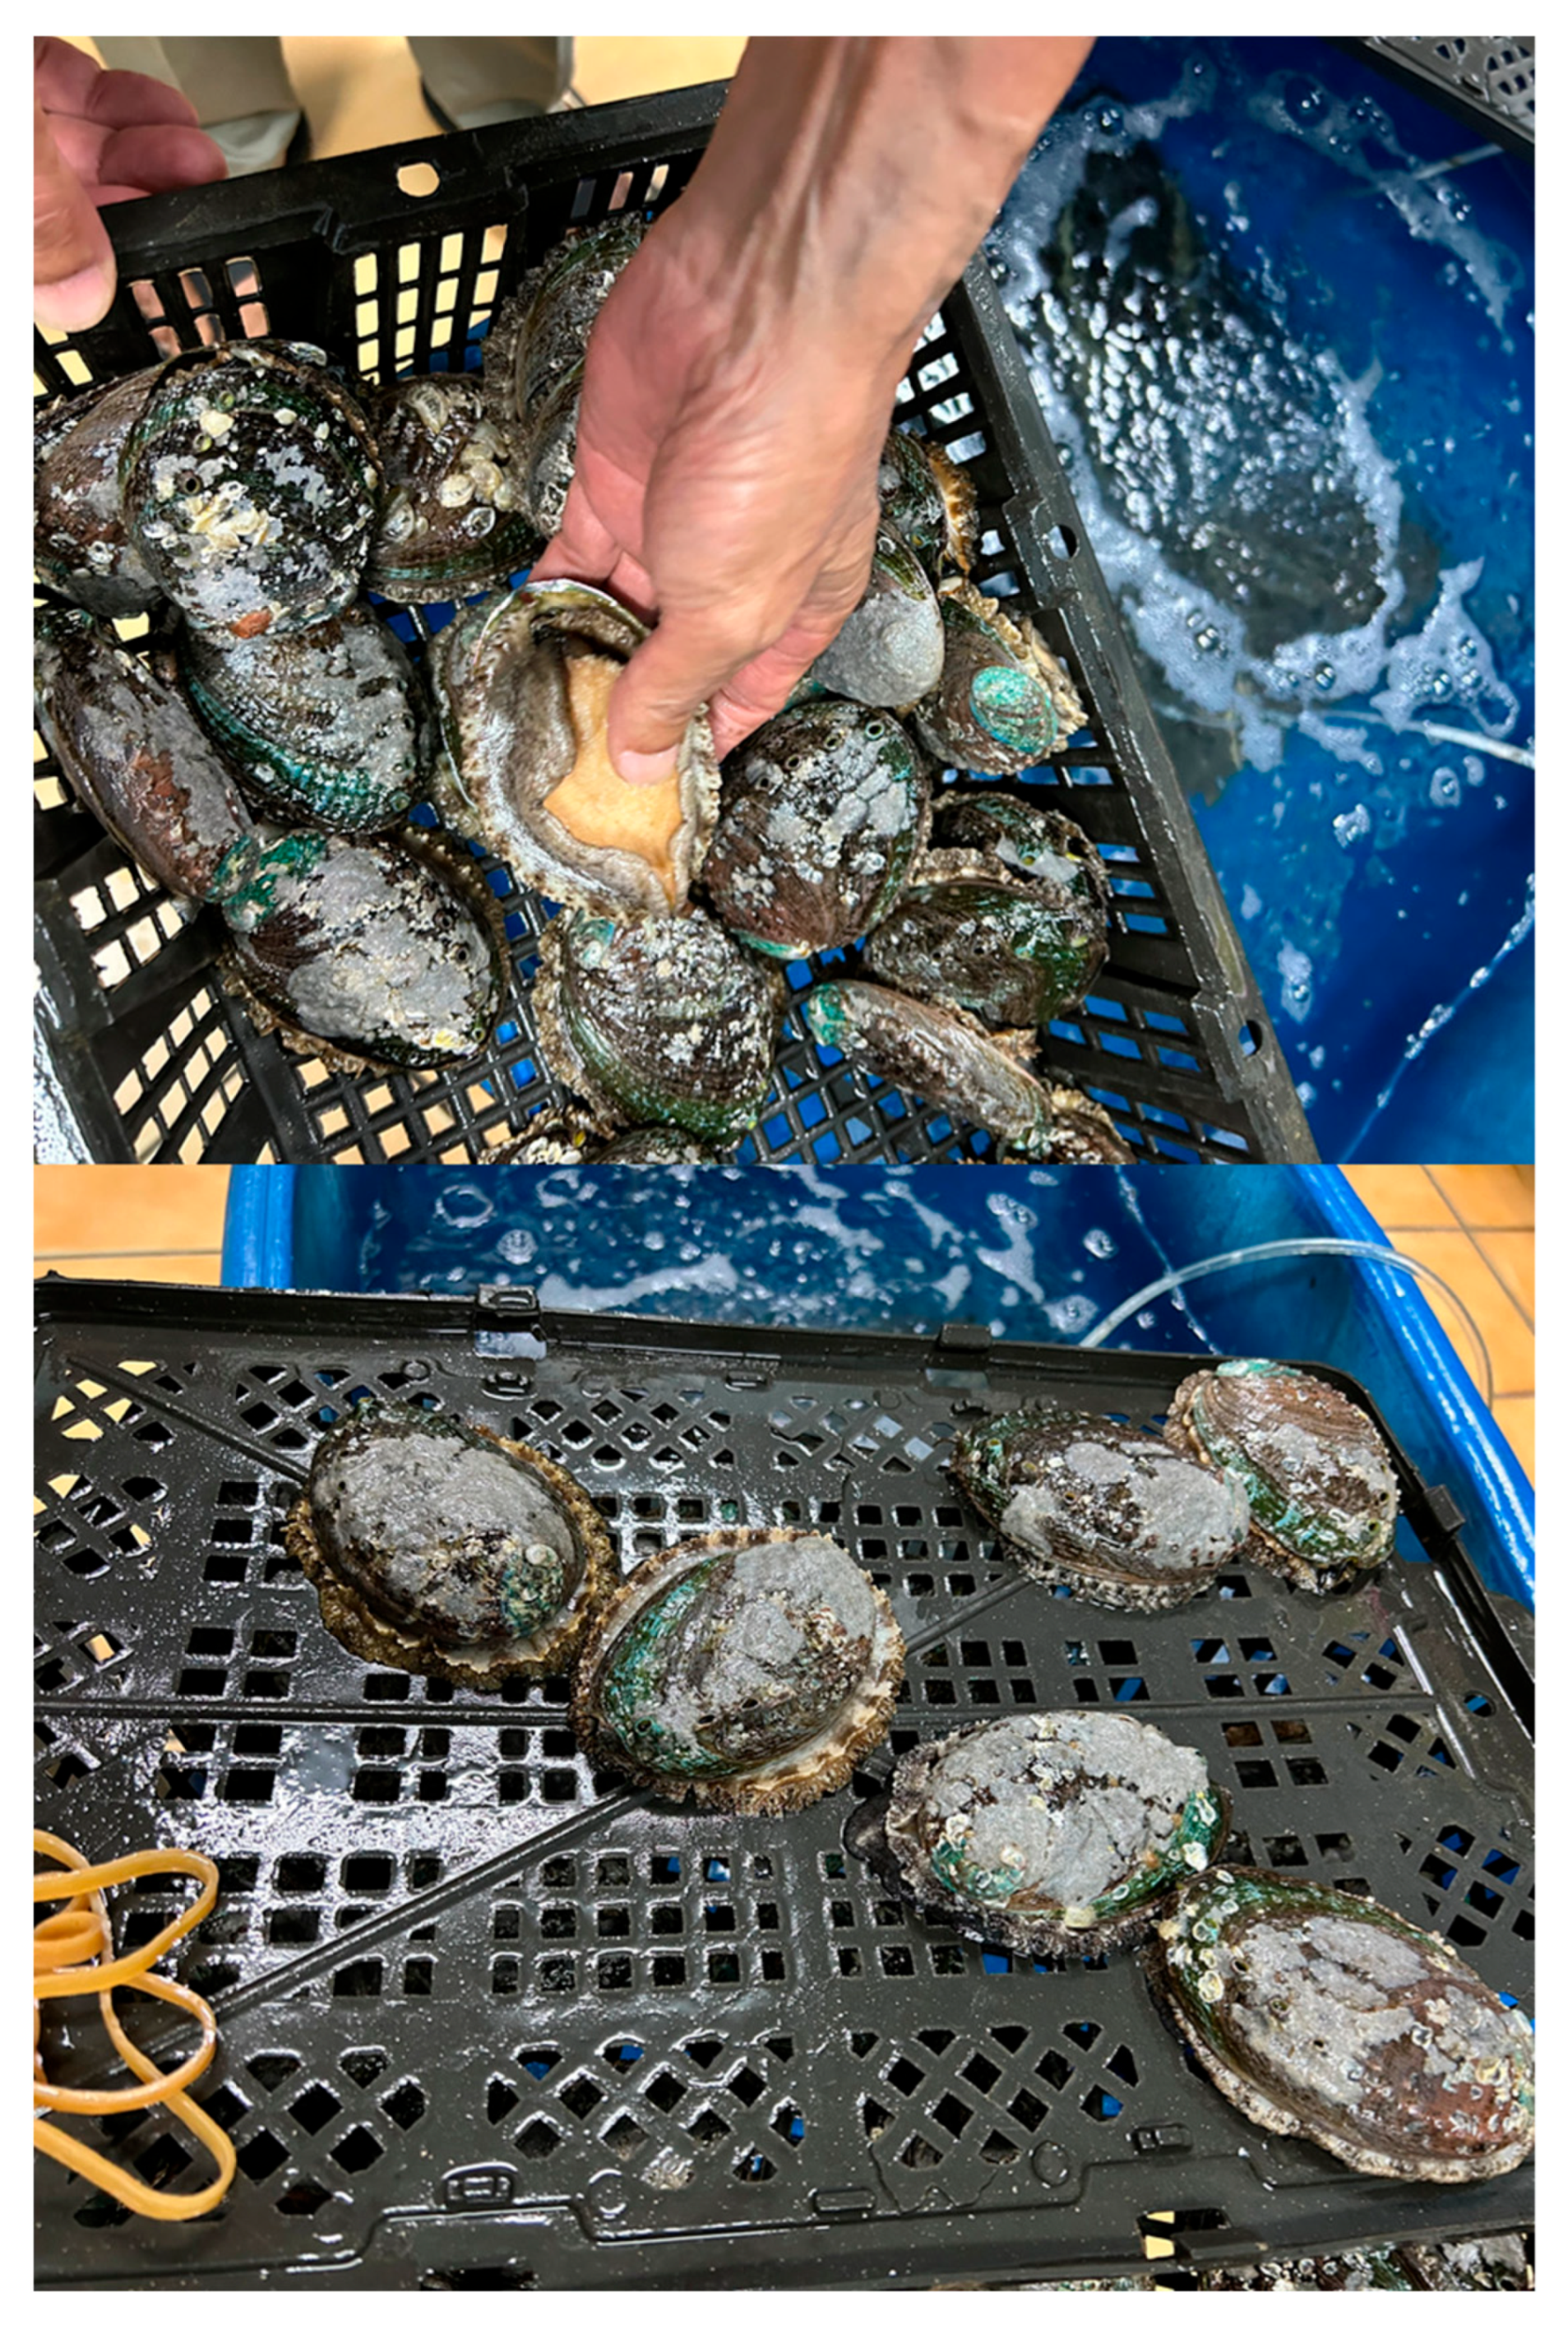
Gongliao District, one of the earliest abalone aquaculture regions in Taiwan, was an ideal location for investigating GHG emissions. The aquaculture facility was originally constructed using concrete by local farmers in the 1960s and has since supported continuous abalone farming. This long history has created a mature aquaculture system characterized by stable environmental conditions, accumulated management practices, and sociocultural significance, making it particularly suitable for GHG emission studies. The main cultured species was Haliotis discus (Figure 2). In this system, ponds were located in the intertidal zone and functioned as tide pools that depended on tidal fluctuations for water exchange, with water depths ranging between 2 and 4 m. Stocking began in early May, and harvesting occurred from October to December, with the exact timing largely influenced by market prices. Although water exchange was an essential feature of this system, the exchange rate could not be quantified in this study because it varied substantially with tides and wave conditions. Prior to the stocking stage, from March to April, farmers turn over the tiles placed at the pond bottom, which serve as habitat substrates for the abalone. This practice exposes any accumulated hydrogen sulfide to sunlight, allowing them to oxidize. Aside from this step, no additional pond preparation is carried out.
Due to the elongated shape of the ponds, the landward side experienced poorer water circulation, which often resulted in lower oxygen levels. Previous studies have shown that dissolved oxygen concentrations below 3.08 mg L−1 can negatively affect the acid–base balance and metabolism of H. diversicolor supertexta [22]. To prevent such effects, aerators powered by 2-horsepower blowers were used in this study to maintain dissolved oxygen levels between 4.75 mg L−1 and 7.15 mg L−1, which were sufficient to avoid any negative impacts associated with low oxygen conditions. Details of the culture system are provided in Table 1. The experiment spanned from March to October 2023 to monitor the full aquaculture cycle, including the before stocking stages (March to April), the during stocking stages (May to September), and harvest period (October). In this study, three adjacent aquaculture ponds, each exclusively culturing H. discus and located within 20 m of one another, were selected. The abalones were fed red macroalgae (Gracilaria spp.), which provide essential nutrients for growth and shell formation. Gracilaria is widely farmed in Yunlin County, southern Taiwan, offering a stable and low-cost local food supply for the abalone industry. From March to April, 70 kg of fresh algae is supplied daily, increasing to 85 kg per day from May to August, and reaching 100 kg daily from September onward. Algae are supplied twice a day—at 07:00 and 16:00—with the feeding rate adjusted to 4–8% of the abalone biomass. The feeding ration was adjusted based on observations of feed consumption and weather conditions.

2.3. Sampling and Environmental Factors Analysis

Five sampling campaigns were conducted over a 212-day period (15 March, 21 April, 23 May, 10 August, and 12 October) in three adjacent ponds culturing H. discus. Within each pond, two fixed sites were established: one on the landward side and the other on the seaward (ocean-facing) side. At each site, two sampling points were positioned at least 2 m apart. Each sampling point was measured twice during every campaign: once in the morning (5:00–7:00 AM) and once in the afternoon (1:00–3:00 PM). Consequently, each pond yielded eight measurements per sampling campaign.
At each sampling event, water samples were collected from all three ponds. At each site, seawater salinity, pH, and dissolved oxygen (DO) were measured in situ during both morning and afternoon campaigns using a water quality monitoring system (WQC30-1-1B WMS30-0-11, TOA-DKK, Tokyo, Japan). Mid-water samples were collected at every campaign in three 120 mL borosilicate bottles and one 1 L plastic bottle after filtration through a 48-µm plankton net (Chuan-Kuan Co., Ltd., Kaohsiung, Taiwan). To inhibit microbial activity, 0.2 mL of saturated mercuric chloride solution was added to each bottle, following the dosage reported [23,24]. In addition, surface water temperature was continuously recorded at hourly intervals using a data logger (MX2202, HOBO, New York, NY, USA) installed 20 cm below the surface in Pond 2 on the landward side, near the shoreline.
The three 120 mL water samples were stored in borosilicate bottles and subsequently allocated for analyses of CO2, CH4, and N2O. The water collected in the 1 L plastic bottle was used to analyze other environmental factors, including ammonium nitrogen (NH3-N), nitrate nitrogen (NO3-N), nitrite nitrogen (NO2-N), dissolved organic carbon (DOC), dissolved inorganic phosphorus (DIP), and chlorophyll a (Chl-a). NH3-N was measured using an improved indophenol blue method [25]. NO3-N and NO2-N were measured using the pink azo dye method [26]. DIP were measured using the molybdophosphate blue method [27]. Chl-a was collected by filtration through GF/F glass microfiber filters, extracted with 90% acetone in darkness for 24 h, and quantified using a spectrophotometer [28]. Water samples were acidified with 2 mol L−1 HCl to remove inorganic carbon and then combusted at 680 °C in a high-temperature oxidation tube for dissolved organic carbon (DOC) determination using a total organic carbon analyzer (TOC-L Series, Shimadzu, Kyoto, Japan) [9].
During the second and third sampling campaigns, two sediment traps were deployed at each pond to collect accumulated material, with one placed on the landward side and the other on the seaward side. Each trap was attached to a supporting tube and stabilized with a plumb bob to maintain its position. The trap openings were positioned approximately 20 cm above the pond sediment surface, and the traps remained in place for seven days. However, no visually detectable sediment was found inside the traps, which we attribute either to active grazing by organisms or to the inherently low sediment availability in the study area.

2.4. GHG Concentrations

The partial pressure of CO2 (pCO2) was calculated using water temperature, pH, salinity, dissolved inorganic carbon (DIC), and total alkalinity (TA) as input parameters. DIC and TA were measured using a dissolved inorganic carbon analyzer (LI-5300A AS-C6L, LI-COR, Bourne, MA, USA) and a total alkalinity titrator (LI-5800A AS-ALK3, LI-COR, Bourne, MA, USA), respectively. Both DIC and TA were then entered into the CO2SYS software (version 2.3, Excel-based) to estimate pCO2 [29], using the K1 and K2 equilibrium constants reported by previous studies [30]. Similar to previous studies, our estimations may be affected by measurement precision, assumptions in carbonate equilibrium, and the selection of dissociation constants, which could result in discrepancies when compared with direct pCO2 measurements [31,32].
Dissolved CH4 and N2O concentrations were determined in the laboratory using the headspace equilibration technique, following methods described in previous studies [33,34]. Briefly, a 10 mL volume of ultra-high purity nitrogen gas was injected into each glass bottle through the rubber stopper using a syringe, while simultaneously withdrawing 10 mL of water with a second syringe to create a headspace [35]. The bottles were then placed in a shaking incubator at 100 rpm and 25 °C and agitated vigorously for 1.5 h to ensure equilibration between the gas and aqueous phases. After shaking, the samples were left to stand at 25 °C for 1 h before extracting the headspace gas for analysis. Analyses were conducted using a gas chromatograph (Agilent 7890, Agilent Technologies, CA, USA) equipped with a flame ionization detector (FID) for CH4 and an electron capture detector for N2O [36,37].

2.5. GHG Fluxes

The gas flux across the water–air interface was calculated using the following formulas:
Flux water–air (mol m−2 day−1) = k (Cobs − Ceq)
where Cobs represents the measured concentration of dissolved CO2, CH4, and N2O in water, and Ceq denotes the corresponding equilibrium concentration relative to the atmosphere (μmol L−1). Equilibrium concentrations (Ceq) were estimated using gas solubility equations [38,39], based on in situ temperature and salinity, and the atmospheric molar fractions of CO2, CH4, and N2O. Monthly average atmospheric concentrations of these gases from March to October 2023 were obtained from the NOAA Global Monitoring Laboratory, with reference to the study by published reports [6,24].
The gas transfer velocity (k, cm h−1) was calculated following previously described methods [40,41]:
k   =   0.251   ×   u 10 2 × ( Sc / 660 ) 1 / 2
where u10 is the wind speed at 10 m height (m s−1), and Sc is the Schmidt number specific to each gas (CO2, CH4, and N2O), which varies with water temperature. Wind speed data were obtained from the Fulong Weather Station, Central Weather Administration (Taiwan) and estimated using the logarithmic wind profile relationship as the below equation [42]. During the study period, monthly average wind speeds (u10) ranged from 0.1 to 2.3 m s−1.
u 10 = U   ×   ( 1 + C d 10 0.5 k ×   ln 10 z )
where U is the wind speed (m s−1) measured at above the water surface, C d 10 0.5 is the drag coefficient at 10 m above the water surface (0.0013 m s−1), k is the von Karman constant (0.41), and z represents the measurement height above the water surface, with wind speed data obtained from the Fulong Weather Station.
In this study, positive flux values indicate net emissions of CO2, CH4, and N2O from the water surface to the atmosphere, while negative values indicate net absorption, suggesting that the water body acts as a sink for these greenhouse gases. The flux measurements in this study represent biogenic GHG emissions derived from pond water–air exchange and sediment–water interactions. Fossil-fuel-related emissions from energy use (e.g., pumping, aeration) were not included in the analysis.

2.6. Statistic Analysis

Data are presented as mean ± standard deviation (SD). The Kruskal–Wallis test, a one-way analysis of variance (ANOVA) by ranks, was used to evaluate differences among treatments (sampling locations, times, and seasons) for each parameter (environmental factors and GHG fluxes), with the significance level set at 0.05. Additionally, Pearson’s correlation coefficient (r) was used to assess the relationships between CO2, CH4, and N2O fluxes and environmental parameters, with significance levels set at 0.05. All statistical analyses were conducted using SPSS version 22.0 (IBM, Armonk, NY, USA).

3. Results

3.1. Environmental Parameters

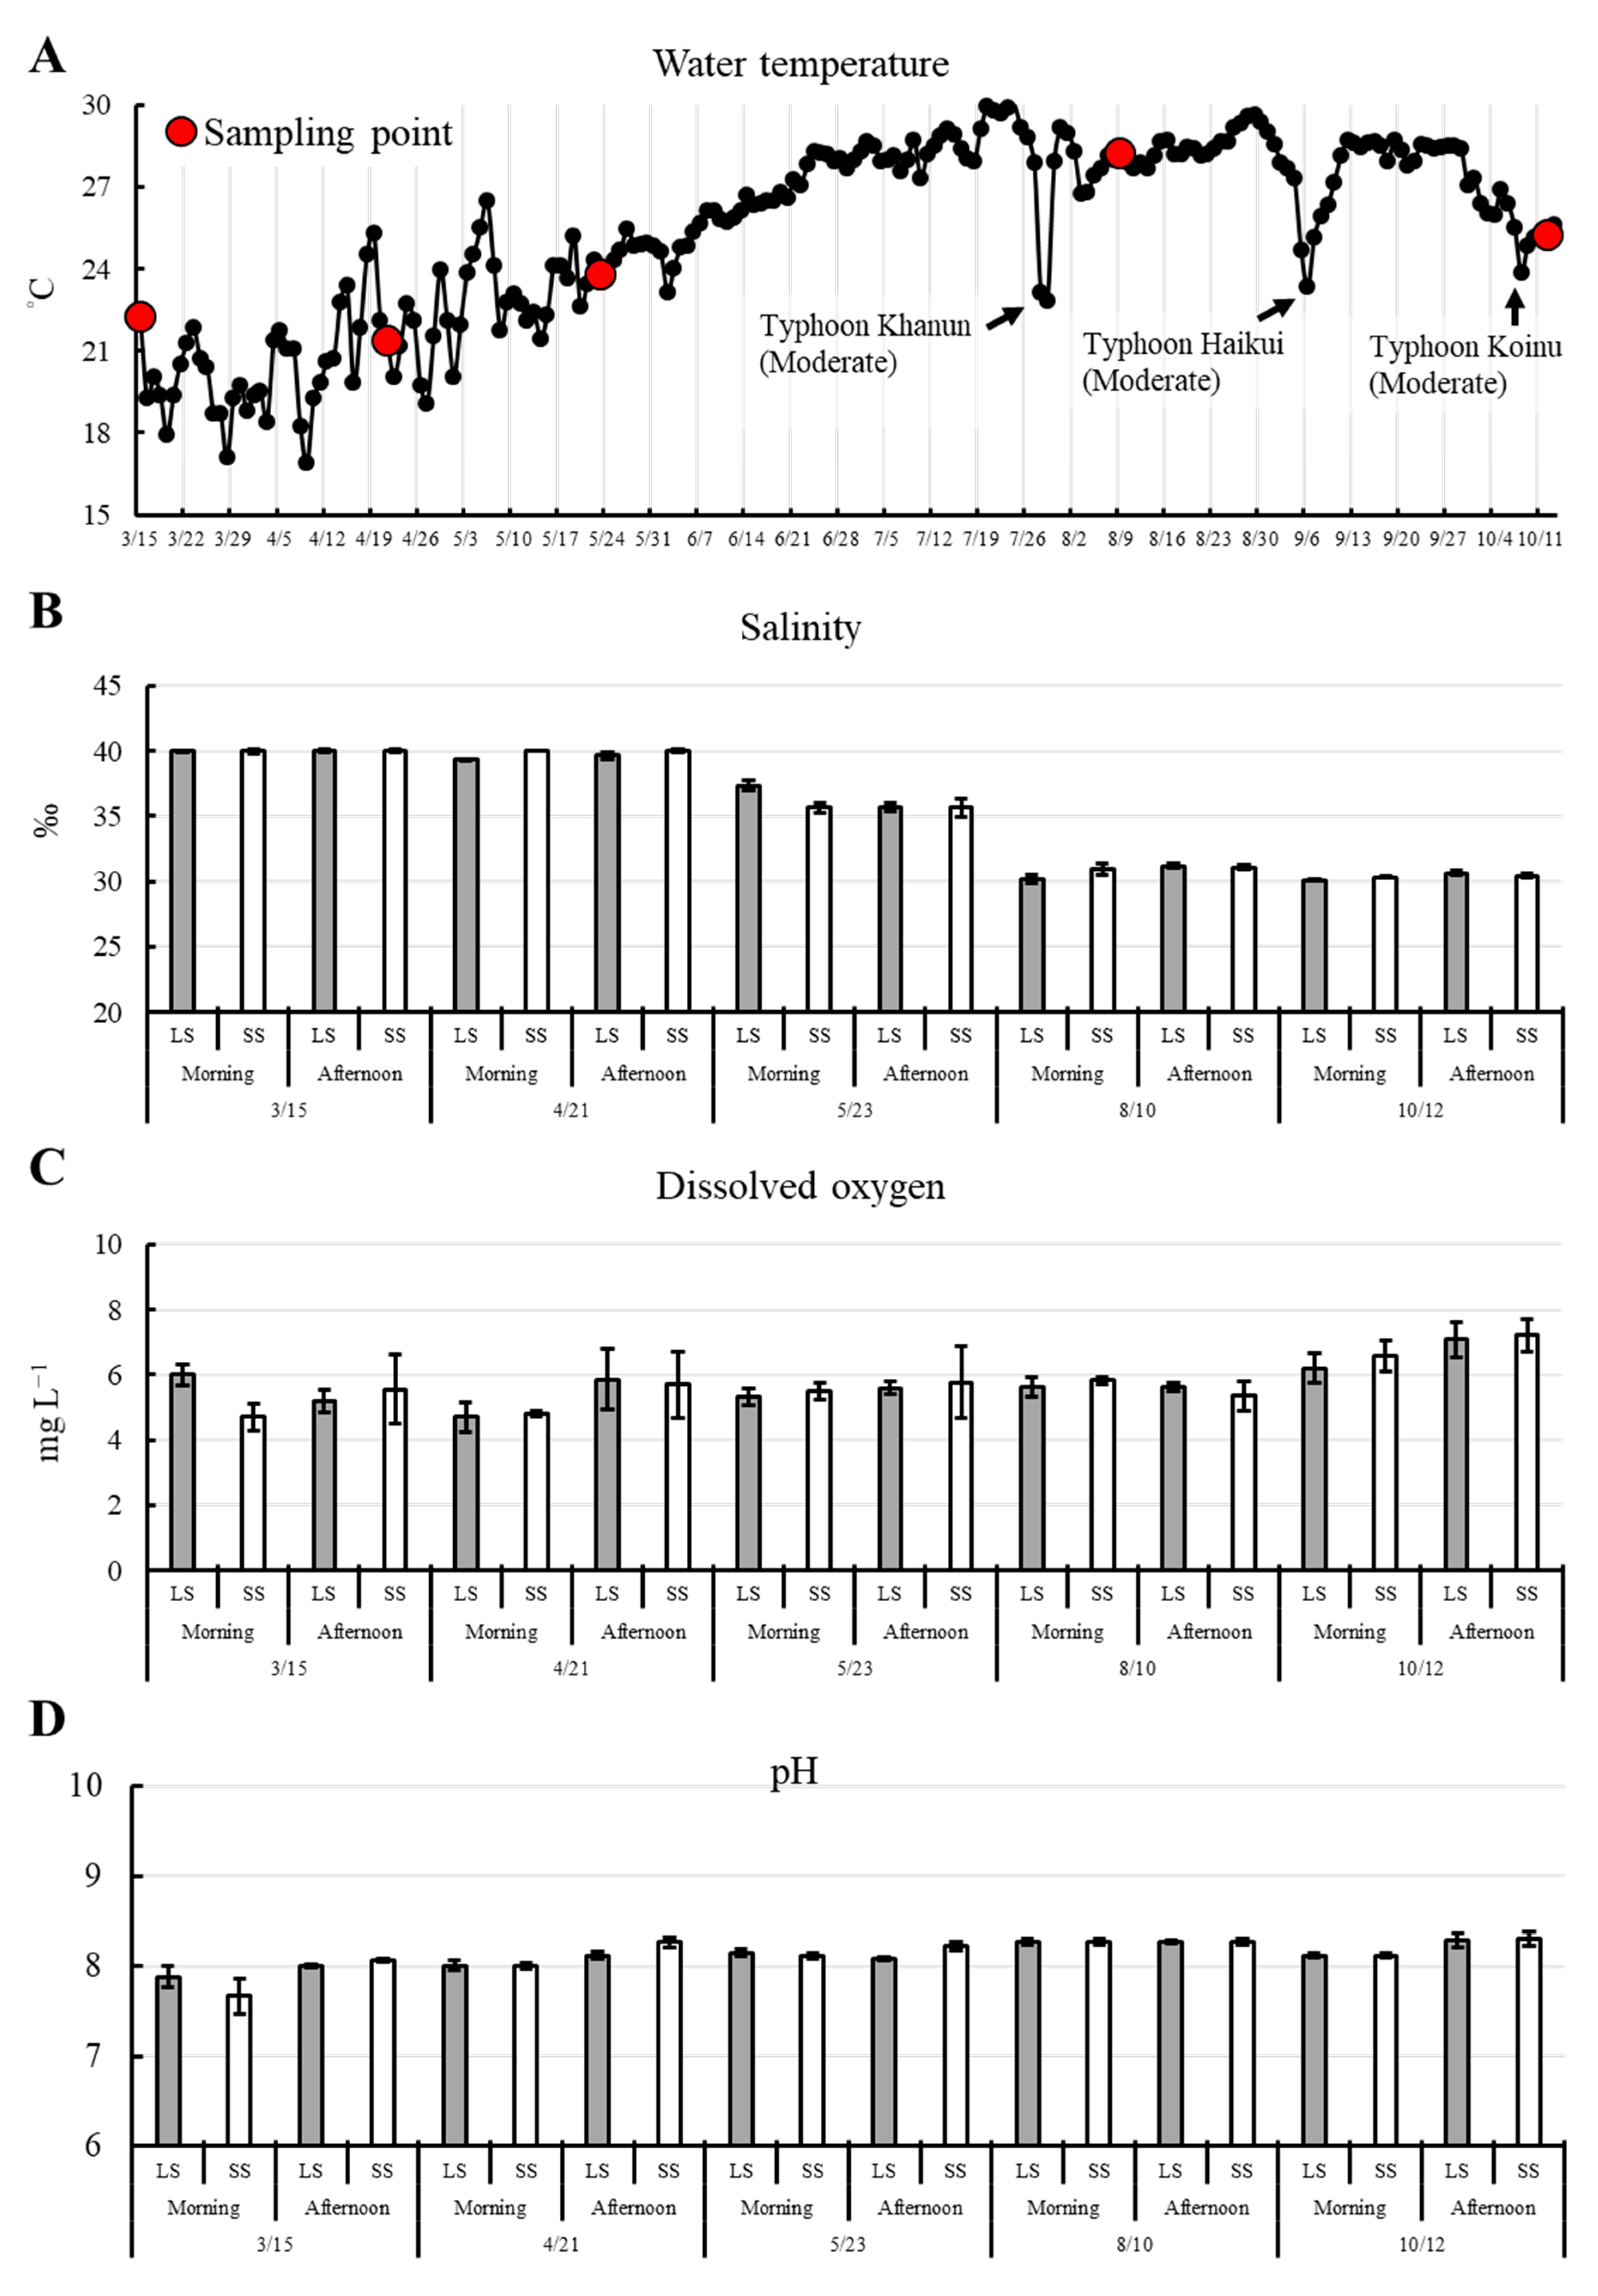
Seawater temperature showed no significant differences between sampling locations (p = 0.954) or sampling periods (p = 0.633). However, seasonally, temperatures followed the order: autumn > winter > summer > spring (p < 0.001). Significant fluctuations were observed between March and May, with temperatures ranging from a minimum of 16.9 °C to a maximum of 26.5 °C. Temperatures then gradually increased, peaking at 29.8 °C on 20 July, before declining steadily in September. During the study period, three typhoons occurred, each causing a marked drop in seawater temperature to approximately 23 °C (Figure 3A; Table 2).
Salinity showed no significant differences between sampling locations within the aquaculture ponds (p = 0.943), and values were similar between morning and afternoon measurements (p = 0.695). However, salinity varied significantly across seasons (spring > summer > autumn > winter), with mean values of 40.00 ± 0.00‰ in spring, 37.92 ± 2.05‰ in summer, 30.86 ± 0.45‰ in autumn, and 30.38 ± 0.23‰ in winter (p < 0.001) (Figure 3B; Table 2) (mean ± standard deviation).
For DO, no significant differences were observed between sampling locations (p = 0.903) or sampling periods (p = 0.539). However, significant seasonal differences were found, with concentrations in winter higher than in other seasons (p < 0.001) (Figure 3A; Table 2). No significant fluctuations in Chl-a concentrations were detected during the sampling times, with all samples measuring less than 0.01 mg L−1. The pH also showed no significant differences between sampling locations (p = 0.557) or sampling periods (p = 0.130). However, seasonal variation was observed, with pH values ranging from 7.89 to 8.21, following the order: autumn ≥ winter ≥ summer > spring (p < 0.001) (Figure 3D; Table 2).
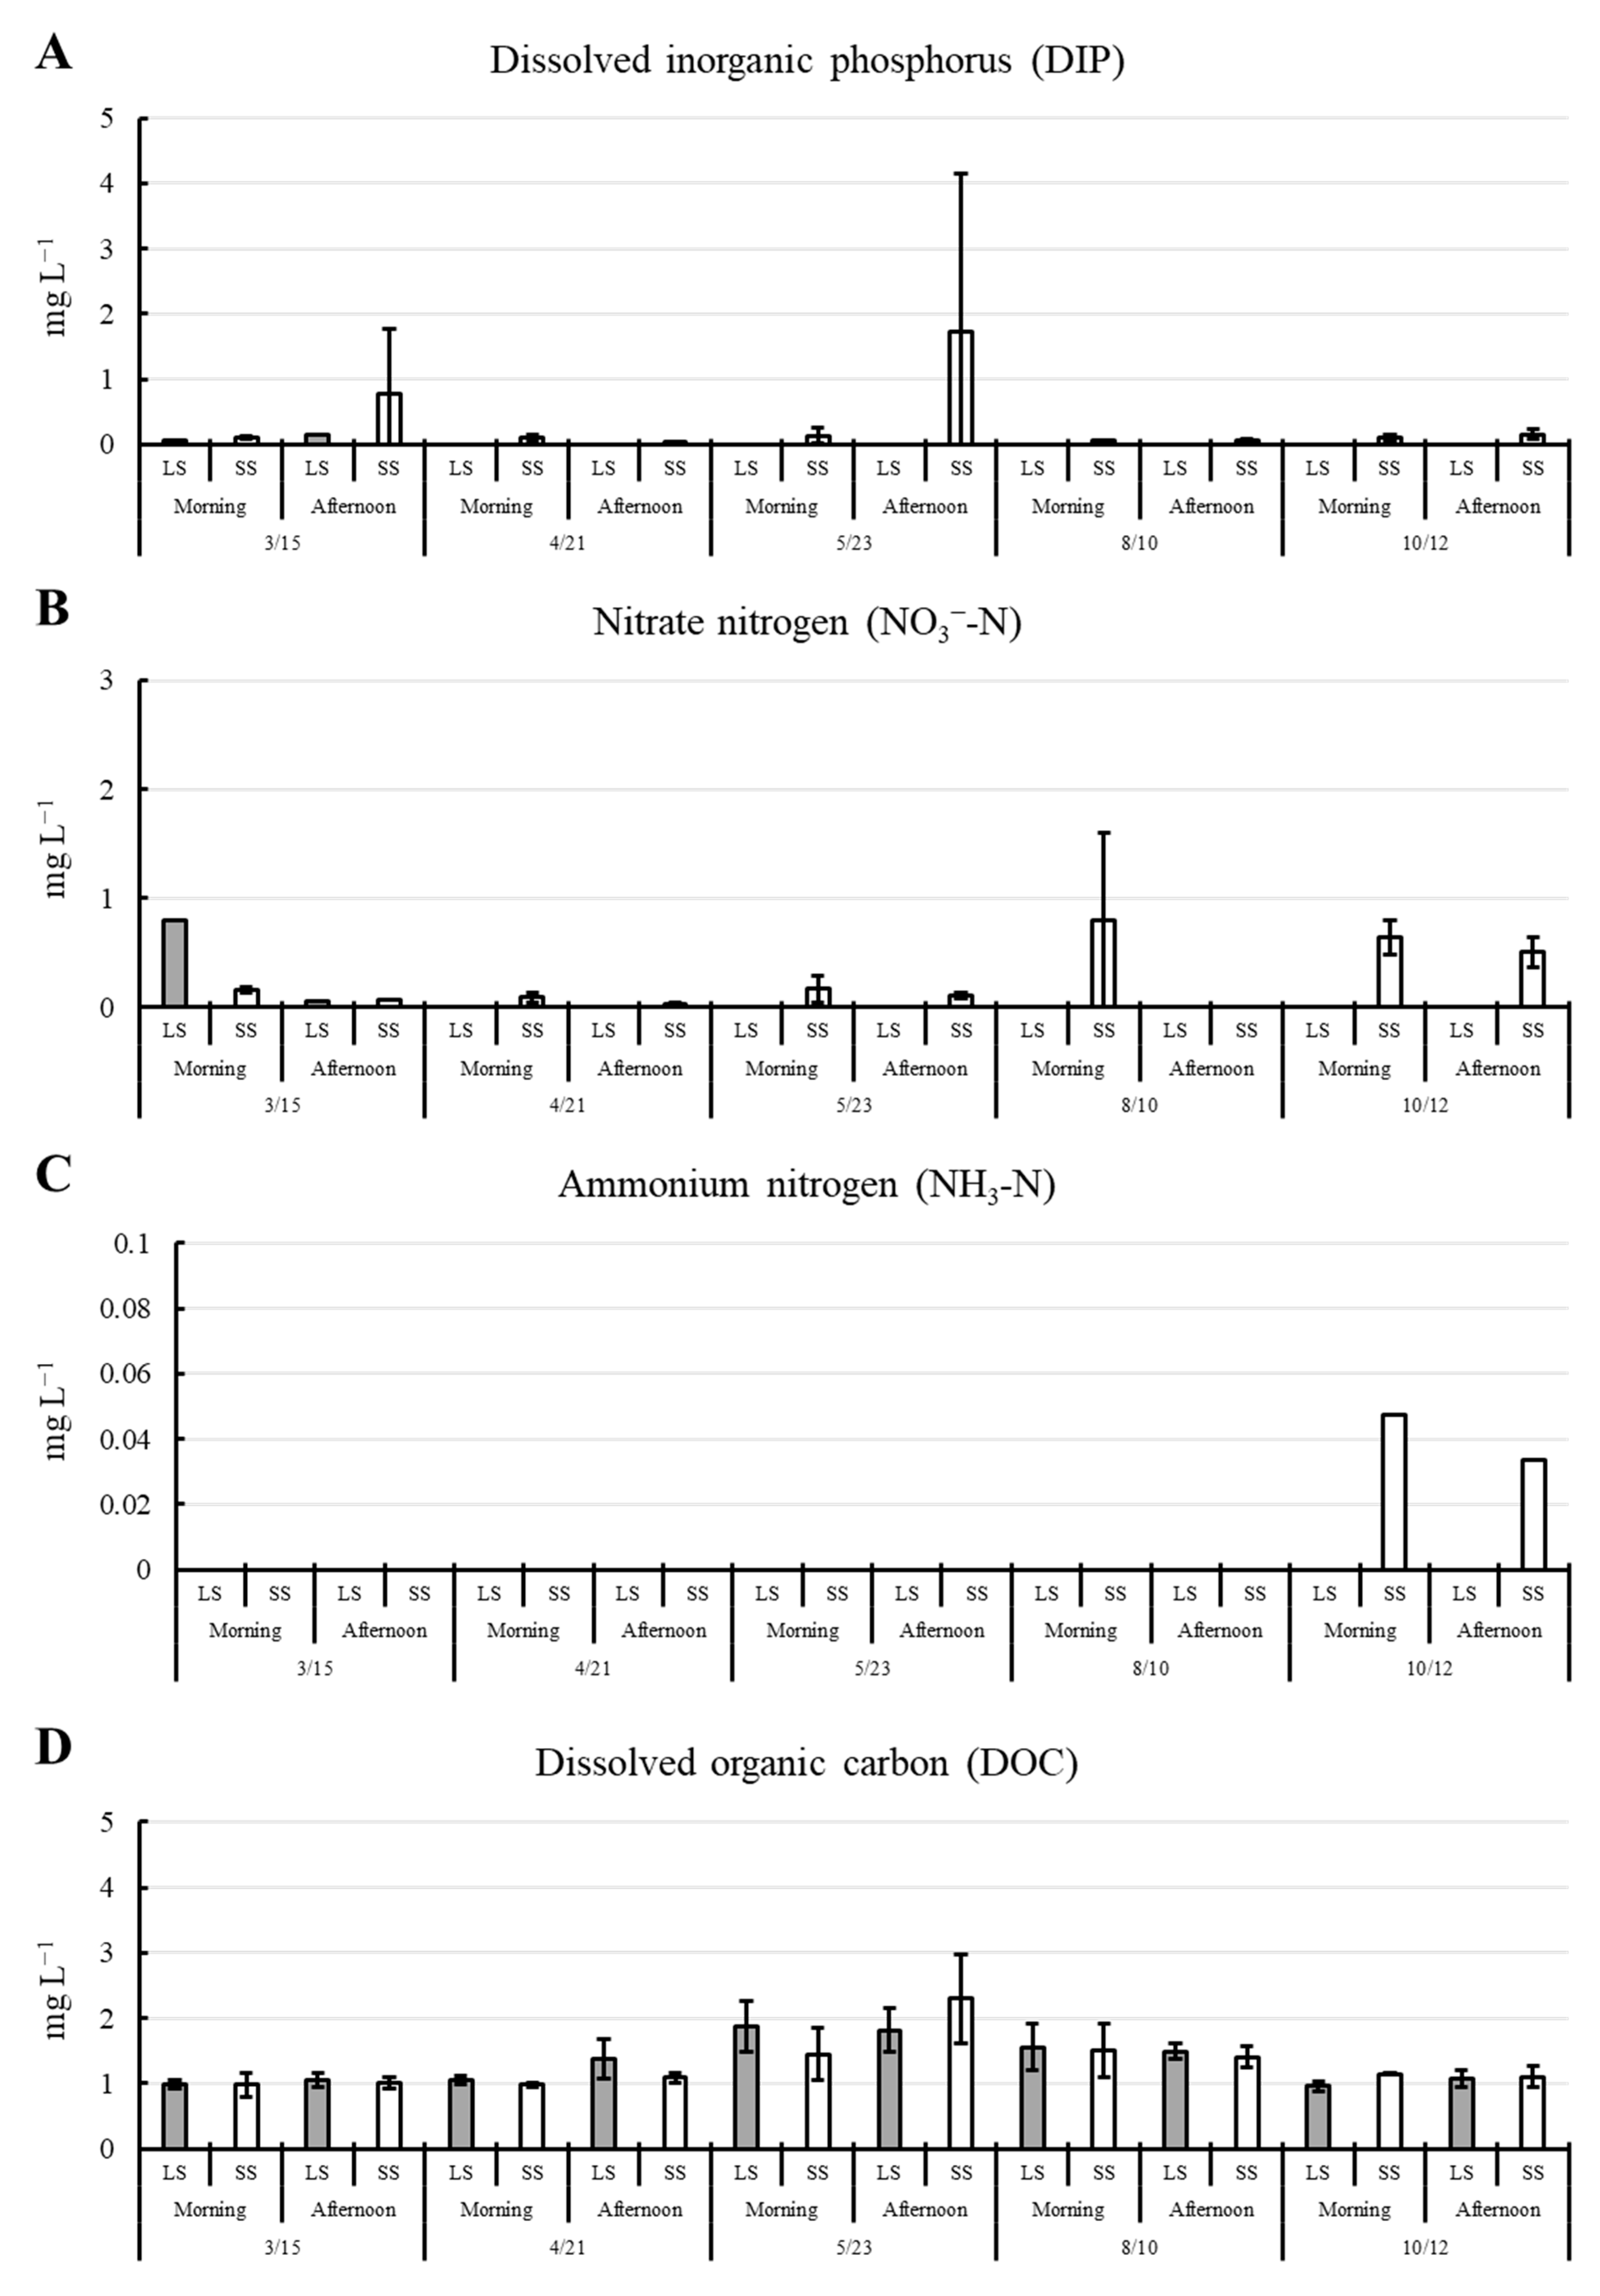
With respect to nutrients, nitrite nitrogen concentrations remained below the instrument’s detection limit throughout the entire cultivation period and were therefore considered non-detectable. DIP showed no significant differences across sampling locations (p = 0.802), sampling times (p = 0.235), and seasons (p = 0.149) (Figure 4A; Table 2). Nitrate nitrogen concentrations showed no significant overall differences between sampling periods (p = 0.560); however, at certain sites, concentrations on the landward side of the ponds were significantly higher than those on the seaward side (p = 0.018). Seasonally, nitrate nitrogen concentrations followed the order: winter ≥ spring ≥ summer > autumn (p < 0.001) (Figure 4B; Table 2). Ammonium nitrogen concentrations did not differ significantly between sampling locations (p = 0.475) or periods (p = 0.677), but seasonal variation was observed, with concentrations in winter markedly higher than in other seasons (p < 0.001) (Figure 4C; Table 2).
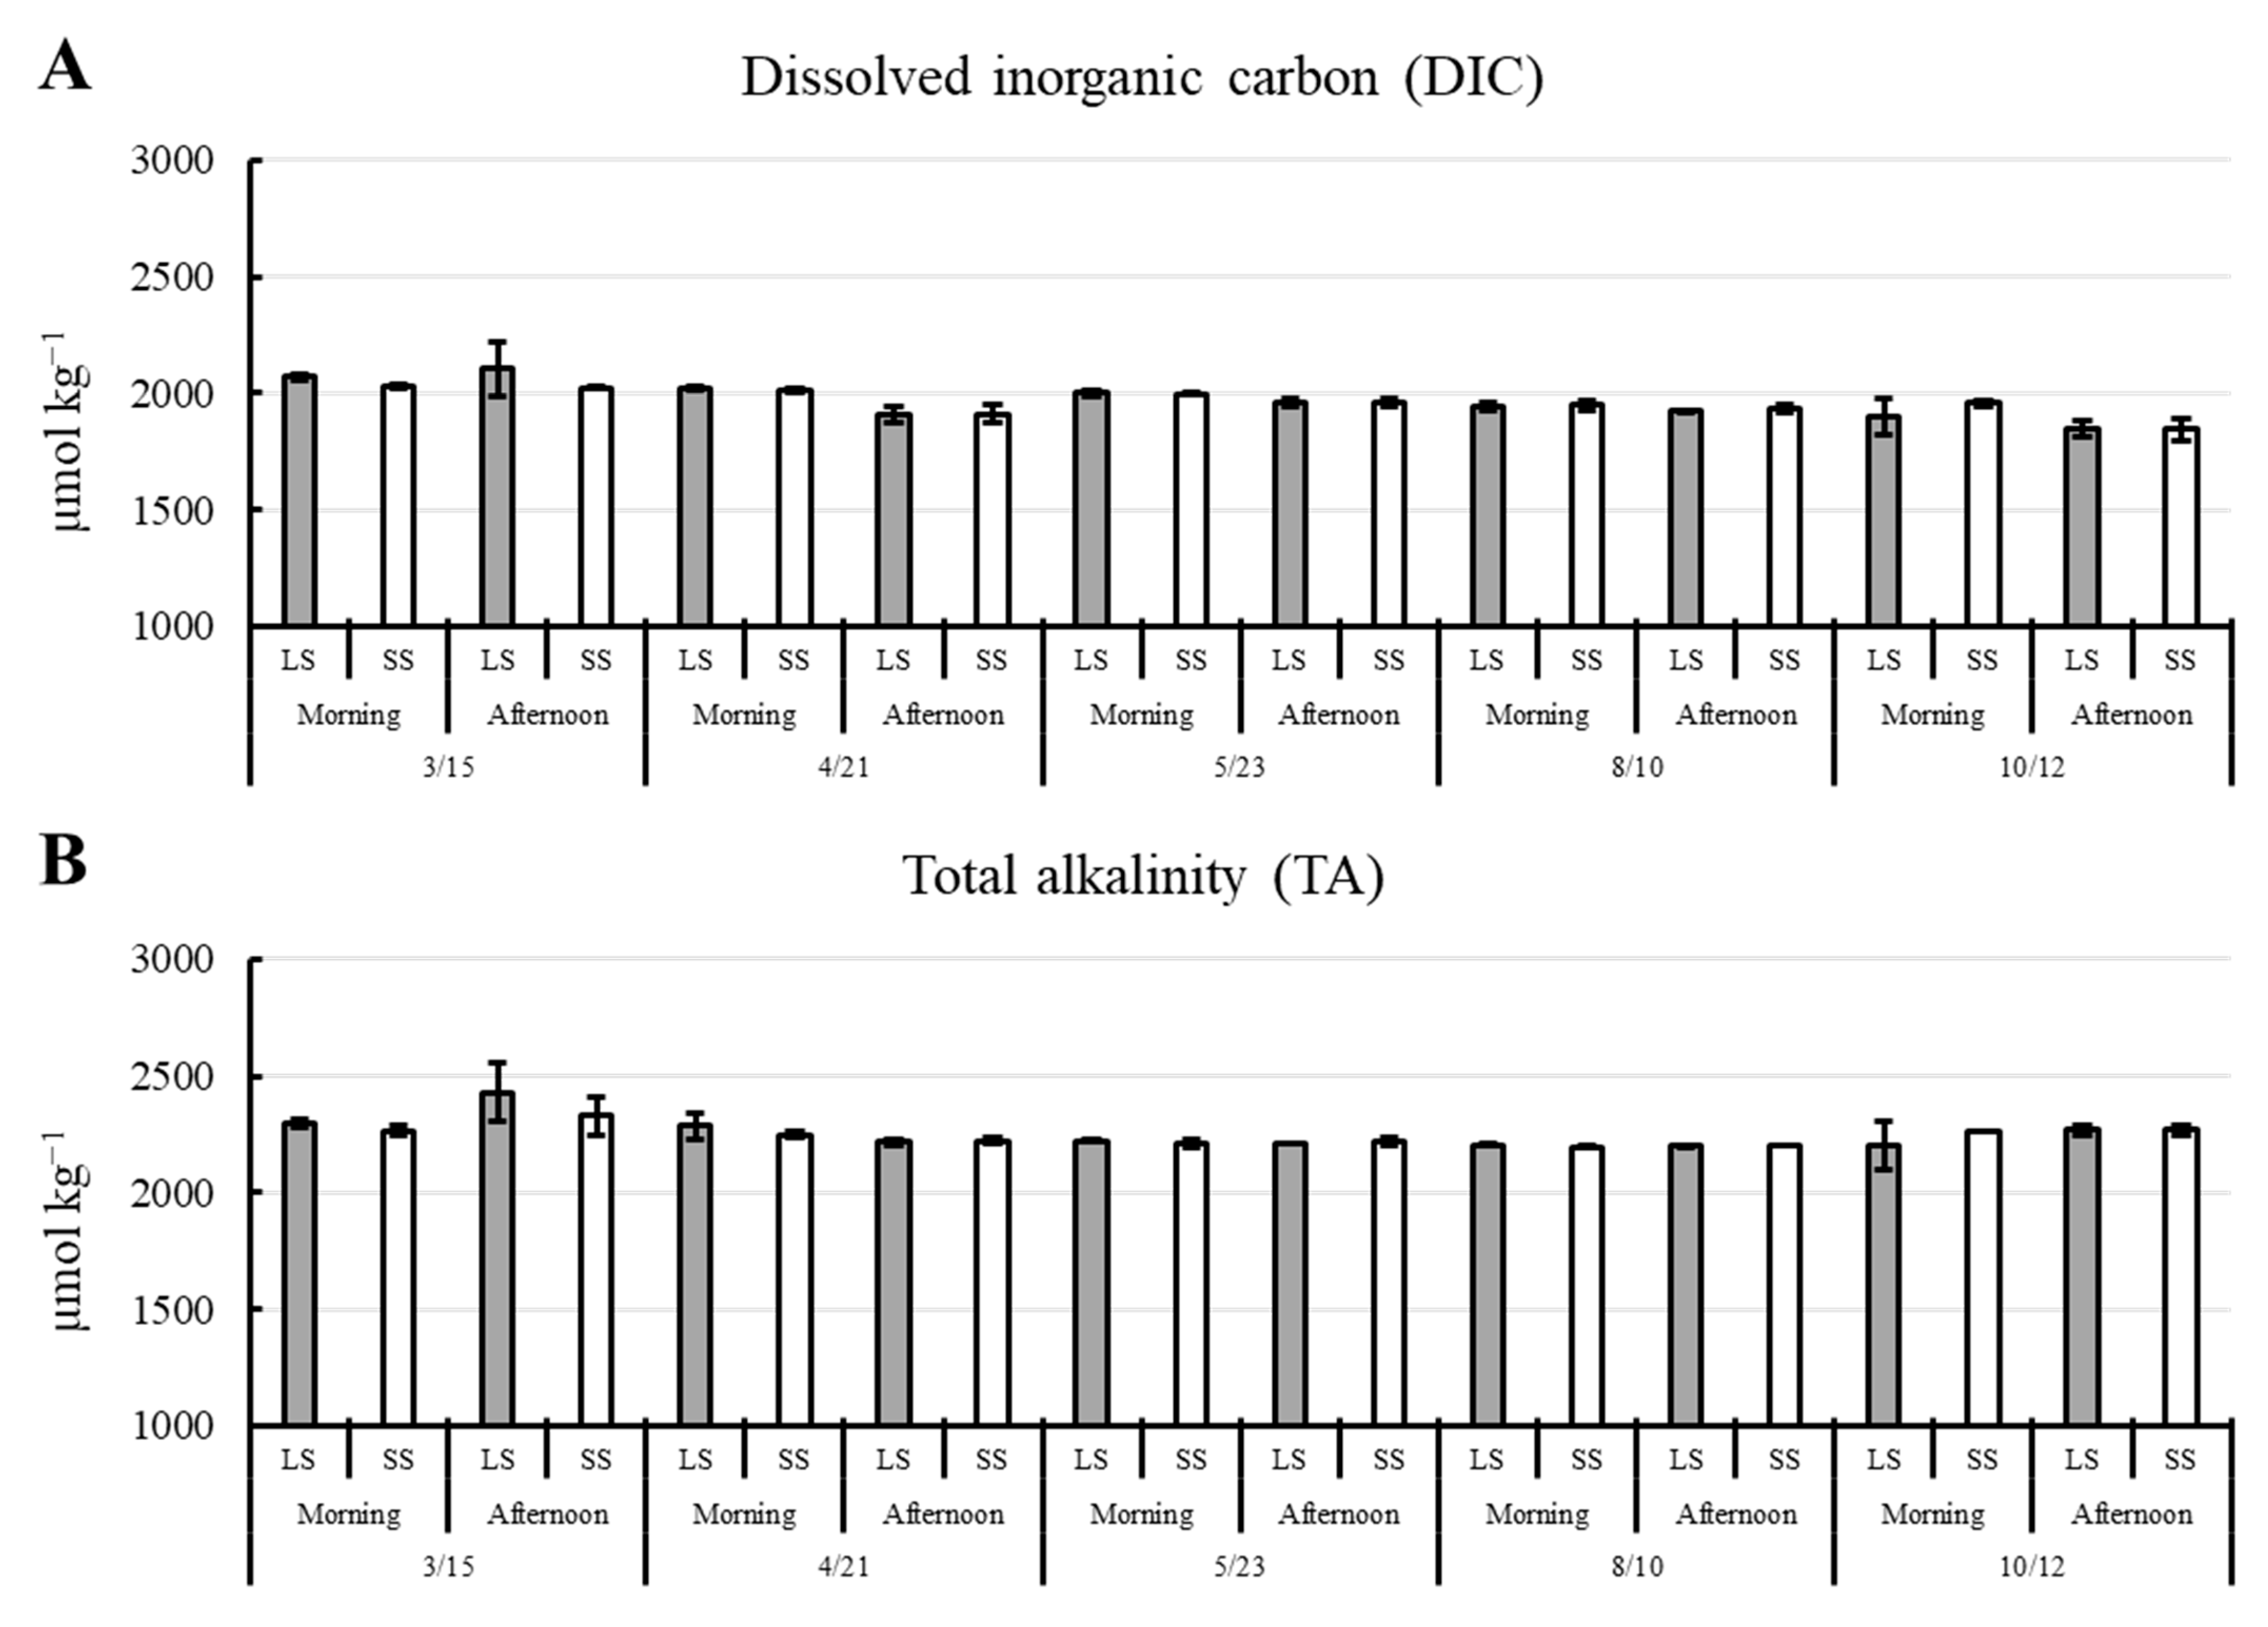
For DOC, no significant differences were observed between sampling locations (p = 0.227) or sampling periods (p = 0.980). However, significant seasonal differences were found, with concentrations in summer and autumn higher than those in spring and winter (p < 0.001) (Figure 4D; Table 2). Both DIC and TA showed no significant differences between sampling locations (DIC, p = 0.884; TA, p = 0.655) or periods (DIC, p = 0.424; TA, p = 0.500). However, seasonal patterns were observed; DIC followed the order spring > summer > autumn, winter (p < 0.001), whereas TA followed the order spring > winter > summer > autumn (p < 0.001) (Table 2). The average DIC ranged from 1887.92 µmol kg−1 to 2055.95 µmol kg−1 over the culture period (Figure 5A), while TA ranged from 2200.00 µmol kg−1 to 2330.88 µmol kg−1 (Figure 5B).

3.2. Variation in GHG Concentrations and Fluxes

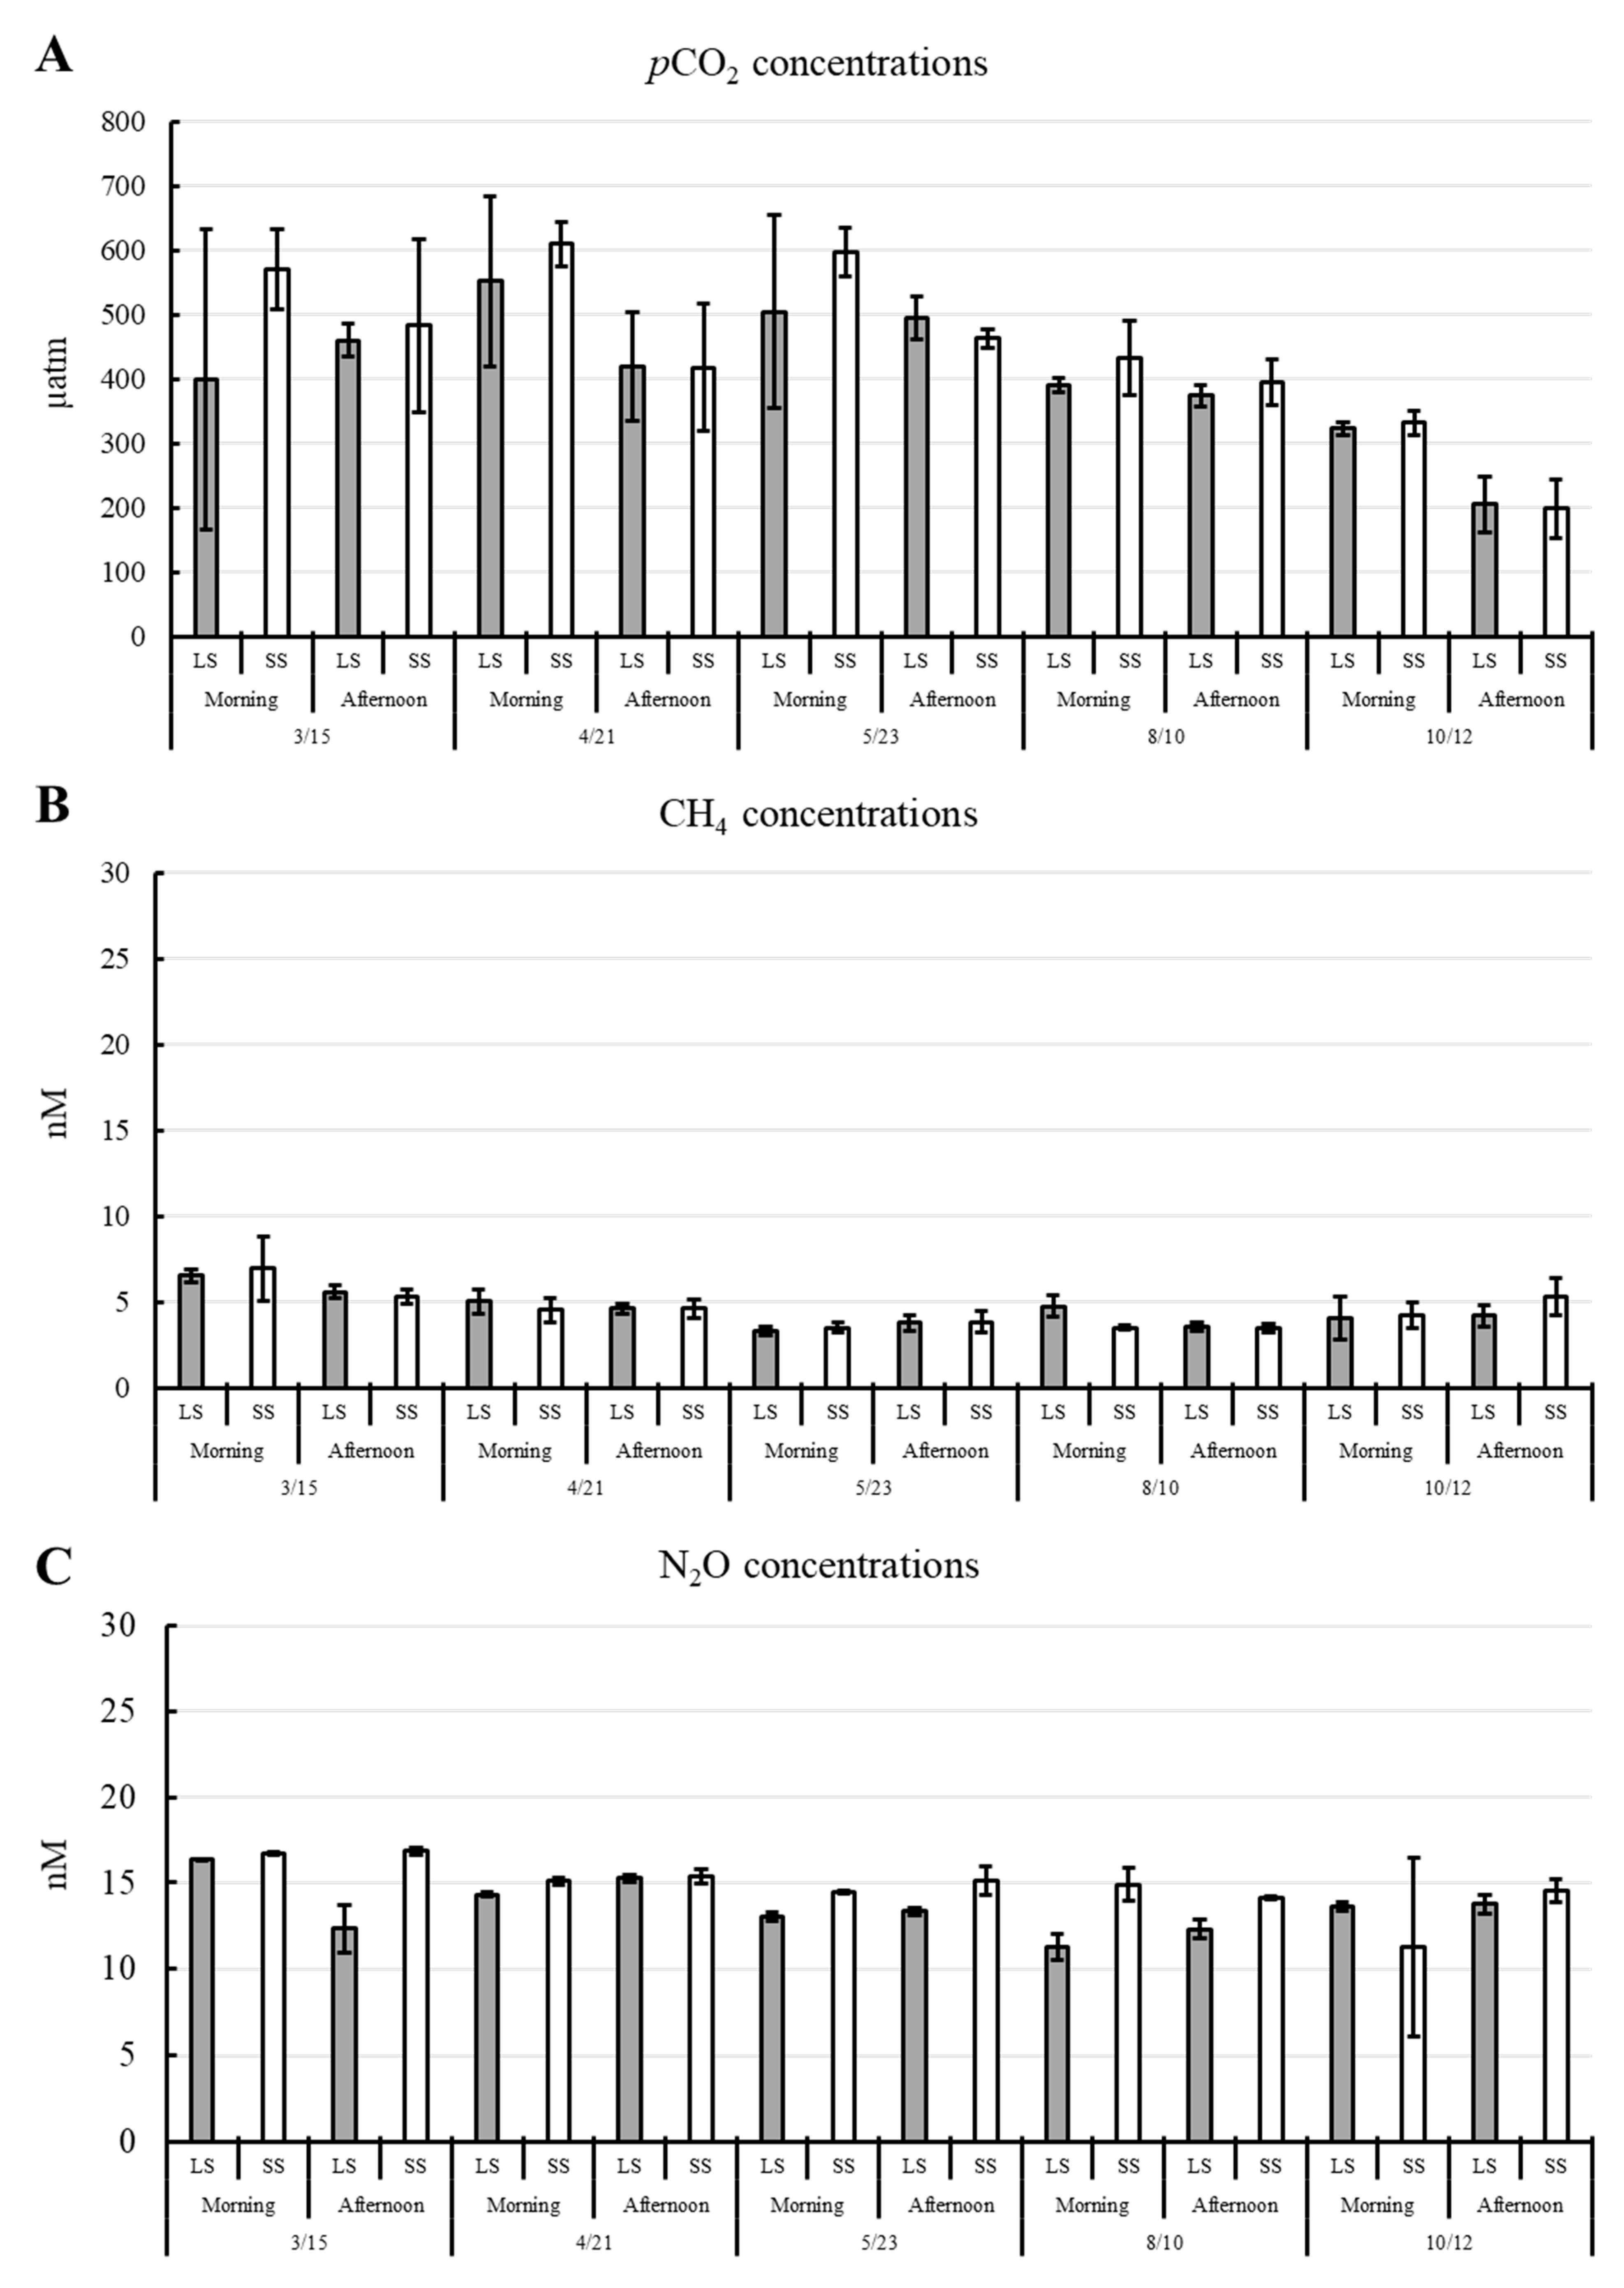
pCO2 concentrations showed no significant differences between sampling locations within the aquaculture ponds (p = 0.209) (Figure 6A). However, concentrations were significantly higher in the morning (489.26 ± 139.96 µatm) than in the afternoon (399.78 ± 113.48 µatm) (p = 0.007) (Figure 6A). Seasonally, the highest pCO2 concentrations were observed in spring (478.54 ± 139.30 µatm) and summer (504.80 ± 110.57 µatm), while the lowest were recorded in winter (264.88 ± 71.60 µatm) (p < 0.001) (Figure 6A). CH4 concentrations showed no significant differences between sampling locations (p = 0.980) or sampling periods (p = 0.822) (Figure 6B). However, CH4 concentrations in spring (6.52 ± 1.12 nM) were higher than in other seasons (p = 0.001) (Figure 6B; Table 2). N2O concentrations showed no significant differences between sampling periods (p = 0.280) (Figure 6C). However, concentrations on the landward side of the ponds (14.56 ± 2.38 nM) were higher than those on the seaward side (13.42 ± 2.53 nM) (p = 0.001) (Figure 5B). Seasonally, N2O concentrations in spring (15.07 ± 4.10 nM) were higher than in other seasons (p < 0.001) (Figure 6C) (mean ± standard deviation).
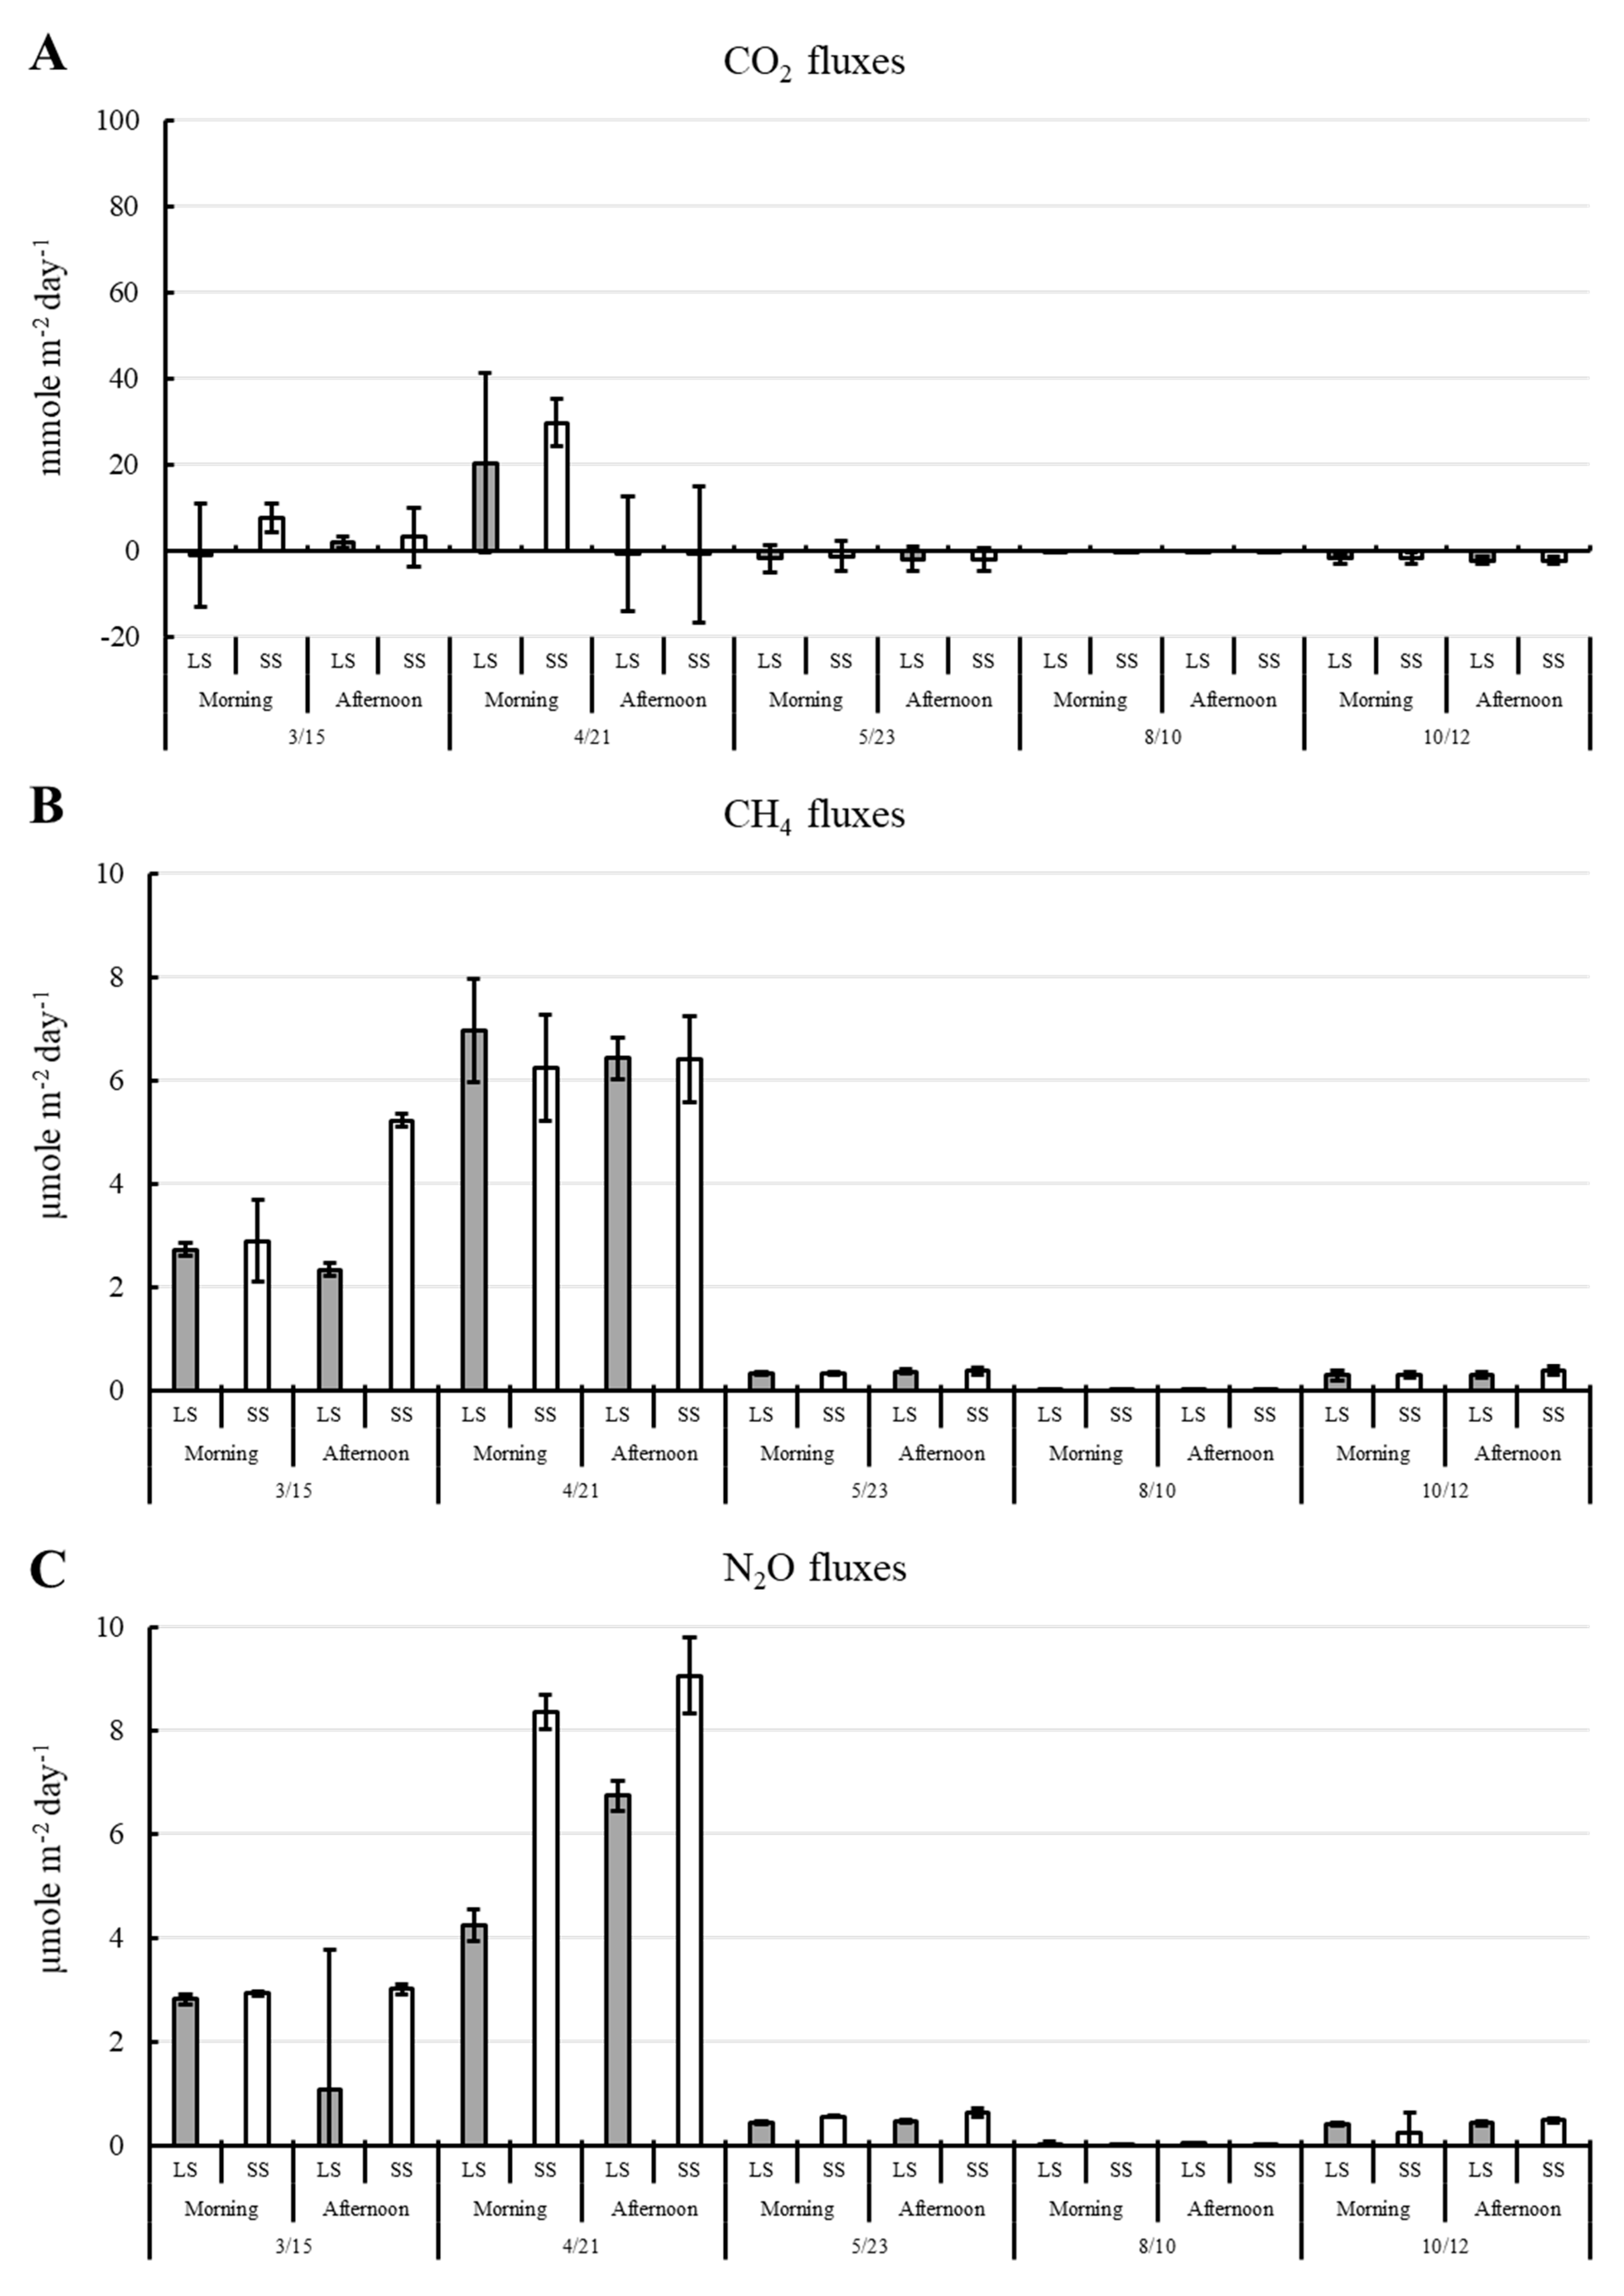
In terms of GHG fluxes, CO2 flux showed no significant differences between sampling locations (p = 0.328) or periods (p = 0.445) within the aquaculture ponds (Figure 7A). Seasonally, CO2 fluxes were highest in spring (2.95 ± 7.14 mmol m−2 day−1) and autumn (5.19 ± 15.47 mmol m−2 day−1), and lowest in winter (−2.06 ± 1.04 mmol m−2 day−1) (p = 0.003) (Figure 7A). Additionally, CH4 fluxes showed no significant differences between sampling locations (p = 0.643) or periods (p = 0.691) (Figure 7B). However, fluxes were highest in spring (2.72 ± 0.46 µmol m−2 day−1) and summer (3.43 ± 3.17 µmol m−2 day−1), and lowest in autumn (0.01 ± 0.00 µmol m−2 day−1) (p < 0.001) (Figure 7B; Table 2). N2O fluxes showed no significant differences between sampling periods (p = 0.341) (Figure 6B). However, at different pond locations, fluxes on the landward side (2.19 ± 0.71 µmol m−2 day−1) were higher than on the seaward side (3.21± 1.16 µmol m−2 day−1) (p = 0.001) (Figure 7C). A similar seasonal pattern was observed, with fluxes in spring (2.24 ± 1.73 µmol m−2 day−1) and summer (2.91 ± 3.82 µmol m−2 day−1) higher than in autumn (0.02 ± 0.00 µmol m−2 day−1) and winter (0.39 ± 0.22 µmol m−2 day−1) (p < 0.001) (Figure 7C) (mean ± standard deviation).

3.3. Correlation Between GHG Fluxes and Environmental Factors

Pearson correlation analysis was conducted to explore the influence of environmental parameters on GHG fluxes. The results showed that CH4 flux (r = 0.528; p < 0.001), N2O flux (r = 0.442; p = 0.003), salinity (r = 0.348; p < 0.001), DIC (r = 0.366; p = 0.001), and wind speed (r = 0.471; p < 0.001) were positively correlated with CO2 flux, suggesting these factors contributed to increased atmospheric CO2 emissions. In contrast, water temperature (r = −0.290; p = 0.002), pH (r = −0.532; p < 0.001), DO (r = −0.592; p < 0.001), and DOC (r = −0.250; p = 0.013) were negatively correlated with CO2 flux (Table 3). For CH4 flux, positive correlations were found with CO2 flux (r = 0.528; p < 0.001), N2O flux (r = 0.982; p < 0.001), salinity (r = 0.768; p < 0.001), and wind speed (r = 0.976; p < 0.001), indicating that these factors contributed to increased CH4 emissions. In contrast, CH4 flux was negatively correlated with water temperature (r = −0.663; p < 0.001), pH (r = −0.364; p = 0.021), DO (r = −0.384; p = 0.005), and DOC (r = −0.434; p < 0.001), suggesting that these factors acted as sinks for atmospheric CH4 (Table 3). With regard to N2O flux, positive correlations were observed with CO2 flux (r = 0.442; p = 0.003), CH4 flux (r = 0.982; p < 0.001), salinity (r = 0.615; p < 0.001), and wind speed (r = 914; p < 0.001), indicating that these factors were associated with increased N2O emissions. Conversely, water temperature (r = −0.474; p = 0.001) and DOC (r = −0.363; p = 0.030) showed negative correlations, suggesting that these factors acted as sinks for atmospheric N2O (Table 3).

4. Discussion

Given the increasing concern over greenhouse gas (GHG) emissions from aquaculture, this study monitored CO2, CH4, and N2O dynamics together with key environmental variables across a full cultivation cycle of abalone in intertidal ponds. These observations were further compared with findings from other aquaculture systems to contextualize the emissions from abalone culture. Our results revealed (1) clear spatio-temporal differences in GHG concentrations and fluxes, (2) strong influences of environmental and management factors on emission dynamics, and (3) relatively low CO2-equivalent (CO2-eq) emissions compared with other aquaculture systems. The following sections discuss these aspects in detail, focusing on environmental variables (Section 4.1 and Section 4.2), management practices (Section 4.3), and overall CO2-eq emissions (Section 4.4).

4.1. Environmental Variables Contributing to the Dynamic of pCO2, CH4, and N2O Concentrations Throughout the Cultivation Period

Photosynthesis, respiration, microbial metabolism, and both aerobic and anaerobic decomposition are key biological processes regulating pCO2 levels. Other processes such as animal feeding behavior and burrowing, calcification, and methane oxidation also contribute to pCO2 dynamics in aquaculture ponds [6,13,24,43,44,45]. In general, phytoplankton (microalgae) play a central role in driving both photosynthesis and respiration, depending on the availability of light and nutrients [46]. Although the Chl-a ratio may vary depending on species composition, nutrient, and light conditions [47], Chl-a concentrations generally provide a reliable index of phytoplankton abundance. In this study, Chl-a levels remained below 0.01 mg L−1, indicating that phytoplankton biomass was extremely low, and thus unlikely to be a major driver of pCO2 dynamics in the ponds. This is likely due to the oligotrophic nature of the pond environment [48].
Based on the solubility model [49], dissolved oxygen (DO) saturation was calculated to evaluate the metabolic status of the pond ecosystem. The results showed that morning DO saturation ranged from 68.62% to 94.71%, whereas afternoon values ranged from 74.70% to 106.74%. The differences between morning and afternoon measurements were relatively small (−3.75% to 15.70%), indicating that afternoon oxygen saturation was only slightly higher than in the morning. According to the report [50], limited diel variations in DO suggest that the studied aquaculture ponds were metabolically neutral, with gross primary production approximately balanced by ecosystem respiration. Furthermore, it was proposed that dissolved organic carbon (DOC) concentrations greater than 6 mg L−1 indicate a heterotrophic system [51]. In our study, DOC levels consistently remained below 3 mg L−1 throughout the culture period, suggesting that the ponds were not heterotrophic, but also likely not strongly driven by phytoplankton activity. We speculate that the relatively stable dissolved oxygen observed in the culture ponds was largely influenced by tidal forcing, where water movement promoted mixing and homogenized the local water column, thereby reducing diel variability in oxygen concentration. These processes likely contributed to maintaining DO concentrations above 4.7 mg L−1 throughout the monitoring period. Also, we recommend that future studies include direct measurements of gross primary production (GPP) to better evaluate the actual metabolic status of the aquatic system.
In addition, the fresh macroalgae (Gracilaria spp.) provided as feed for abalone may have played a dual role, serving both as a food source and contributing to primary productivity. According to previously published studies, the primary productivity of G. debilis and G. foliifera is approximately 2.91 mg C kg−1 (fresh weight) day−1 [52]. This setup effectively forms a fish–algae symbiotic farming system within a monoculture setting. A similar arrangement has been reported in the polyculture of red abalone (H. rufescens) and red macroalgae (Palmaria mollis) [53]. In our study, pCO2 concentrations were significantly higher in the morning (489.26 ± 139.96 µatm) than in the afternoon (399.78 ± 113.48 µatm). As the sampling was conducted between 5 and 7 a.m. and 1 and 3 p.m., this diurnal difference is likely driven by the respiration of cultured organisms and the supplied Gracilaria spp., along with daytime photosynthetic activity. Also, both seasonal and diel variations can influence the physiological state of Gracilaria. Previous research has shown that the NADPH activity of G. tenuistipitata during the daytime can be up to 30 times higher than at night [54]. This suggests that under conditions of sufficient light and favorable temperature, Gracilaria exhibits enhanced efficiency in assimilating nitrogen and carbon from the water, thereby facilitating the utilization of inorganic carbon. Based on this perspective, we infer that as seawater temperature gradually increases and photoperiod lengthens with the sun’s progression toward the Tropic of Cancer, the growth and carbon assimilation capacity of Gracilaria are enhanced. Consequently, pCO2 concentrations may decrease over time. This mechanism, however, was not directly quantified in the present study and should be interpreted with caution. Future research should strengthen investigations into this mechanism and explore its potential as a carbon reduction strategy.
Seasonal variation in pCO2 concentrations was also observed, with the highest levels recorded in spring (478.54 ± 139.30 µatm) and summer (504.80 ± 110.57 µatm), and the lowest in winter (264.88 ± 71.60 µatm). As ectothermic organisms, abalone exhibit changes in activity, digestion efficiency, and gut microbiota in response to temperature and diet [55]. Certain microbiota, such as Vibrio spp., are not native to abalone but are introduced through the consumption of red macroalgae such as G. conferta and G. gracilis. These bacteria colonize the gut and facilitate the digestion of polysaccharides, reducing the amount of undigested material available to environmental bacteria that could otherwise produce GHGs [56,57]. Prior to culturing, juvenile abalones are typically fed commercial artificial feed in hatcheries, which may lead to lower macroalgae (Gracilaria spp.) utilization efficiency at the beginning of the culture process. The resulting inefficiency in nutrient release following digestion could result in nutrients being utilized by environmental bacteria, potentially contributing to pCO2 production. These processes highlight the potential link between abalone metabolism, gut microbiota, and carbon cycling in the ponds. In view of the above, we speculate that the respiration and digestive activity of H. discus, together with the supplied Gracilaria, may have contributed to the observed diel variations in pCO2. Nevertheless, the limited diel changes in DO suggest that such effects were relatively minor at the ecosystem scale. Since direct respiration rates were not measured, this interpretation should be regarded as tentative. Moreover, statistical analysis indicated no significant differences in DIC and DO between morning and afternoon across the cultivation period, although minor day-to-day fluctuations were observed. Therefore, our study could not directly infer the metabolic activity of H. discus from the observed variations in DIC and DO. We recommend that future studies should directly measure the respiration of cultured organisms under stable system conditions to better clarify and quantify their contributions to greenhouse gas emissions.
Temperature is another critical factor affecting abalone physiology, and two scenarios come into play here. First, short-term temperature fluctuations have been shown to increase the metabolic demand of abalone during summer [58]. In Taiwan, early summer is characterized by significant temperature fluctuations. In this study, the period from April to May exhibited the greatest variation, ranging from 17 °C to 27 °C (Figure 3A). These findings support earlier research suggesting that large temperature fluctuations increase metabolic demand, causing the abalone’s feeding rate to rise. However, reduced digestive efficiency may cause more nutrients to be released into the environment, where they are utilized by environmental bacteria. This effect likely diminishes as the gut microbiota becomes more established later in the culture cycle. Second, when compared to low-temperature environments, high temperatures have been reported to facilitate greater colonization of intestinal bacteria in abalone. Studies have shown significantly higher intestinal colonization rates at 28 °C than at 20 °C [53]. We hypothesize that more efficient gut colonization enhances digestion efficiency, which may result in lower pCO2 levels, although further experiments are needed to confirm this relationship. Another possible factor causing seasonal variation in pCO2 concentrations is water temperature, as colder water can hold more dissolved inorganic carbon, ultimately leading to increased pCO2 concentrations [59].
Sampling locations and times did not significantly affect CH4 concentrations in the abalone ponds, but seasonal differences were observed. Spring showed the highest CH4 levels (6.52 ± 1.12 nM) compared to all other seasons (4.16 ± 0.31 nM). Methane is mainly produced by bacteria under anaerobic conditions, as typically found in pond sediments or in the intestines of cultured animals. Several reports have shown that CH4 concentrations are positively correlated with temperature [11,60,61]. Although CH4 levels in our study were slightly higher in spring, they remained consistently low throughout the culture period. The low CH4 concentrations may be attributed to the limited sedimentary organic matter in the ponds, which reduces the available substrate for methanogenic bacteria. Additionally, even if CH4 is produced by microbial activity in the pond or within animals, the consistently high DO levels (>5 mg L−1) observed during the culture period may have inhibited methane production through CH4 oxidation [62].
The production of N2O is primarily driven by microbial processes, including nitrification under aerobic conditions and denitrification under anaerobic conditions [63,64,65]. These processes occur both in the water column and in sediments, and are influenced by various environmental factors such as nitrogen availability, oxygen concentration, temperature, DOC, and DIC [66,67]. Under anoxic or low-oxygen conditions, denitrifying bacteria convert nitrate into N2O, thereby increasing its emissions. However, as reported previously [68], the well-oxygenated conditions maintained by aeration systems in aquaculture ponds likely suppress denitrification, contributing to the relatively low N2O fluxes. In our study, we observed that N2O concentrations were higher on the landward side of the ponds (14.56 ± 2.38 nM) than those on the seaward side (13.42 ± 2.53 nM). A similar spatial trend was observed for nitrate nitrogen levels, which were also higher on the landward side.
We infer that this elevation in nitrate concentrations may result from microbial activity at the pond bottom, where bacteria metabolize residual organic matter that is not flushed out by tidal exchange. This internal nitrogen cycling may explain the spatial differences in N2O concentrations between pond locations. In contrast, DOC and DIC levels showed no clear relationship with N2O production in our system, differing from findings reported in previous studies. This highlights the complexity of the mechanisms regulating N2O production, which may vary across systems depending on both environmental and operational conditions. Additionally, seasonal analysis revealed that N2O concentrations were significantly higher in spring (15.07 ± 4.10 nM) compared to other seasons (14.00 ± 0.74 nM). We attribute this to lower water temperatures during spring, which may influence the metabolic rates of nitrifying and denitrifying microbial communities. These findings support previous studies suggesting that temperature plays a key role in modulating microbial processes responsible for N2O dynamics.

4.2. Environmental Variables Contributing to the Dynamic of CO2, CH4, and N2O Fluxes Throughout the Cultivation Period

Based on statistical analysis, neither sampling locations nor times had a significant effect on the variation in CO2 fluxes and CH4 fluxes. However, seasonal changes were identified as a significant influencing factor for both gases. In contrast, N2O fluxes were significantly affected by both sampling location and season. Given these seasonal effects, the average CO2, CH4, and N2O fluxes are presented by season in Table 2.
Higher CO2 fluxes were observed in spring (2.95 ± 7.14 mmol m−2 day−1) and autumn (5.19 ± 15.47 mmol m−2 day−1) than in winter (−2.06 ± 1.04 mmol m−2 day−1). Pearson correlation analysis revealed that CO2 fluxes were positively correlated with salinity DIC and wind speed, but negatively correlated with water temperature, pH, and DO. CO2 fluxes are known to be strongly driven by both biological and physicochemical factors [69]. Previous studies using continuous sensor monitoring in clam and milkfish ponds reported that CO2 fluxes were mainly influenced by DIC, TA, and wind speed, while the effect of salinity was negligible [6]. However, other studies have reported contrasting findings, suggesting that salinity can affect CO2 flux by controlling CO2 solubility in water [70]. In this study, lower DIC and salinity were observed in winter compared to other seasons. These differences may be attributed to decreased water temperatures and freshwater dilution from heavy precipitation, particularly due to typhoons prior to sampling. Typhoons have been shown to be major drivers of CO2 emissions, with a single event potentially releasing as much CO2 as 100 days without a typhoon [23]. We hypothesize that prior to our sampling, CO2 in the water column was rapidly flushed out by the passing typhoon, which is reflected in the observed CO2 sink during winter sampling. To summarize CO2 fluxes across the abalone culture period, the average flux was 2.19 ± 10.83 mmol m−2 day−1, with values ranging from −14.01 to 42.33 mmol m−2 day−1. This indicates that the ponds act as a slight net source of CO2 emissions to the atmosphere (Table 4).
Several reports have indicated that CH4 flux is strongly associated with low temperatures, low nitrate nitrogen concentrations, and low DO content [60,68,71]. In aquaculture systems, CH4 is mainly produced by methanogens at the pond bottom via ebullition and diffusion pathways, driven by the decomposition of organic matter such as residual feed, dead organisms, or feces [68,72,73]. Management practices including aeration, water exchange, and drainage have been recognized as effective strategies for reducing CH4 emissions [5,60,74,75,76]. In this study, CH4 fluxes were significantly influenced by season, with higher values observed in spring (2.72 ± 0.46 µmol m−2 day−1) and summer (3.43 ± 3.17 µmol m−2 day−1) than in autumn (0.01 ± 0.00 µmol m−2 day−1). Pearson correlation analysis revealed that CH4 fluxes were negatively correlated with water temperature, pH, DO, and DOC. Despite seasonal variations, CH4 fluxes remained relatively low overall, likely due to the oligotrophic conditions in the abalone ponds. Moreover, effective vertical and horizontal water exchange resulted in the absence of significant differences between sampling locations or times within the same sampling campaign. The higher CH4 fluxes observed in spring and summer may be explained by high wind speeds, which can accelerate CH4 emissions, and by relatively low oxygen content, which can promote the oxidation of CH4 to CO2 [62]. Across the abalone culture period, CH4 fluxes averaged 2.11 ± 2.81 µmol m−2 day−1, with observed values ranging from 0.01 to 8.63 µmol m−2 day−1. These findings suggest that the abalone ponds functioned as a slight net source of CH4 emissions to the atmosphere (Table 4). Referring to a nearby study conducted in the Tamsui River estuary, located approximately 60 km from the monitoring site, seasonal variations in CH4 concentrations in 2019 ranged from 13.7 to 27.0 nM [36]. In comparison, CH4 concentrations in the present study ranged from 3.4 to 7.0 nM, lower than those reported for the Tamsui estuary. Since the variation in CH4 fluxes observed in this study showed no clear relationship with nitrogen sources, we infer that the CH4 present in the water likely originated primarily from digestive processes of the cultured organisms within the ponds.
Among the monitored parameters, only nitrate nitrogen and N2O concentrations showed trends consistent with N2O fluxes. We infer that the bacterial decomposition of residual organic matter under well-oxygenated conditions may promote denitrification, leading to N2O production. This finding is consistent with previous findings [68]. These results suggest that maintaining good water circulation in the ponds is necessary not only for water quality but also for mitigating N2O emissions. Seasonally, N2O fluxes in spring (2.24 ± 1.73 µmol m−2 day−1) and summer (2.91 ± 3.82 µmol m−2 day−1) were significantly higher than in autumn (0.02 ± 0.00 µmol m−2 day−1) (Figure 3C). Pearson correlation analysis revealed that N2O fluxes were positively correlated with salinity, but negatively correlated with water temperature and DOC. These patterns may be influenced by the bioactivity of denitrifying bacteria; however, the underlying mechanisms linking environmental factors to denitrification remain unclear. In addition, similar to the CO2 fluxes and CH4 fluxes, the markedly higher wind speeds in spring and summer resulted in significantly greater N2O emissions compared to autumn and winter. Further research is needed to clarify these relationships. Overall, during the abalone culture period, N2O fluxes averaged 1.65 ± 2.73 µmole m−2 day−1, with observed values ranging from −2.02 to 9.57 µmole m−2 day−1. These results indicate that the abalone ponds served as a slight net source of N2O emissions to the atmosphere (Table 4). Referring to a nearby study conducted in the Tamsui River estuary, seasonal variations in N2O concentrations between 2019 and 2021 ranged from 10.3 nM to 13.8 nM [37]. In comparison, N2O concentrations in the present study ranged from 11.3 nM to 16.9 nM, slightly higher than those reported for the Tamsui estuary. Since the variation in N2O fluxes observed in this study showed no clear relationship with nitrogen sources, we infer that the N2O present in the water may have originated from multiple sources, including wastewater inputs from nearby densely populated areas, riverine discharge, and residual organic matter on the landward side of the ponds, where aerobic conditions favored nitrification by bacteria.
Averaged over the monitoring period, the GHG fluxes in this study were as follows: CO2 flux was 2.19 ± 10.83 mmol m−2 day−1, CH4 flux was 2.11 ± 2.81 µmol m−2 day−1, and N2O flux was 1.65 ± 2.73 µmol m−2 day−1. The CO2 flux observed in this study was higher than that reported for a S. constricta monoculture pond (−7.6 to 23.1 mmol m−2 day−1) [9], a polyculture pond containing M. japonicus, P. trituberculatus, and R. philippinarum (0.249 to 0.426 µmol m−2 day−1) [12], and a clam monoculture pond (−2.8 ± 17.3 mmol m−2 day−1) [6]. However, it was lower than the CO2 flux of a fish monoculture pond (16.8 ± 21.7 mmol m−2 day−1), a L. vannamei monoculture pond (18.1 to 79.6 µmol L−1) [11], and an oyster pond (85.44 µmol gDW−1 day−1) [13]. CH4 flux values observed in this study were lower than those reported for a Nile tilapia monoculture pond (5.9 to 4.5 mg m−2 day−1) [14], a L. vannamei monoculture pond (1.3 to 55.9 µmol L−1) [11], and a S. constricta monoculture pond (100 to 1000 µmol m−2 day−1) [9]. The N2O flux value recorded in this study was lower than that of a S. constricta monoculture pond (100 µmol m−2 day−1) [9], but higher than that observed in an oyster pond (0.00288 µmol g DW−1 day−1) [13]. Based on these comparisons, GHG emissions from the abalone culture ponds in this study were higher than those from other shellfish cultures but lower than those from fish and shrimp cultures. These differences are likely due to variations in breeding environments, complex environmental conditions, and management strategies. However, the significant temperature fluctuations observed in early summer, which may explain the higher GHG emissions in the abalone culture ponds, have not been discussed in previous studies. Future research should investigate the role of intestinal microbiota in the cultured organisms and the microbial communities in pond sediments to better understand the mechanisms underlying GHG emissions in aquaculture systems.

4.3. Management Practices Contributing to the Dynamic of CO2, CH4, and N2O Fluxes Throughout the Cultivation Period and Potential Strategies for Mitigating Emissions

First, aeration, implemented to maintain dissolved oxygen levels above critical thresholds, not only reduced the risk of hypoxia but also suppressed anaerobic conditions that typically promote CH4 and N2O production. This practice may partly explain the relatively low CH4 concentrations and fluxes observed in the ponds, despite seasonal fluctuations. Water exchange, driven primarily by tidal forces and supplemented by manual drainage, further contributed to the homogenization of the water column, diluting accumulated dissolved inorganic carbon and nitrogen compounds while reducing diel variability in oxygen concentration. However, circulation inefficiencies on the landward side of the ponds were reflected in spatial differences in nitrate nitrogen and N2O concentrations, highlighting the importance of maintaining balanced hydrodynamics to mitigate local hotspots of nitrogen cycling.
Second, feeding practices also contributed to GHG dynamics. The provision of fresh macroalgae served as both a nutrient input and a source of photosynthetic activity, creating a semi-integrated abalone–algae farming system. While this practice may have enhanced oxygen production and organic matter utilization, inefficiencies in digestion during the early stages of culture could have increased nutrient release into the water column, indirectly stimulating microbial metabolism and CO2 production. Over time, as gut microbiota became more established and digestion efficiency improved, this effect was likely reduced. Furthermore, seasonal water temperature fluctuations influenced both abalone metabolism and microbial processes, thereby modulating how nutrients were cycled and gases were produced or consumed. Therefore, determining the stocking time of abalone and shortening the cultivation cycle may be a potential strategy to reduce greenhouse gas emissions.
Finally, external drivers such as typhoons and associated heavy rainfall events strongly influenced the management context, with sudden freshwater inputs lowering salinity and flushing out dissolved carbon pools, as reflected in the observed CO2 sink during winter. These findings underscore that routine management strategies—such as aeration, feeding, and water exchange—interact with environmental variability to regulate GHG fluxes in abalone aquaculture. Future management practices should focus on optimizing circulation on the landward side of ponds, refining feeding strategies to minimize nutrient leakage.
Based on the monitoring results of this study, abalone aquaculture in intertidal ponds generally exhibited low greenhouse gas emissions. However, during the early culture period in March and April, when water temperature fluctuations were more pronounced, relatively higher emissions of the three greenhouse gases were observed, which may be regarded as potential emission hotspots. This finding highlights the strong influence of environmental factors, particularly temperature variability and tidal exchange efficiency, on GHG emissions. To reduce uncertainties and improve the sensitivity of emission estimates, we recommend increasing sampling frequency during this critical period and simultaneously examining the metabolic responses of both abalone and the supplied Gracilaria to better clarify the biological contributions to emission dynamics. In addition, future studies could incorporate eDNA-based analyses to characterize bacterial communities in both the pond water and the gastrointestinal tract of cultured organisms, thereby providing a more comprehensive understanding of the microbial mechanisms underlying GHG production.

4.4. CO2-eq Fluxes Throughout the Cultivation Period

In this study, the total CO2-equivalent (CO2-eq) fluxes were estimated by combining the average fluxes of CO2, CH4, and N2O measured during the abalone culture period in the tidal ponds. The calculated total average CO2-eq flux from the pond water was approximately 0.02 ± 0.09 mg CO2-eq m−2 day−1, with minimal differences between values derived using GWP20 and GWP100 metrics (Table 5). Notably, CO2 accounted for the majority of total GHG emissions, contributing over 71% to the total CO2-eq flux. In contrast, CH4 and N2O had a relatively minor influence on the overall GHG budget. These findings align with previous reports of shrimp aquaculture systems, where CO2 was also identified as the dominant GHG contributor [24,77].
The present study focused exclusively on biogenic GHG emissions from abalone aquaculture ponds. Energy-related emissions were not included. This distinction is important because biogenic fluxes reflect direct ecological processes, whereas fossil-fuel emissions represent external inputs. Future work combining both aspects would allow a more comprehensive life-cycle evaluation of aquaculture emissions.
This study estimated GHG fluxes based on equilibrium equations rather than direct flux measurements, which may introduce uncertainties. The analysis focused only on biogenic emissions and excluded fossil-fuel-related sources. In addition, relatively low nutrient levels limited mechanistic interpretation of N2O and CH4 dynamics. As the study was restricted to ponds in one region, broader applicability should be verified in future work.

5. Conclusions

This study provides the first comprehensive assessment of greenhouse gas (GHG) emissions from abalone (Haliotis discus) monoculture ponds worldwide. The results revealed distinct seasonal variations in CO2, CH4, and N2O fluxes, with N2O fluxes additionally influenced by spatial location within the ponds. On average, all three gases acted as slight net sources of emissions. Nevertheless, compared with other aquaculture systems, abalone culture in tidal ponds integrated with Gracilaria appears to be a relatively eco-friendly farming practice, characterized by lower emission intensities.
The observed flux dynamics were driven by both biological processes (e.g., animal metabolism, algal assimilation, microbial activity) and physicochemical conditions (e.g., temperature fluctuations, tidal exchange, nutrient availability), consistent with the oligotrophic nature of the ponds. Elevated nitrate nitrogen concentrations at landward sites suggest that localized microbial decomposition of residual organic matter may contribute to N2O production, underscoring the importance of maintaining effective water circulation to minimize nutrient accumulation and associated emissions.
When converted into CO2-equivalents (CO2-eq) using IPCC GWP metrics, the total average flux was estimated at approximately 0.02 ± 0.09 mg CO2-eq m−2 day−1, with minimal differences between GWP20 and GWP100 values. CO2 was the dominant contributor, accounting for more than 71% of total emissions, whereas CH4 and N2O played comparatively minor roles.
Taken together, this study highlights the relatively low GHG footprint of abalone tidal pond aquaculture and the role of environmental management practices in regulating emissions. Future research should focus on high-frequency sampling during periods of pronounced temperature variability, coupled with integrated assessments of abalone and macroalgal metabolism, to strengthen mechanism understanding and inform carbon reduction strategies in aquaculture.

Author Contributions

Y.-J.C.: methodology; W.-C.C.: methodology; H.-C.T.: methodology; R.-F.S.: methodology; M.-C.L.: visualization; F.-H.N.: supervision, visualization, and funding acquisition; H.-Y.Y.: investigation, formal analysis, resources, writing—original draft, and writing—review and editing. All authors have read and agreed to the published version of the manuscript.

Funding

This research was financially supported by the Ministry of Agriculture, Executive Yuan, Taiwan.

Data Availability Statement

All data that support the findings of this study are included within the article.

Acknowledgments

The authors specially thank editor and anonymous reviewers for their thoughtful comments. The authors are grateful to the person in charge, Li, Sheng-Xing, from the Nice Store Co., Ltd. for providing the study area.

Conflicts of Interest

The authors declare that there are no financial interests or personal relationships that could have influenced the work presented in this paper.

Abbreviations

The following abbreviations are used in this manuscript:
CO2Carbon dioxide
CH4Methane
DICDissolved inorganic carbon
DINDissolved inorganic nitrogen
DIPDissolved inorganic phosphorus
ECDElectron capture detector
FAOFood and Agriculture Organization
FIDFlame ionization detector
GCGas chromatograph
GHGGreenhouse gas
IMTAIntegrated Multi-Trophic Aquaculture
IPCCIntergovernmental Panel on Climate Change
N2ONitrous oxide
TATotal alkalinity
TOCTotal dissolved organic carbon

References

  1. Cook, P. Worldwide abalone production: An update. N. Z. J. Mar. Freshw. Res. 2023, 5, 4–10. [Google Scholar] [CrossRef]
  2. Schubel, J.R.; Thompson, K. Farming the Sea: The Only Way to Meet Humanity’s Future Food Needs. Geohealth 2019, 3, 238–244. [Google Scholar] [CrossRef]
  3. IPCC. Climate Change 2023: Synthesis Report. Contribution of Working Groups I, II and III to the Sixth Assessment Report of the Intergovernmental Panel on Climate Change; IPCC: Geneva, Switzerland, 2023; pp. 35–115. [Google Scholar]
  4. Dong, B.; Xi, Y.; Cui, Y.; Peng, S. Quantifying Methane Emissions from Aquaculture Ponds in China. Environ. Sci. Technol. 2023, 57, 1576–1583. [Google Scholar] [CrossRef]
  5. Zhang, L.; Wang, X.; Huang, L.; Wang, C.; Gao, Y.; Peng, S.; Canadell, J.G.; Piao, S. Inventory of methane and nitrous oxide emissions from freshwater aquaculture in China. Commun. Earth Environ. 2024, 5, 531. [Google Scholar] [CrossRef]
  6. Weerathunga, V.; Liu, L.-L.; Yuan, F.-L.; Xu, S.X.; Kao, K.-J.; Huang, W.-J. Temporal variability of air-water gas exchange of carbon dioxide in clam and fish aquaculture ponds. Sci. Total Environ. 2024, 917, 170090. [Google Scholar] [CrossRef]
  7. MacLeod, M.J.; Hasan, M.R.; Robb, D.H.F.; Mamun-Ur-Rashid, M. Quantifying greenhouse gas emissions from global aquaculture. Sci. Rep. 2020, 10, 11679. [Google Scholar] [CrossRef]
  8. Polymeni, S.; Skoutas, D.N.; Sarigiannidis, P.; Kormentzas, G.; Skianis, C. Smart Agriculture and Greenhouse Gas Emission Mitigation: A 6G-IoT Perspective. Electronics 2024, 13, 1480. [Google Scholar] [CrossRef]
  9. Ye, W.; Sun, H.; Li, Y.; Zhang, J.; Zhang, M.; Gao, Z.; Yan, J.; Liu, J.; Wen, J.; Yang, H.; et al. Greenhouse gas emissions from fed mollusk mariculture: A case study of a Sinonovacula constricta farming system. Agric. Ecosyst. Environ. 2022, 336, 108029. [Google Scholar] [CrossRef]
  10. Yuan, J.; Xiang, J.; Liu, D.; Kang, H.; He, T.; Kim, S.; Lin, Y.; Freeman, C.; Ding, W. Rapid growth in greenhouse gas emissions from the adoption of industrial-scale aquaculture. Nat. Clim. Chang. 2019, 9, 318–322. [Google Scholar] [CrossRef]
  11. Tong, C.; Bastviken, D.; Tang, K.W.; Yang, P.; Yang, H.; Zhang, Y.; Guo, Q.; Lai, D.Y.F. Annual CO2 and CH4 fluxes in coastal earthen ponds with Litopenaeus vannamei in southeastern China. Aquaculture 2021, 545, 737229. [Google Scholar] [CrossRef]
  12. Zhang, D.; Tian, X.; Dong, S.; Chen, Y.; Feng, J.; He, R.-P.; Zhang, K. Carbon dioxide fluxes from two typical mariculture polyculture systems in coastal China. Aquaculture 2020, 521, 735041. [Google Scholar] [CrossRef]
  13. Ray, N.E.; Maguire, T.J.; Al-Haj, A.N.; Henning, M.C.; Fulweiler, R.W. Low Greenhouse Gas Emissions from Oyster Aquaculture. Environ. Sci. Technol. 2019, 53, 9118–9127. [Google Scholar] [CrossRef]
  14. da Silva, M.G.; Packer, A.P.; Sampaio, F.G.; Marani, L.; Mariano, E.V.C.; Pazianotto, R.A.A.; Ferreira, W.J.; Alvalá, P.C. Impact of intensive fish farming on methane emission in a tropical hydropower reservoir. Clim. Chang. 2018, 150, 195–210. [Google Scholar] [CrossRef]
  15. Xia, Z.; Hu, D. Accounting for Carbon Emissions from Fisheries in China and Analyzing the Decoupling Effect. Fishes 2025, 10, 79. [Google Scholar] [CrossRef]
  16. Mistri, M.; Munari, C. Clam farming generates CO2: A study case in the Marinetta lagoon (Italy). Mar. Pollut. Bull. 2012, 64, 2261–2264. [Google Scholar] [CrossRef] [PubMed]
  17. Munari, C.; Rossetti, E.; Mistri, M. Shell formation in cultivated bivalves cannot be part of carbon trading systems: A study case with Mytilus galloprovincialis. Mar. Environ. Res. 2013, 92, 264–267. [Google Scholar] [CrossRef]
  18. Xiao, Q.; Duan, H.; Qin, B.; Hu, Z.; Zhang, M.; Qi, T.; Lee, X. Eutrophication and temperature drive large variability in carbon dioxide from China’s Lake Taihu. Limnol. Oceanogr. 2022, 67, 379–391. [Google Scholar] [CrossRef]
  19. Conrad, R. Importance of hydrogenotrophic, aceticlastic and methylotrophic methanogenesis for methane production in terrestrial, aquatic and other anoxic environments: A mini review. Pedosphere 2020, 30, 25–39. [Google Scholar] [CrossRef]
  20. Barnard, R.; Leadley, P.W.; Hungate, B.A. Global Change, Nitrification, and Denitrification: A Review. Glob. Biogeochem. Cycles 2005, 19, GB1007. [Google Scholar] [CrossRef]
  21. Zhang, Z.; Liu, H.; Jin, J.; Zhu, X.; Han, D.; Xie, S. Towards a low-carbon footprint: Current status and prospects for aquaculture. Water Biol. Secur. 2024, 3, 100290. [Google Scholar] [CrossRef]
  22. Cheng, W.; Liu, C.-H.; Cheng, S.-Y.; Chen, J.-C. Effect of dissolved oxygen on the acid–base balance and ion concentration of Taiwan abalone Haliotis diversicolor supertexta. Aquaculture 2004, 231, 573–586. [Google Scholar] [CrossRef]
  23. Yang, P.; Zhang, Y.; Bastviken, D.; Lai, D.Y.F.; Yang, H.; Zhang, Y.F.; Guo, Q.Q.; Tan, L.; Tong, C. Large increase in diffusive greenhouse gas fluxes from subtropical shallow aquaculture ponds during the passage of typhoons. J. Hydrol. 2020, 583, 124643. [Google Scholar] [CrossRef]
  24. Cheng, Q.-F.; Liao, B.-K.; Tseng, H.-C. Shrimp mariculture may increase aquatic CO2, CH4, and N2O emissions in semi-indoor and indoor ponds. Mar. Pollut. Bull. 2025, 210, 117298. [Google Scholar] [CrossRef]
  25. Tzollas, N.; Zachariadis, G.; Anthemidis, A.; Stratis, J. A new approach to indophenol blue method for determination of ammonium in geothermal waters with high mineral content. Anal. Chem. 2010, 90, 115–126. [Google Scholar] [CrossRef]
  26. Zhang, R.; Xu, Z.; Jiang, Y.; Zhao, J.; Tang, S. Biological effect of cadmium in Daphnia magna: Influence of nitrogen and phosphorus. Fresenius Environ. Bull. 2012, 21, 2891–2895. [Google Scholar]
  27. Ormaza-González, F.I.; Statham, P.J. Determination of dissolved inorganic phosphorus in natural waters at nanomolar concentrations using a long capillary cell detector. Anal. Chim. Acta 1991, 244, 63–70. [Google Scholar] [CrossRef]
  28. Johan, F.; Mat Jafri, M.Z.; Lim, H.S.; Wan Omar, W.M. Laboratory measurement: Chlorophyll-a concentration measurement with acetone method using spectrophotometer. In Proceedings of the IEEE International Conference on Industrial Engineering and Engineering Management, Selangor, Malaysia, 9–12 December 2014; Volume 2015, pp. 744–748. [Google Scholar] [CrossRef]
  29. Pelletier, G.; Lewis, E.; Wallace, D. CO2Sys. xls: A Calculator for the CO2 System in Seawater for Microsoft Excel/VBA; Washington State Department of Ecology: Olympia, WA, USA; Brookhaven National Laboratory: Upton, NY, USA, 2007. [Google Scholar]
  30. Lueker, T.J.; Dickson, A.G.; Keeling, C.D. Ocean pCO2 calculated from dissolved inorganic carbon, alkalinity, and equations for K1 and K2: Validation based on laboratory measurements of CO2 in gas and seawater at equilibrium. Mar. Chem. 2000, 70, 105–119. [Google Scholar] [CrossRef]
  31. Weyhenmeyer, G.A.; Kortelainen, P.; Sobek, S.; Müller, R.; Rantakari, M. Carbon Dioxide in Boreal Surface Waters: A Comparison of Lakes and Streams. Ecosystems 2012, 15, 1295–1307. [Google Scholar] [CrossRef]
  32. Xiao, Q.; Xu, X.; Duan, H.; Qi, T.; Qin, B.; Lee, X.; Hu, Z.; Wang, W.; Xiao, W.; Zhang, M. Eutrophic Lake Taihu as a significant CO2 source during 2000–2015. Water Res. 2020, 170, 115331. [Google Scholar] [CrossRef]
  33. Johnson, K.M.; Hughes, J.E.; Donaghay, P.L.; Sieburth, J.M. Bottle-calibration static head space method for the determination of methane dissolved in seawater. Anal. Chem. 1990, 62, 2408–2412. [Google Scholar] [CrossRef]
  34. Weiss, R.F. Determinations of Carbon Dioxide and Methane by Dual Catalyst Flame Ionization Chromatography and Nitrous Oxide by Electron Capture Chromatography. J. Chromatogr. Sci. 1981, 19, 611–616. [Google Scholar] [CrossRef]
  35. Xiao, Q.; Zhang, M.; Hu, Z.; Gao, Y.; Hu, C.; Liu, C.; Liu, S.; Zhang, Z.; Zhao, J.; Xiao, W.; et al. Spatial variations of methane emission in a large shallow eutrophic lake in subtropical climate: Methane flux in a shallow eutrophic lake. J. Geophys. Res. Biogeosci. 2017, 122, 1597–1614. [Google Scholar] [CrossRef]
  36. Tseng, H.-C.; Lin, C.-C.; Pan, H.-J.; Han, Y.T.Y.; Gong, G.-C. Seasonal Distributions of Methane in a Populous Urban Coastal Sea Area. Front. Mar. Sci. 2022, 9, 843549. [Google Scholar] [CrossRef]
  37. Tseng, H.-C.; Yuh Han, Y.T.; Lin, C.-C.; Gong, G.-C. Seasonal variations of nitrous oxide in a populous urban estuary and its adjacent sea. Front. Earth Sci. 2023, 11, 1112192. [Google Scholar] [CrossRef]
  38. Weiss, R.F.; Price, B.A. Nitrous oxide solubility in water and seawater. Mar. Chem. 1980, 8, 347–359. [Google Scholar] [CrossRef]
  39. Wiesenburg, D.A.; Guinasso, N.L., Jr. Equilibrium solubilities of methane, carbon monoxide, and hydrogen in water and sea water. J. Chem. Eng. Data 1979, 24, 356–360. [Google Scholar] [CrossRef]
  40. Wanninkhof, R. Relationship between wind speed and gas exchange over the ocean revisited. Limnol. Oceanogr. Methods 2014, 12, 351–362. [Google Scholar] [CrossRef]
  41. Banko-Kubis, H.; Wurl, O.; Mustaffa, N.I.H.; Ribas Ribas, M. Gas transfer velocities in Norwegian fjords and the adjacent North Atlantic waters. Oceanologia 2019, 61, 460–470. [Google Scholar] [CrossRef]
  42. Crusius, J.; Wanninkhof, R. Gas transfer velocities measured at low wind speed over a lake. Limnol. Oceanogr. 2003, 48, 1010–1017. [Google Scholar] [CrossRef]
  43. Gruca-Rokosz, R.; Koszelnik, P. Production pathways for CH4 and CO2 in sediments of two freshwater ecosystems in south-eastern Poland. PLoS ONE 2018, 13, e0199755. [Google Scholar] [CrossRef] [PubMed]
  44. Gruca-Rokosz, R.; Tomaszek, J.A.; Koszelnik, P.; Czerwieniec, E. Methane and Carbon Dioxide Fluxes at the Sediment-Water Interface in Reservoirs. Pol. J. Environ. Stud. 2011, 20, 81–86. [Google Scholar]
  45. Moriarty, D.J.W. The role of microorganisms in aquaculture ponds. Aquaculture 1997, 151, 333–349. [Google Scholar] [CrossRef]
  46. Crump, B.C.; Fine, L.M.; Fortunato, C.S.; Herfort, L.; Needoba, J.A.; Murdock, S.; Prahl, F.G. Quantity and quality of particulate organic matter controls bacterial production in the Columbia River estuary. Limnol. Oceanogr. 2017, 62, 2713–2731. [Google Scholar] [CrossRef]
  47. Geider, R.J. Light and temperature dependence of the carbon to chlorophyll a ratio in microalgae and cyanobacteria: Implications for physiology and growth of phytoplankton. New Phytol. 1987, 106, 1–34. [Google Scholar] [CrossRef]
  48. Clark, D.R.; Flynn, K.J. The relationship between the dissolved inorganic carbon concentration and growth rate in marine phytoplankton. Proc. Biol. Sci. 2000, 267, 953–959. [Google Scholar] [CrossRef]
  49. Weiss, R.F. The solubility of nitrogen, oxygen and argon in water and seawater. Deep Sea Res. Oceanogr. Abstr. 1970, 17, 721–735. [Google Scholar] [CrossRef]
  50. Staehr, P.A.; Bade, D.; Van de Bogert, M.C.; Koch, G.R.; Williamson, C.; Hanson, P.; Cole, J.J.; Kratz, T. Lake metabolism and the diel oxygen technique: State of the science. Limnol. Oceanogr. Methods 2010, 8, 628–644. [Google Scholar] [CrossRef]
  51. Carignan, R.; Planas, D.; Vis, C. Planktonic production and respiration in oligotrophic Shield lakes. Limnol. Oceanogr. 2000, 45, 189–199. [Google Scholar] [CrossRef]
  52. Vinuganesh, A.; Kumar, A.; Prakash, S.; Korany, S.M.; Alsherif, E.A.; Selim, S.; AbdElgawad, H. Evaluation of growth, primary productivity, nutritional composition, redox state, and antimicrobial activity of red seaweeds Gracilaria debilis and Gracilaria foliifera under pCO2-induced seawater acidification. Mar. Pollut. Bull. 2022, 185, 114296. [Google Scholar] [CrossRef]
  53. Kohl, K.D.; Yahn, J. Effects of environmental temperature on the gut microbial communities of tadpoles. Environ. Microbiol. 2016, 18, 1561–1565. [Google Scholar] [CrossRef] [PubMed]
  54. Lopes, P.F.; Oliveira, M.C.; Colepicolo, P. Diurnal Fluctuation of Nitrate Reductase Activity in the Marine Red Alga Gracilaria Tenuistipitata (RHODOPHYTA). J. Phycol. 1997, 33, 225–231. [Google Scholar] [CrossRef]
  55. Wang, X.; Tang, B.; Luo, X.; Ke, C.; Huang, M.; You, W.; Wang, Y. Effects of temperature, diet and genotype-induced variations on the gut microbiota of abalone. Aquaculture 2020, 524, 735269. [Google Scholar] [CrossRef]
  56. Weinberger, F.; Hoppe, H.-G.; Friedlander, M. Bacterial induction and inhibition of a fast mecrotic response in Gracilaria conferta (Rhodophyta). J. Appl. Phycol. 1997, 9, 277–285. [Google Scholar] [CrossRef]
  57. Jaffray, A.E.; Anderson, R.J.; Coyne, V.E. Investigation of Bacterial Epiphytes of the Agar-producing Red Seaweed Gracilaria gracilis (Stackhouse) Steentoft, Irvine et Farnham from Saldanha Bay, South Africa and Lüderitz, Namibia. Bot. Mar. 1997, 40, 569–576. [Google Scholar] [CrossRef]
  58. Kang, H.Y.; Lee, Y.-J.; Song, W.Y.; Kim, T.-I.; Lee, W.C.; Kim, T.Y.; Kang, C.-K. Physiological responses of the abalone Haliotis discus hannai to daily and seasonal temperature variations. Sci. Rep. 2019, 9, 8019. [Google Scholar] [CrossRef] [PubMed]
  59. Ko, Y.H.; Park, G.-H.; Kim, D.; Kim, T.-W. Variations in Seawater pCO2 Associated With Vertical Mixing During Tropical Cyclone Season in the Northwestern Subtropical Pacific Ocean. Front. Mar. Sci. 2021, 8, 679314. [Google Scholar] [CrossRef]
  60. Yang, P.; Zhang, Y.; Lai, D.Y.F.; Tan, L.; Jin, B.; Tong, C. Fluxes of carbon dioxide and methane across the water–atmosphere interface of aquaculture shrimp ponds in two subtropical estuaries: The effect of temperature, substrate, salinity and nitrate. Sci. Total Environ. 2018, 635, 1025–1035. [Google Scholar] [CrossRef]
  61. Yvon-Durocher, G.; Allen, A.P.; Bastviken, D.; Conrad, R.; Gudasz, C.; St-Pierre, A.; Thanh-Duc, N.; del Giorgio, P.A. Methane fluxes show consistent temperature dependence across microbial to ecosystem scales. Nature 2014, 507, 488–491. [Google Scholar] [CrossRef] [PubMed]
  62. Kosten, S.; Almeida, R.M.; Barbosa, I.; Mendonça, R.; Santos Muzitano, I.; Sobreira Oliveira-Junior, E.; Vroom, R.J.E.; Wang, H.-J.; Barros, N. Better assessments of greenhouse gas emissions from global fish ponds needed to adequately evaluate aquaculture footprint. Sci. Total Environ. 2020, 748, 141247. [Google Scholar] [CrossRef]
  63. Williams, J.; Crutzen, P.J. Nitrous oxide from aquaculture. Nat. Geosci. 2010, 3, 143. [Google Scholar] [CrossRef]
  64. Daims, H.; Lücker, S.; Wagner, M. A New Perspective on Microbes Formerly Known as Nitrite-Oxidizing Bacteria. Trends Microbiol. 2016, 24, 699–712. [Google Scholar] [CrossRef]
  65. Li, S.; Zhou, X.; Cao, X.; Chen, J. Insights into simultaneous anammox and denitrification system with short-term pyridine exposure: Process capability, inhibition kinetics and metabolic pathways. Front. Environ. Sci. Eng. 2021, 15, 139. [Google Scholar] [CrossRef]
  66. Tan, L.; Ge, Z.; Zhou, X.; Li, S.; Li, X.; Tang, J. Conversion of coastal wetlands, riparian wetlands, and peatlands increases greenhouse gas emissions: A global meta-analysis. Glob. Chang. Biol. 2020, 26, 1638–1653. [Google Scholar] [CrossRef]
  67. Hu, Z.; Lee, J.W.; Chandran, K.; Kim, S.; Sharma, K.; Brotto, A.C.; Khanal, S.K. Nitrogen transformations in intensive aquaculture system and its implication to climate change through nitrous oxide emission. Bioresour. Technol. 2013, 130, 314–320. [Google Scholar] [CrossRef] [PubMed]
  68. Barreto, M.K.; Oliveira, C.T.A.; Henry-Silva, G.G. Greenhouse gas emission flux (CO2, CH4, N2O) from marine shrimp (Litopenaeus vannamei) monoculture cultures in the Brazilian semi-arid region. Aquaculture 2024, 582, 740536. [Google Scholar] [CrossRef]
  69. Threlkeld, S.T. Reservoir limnology; Ecological perspectives (K. W. Thornton. B.L. Kimmel, and F. E. Payne [eds.]). Limnol. Oceanogr. 1990, 35, 1411–1412. [Google Scholar] [CrossRef]
  70. Woolf, D.K.; Land, P.E.; Shutler, J.D.; Goddijn-Murphy, L.M.; Donlon, C.J. On the calculation of air-sea fluxes of CO2 in the presence of temperature and salinity gradients. J. Geophys. Res. Ocean. 2016, 121, 1229–1248. [Google Scholar] [CrossRef]
  71. Hu, M.; Wilson, B.J.; Sun, Z.; Ren, P.; Tong, C. Effects of the addition of nitrogen and sulfate on CH4 and CO2 emissions, soil, and pore water chemistry in a high marsh of the Min River estuary in southeastern China. Sci. Total Environ. 2017, 579, 292–304. [Google Scholar] [CrossRef]
  72. Maeck, A.; DelSontro, T.; McGinnis, D.F.; Fischer, H.; Flury, S.; Schmidt, M.; Fietzek, P.; Lorke, A. Sediment Trapping by Dams Creates Methane Emission Hot Spots. Environ. Sci. Technol. 2013, 47, 8130–8137. [Google Scholar] [CrossRef]
  73. Boyd, C.E.; Wood, C.W.; Chaney, P.L.; Queiroz, J.F. Role of aquaculture pond sediments in sequestration of annual global carbon emissions. Environ. Pollut. 2010, 158, 2537–2540. [Google Scholar] [CrossRef]
  74. Kauffman, J.B.; Bernardino, A.F.; Ferreira, T.O.; Bolton, N.W.; Gomes, L.E.d.O.; Nobrega, G.N. Shrimp ponds lead to massive loss of soil carbon and greenhouse gas emissions in northeastern Brazilian mangroves. Ecol. Evol. 2018, 8, 5530–5540. [Google Scholar] [CrossRef] [PubMed]
  75. Liu, S.; Hu, Z.; Wu, S.; Li, S.; Li, Z.; Zou, J. Methane and Nitrous Oxide Emissions Reduced Following Conversion of Rice Paddies to Inland Crab–Fish Aquaculture in Southeast China. Environ. Sci. Technol. 2016, 50, 633–642. [Google Scholar] [CrossRef] [PubMed]
  76. Maher, D.T.; Drexl, M.; Tait, D.R.; Johnston, S.G.; Jeffrey, L.C. iAMES: An inexpensive, Automated Methane Ebullition Sensor. Environ. Sci. Technol. 2019, 53, 6420–6426. [Google Scholar] [CrossRef] [PubMed]
  77. Peacock, M.; Audet, J.; Bastviken, D.; Cook, S.; Evans, C.D.; Grinham, A.; Holgerson, M.A.; Högbom, L.; Pickard, A.E.; Zieliński, P.; et al. Small artificial waterbodies are widespread and persistent emitters of methane and carbon dioxide. Glob. Chang. Biol. 2021, 27, 5109–5123. [Google Scholar] [CrossRef]
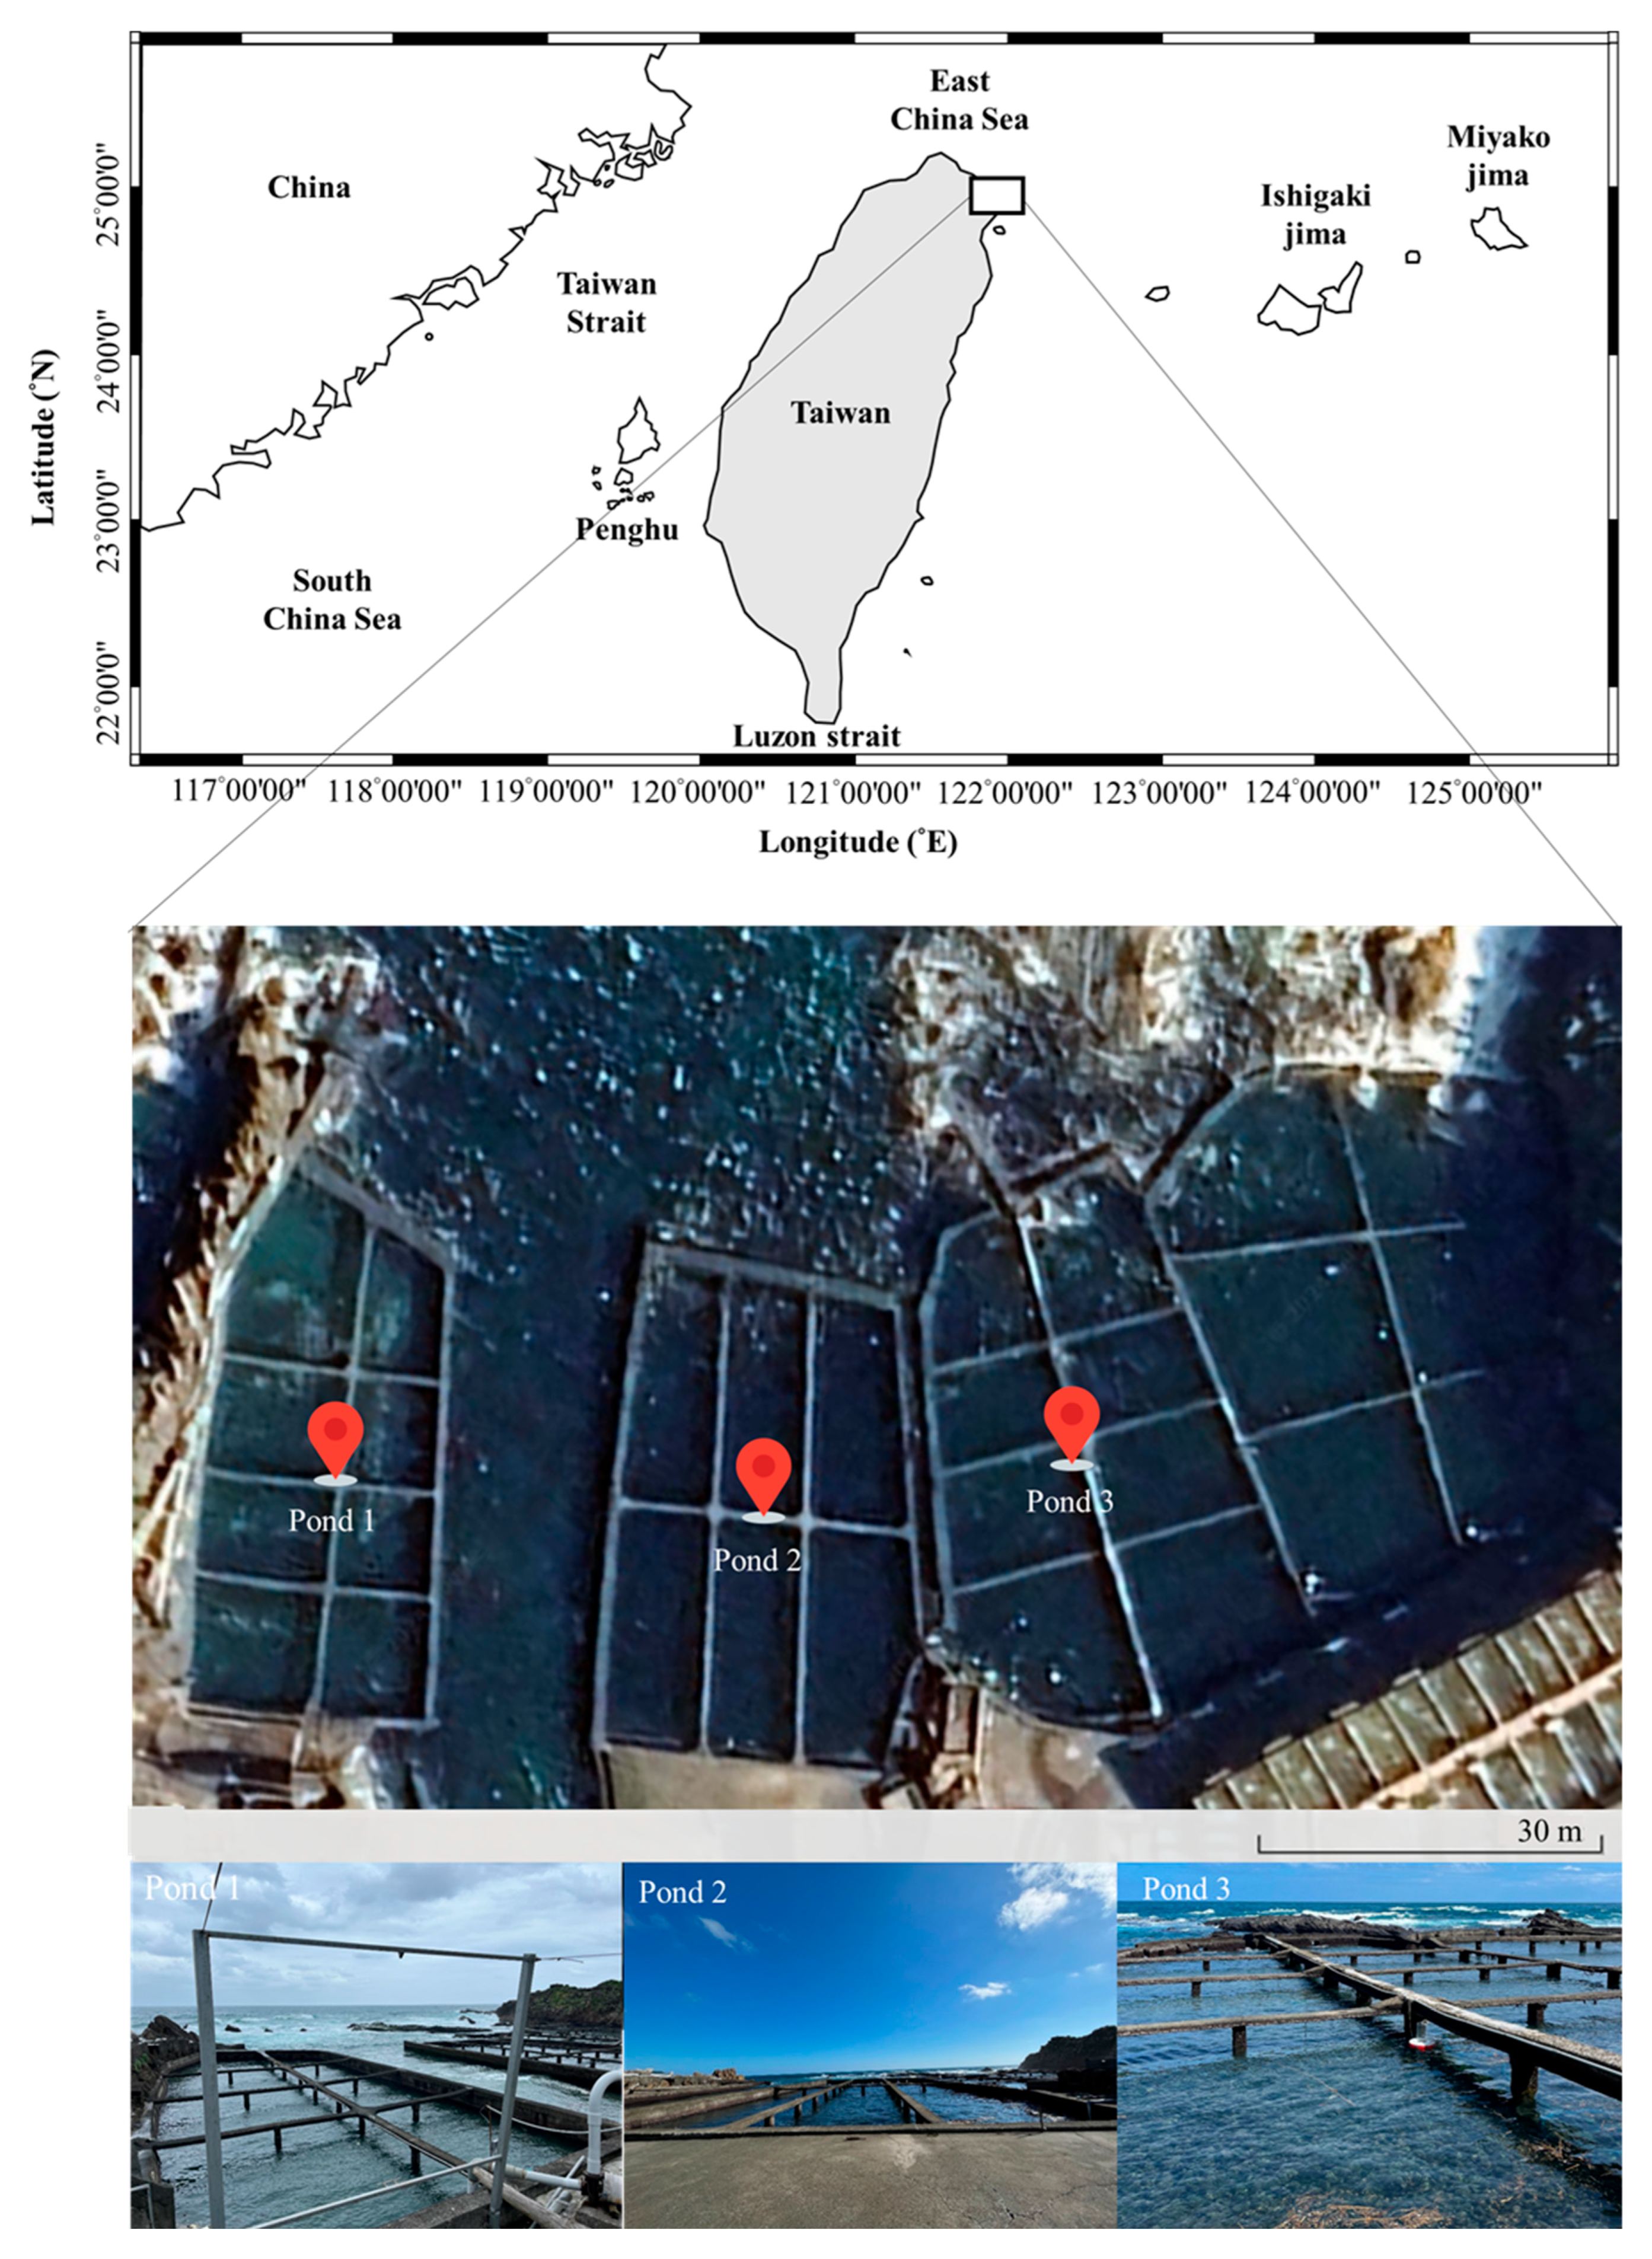
Figure 1. Location of the abalone aquaculture pond in Gongliao district of New Taipei City, Taiwan.
Environments 12 00313 g001
Figure 2. Commercial-size Haliotis discus.
Environments 12 00313 g002
Figure 3. Diurnal variation in pond (A) water temperature (°C); (B) salinity (PSU); (C) dissolved oxygen (mg L−1); and (D) pH during the culture period. LS represents the landward side, and SS represents the seaward side. Water temperature was continuously monitored, whereas salinity, dissolved oxygen, and pH are presented as mean ± standard deviation (SD).
Environments 12 00313 g003
Figure 4. Diurnal variation in pond (A) dissolved inorganic phosphorus; (B) nitrate nitrogen concentration (mg L−1); (C) ammonium nitrogen concentration (mg L−1); and (D) dissolved organic carbon (mg L−1) during the culture period. LS represents the landward side, and SS represents the seaward side. Data are presented as mean ± standard deviation (SD).
Environments 12 00313 g004
Figure 5. Diurnal variation in pond (A) dissolved inorganic carbon (µmol kg−1) and (B) total alkalinity (µmol kg−1) during the culture period. LS represents the landward side, and SS represents the seaward side. Data are presented as mean ± standard deviation (SD).
Environments 12 00313 g005
Figure 6. Diurnal variation in pond (A) pCO2 concentrations (µatm), (B) CH4 concentrations (nM), and (C) N2O concentrations (nM) during the culture period. LS represents the landward side, and SS represents the seaward side. Data are presented as mean ± standard deviation (SD).
Environments 12 00313 g006
Figure 7. Diurnal variation in pond (A) CO2 fluxes (mmol m−2 day−1), (B) CH4 fluxes (µmol m−2 day−1), and (C) N2O fluxes (µmol m−2 day−1) during the culture period. LS represents the landward side, and SS represents the seaward side. Data are presented as mean ± standard deviation (SD).
Environments 12 00313 g007
Table 1. Stocking density and yield in the abalone aquaculture system.
ParametersPond 1Pond 2Pond 3
Area (m2)180016601700
Depth (m)2–42–42–4
Volume (tons)270024902550
Culture month888
Survival rate (%)95.095.095.0
Initial weight (g/unit Abalone)2–32–32–3
Initial stocking weight (kg)400–600400–600400–600
Final weight (g/unit Abalone)24–2824–2824–28
Final harvest weight (tons)4.56–5.324.56–5.324.56–5.32
Table 2. Results of Kruskal–Wallis rank-based one-way ANOVA testing the effects of season, sampling time (morning vs. afternoon), and location (landward vs. seaward) on GHG fluxes and environmental variables in abalone aquaculture ponds.
VariablesFactorndfp-Value
Water temperatureLocation12010.954
Period10.633
Seasons3p < 0.001
SalinityLocation12010.943
Period10.695
Seasons3p < 0.001
pHLocation12010.557
Period10.130
Seasons3p < 0.001
Dissolved oxygenLocation12010.903
Period10.539
Seasons3p < 0.001
Dissolved organic carbonLocation12010.227
Period10.980
Seasons3p < 0.001
Dissolved inorganic carbonLocation12010.844
Period10.424
Seasons3p < 0.001
Total alkalinityLocation12010.655
Period10.500
Seasons3p < 0.001
Ammonium nitrogenLocation12010.475
Period10.677
Seasons3p < 0.001
Nitrate nitrogenLocation12010.560
Period1<0.05 (0.018)
Seasons3p < 0.001
Dissolved inorganic phosphorusLocation12010.802
Period10.235
Seasons30.149
pCO2 concentrationLocation12010.209
Period1<0.05 (0.007)
Seasons3p < 0.001
CH4 concentrationLocation12010.980
Period10.822
Seasons3<0.05 (0.001)
N2O concentrationLocation1201<0.05 (0.001)
Period10.280
Seasons3<0.05 (0.005)
CO2 fluxLocation12010.328
Period10.445
Seasons3<0.05 (0.003)
CH4 fluxLocation12010.643
Period10.691
Seasons3p < 0.001
N2O fluxLocation1201<0.05 (0.001)
Period10.341
Seasons3p < 0.001
Table 3. Pearson correlation coefficients for CO2 flux, CH4 flux, N2O flux, and environmental variables in abalone aquaculture ponds. * indicates a significant difference (p-value < 0.05).
Environmental VariablesCO2 FluxCH4 FluxN2O Flux
Pearson Correlationp-ValuePearson Correlationp-ValuePearson Correlationp-Value
Greenhouse gas flux
CO2 flux- 0.528 *<0.0010.442 *0.003
CH4 flux0.528 *<0.001- 0.982 *<0.001
N2O flux0.442 *0.0030.982 *<0.001-
Water properties
Water temperature−0.290 *0.002−0.663 *<0.001−0.474 *0.001
Salinity0.348 *<0.0010.768 *<0.0010.615 *<0.001
pH−0.532 *<0.001−0.364 *0.021NS0.345
Dissolved oxygen−0.592 *<0.001−0.384 *0.005NS0.373
Dissolved organic carbon−0.250 *0.013−0.434 *<0.001−0.362 *0.030
Dissolved inorganic carbon0.366 *0.001NS0.053NS0.336
Total alkalinityNS0.792NS0.068NS0.946
NH3-N concentrationNS0.469NS0.122NS0.470
NO2-N concentrationND ND ND
NO3-N concentrationNS0.459NS0.109NS0.258
DIP concentrationNS0.964NS0.474NS0.531
Chlorophyll a concentrationND ND ND
Wind speed0.471 *<0.0010.976 *<0.0010.914 *<0.001
NS; not significant; ND: no data, values below the detection limit.
Table 4. Average CO2, CH4, and N2O fluxes from pond water in the abalone culture system during the culture period, different lowercase letters on bars indicate significant differences between seasons.
Culture PeriodCO2 Flux
(mmol m−2 day−1)
CH4 Flux
(mmol m−2 day−1)
N2O Flux
(mmol m−2 day−1)
Wind Speed
(m s−1)
Spring2.95 ± 7.14 a2.72 ± 0.46 × 10⁻³ a2.24 ± 1.73 × 10⁻³ a1.30 ± 0.00 a
Summer5.19 ± 15.47 b3.43 ± 3.17 × 10⁻³ a2.91 ± 3.82 × 10⁻³ a1.45 ± 0.86 a
Autumn−0.06 ± 0.06 a0.01 ± 0.00 × 10⁻³ c0.02 ± 0.00 × 10⁻³ b0.10 ± 0.00 c
Winter−2.06 ± 1.04 c0.32 ± 0.08 × 10⁻³ b0.39 ± 0.22 × 10⁻³ b0.50 ± 0.00 b
Average2.19 ± 10.832.11 ± 2.81 × 10−31.65 ± 2.73 × 10−30.84 ± 0.64
Table 5. Dynamics of CO2-equivalent (CO2-eq) fluxes in the abalone culture system during the culture period.
CO2 FluxCH4 FluxN2O Flux
CO2-eq (mg CO2-eq m−2 day−1)GWP20Range−0.32–0.960.05–42.90 × 10⁻³−12.54–59.36 × 10⁻³
Average0.05 ± 0.2510.50 ± 13.94 × 10−310.23 ± 16.96 × 10⁻³
Total Average0.02 ± 0.09
GWP100Range−0.32–0.960.02–14.53 × 10⁻³−12.54–59.36 × 10⁻³
Average0.05 ± 0.253.56 ± 4.72 × 10−310.23 ± 16.96 × 10⁻³
Total Average0.02 ± 0.09
Disclaimer/Publisher’s Note: The statements, opinions and data contained in all publications are solely those of the individual author(s) and contributor(s) and not of MDPI and/or the editor(s). MDPI and/or the editor(s) disclaim responsibility for any injury to people or property resulting from any ideas, methods, instructions or products referred to in the content.