Article

Toxicological Risk Assessment and Source Identification of Groundwater Pollution: A Case of Sheep Herd Damage in a Pastoral Area

1
Agro-Environmental Protection Institute, Ministry of Agriculture and Rural Affairs/Key Laboratory of Original Agro-Environmental Pollution Prevention and Control, MARA/Tianjin Key Laboratory of Agro-Environment and Agro-Product Safety, Tianjin 300191, China
2
Ecology and Environment Bureau of Damao Banner, Baotou City, Inner Mongolia Autonomous Region, Baotou 014060, China
*
Author to whom correspondence should be addressed.
These authors contributed equally to this work.
Environments 2025, 12(7), 240; https://doi.org/10.3390/environments12070240 (registering DOI)
Submission received: 9 May 2025 / Revised: 25 June 2025 / Accepted: 8 July 2025 / Published: 14 July 2025

Abstract

Improper emissions from industrial activities pose toxicological risks to groundwater safety. Based on an environmental forensic identification case involving livestock (sheep) damage caused by groundwater pollution in a pastoral area, we comprehensively evaluated groundwater quality risks, toxicological risks, and pollution sources using multivariate statistical methods, the Nemerow index method, and a non-carcinogenic health risk model. The potential specific pollutants in the region mainly included calcium, potassium, sodium, magnesium, manganese, fluoride, chloride, sulfate, ammonia nitrogen, total dissolved solids, and nitrate. An evaluation of the groundwater health risk factors showed that fluoride, nitrate, and manganese pose higher health risks (HQ > 1), as fluoride > nitrate > manganese. This suggests that these three pollutants were the primary causes of livestock damage. Identification of pollution sources using multivariate statistical analysis revealed that the main pollutants in the groundwater originate from two rare earth enterprises in the surrounding industrial park, followed by the emissions from animal husbandry. This study provides guidelines into comprehensive regional toxicological risk assessment and source tracing, offering an identification method for similar forensic environmental damage cases.

1. Introduction

Groundwater is an important source of drinking water. However, contaminated groundwater pollution can easily spread and is difficult to manage. Various anthropogenic activities including industrial, urban, and agricultural pollution, have degraded groundwater quality, posing regional ecological risks and affecting the drinking water and health of humans and livestock [1,2]. Groundwater contamination often occurs by the pollution of surface water or soil, which then enter the groundwater through long-term rainwater infiltration and surface runoff [3]. Commonly, various pollution sources are difficult to accurately identify [4]. Therefore, accurate identification of pollution sources is crucial for effectively controlling pollutant emissions and preventing pollution aggravation. Reasonable water quality sampling over an appropriate spatial coverage, coupled with auxiliary verification of potential characteristic pollutant levels in animal samples, facilitates the screening of specific pollutants, identification of pollution sources, and discrimination of the causes of biological damage in the target area.
Multivariate statistical techniques (MSTs) and the Nemerow index method have been widely used in quality assessments of rivers and groundwater [5,6]. The modified Nemerow pollution index method calculates the weights of each evaluation item, including the effect of evaluation items with low concentrations but significant hazards on water quality, thus making the evaluation results more accurate [7]. When faced with multiple pollutants in a water medium, the Nemerow index method can combine multiple water quality variables into a single numerical index to reflect the water quality status [8]. Multivariate statistical techniques, such as cluster analysis (CA), factor analysis, and principal component analysis (PCA), are used to interpret complex datasets, aiding in understanding multidimensional information and patterns. These methods assist in identifying pollution sources and distinguishing between primary anthropogenic and natural factors affecting groundwater or rivers [9].
The non-carcinogenic health risk model proposed by the United States Environmental Protection Agency (USEPA) is used to evaluate the toxicological risks of water pollution by quantitatively describing the health hazards of specific pollutants to people of different age groups and prioritizing regional pollutants, which is conducive to an in-depth exploration of the effect of regional groundwater ecological risks [10,11]. Previous studies have used a single method to identify pollution sources, such as geochemical fingerprinting or pollution index methods; only a few studies have combined multiple methods to gain a comprehensive understanding of pollution dynamics and the associated risks [12,13]. Therefore, the combination of the Nemerow index, MSTs, and toxicological assessment methods allows for not only a comprehensive evaluation of groundwater quality but also the assessment of potential ecological risks to livestock drinking groundwater in the region.
Currently, researchers have focused on the regional spatial distribution, migration characteristics, risk assessment, or pollution source identification of contaminants [14,15,16,17,18]. However, there is a paucity of data on the survival conditions of animals in polluted areas, although biological entities in the habitat, including livestock and human, are often adversely affected when regions face toxicological risks. Therefore, this study was based on the factual circumstances of a typical environmental forensic identification case involving damaged livestock (sheep) at a ranch in Inner Mongolia, China. Building upon traditional analytical methods, such as PCA, CA, and cluster analysis, we integrated toxicity assessment methodologies from the non-carcinogenic health risk model to identify characteristic pollutants, evaluate toxicological risks, and trace pollution sources in a pastoral area. Our findings provide help for comprehensive regional toxicological risk assessment, effective groundwater pollution management, and precise source tracing.

2. Materials and Methods
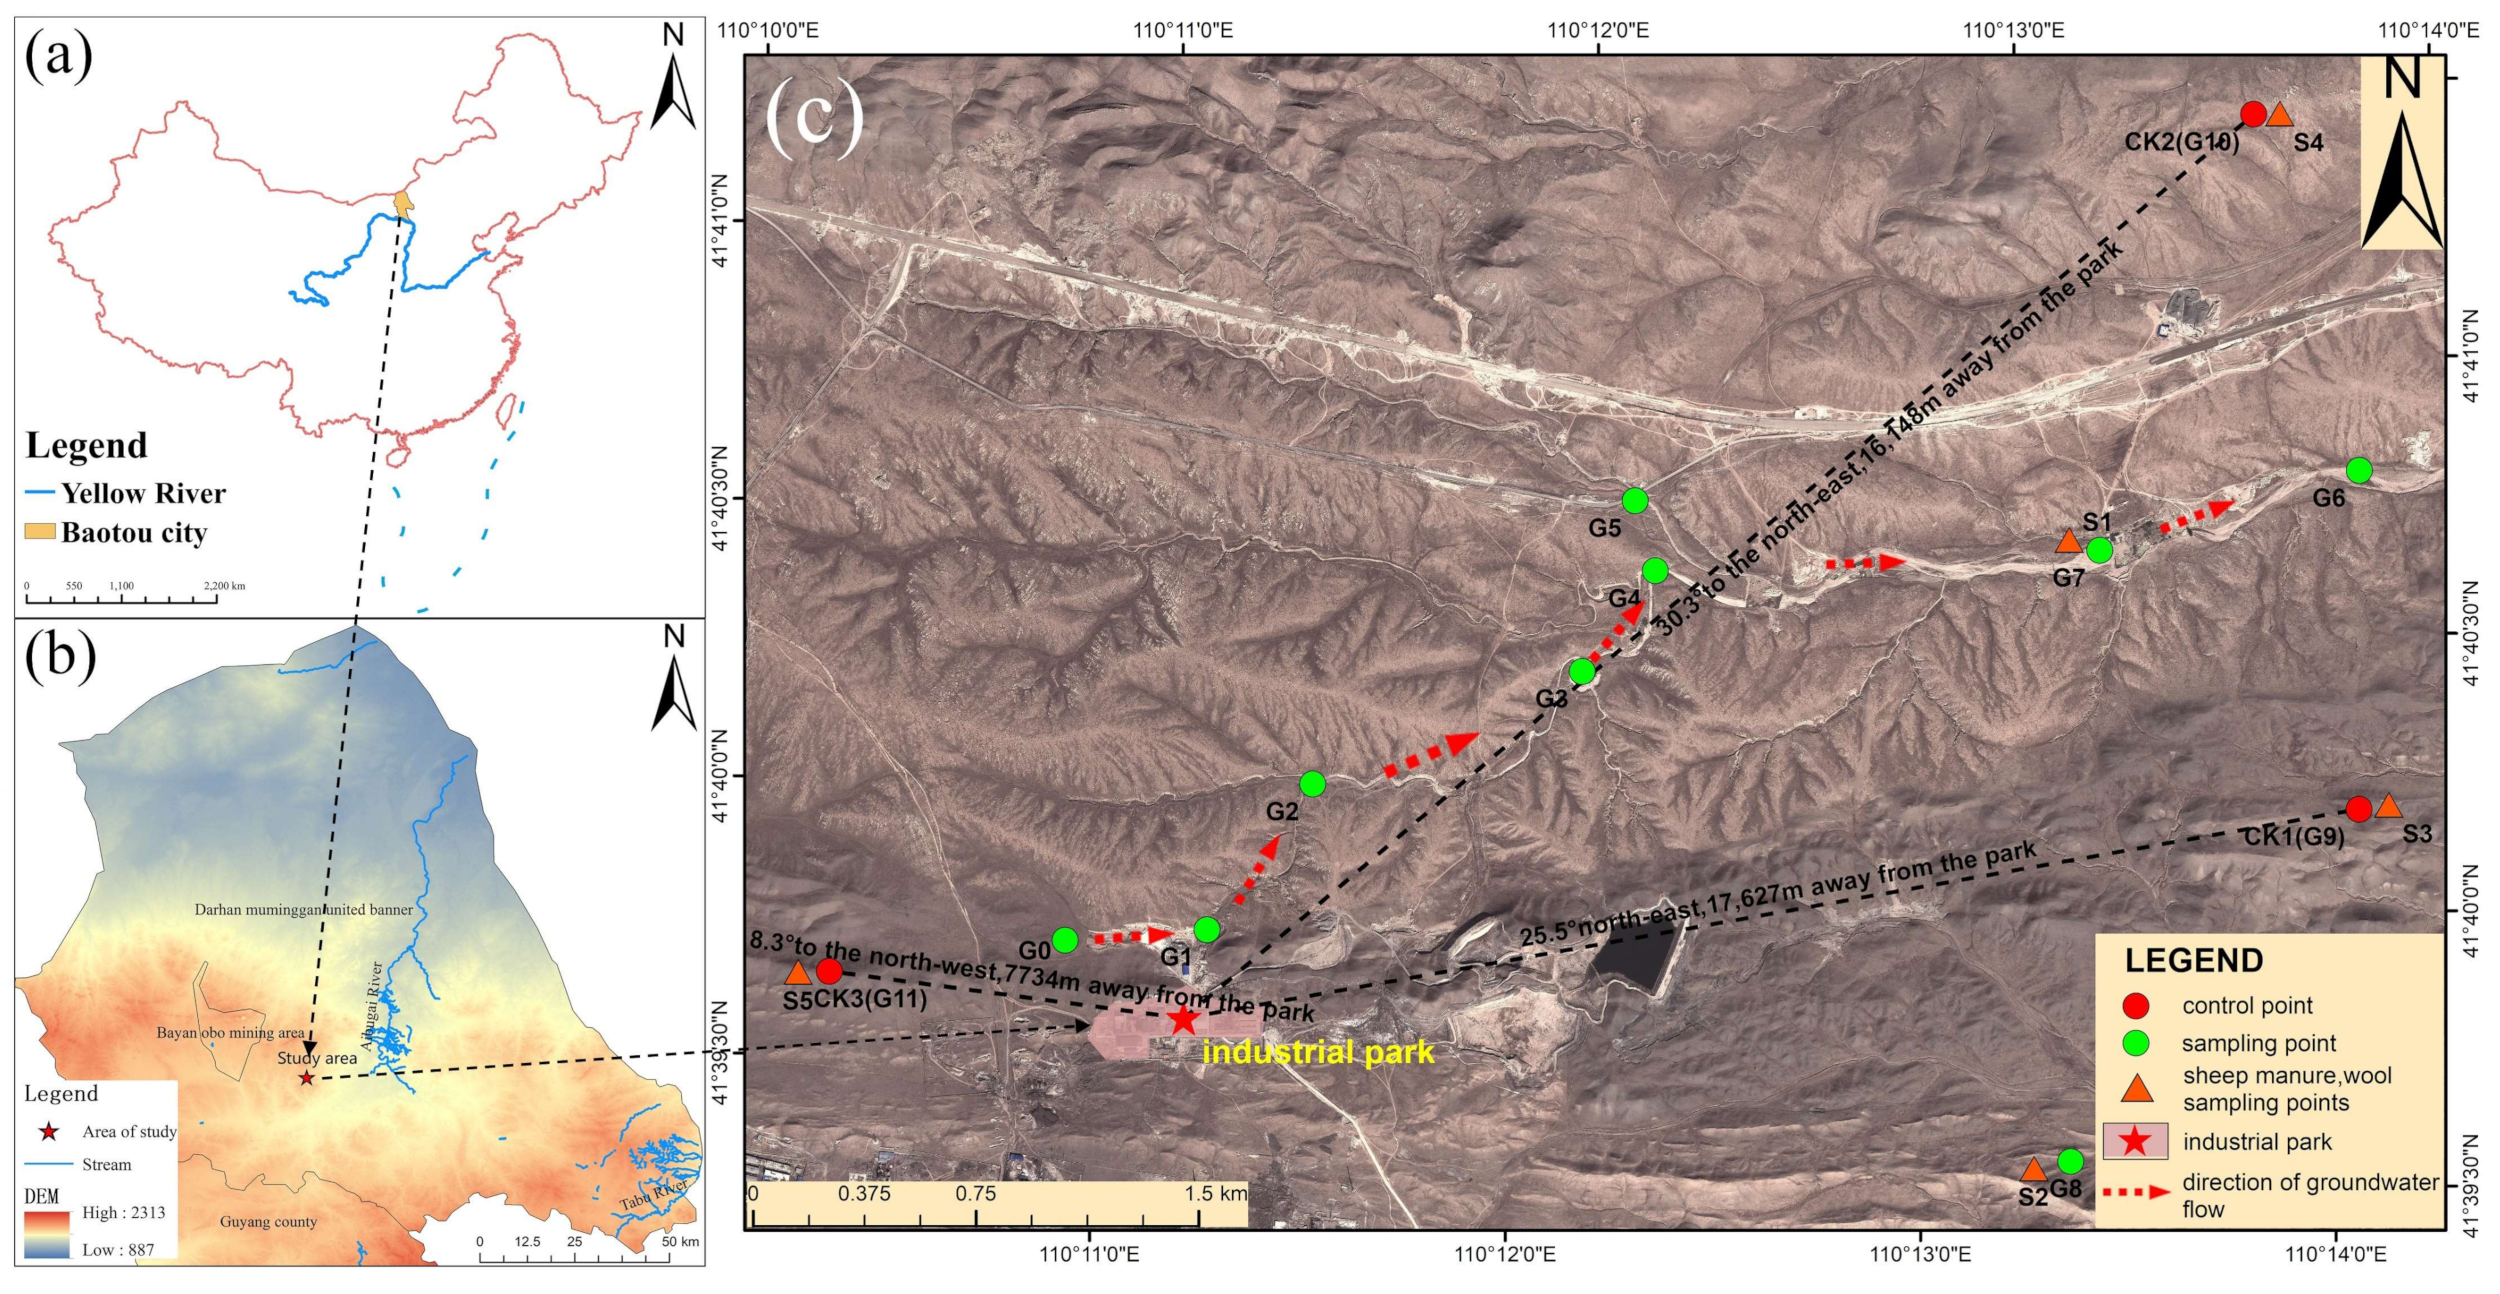
2.1. Study Area

The pastoral area is located in Baotou City, Inner Mongolia, China, with central coordinates of N 110°13′19.56″, E 41°40′42.96″. The sampling geographical location is shown in Figure 1. The overall terrain of this area is relatively flat, with concentrated rainfall in the summer and an average rainfall of approximately 256.2 mm. The annual average temperature is 3.4 °C, classifying it as a mid-temperate semi-arid continental climate [19]. The tectonic unit of the study area belongs to the northern edge of the Daqing Mountain in Inner Mongolia of the North China Platform. The hydrological address unit is the pore-confined water area of the Xihe Depression Basin. The overall terrain is high in the northwest and low in the southeast, and the groundwater flow direction is from northwest to southeast. The region suffers from water scarcity, characterized by low annual precipitation and high evaporation rates [20]. The groundwater in the northern part of the study area is mainly stratified rock fissure water, with a single well inflow of less than 10 m3/d, belonging to the SO4·HCO3Na·Ca and SO4·HCO3Ca·Mg types. The southern part is mainly pore water of the loose rock type, and the water inflow of a single well is less than 100 m3/d. The runoff in the region is unobstructed, with a mineralization degree of less than 0.5 g/L. It is mainly replenished by atmospheric precipitation and Quaternary diving, and mainly belongs to the HCO3Ca·Mg-type water [21]. The primary use of this region is as a pasture for sheep grazing, and groundwater serves as the main water source.

2.2. Sampling Point Layout and Collection

Based on preliminary testing data (Table S1), the water quality stored in the flood drainage canal within the pasture area where the damaged sheep were located exceeded the “Groundwater Quality Standard” (GB/T 14848-2017) [22]. Field interviews and site inspections identified an industrial park to the northwest of the assessment area. The groundwater monitoring area was determined, extending upstream and downstream to encompass the pasture range where the sheep were affected. Twelve groundwater monitoring points were established in June 2023, primarily along the groundwater flow direction, with specific locations shown in Figure 1. The average sampling depth for the groundwater was 6.50 m. Among these, G0, G1, G2, G3, G4, G5, and G6 were newly constructed monitoring wells, while G7, G8, G9, G10, and G11 were drinking water wells for sheep. Good purging was conducted to avoid disturbances, such as air stripping and steam sparging within the wellbore, ensuring that the water level drop during purging was less than 10 cm. Then, the groundwater samples were collected after the wells were stabilized for 24 h according to the requirements of the “Technical Regulations on Preservation and Management of Water Quality Samples” (HJ 493-2009) [23] and “Technical Specifications for Groundwater Environment Monitoring” (HJ 164-2020) [24].
Three pastures surrounding the damaged pasture, with identical feeding and management practices and normal sheep growth and development, were selected as a control group. The mortality rates of the adult sheep and lambs and the weight loss rate of sheep at slaughter were measured in the control group and two damaged pastures.

2.3. Analytical Methods

The relevant pollutants in the water samples were detected as follows. The pH was measured on-site using a portable pH meter (PHBJ-260F; Leici, Shanghai, China). The arsenic (As) content was determined using atomic fluorescence spectrometry (AFS-8220; Jitian, Beijing, China). The concentration of major metal ions (calcium (Ca2+), potassium (K+), sodium (Na+), magnesium (Mg2+), iron (Fe), and manganese (Mn)) were measured using an atomic absorption spectrometer (700p; Analytik Jena, Jena, Germany). The nitrate (NO3), sulfate, fluoride (F), and chloride (Cl) contents were determined using an ion chromatograph (ICS1100; Thermo Fisher Scientific Inc, MA, USA). The nitrite nitrogen content (calculated as nitrogen) was detected using spectrophotometry (T6, Persee, Beijing, China). The ammonia nitrogen was determined using Nessler’s reagent spectrophotometry with a UV/Vis spectrophotometer (T6; Persee, Beijing, China). The carbonate content was detected using the acid–base indicator titration. The dissolved total solids were measured using gravimetry. The reference material numbers are as follows: Na+: GBW(E)084488, Ca2+: GBW(E)080367, Fe: GBW(E)080949, K+: GBW(E)080365, Mg2+: GBW(E)080369, Mn: BW085521, Cl: GBW(E)084362, SO42−: GBW(E)080372, and CO32−: BWZ6877-2016. The analysis methods of the samples were carried out in accordance with the corresponding standard methods (Table S2), and the accuracy and credibility of the data were guaranteed through a series of quality control measures. The quality control results of the sample tests are shown in Table S3.

2.4. Groundwater Quality and Health Risk Assessment

2.4.1. Groundwater Quality Assessment

We used an improved Nemerow pollution index method to assess the groundwater quality in the study area [25]. The formula is as follows:
N P I = max I i 2 + W a v g I i 2 2
W a v g I i = 1 n I i * ω i n
I i = C i S i
where NPI represents the Nemerow comprehensive pollution index, max(Ii)2 is the square of the maximum single-factor pollution index, Wavg(Ii)2 is the weighted average of the pollution index of the water quality index, ω i is the weight value of the pollution index of the water quality index, Ii represents the single pollution factor for the ith pollutant, Ci is the measured concentration of groundwater in the area, and Si is the standard value for each type of pollutant [26].
The Nemerow index (NPI) can be classified into the following levels: (NPI < 1) low pollution (1 ≤ NPI < 2.5), moderate pollution (2.5 ≤ NPI < 7), and high pollution (NPI ≥ 7) [27,28].

2.4.2. Health Risk Assessment

Pollutants in groundwater pose potential health risks to animals primarily through ingestion [29]. We suspect that groundwater contamination in the study area may be the primary factor affecting the normal growth and development of livestock, considering the low annual rainfall and absence of other surface water sources. Therefore, to clarify the causes of damage to sheep on the pasture, the USEPA health risk assessment model was used to evaluate the risk of groundwater quality in the region [30]. The hazard quotients (HQs) were referenced against values established by the USEPA’s Office of Pollution Prevention and Toxics [31]. The formula is as follows:
H Q = C D I R f D
C D I = C × I R × E F × E D B W × A T
where RfD represents the reference dose for the oral ingestion exposure pathway [mg/(kg·d)], and the chronic daily intake (CDI) is calculated as below.
An HQ < 1 indicates no adverse effects on human health, whereas an HQ > 1 suggests potential adverse effects on human health.
The chronic daily intake (CDI) is the amount of the substance consumed per unit of body weight per day. C is the concentration of the chemical parameter in the water (mg/L), IR is the ingestion rate of water (1.85 L/d for adults and 1.0 L/d for children), EF is the exposure frequency (350 days for both adults and children), ED is the exposure duration (30 years for adults and 6 years for children), BW is the average body weight in kilograms (60.9 kg for adults and 26.8 kg for children), and AT is the average time (AT = 365 × ED(d)), where d represents the number of days [32,33,34]; Tables S4 and S5).

2.5. Statistical Analysis

The statistical analyses were conducted using SPSS 22.0 (IBM Corp., Armonk, NY, USA). Pearson correlation coefficient (PCC) was performed to determine the correlation between the chemical components. Two-level clustering analysis (HCA) was performed to determine the similarity between each sampling point, and principal component analysis (PCA) was performed to extract the main features of the data to confirm the contribution of the original variables to the principal components. The figures were constructed using OriginPro 2021.

2.6. Livestock Damage

The growth information of the sheep in the study area and the surrounding area not affected by groundwater was collected. The number of deaths of breeding sheep and lambs, the slaughter weight of breeding sheep, etc., were collected, and the mortality rate of the breeding sheep and lambs and the weight loss rate of the slaughter weight of the breeding sheep w calculated to carry out the correlation matrix analysis between the quality of the drinking well water and the growth of sheep.

2.7. Data Analysis

The conceptual framework proposed for multivariate complex pollution source detection is summarized in Figure 2. The framework involves data processing and statistical analysis, correlation analysis, PCA, and two-level clustering analysis.

3. Results and Discussion

3.1. Pollution Source Analysis

We conducted polynomial trend fitting for the concentration of each contaminant at the groundwater monitoring sites. There was a gradually decreasing trend in the concentrations of Mn, F, K+, Na+, and Mg2+, following the sequence of sampling points from G1 to G8 (R2 = 0.60, R2 = 0.65, R2 = 0.64, R2 = 0.74, and R2 = 0.85, respectively; Figure 3c–e,g,h). Notably, the sequence from G1 to G8 coincides with the groundwater flow direction. This may be attributed to the proximity of the pollution source to the G1 sampling point, with the concentrations of contaminants gradually decreasing along the groundwater flow path according to their migration patterns.
The results of the multivariate analysis revealed complex correlations among the groundwater contaminants in the region, providing crucial information for identifying pollution sources and potential origins of contamination. To further trace the sources of groundwater contamination exceeding the “Groundwater Quality Standard” (GB/T 14848-2017) [22] in the region, we conducted an exclusionary investigation during the identification process and determined that PC1 primarily originates from industrial pollution. The pollution source was pinpointed as an existing industrial park located within a ranch. Because this area is a natural ranch and there are no other potential industrial pollution sources aside from this park on the western side of the identified region, it is virtually certain that the contaminants included in PC1, such as Cl, F, and Mn, originate from enterprises within this industrial park. Further analysis revealed that two rare earth enterprises within the park produce wastewater, including acidic wastewater (sulfuric acid and fluoride salt), ammonium sulfate wastewater, ammonium chloride wastewater, and brine, during the production process using raw and auxiliary materials. These wastewaters contain multiple contaminants present in PC1, such as Cl, F, SO42−, and Mg2+. Wastewater discharged during the mining and processing of ion-adsorption rare earth ores contains high concentrations of sulfate ions, ammonia, and nitrogen, which are direct sources of sulfate and ammonia nitrogen pollution [35]. The primary contaminants generated during on-site leaching mining of ion-adsorption rare earth ores are heavy metals, ammonia nitrogen, SO42−, and others. Notably, the concentrations of Mn, F, K+, and Mg2+ showed a gradually decreasing trend following the groundwater flow sequence from G1 to G8 (R2 = 0.74, R2 = 0.85, R2 = 0.60, and R2 = 0.64, respectively; Figure 3a–d), which aligns with the migration pattern of contaminants spreading from the source to the surrounding areas [18]. Therefore, we infer that the pollution source is relatively close to the G1 sampling point. This finding further supports our conclusion that the pollution source of PC1 is the industrial park.
The correlation analysis provides valuable insights into the potential common origins of pollutants by assessing the degree of association between different pollutants [5]. As shown in Figure 4a, Cl exhibits significant positive correlations with F (r = 0.90), Mn (r = 0.90), SO42− (r = 0.86), NO3 (r = 0.76), Na+ (r = 0.90), K+ (r = 0.90), and Mg2+ (r = 0.76). F also shows significant positive correlations with Cl (r = 0.90), Mn (r = 0.95), SO42− (r = 0.78), Na+ (r = 0.82), K+ (r = 0.83), and Mg2+ (r = 0.90). Mn has significant positive correlations with F (r = 0.95), Cl (r = 0.90), SO42− (r = 0.74), Na+ (r = 0.90), K+ (r = 0.90), Mg2+ (r = 0.90), and NH3-N (r = 0.81). SO42− has significant positive correlations with F (r = 0.78), Cl (r = 0.86), Mn (r = 0.74), Na+ (r = 0.75), K+ (r = 0.61), Mg2+ (r = 0.78), TDS (r = 0.74), and NO3 (r = 0.88). These results indicate clear linear relationships among these elements in groundwater, suggesting a possible common source. Additionally, Cl, F, Mn, and SO42− all exhibit significant correlations with Na+, K+, and Mg2+ (Figure 4a, p < 0.01 or p < 0.05). The results of the correlation analysis are generally consistent with those of the PCA, confirming the robustness of the results.
The dual-hierarchical cluster analysis (HCA) serves as an auxiliary method to analyze data clustering and pattern recognition of contaminants in regional groundwater from a different perspective [36]. Therefore, in this study, we performed a dual-HCA to supplement and validate the results obtained from the PCA. Overall, the separation between clusters in the HCA was not as pronounced as that in the PCA; however, the proximity of contaminants within the clusters provides insights into the similarity of their sources. For instance, NO2 and NH3-N show proximity in terms of their sources, while Ca2+, As, and CO32− are grouped within the same cluster (Figure 4b). Contaminants, such as F, Mn, K+, and Cl, are clustered together, suggesting a potential common source, which is consistent with the PCA findings. Nevertheless, there exist some discrepancies between the results of the dual HCA and PCA. HCA operates by iterative grouping or separating data based on similarity or dissimilarity measures, whereas PCA identifies principal components through eigenvalue or singular-value decomposition [6]. Consequently, these differences may lead to slight variations in their outcomes.
The PCA method reveals the complex relationships among various pollutants in groundwater by examining the spatial arrangement patterns of these pollutants [37]. The PCA showed that the eigenvalues of the three principal components are >1, with a cumulative variance contribution rate of 84.71% (Table 1, Figure 4e). Specifically, PC1 comprises Cl, F, Mn, SO42−, NO3, Na+, K+, Mg2+, and TDS, with significant positive loadings > 0.77, accounting for 57.22% of the total variance (Figure 4c). These findings suggest that these pollutants share common environmental attributes or originate from the same source owing to their strong correlations. By contrast, PC2, comprising NO2, iron, and NH3-N, has a loading combination accounting for only 15.13% of the total variance, with the positive and negative loadings primarily exceeding 0.65 (Figure 4d,f). Since the study area belongs to the pasture and only involves animal husbandry, we summarize the principal component 2 (PC2) as the input of animal husbandry. PC3 is composed of CO32−, As, and Ca2+, with a loading combination accounting for 12.36% of the total variance.
PC2 consists of NO2, Fe, and NH3-N, with a relatively small loading combination accounting for only 15.13% of the total variance. This result is similar to the HCA results, where NO2 and NH3-N were clustered together. The concentration of iron does not exceed the “Groundwater Quality Standard” (GB/T 14848-2017). NO2 and NO3 can interconvert, with NO3 being relatively more stable. An acidic environment favors the conversion of NO3 to NO2 [38]. The acidic pH values at sampling points G2 and G4 may be the primary reason for the excess NO2 in the groundwater. Hence, we suggest that NO2 is not a direct contaminant but rather an unstable indirect contaminant generated under acidic conditions owing to excess NO3 and the presence of acidic substances. The excess NH3-N may arise from two sources: ammonium sulfate, a byproduct produced by rare earth enterprises, which may enter the groundwater through atmospheric precipitation and surface runoff due to inadequate protective measures implemented by the enterprises [39], and excreta from a large number of livestock on the ranch that can enter the soil through rainwater erosion and soil capillary action, subsequently migrating into the groundwater through leaching and infiltration, affecting the NH3-N levels in the groundwater [40]. The detection of organic and inorganic nitrogen contents revealed that the excess NH3-N in the groundwater of this region is mainly in the form of inorganic ammonia nitrogen. This NH3-N may be mainly derived from the conversion of ammonium sulfate wastewater generated in the industrial park, while a minor amount may originate from livestock excreta.
PCA, HCA, and PCC are the most widely used multivariate statistical techniques, providing interpretations of complex data matrices to better understand the contamination status of the media in the investigated areas [9,41]. In this study, the PCA, PCC, and HCA methods were simultaneously used to identify pollution sources of contaminants in ecological media, and their results were used to complement and validate each other. For instance, although both As and Ca2+ were included in PC3, the correlation analysis showed no close correlation between the pollutant As and Ca2+ (R = −0.23), and the As content at each monitoring site did not exceed the standard value of the “Groundwater Quality Standard” (GB/T 14848-2017). Therefore, it is necessary to utilize multiple analysis methods for complementation and validation. Karadeniz et al. [42] used statistical methods, such as principal component analysis (PCA), hierarchical cluster analysis (HCA), and Pearson correlation coefficient (PCC). We analyzed the correlation and sources between the metal elements and the physical and chemical parameters and revealed the main sources of metal elements in spring water (natural or anthropogenic sources). The three analysis methods yielded consistent source tracing results, providing good validation among the methods. Various multivariate statistical methods have been applied in identifying the sources of toxic elements in the Çavuşlu River sediments in Turkey, successfully revealing that waste disposal facilities are the primary anthropogenic source of contamination in sediments [37].

3.2. Toxicological Risk Assessment

By integrating the indicators of metals, organic matter, and nutrients, the comprehensive pollution status of the groundwater in the region was evaluated using the modified NPI method. The NPI was 43, categorizing it as “highly polluted”. When livestock (sheep) in the pasture drink “highly polluted” groundwater, it is highly likely to cause adverse reactions and toxic effects in the animals. Hence, we hypothesize that the deterioration in drinking water quality is correlated with the observed symptoms of sheep damage, such as increased mortality and weight loss.
Given the lack of suitable toxicological evaluation methods specifically for the health of livestock such as sheep, we used the USEPA health risk assessment model [30] to evaluate the effect of characteristic pollutants in the drinking water on the health of different age groups, thereby assessing the water quality situation in the region. Corresponding hazard quotients (HQs) for Ca2+, K+, Na+, Mg2+, NH3-N, TDS, and Cl were not found in the Integrated Risk Information System database. Therefore, we evaluated other important health risk factors and found that some sampling points in the study area exceeded the risk limitation, with increasing intensity of health risks: F > NO3 > Mn. The exceedance rates at these points ranged from 37 to 50%, indicating that these three pollutants pose higher health risks to humans or livestock in the region (Table 2). A comparison of the HQ values for children and adults revealed that all the monitored indicators were higher for children than for adults, suggesting that infants are more sensitive to non-carcinogenic risks and more susceptible to the adverse effects of F, NO3, and Mn. Overall, the quality of groundwater in the study area poses health risks to the surrounding livestock or humans and should undergo remediation if used as drinking water by local livestock.

3.3. Potential Characteristic Risk Factors in Groundwater

According to the “Groundwater Quality Standard” (GB/T 14848-2017) currently implemented in China, the “Guidelines for Drinking-water Quality” by the WHO (2022) (Table 3), and the background values, we comprehensively screened the regional characteristics of the potential pollution factors. The pH level of the groundwater ranged between 6.5 and 8.0, with most sites having neutral pH. According to the overall planning of the region, the groundwater in this area complied with the Class III water quality standards. The average concentrations of arsenic (As), sodium (Na+), iron (Fe), manganese (Mn), fluoride (F), chloride (Cl), sulfate (SO42−), ammonia nitrogen (NH3-N), total dissolved solids (TDS), nitrite (NO2), and nitrate (NO3) in the groundwater at various sites were 0.84, 186, 0.03, 4.70, 15.34, 131.91, 1807, 47.21, 2962, 0.79, and 320 mg/L, respectively. The concentrations of other pollutants, except for As, Na+, Fe, Cl, and NO2, exceeded the Class III water quality standards, having average values of 47, 15, 7, 94, 3, and 16 times the standard values, respectively (Figure 5a,d,f–n). The data indicate that the concentrations of Ca2+, K+, and Mg2+ at most sites were significantly higher than those at the background site. Compared with the background value, the average concentrations of these three metals were 5, 8, and 11 times higher, respectively (Figure 5b,c,e).
Due to geological factors, the study area itself contains some chemical substances. Studies have found that the content of arsenic in the groundwater of the Hetao Basin in Inner Mongolia is between 0.96 and 720 μg/L, while the concentration of fluoride is between 0.30 and 2.57 mg/L [43]. Despite this, based on the Class III water quality standards and the pollutant concentrations at the background points, through a comprehensive analysis of the over-limit situation of groundwater pollutants in this area, it can still be clearly identified that the potential characteristic pollutants in this area mainly include Ca2+, K+, Na+, Mg2+, Mn, F, Cl, SO42−, NH3-N, TDS, and NO3. Thus, these pollutants, which significantly exceed the standard values or background values, may pose potential risks to the ecosystem within the region and cause toxic effects on livestock.

3.4. Causes Analysis of Damage to Sheep

The toxicological risk assessment results of the groundwater indicate potential adverse effects on livestock. After conducting an on-site investigation, the potential harm to the sheep flocks in the surrounding pastures was confirmed to originate from the drinking groundwater, leading to impaired growth. Therefore, the correlation between groundwater pollutants and indicators of sheep damage was analyzed. The Mantel correlation matrix between the pollutant contents in the drinking well water and the sheep-growth indicators clearly showed a significant positive correlation between the mortality rate of sheep and the concentrations of Ca2+, K+, SO42−, and TDS in the well water (r = 0.89, p < 0.05; r = 0.90, p < 0.05; r = 0.99, p < 0.01; and r = 0.98, p < 0.01; Figure 6). There was a significant negative correlation between the sheep slaughter weight and the SO42− and TDS contents (r = −0.92, p < 0.05; r = −0.89, p < 0.05; Figure 6). These indicators are closely related to excessive levels of Ca2+, Mg2+, NH3-N, and NO2, suggesting that the increased mortality rate and the decreased slaughter weight of sheep may be caused by these related factors, namely, drinking well water is the cause of sheep damage.
Although F and Mn are essential trace elements for animal growth, at higher concentrations, they can be toxic to organisms. China stipulates that the fluoride concentration in drinking water should not exceed 1 mg/L (GB 5749-2006). Generally, a relatively safe fluoride concentration for sheep in the Inner Mongolia region is 0.58–1.3 mg/L [44], whereas the average F concentration at the monitoring sites was as high as 15.34 mg/L. As early as the 1970s, tooth damage in sheep due to high F concentrations in forage was reported in the Baotou area of Inner Mongolia, leading to difficulties in chewing and feeding, subsequently resulting in malnutrition and growth retardation [45,46].
In this study, sheep’s teeth were smaller and shorter, which is very similar to the symptoms of fluoride poisoning (Figure S1). Furthermore, the F concentrations in the sheep manure from the affected areas were increased by 1.82- and 1.93-fold compared to those in the control group. The Mn content in sheep manure and wool was also significantly higher (Table S6). Excessive Mn may be an important cause of symptoms, such as unstable gait and paralysis in sheep, as Mn primarily induces the auto-oxidation of dopamine in the frontal cortex of livestock, leading to the destruction of dopaminergic neurons and decolorization of gray matter in the central nervous system, which can cause neurological disorders. Excessive Mn also interferes with synaptic neurotransmission by entering the nerve terminals of motor neurons through Ca2+ channels during action potentials, thereby increasing the release of neurotransmitters [47,48].
When ruminants, such as sheep, ingest excessive amounts of NO3, it can be reduced to NO2 by rumen microorganisms and further reduced to ammonia. The NO2 produced during this intermediate stage exhibits toxic effects [49]. High SO42− concentrations in drinking water can lead to decreased water intake and feed consumption in animals. However, some studies have indicated that SO42− concentrations in animal drinking water below 1000 mg/L are relatively safe, whereas those above 2000 mg/L may cause diarrhea, decreased production performance, and occasionally sulfur-related cases of polioencephalomalacia [50]. According to “Pollution-free Food: Water Quality for Livestock and Poultry Drinking Water” [51] (NY 5027-2008), the safe concentration standard for SO42− is ≤500 mg/L. In this study, the maximum SO42− concentration in the groundwater samples reached 3880 mg/L, exceeding the water quality standards for livestock and poultry drinking water, which may adversely affect sheep. Although [52] reported that NaCl (7 g/L), Na2SO4 (2 g/L), or NaNO2 (40 mg/L) had minimal effects on carcass traits and meat quality in Barbarine lambs, they did affect the amount of fatty acids in the meat. The concentrations of SO42− and NO3 in the groundwater in this study were higher than those used in the aforementioned study; therefore, the negative effects of NO3 and SO42− on sheep health and production performance cannot be excluded.

3.5. Future-Oriented Environmental Damage Identification Outlook

(1)
Using multiple statistical analysis methods and integrating case information could accurately identify the sources of groundwater pollutants, thereby assisting administrative law enforcement personnel in handling similar pollution cases and enabling them to make scientific judgments and enforce decisions. Moreover, it provides guidelines for handling similar environmental damage appraisal cases.
(2)
The pollution sources in this case were traced to two rare earth enterprises. Thus, the sewage discharge, hazardous waste disposal, and other environmental protection measures of these two enterprises should be closely monitored and investigated by relevant environmental law enforcement personnel to prevent more serious pollution problems in the future.
(3)
Based on the current groundwater monitoring results, there are adverse effects on the growth of cattle and sheep in this region, primarily due to their ingestion of contaminated drinking water. Thus, to avoid unnecessary losses of livestock, cattle, sheep, and other livestock in this area should not use local groundwater as a drinking water source until it has been restored.

4. Conclusions

Based on the groundwater quality, there are potential toxicological risks to livestock within the study region. The characteristic pollutants identified in the groundwater mainly included Ca2+, K+, Na+, Mg2+, Mn, F, Cl, SO42−, NH3-N, TDS, and NO3. The NPI in the groundwater of the study area is as high as 43 (NPI ≥ 7), which belongs to the “high pollution” level. Specifically, F, NO3, and Mn pose potential health risks in this order: F (HQ = 34.17) > NO3 (HQ = 21.58) > Mn (HQ = 4.4). Thus, groundwater should not be used for drinking by local livestock until water quality remediation measures are implemented. Additionally, PCA, CA, and cluster analyses revealed that the main source of groundwater pollution is industrial contamination from two rare earth enterprises in the surrounding industrial park. The regional toxicological risk assessment and pollution source identification conducted can assist environmental or agriculture-livestock law enforcement personnel in making scientific judgments and management. Our findings also provide guidance to management departments in implementing relevant environmental emergency measures to prevent more serious pollution problems.

Supplementary Materials

The following supporting information can be downloaded at: https://www.mdpi.com/article/10.3390/environments12070240/s1, Figure S1: Teeth of sheep in control area (a) and study area (b, c); Table S1: Preliminary test results of water quality; Table S2: Detection method of groundwater samples; Table S3: Quality control results of water quality testing; Table S4: Parameters for the use of the U.S. National Environmental Protection Agency (USEPA) health risk assessment model; Table S5: Contaminant concentrations in fecal and hair samples from sheep and cattle.

Author Contributions

Q.Z., W.W. and H.C. wrote the main manuscript text and prepared Table 1, Table 2, Table 3. Y.Y., J.S. (Jianjun Sun), J.S. (Jialu Sun) and X.L. prepared Figure 1, Figure 2, Figure 3, Figure 4, Figure 5, Figure 6. All authors have read and agreed to the published version of the manuscript.

Funding

The research of this study is supported by the Chinese Academy of Agricultural Sciences (CAAS).

Informed Consent Statement

Not applicable.

Data Availability Statement

The data will be made available on request.

Conflicts of Interest

The authors declare that they have no conflicts of interest.

References

  1. Torres-Martínez, J.A.; Mora, A.; Knappett, P.S.K.; Ornelas-Soto, N.; Mahlknecht, J. Tracking Nitrate and Sulfate Sources in Groundwater of an Urbanized Valley Using a Multi-tracer Approach Combined with a Bayesian Isotope Mixing Model. Water Res. 2020, 182, 115962. [Google Scholar] [CrossRef] [PubMed]
  2. Abanyie Samuel, K.; Apea Ohene, B.; Abagale Samson, A.; Amuah Ebenezer Ebo, Y.; Sunkari Emmanuel, D. Sources and Factors Influencing Groundwater Quality and Associated Health Implications: A Review. Emerg. Contam. 2023, 9, 100207. [Google Scholar] [CrossRef]
  3. Neely, W.R.; Borsa, A.A.; Burney, J.A.; Levy, M.C.; Silverii, F.; Sneed, M. Characterization of Groundwater Recharge and Flow in California’s San Joaquin Valley from InSAR-observed Surface Deformation. Water Resour. Res. 2021, 57, e2020WR028451. [Google Scholar] [CrossRef] [PubMed]
  4. Chen, X.; Zheng, L.; Zhu, M.; Jiang, C.; Dong, X.; Chen, Y. Quantitative Identification of Nitrate and Sulfate Sources of a Multiple Land-use Area Impacted by Mine Drainage. J. Environ. Manag. 2023, 325, 116551. [Google Scholar] [CrossRef]
  5. Bessa Santos, R.M.; Farias do Valle Junior, R.; Abreu Pires de Melo Silva, M.M.; Tarlé Pissarra, T.C.; Carvalho de Melo, M.; Valera, C.A.; Leal Pacheco, F.A.; Sanches Fernandes, L.F. A Framework Model to Integrate Sources and Pathways in the Assessment of River Water Pollution. Environ. Pollut. 2024, 347, 123661. [Google Scholar] [CrossRef]
  6. Ustaoğlu, F.; Yuksel, B.; Tepe, Y.; Aydin, H.; Topaldemir, H. Metal Pollution Assessment in the Surface Sediments of a River System in Türkiye: Integrating Toxicological Risk Assessment and Source Identification. Mar. Pollut. Bull. 2024, 203, 116514. [Google Scholar] [CrossRef]
  7. Su, K.; Wang, Q.; Li, L.; Cao, R.; Xi, Y. Water Quality Assessment of Lugu Lake Based on Nemerow Pollution Index Method. Sci. Rep. 2022, 12, 13613. [Google Scholar] [CrossRef]
  8. Su, K.; Wang, Q.; Li, L.; Cao, R.; Xi, Y.; Li, G. Water Quality Assessment Based on Nemerow pollution Index Method: A Case Study of Heilongtan Reservoir in Central Sichuan Province, China. PLoS ONE 2022, 17, e0273305. [Google Scholar] [CrossRef]
  9. Varol, M. Use of Water Quality Index and Multivariate Statistical Methods for the Evaluation of Water Quality of a Stream Affected by Multiple Stressors: A Case Study. Environ. Pollut. 2020, 266, 115417. [Google Scholar] [CrossRef]
  10. Meng, F.; Cao, R.; Zhu, X.; Zhang, Y.; Liu, M.; Wang, J.; Chen, J.; Geng, N. A Nationwide Investigation on the Characteristics and Health Risk of Trace Elements in Surface Water Across China. Water Res. 2024, 250, 121076. [Google Scholar] [CrossRef]
  11. Li, X.; Ma, J.; Chen, S.; Shen, X.; Meng, J.; Geng, J.; Yang, Y.; Yang, Z.; Zhang, J.; Zhang, H.; et al. Pollution Appraisal, Health Risk Assessment and Source Apportionment of Reservoirs’ Heavy Metals in an Agricultural Base, Northern Anhui Province, China. Pol. J. Environ. Stud. 2024, 33, 3759–3769. [Google Scholar] [CrossRef]
  12. Collins, A.L.; Pulley, S.; Foster, I.D.L.; Gellis, A.; Porto, P.; Horowitz, A.J. Sediment Source Fingerprinting as an Aid to Catchment Management: A Review of the Current State of Knowledge and a Methodological Decision-tree for End-users. J. Environ. Manag. 2017, 194, 86–108. [Google Scholar] [CrossRef] [PubMed]
  13. Aydin, H.; Tepe, Y.; Ustaoglu, F. A Holistic Approach to the Eco-geochemical Risk Assessment of Trace Elements in the Estuarine Sediments of the Southeastern Black Sea. Mar. Pollut. Bull. 2023, 189, 114732. [Google Scholar] [CrossRef]
  14. Yu, B.; Wang, Y.; Zhou, Q. Human Health Risk Assessment Based on Toxicity Characteristic Leaching Procedure and Simple Bioaccessibility Extraction Test of Toxic Metals in Urban Street Dust of Tianjin, China. PLoS ONE 2014, 9, e92459. [Google Scholar] [CrossRef]
  15. Zhang, Q.; Wang, H.; Lu, C. Tracing Sulfate Origin and Transformation in an Area with Multiple Sources of Pollution in Northern China by Using Environmental Isotopes and Bayesian Isotope Mixing Model. Environ. Pollut. 2020, 265, 115105. [Google Scholar] [CrossRef]
  16. Carrey, R.; Baleste, E.; Blanch, A.R.; Lucena, F.; Pons, P.; Manuel Lopez, J.; Rull, M.; Sola, J.; Micola, N.; Fraile, J.; et al. Combining Multi-isotopic and Molecular Source Tracking Methods to Identify Nitrate Pollution Sources in Surface and Groundwater. Water Res. 2021, 188, 116537. [Google Scholar] [CrossRef]
  17. Jafarzadeh, N.; Heidari, K.; Meshkinian, A.; Kamani, H.; Mohammadi, A.A.; Conti, G.O. Non-carcinogenic Risk Assessment of Exposure to Heavy Metals in Underground Water Resources in Saraven, Iran: Spatial Distribution, Montecarlo Simulation, Sensitive Analysis. Environ. Res. 2022, 204, 112002. [Google Scholar] [CrossRef]
  18. You, X.; Liu, S.; Dai, C.; Guo, Y.; Zhong, G.; Duan, Y. Contaminant Occurrence and Migration Between High- and Low-permeability Zones in Groundwater Systems: A Review. Sci. Total Environ. 2020, 743, 140703. [Google Scholar] [CrossRef]
  19. Li, W.; Dong, S.; Lin, H.; Li, F.; Cheng, H.; Jin, Z.; Wang, S.; Zhang, H.; Hou, P.; Xia, B. Vulnerability of Farmers and Herdsmen Households in Inner Mongolian Plateau to Arid Climate Disasters and Their Development Model. J. Clean Prod. 2023, 402, 136853. [Google Scholar] [CrossRef]
  20. Hai, C.; Zhao, M.; Hao, R.; Guo, Y.; Li, J. Studies on the Soil Surface Layer Moisture Changes of Different Land Use Types in Spring in North Foot of Yinshan Mountain. J. Arid Land Resour. Environ. 2005, 19, 150–154. [Google Scholar] [CrossRef]
  21. Gong, M.; Cai, J.; Yan, G.; Liu, C.; Liu, Z. Petrogeochemical Characteristics and Zircon SHRIMP U-Pb Ages of the Alkaline Intrusions on Northern Side of the Yinshan Mountains-Yanshan Mountains and Their Tectonic Significances. Geol. Rev. 2019, 65, 894–915. [Google Scholar] [CrossRef]
  22. GB/T 14848-2017; Standard for Groundwater Quality. Ministry of Land and Resources and Ministry of Water Resources of the People’s Republic of China. China Quality and Standards Publishing & Media Co., Ltd.: Beijing, China, 2017.
  23. HJ 493-2009; Water Quality—Technical Regulation of the Preservation and Handling of Samples. Ministry of Ecology and Environment of the People’s Republic of China. China Environmental Science Publishing House: Beijing, China, 2009.
  24. HJ 164-2020; Technical Specifications for Environmental Monitoring of Groundwater. Ministry of Ecology and Environment of the People’s Republic of China. China Environment Publishing Group: Beijing, China, 2020.
  25. Jannat, J.N.; Mia, M.Y.; Jion, M.M.M.F.; Islam, M.S.; Ali, M.M.; Siddique, M.A.B.; Rakib, M.R.J.; Ibrahim, S.M.; Pal, S.C.; Costache, R.; et al. Pollution Trends and Ecological Risks of Heavy Metal(loid)s in Coastal Zones of Bangladesh: A Chemometric Review. Mar. Pollut. Bull. 2023, 191, 114960. [Google Scholar] [CrossRef] [PubMed]
  26. World Health Organization (WHO). Guideline for Drinking Water Quality (Fourth Edition). Available online: https://www.who.int/publications/i/item/9789241549950 (accessed on 13 July 2025).
  27. Li, B.; Song, J.; Guan, M.; Chen, Z.; Tang, B.; Long, Y.; Mao, R.; Zhao, J.; Xu, W.; Zhang, Y. With Spatial Distribution, Risk Evaluation of Heavy Metals and Microplastics to Emphasize the Composite Mechanism in Hyporheic Sediments of Beiluo River. J. Hazard. Mater. 2024, 462, 132784. [Google Scholar] [CrossRef] [PubMed]
  28. Senoro, D.B.; De Jesus, K.L.M.; Monjardin, C.E.F. Pollution and Risk Evaluation of Toxic Metals and Metalloid in Water Resources of San Jose, Occidental Mindoro, Philippines. Sustainability 2023, 15, 3667. [Google Scholar] [CrossRef]
  29. Kurwadkar, S.; Kanel, S.R.; Nakarmi, A. Groundwater pollution: Occurrence, Detection, and Remediation of Organic and Inorganic Pollutants. Water Environ. Res. 2020, 92, 1659–1668. [Google Scholar] [CrossRef]
  30. Nawaz, R.; Nasim, I.; Irfan, A.; Islam, A.; Naeem, A.; Ghani, N.; Irshad, M.A.; Latif, M.; Nisa, B.U.; Ullah, R. Water Quality Index and Human Health Risk Assessment of Drinking Water in Selected Urban Areas of a Mega City. Toxics 2023, 11, 577. [Google Scholar] [CrossRef]
  31. Sheng, D.; Meng, X.; Wen, X.; Wu, J.; Yu, H.; Wu, M.; Zhou, T. Hydrochemical Characteristics, Quality and Health Risk Assessment of Nitrate Enriched Coastal Groundwater in Northern China. J. Clean Prod. 2023, 403, 136872. [Google Scholar] [CrossRef]
  32. USEPA (U.S. Environmental Protection Agency). Risk Assessment Guidance for Superfund; Human Health Evaluation Manual, Part B Volume I); [9285.7-01B]; Office of Emergency and Remedial Response: Washington, DC, USA, 1991. [Google Scholar]
  33. USEPA (U.S. Environmental Protection Agency). Risk Assessment Guidance for Superfund; Human Health Evaluation Manual (Part E, Volume I:); Supplemental Guidance for Dermal Risk Assessment; EPA/540/R/99/005, OSWER 9285.7-02EP, PB99-963312; Office of Superfund Remediation and Technology Innovation: Washington, DC, USA, 2004. [Google Scholar]
  34. Peng, H.; Yang, W.; Xiong, S.; Li, X.; Niu, G.; Lu, T.; Ferrer, A.S.N. Hydrochemical Characteristics and Health Risk Assessment of Groundwater in Karst Areas of Southwest China: A Case Study of Bama, Guangxi. J. Clean Prod. 2022, 341, 130872. [Google Scholar] [CrossRef]
  35. Zhang, Q.; Ren, F.; Li, F.; Chen, G.; Yang, G.; Wang, J.; Du, K.; Liu, S.; Li, Z. Ammonia Nitrogen Sources and Pollution along Soil Profiles in an In-situ Leaching Rare Earth Ore. Environ. Pollut. 2020, 267, 115449. [Google Scholar] [CrossRef]
  36. Din, I.U.; Muhammad, S.; Rehman, I.U.; Tokatli, C. Spatial Distribution of Potentially Toxic Elements Contaminations and Risk Indices of Water and Sediments in the Darband and Samana Streams, Pakistan. Environ. Monit. Assess. 2023, 195, 1343. [Google Scholar] [CrossRef]
  37. Yüksel, B.; Ustaoglu, F.; Tokatli, C.; Islam, M.S. Ecotoxicological Risk Assessment for Sediments of Cavuslu Stream in Giresun, Turkey: Association between Garbage Disposal Facility and Metallic Accumulation. Environ. Sci. Pollut. Res. 2022, 29, 17223–17240. [Google Scholar] [CrossRef] [PubMed]
  38. Wu, Y.; Bu, L.; Duan, X.; Zhu, S.; Kong, M.; Zhu, N.; Zhou, S. Mini Review on the Roles of Nitrate/Nitrite in Advanced Oxidation Processes: Radicals Transformation and Products Formation. J. Clean Prod. 2020, 273, 123065. [Google Scholar] [CrossRef]
  39. Wu, X.; Zhao, X.; Yi, G.; Zhang, W.; Gao, R.; Tang, D.K.H.; Xiao, R.; Zhang, Z.; Yao, Y.; Li, R. Promoting Nitrogen Conversion in Aerobic Biotransformation of Swine Slurry with the Co-application of Manganese Sulfate and Biochar. J. Environ. Manag. 2024, 356, 120604. [Google Scholar] [CrossRef] [PubMed]
  40. Zilio, M.; Orzi, V.; Chiodini, M.E.; Riva, C.; Acutis, M.; Boccasile, G.; Adani, F. Evaluation of Ammonia and Odour Emissions from Animal Slurry and Digestate Storage in the Po Valley (Italy). Waste Manag. 2020, 103, 296–304. [Google Scholar] [CrossRef]
  41. Ustaoğlu, F.; Tepe, Y. Water Quality and Sediment Contamination Assessment of Pazarsuyu Stream, Turkey Using Multivariate Statistical Methods and Pollution Indicators. Int. Soil. Water. Conse. 2019, 7, 47–56. [Google Scholar] [CrossRef]
  42. Karadeniz, S.; Ustaoğlu, F.; Aydin, H.; Yüksel, B. Toxicological Risk Assessment Using Spring Water Quality Indices in Plateaus of Giresun Province/Turkiye: A Holistic Hydrogeochemical Data Analysis. Environ. Geochem. Health 2024, 46, 285. [Google Scholar] [CrossRef]
  43. Guo, H.; Zhang, Y.; Xing, L.; Jia, Y. Spatial Variation in Arsenic and Fluoride Concentrations of Shallow Groundwater from the Town of Shahai in the Hetao Basin, Inner Mongolia. Appl. Geochem. 2012, 27, 2187–2196. [Google Scholar] [CrossRef]
  44. Wang, H.; Liu, H.; Gao, D. Study on Chronic Fluorosis of Goats—The Experimental Results of Natural Grazing and Artificial Fluoride Poisoning. J. Environ. Eng.-ASCE 1981, 11, 17–21. [Google Scholar]
  45. Xu, G.; Masters, D.G.; Yu, S.; Lu, D.; White, C.L. An Investigation of Fluorosis of Cattle and Goats in Western Inner Mongolia. In Proceedings of the Mineral Problems in Sheep in Northern China and Other Regions of Asia, Beijing, China, 25–30 September 1995; pp. 56–60. [Google Scholar]
  46. Qu, W.J.; Zhong, D.B.; Wu, P.F.; Wang, J.F.; Han, B. Sodium Fluoride Modulates Caprine Osteoblast Proliferation and Differentiation. J. Bone Miner. Metab. 2008, 26, 328–334. [Google Scholar] [CrossRef]
  47. Reis, L.S.L.S.; Pardo, P.E.; Camargos, A.S.; Oba, E. Mineral Element and Heavy Metal Poisoning in Animals. Saudi J. Med. Med. Sci. 2010, 1, 560–579. [Google Scholar]
  48. Toghdory, A.; Asadi, M.; Ghoorchi, T.; Hatami, M. Impacts of Organic Manganese Supplementation on Blood Mineral, Biochemical, and Hematology in Afshari Ewes and Their Newborn Lambs in the Transition Period. J. Trace Elem. Med. Biol. 2023, 79, 127215. [Google Scholar] [CrossRef] [PubMed]
  49. Llonch, L.; Verdú, M.; Guivernau, M.; Viñas, M.; Martí, S.; Medinyà, C.; Riera, J.; Cucurull, J.; Devant, M. Dose Effect of Drinking Water Nitrate on Health, Feed Intake, Rumen Fermentation and Microbiota, and Nitrogen Excretion in Holstein Heifers for a Sustainable Water Use. Sustainability 2024, 16, 8814. [Google Scholar] [CrossRef]
  50. Wright, C.L. Management of Water Quality for Beef Cattle. Vet. Clin. N. Am.-Food Anim. Pract. 2007, 23, 91–103. [Google Scholar] [CrossRef] [PubMed]
  51. NY 5027-2008; Pollution-Free Food-Water Quality of Livestock and Poultry Drinking Water. Ministry of Agriculture and Rural Affairs of the People’s Republic of China. China Agricultural Publishing House: Beijing, China, 2008.
  52. Yousfi, I.; Salem, H.B.; Aouadi, D.; Abidi, S. Effect of Sodium Chloride, Sodium Sulfate or Sodium Nitrite in Drinking Water on Intake, Digestion, Growth Rate, Carcass Traits and Meat Quality of Barbarine Lamb. Small Rumin. Res. 2016, 143, 43–52. [Google Scholar] [CrossRef]
Figure 1. Location (a,b), and sampling point (c) of pastoral area.
Environments 12 00240 g001
Figure 2. A conceptual framework based on a multivariate analysis of the detection results of complex pollution sources.
Environments 12 00240 g002
Figure 3. Trend-fitting diagrams for the contaminant concentrations in the groundwater at various monitoring sites, including for the As (a), Ca2+ (b), K+ (c), Na+ (d), Mg2+ (e), Fe (f), Mn (g), F (h), Cl (i), SO42− (j), NH3-N (k), TDS (l), NO2− (m), and NO3− (n) concentrations.
Environments 12 00240 g003
Figure 4. Graphical representation of pollutants in groundwater: (a) Pearson’s correlation analysis; (b) bipartite cluster analysis. (c) Sankey diagram. Analysis of pollutants in groundwater, (d) PCA polythetic analysis, (e) Scree Plot, and (f) rotation matrix. F denotes fluoride, Cl denotes chloride, SO42− denotes sulfate, NH3-N denotes ammonia nitrogen, TDS denotes total dissolved solids, and CO32− denotes carbonate.
Environments 12 00240 g004
Figure 5. Box plots and normal distribution plots of various pollutant concentrations in groundwater. Pollutants included As (a), Ca2+ (b), K+ (c), Na+ (d), Mg2+ (e), Fe (f), Mn (g), F (h), Cl (i), SO42− (j), NH3-N (k), TDS (l), NO2 (m), and NO3 (n). The red dashed line in the figures represents the Class III water quality standard values according to the “Groundwater Quality Standards” (GB/T 14848-2017) enforced in the region, while the blue dashed line represents the background values.
Environments 12 00240 g005
Figure 6. Mantel correlation matrix between the pollutant contents in the well water consumed by the sheep flocks in the pasture and the sheep-growth indicators. “Mortality1” represents the mortality rate of the growing sheep within the flock; “Mortality 2” represents the mortality rate of the lambs; “Weight” represents the rate of weight loss in the sheep at slaughter; and “F”, “Cl”, “SO42−”, “NH3-N”, “TDS”, and “CO32−” represent fluoride, chloride, sulfate, ammonia nitrogen, total dissolved solids, and carbonate, respectively.
Environments 12 00240 g006
Table 1. Eigenvalues and cumulative contribution rates of pollutants in groundwater in the study area.
Principal
Component
Initial EigenvalueExtract the Load Sum of SquaresSquare Sum of Rotational Loads
EigenvalueVariance
Proportion/%
Accumulation/%EigenvalueVariance
Proportion/%
Accumulation
/%
EigenvalueVariance
Proportion/%
Accumulation
/%
18.58357.21957.2198.58357.21957.1294.94132.94232.942
22.26915.12872.3472.26915.12872.3474.54330.28963.232
31.85412.36184.7081.85412.36184.7082.39815.98579.217
41.1517.67092.3791.1517.67092.3791.97413.16292.379
50.7555.03097.409
60.3182.11799.526
70.0710.474100.000
Table 2. Non-carcinogenic health risk assessment results of groundwater pollutants (children and adults).
IndexAsMnFNO2NO3Fe
HQ children
G10.1193.68034.1700.11112.8810.007
G20.1794.39624.4501.04815.6200.000
G30.1790.0410.8830.1720.5050.000
G40.1191.05810.9730.79421.5800.002
G50.0000.0000.5290.0000.0000.000
G60.0000.3041.0730.0000.0000.000
G70.1070.0490.3640.1366.6640.002
G80.1670.0790.7450.0100.0020.002
mean value0.1091.2019.1480.2847.1570.002
HQ adults
G10.0972.99627.8180.09010.4870.006
G20.1463.57919.9050.85312.7170.000
G30.1460.0330.7190.1400.4110.000
G40.0970.8618.9330.64717.5690.002
G50.0000.0000.4310.0000.0000.000
G60.0000.2480.8740.0000.0000.000
G70.0870.0400.2970.1115.4250.002
G80.1360.0650.6070.0080.0010.001
meanvalue0.0890.9787.4480.2315.8260.001
Table 3. Global overview of WHO drinking water quality regulations and standards in various countries and the limits of the “Groundwater Quality Standards” (GB/T 14848-2017), Class III water category, currently implemented in China. Unit: mg/L.
ParameterspHAsMg2+MnFeFClSO42−NH3-NTDSNO2NO3
WHO (2022)6.5 ≤ pH ≤ 8.50.01800.080.31.52502501.5600350
China6.5 ≤ pH ≤ 8.510~0.10.312502500.51000120
Disclaimer/Publisher’s Note: The statements, opinions and data contained in all publications are solely those of the individual author(s) and contributor(s) and not of MDPI and/or the editor(s). MDPI and/or the editor(s) disclaim responsibility for any injury to people or property resulting from any ideas, methods, instructions or products referred to in the content.

