3.1. Single-Pass Oxygenation from Air and O2
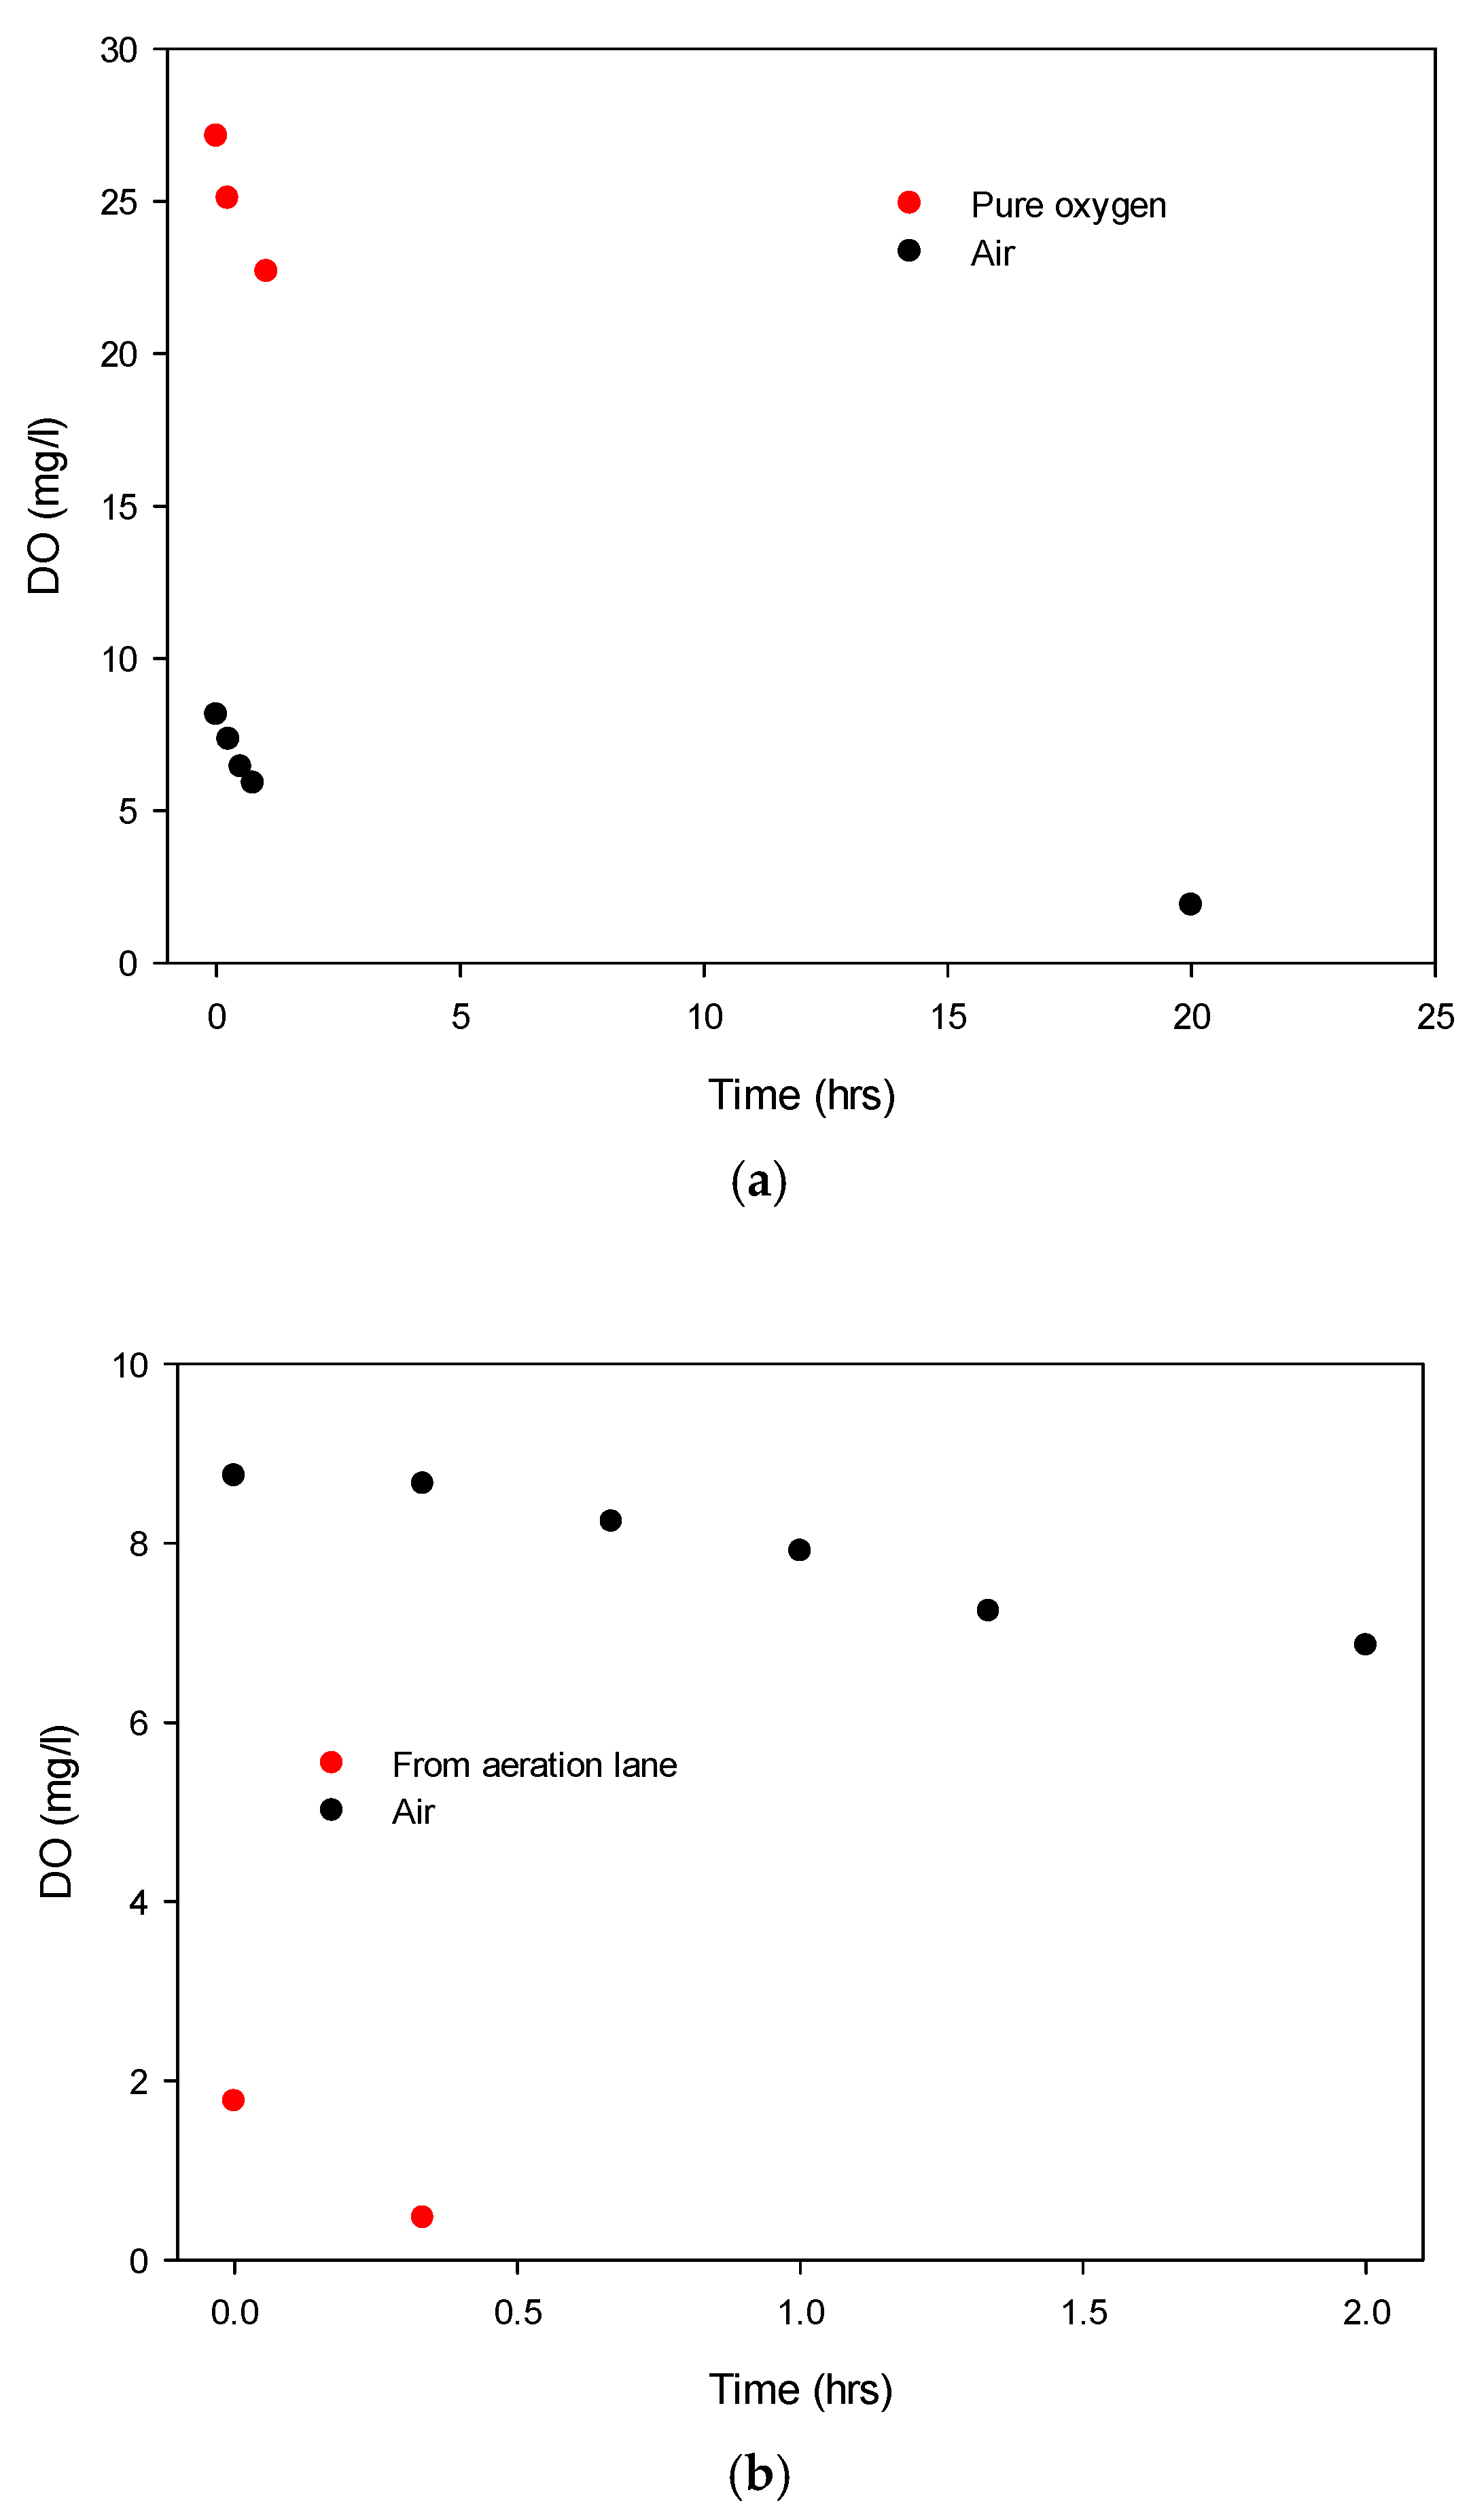
Before discussing the most promising low-energy NB oxygenation results, let us state the intrinsic deoxygenation rate of water sampled from the WWTP AS lanes, for background context: at 11 °C, DO dropped from 0.77 to 0.47 mg/L in 20 min (cf.
Figure 3b). This results in a negative exponential decay/relaxation time, τ, of 0.675 h (i.e., 40.5 min) for the exp(−t/τ) oxygen depletion relationship as a result of microbial consumption. As an aside, for exponential decay, as a rule of thumb for quick mental arithmetic, one relaxation time decays the initial level by a bit over two-thirds; 95% is lost after three such time “periods” have elapsed—i.e., two hours in this example results in a loss of 95% of the oxygen pumped in by the blowers in the aeration lane, without continuous re-aeration. As we shall see, we obtain far longer intrinsic relaxation times for DO levels in nano-oxygenated samples, owing to the previously discussed reservoir effect of the NB state.
In
Figure 3b, a second typical example of air showing the DO drop versus time for a single passage of incoming wastewater (DO < 0.1 mg/L) in shown in black (with the microbial culture again absent)—showing a relaxation time of about 16 h. For comparison, the red curve shows wastewater from the activated-sludge aeration lane not treated with nanobubbles, with the initial DO of ~1.9 ± 0.16 mg/L decaying much more quickly, as the present microbial culture consumes the dissolved oxygen much more quickly—this is slowed substantially by the presence of NBs in aeration lane wastewater.
With single-pass NB aeration from air (with the aid of a compressor), we routinely achieved (with a residence time of 10–15 s through the unit) DO boosts from <0.1 mg/L to 8.1–8.3 mg/L (corresponding to 0.3 to 73–76% of Henry’s Law level at 10–11 °C)—a typical example is shown in
Figure 3a,b. However, these DO levels were maintained higher for much longer: a relaxation time of 13.9 ± 2.7 h (averaged over six readings, arising from an 8.11 ± 0.20 mg/L decay to 1.92 ± 0.05 mg/L over 20 h, although the temperature was higher at 15.5 °C on the second day, compared to 10.6 °C). In any event, this is twenty times longer than the intrinsic relaxation time in the AS lane itself without NBs (compare
Figure 3a vs.
Figure 3b).
Considering statistical hypothesis testing and the distribution of the DO data and time evolutions thereof, normal/random distributions were seen, and the standard deviations were quite similar, supporting the validity of ANOVA testing and the validity of pairwise Student’s t-testing. Using ANOVA testing passing 99% confidence levels (at 99.2% on the Fisher F-distribution), we can conclude that NB-based aeration has led to a significant boost in long-lived oxygenation. Naturally, as there was not an AS culture presence in the nano-aerated influent water source, this comparison is slightly dramatic. However, we also carried out AS nano-aeration, which also showed the maintenance of DO levels at 3–3.5 mg/L for two to three times longer in the AS samples than with conventional aeration, with microbes appearing to operate at a metabolic rate around 2–3% above that of the conventional aeration of the AS samples. Measured over five cases, the aeration retention time boost was 2.39 ± 0.41, passing the Student’s t-test results at the 95% confidence level (at ~97%, single-tailed). This constant NB reservoir/battery-fed replenishment is simply Fick’s Law (kinetics) in action, resulting in the maintenance of the liquid-phase fugacity of oxygen in the conventionally dissolved state (thermodynamics), subject to microbial oxygen demand. Still, maintaining a target DO level of 3–3.5 mg/L for, typically, double or more the time in AS samples is striking—pointing to the substantial additional levels of nano-dissolved oxygen, realised in a very-low-energy way compared to mechanical fine-bubble systems and AS lane mechanical aerator blowers.
This striking low-energy and efficient oxygenation is explained, once again, by the reservoir effect, with the NBs’ additional oxygen supply in the nano-dissolved state providing oxygen release (via Fick’s Law) as the microbial population consumes local DO (and promoting the chemical potential driving force based on oxygen). DO probes cannot detect nanobubbles in any direct way—but we estimate that there is a further 5–8 mg/L in the NB state initially [
24] (which is depleted over tens of hours by influent water oxygen demand), above and beyond the measured DO level. These data have not yet been verified independently by other research groups in published form, although efforts are underway.
There was 27.13 ± 0.71 mg/L O
2 as a cylinder-fed gas, declining to 22.7 ± 0.56 mg/L over a little over an hour. In contact with air, this corresponds to 243 to 201% of Henry’s Law level at about 10.5 °C, and indeed, for near-pure O
2, we would expect the initial DO levels to reach above 200%, given that the electrostriction chamber also has a certain residence time of air therein. In any event, the DO depletion decay time here was about 5.8 ± 0.9 h. This shows that if O
2 is readily available in the nano-dissolved state in any event (beyond measured DO), then it is very useful indeed to boost DO. However, the longer relaxation time of simply using single-pass air, as opposed to pure O
2 (13.7 h vs. 5.8 h), arises due to the enhanced level of oxygen in the NBs [
24].
Comparing the DO decay dynamics shown in
Figure 3 with other fine-bubble aeration approaches, a conventional Xylem Sanitaire Silver II fine-bubble sparger–aerator was used as a control to aerate 200 L of filtered municipal water in comparison to 200 L passed through the NB generator shown in
Figure 1. After 1 min of operation for each configuration, the relaxation times for DO decay were found to be 63.6 ± 3.1 and 2.35 ± 0.26 h for nanobubble and fine-bubble aeration, respectively.
Commenting on these observed results in terms of nanobubble-based explanations, in cleaner water with lower BOD and COD, it is evident that the reservoir effect of curtailed and slower Fick’s Law transfer of NB-borne oxygen to the regularly dissolved (Henry’s Law) state—in an effort to realise closer NB and Henry’s Law state fugacity equilibration—suppresses the decay of DO. In contrast, the meso and microbubbles imparted by regular fine-bubble generators in such sparger–diffusers are dissipated relatively rapidly—within no more than a few hours by Stokesian bubble rising/buoyancy dissipation. In this case/comparison, one can see that DO (reflective of individual molecular solvation in a Henry’s Law state) decays around 25 times faster than it does for nanobubble aeration, given that Stokes’ Law has led to the rapid decay of any meso/microbubble reservoirs. In short, the slowness of release of nanobubbles, especially in cleaner water with low BOD and COD, leads to a far slower decay of DO, as these long-lived stores of gas release O2 molecules far more slowly—with less thermodynamic driving force for Fick’s Law transfer.
3.2. Settlement and Dissolved Air Flotation
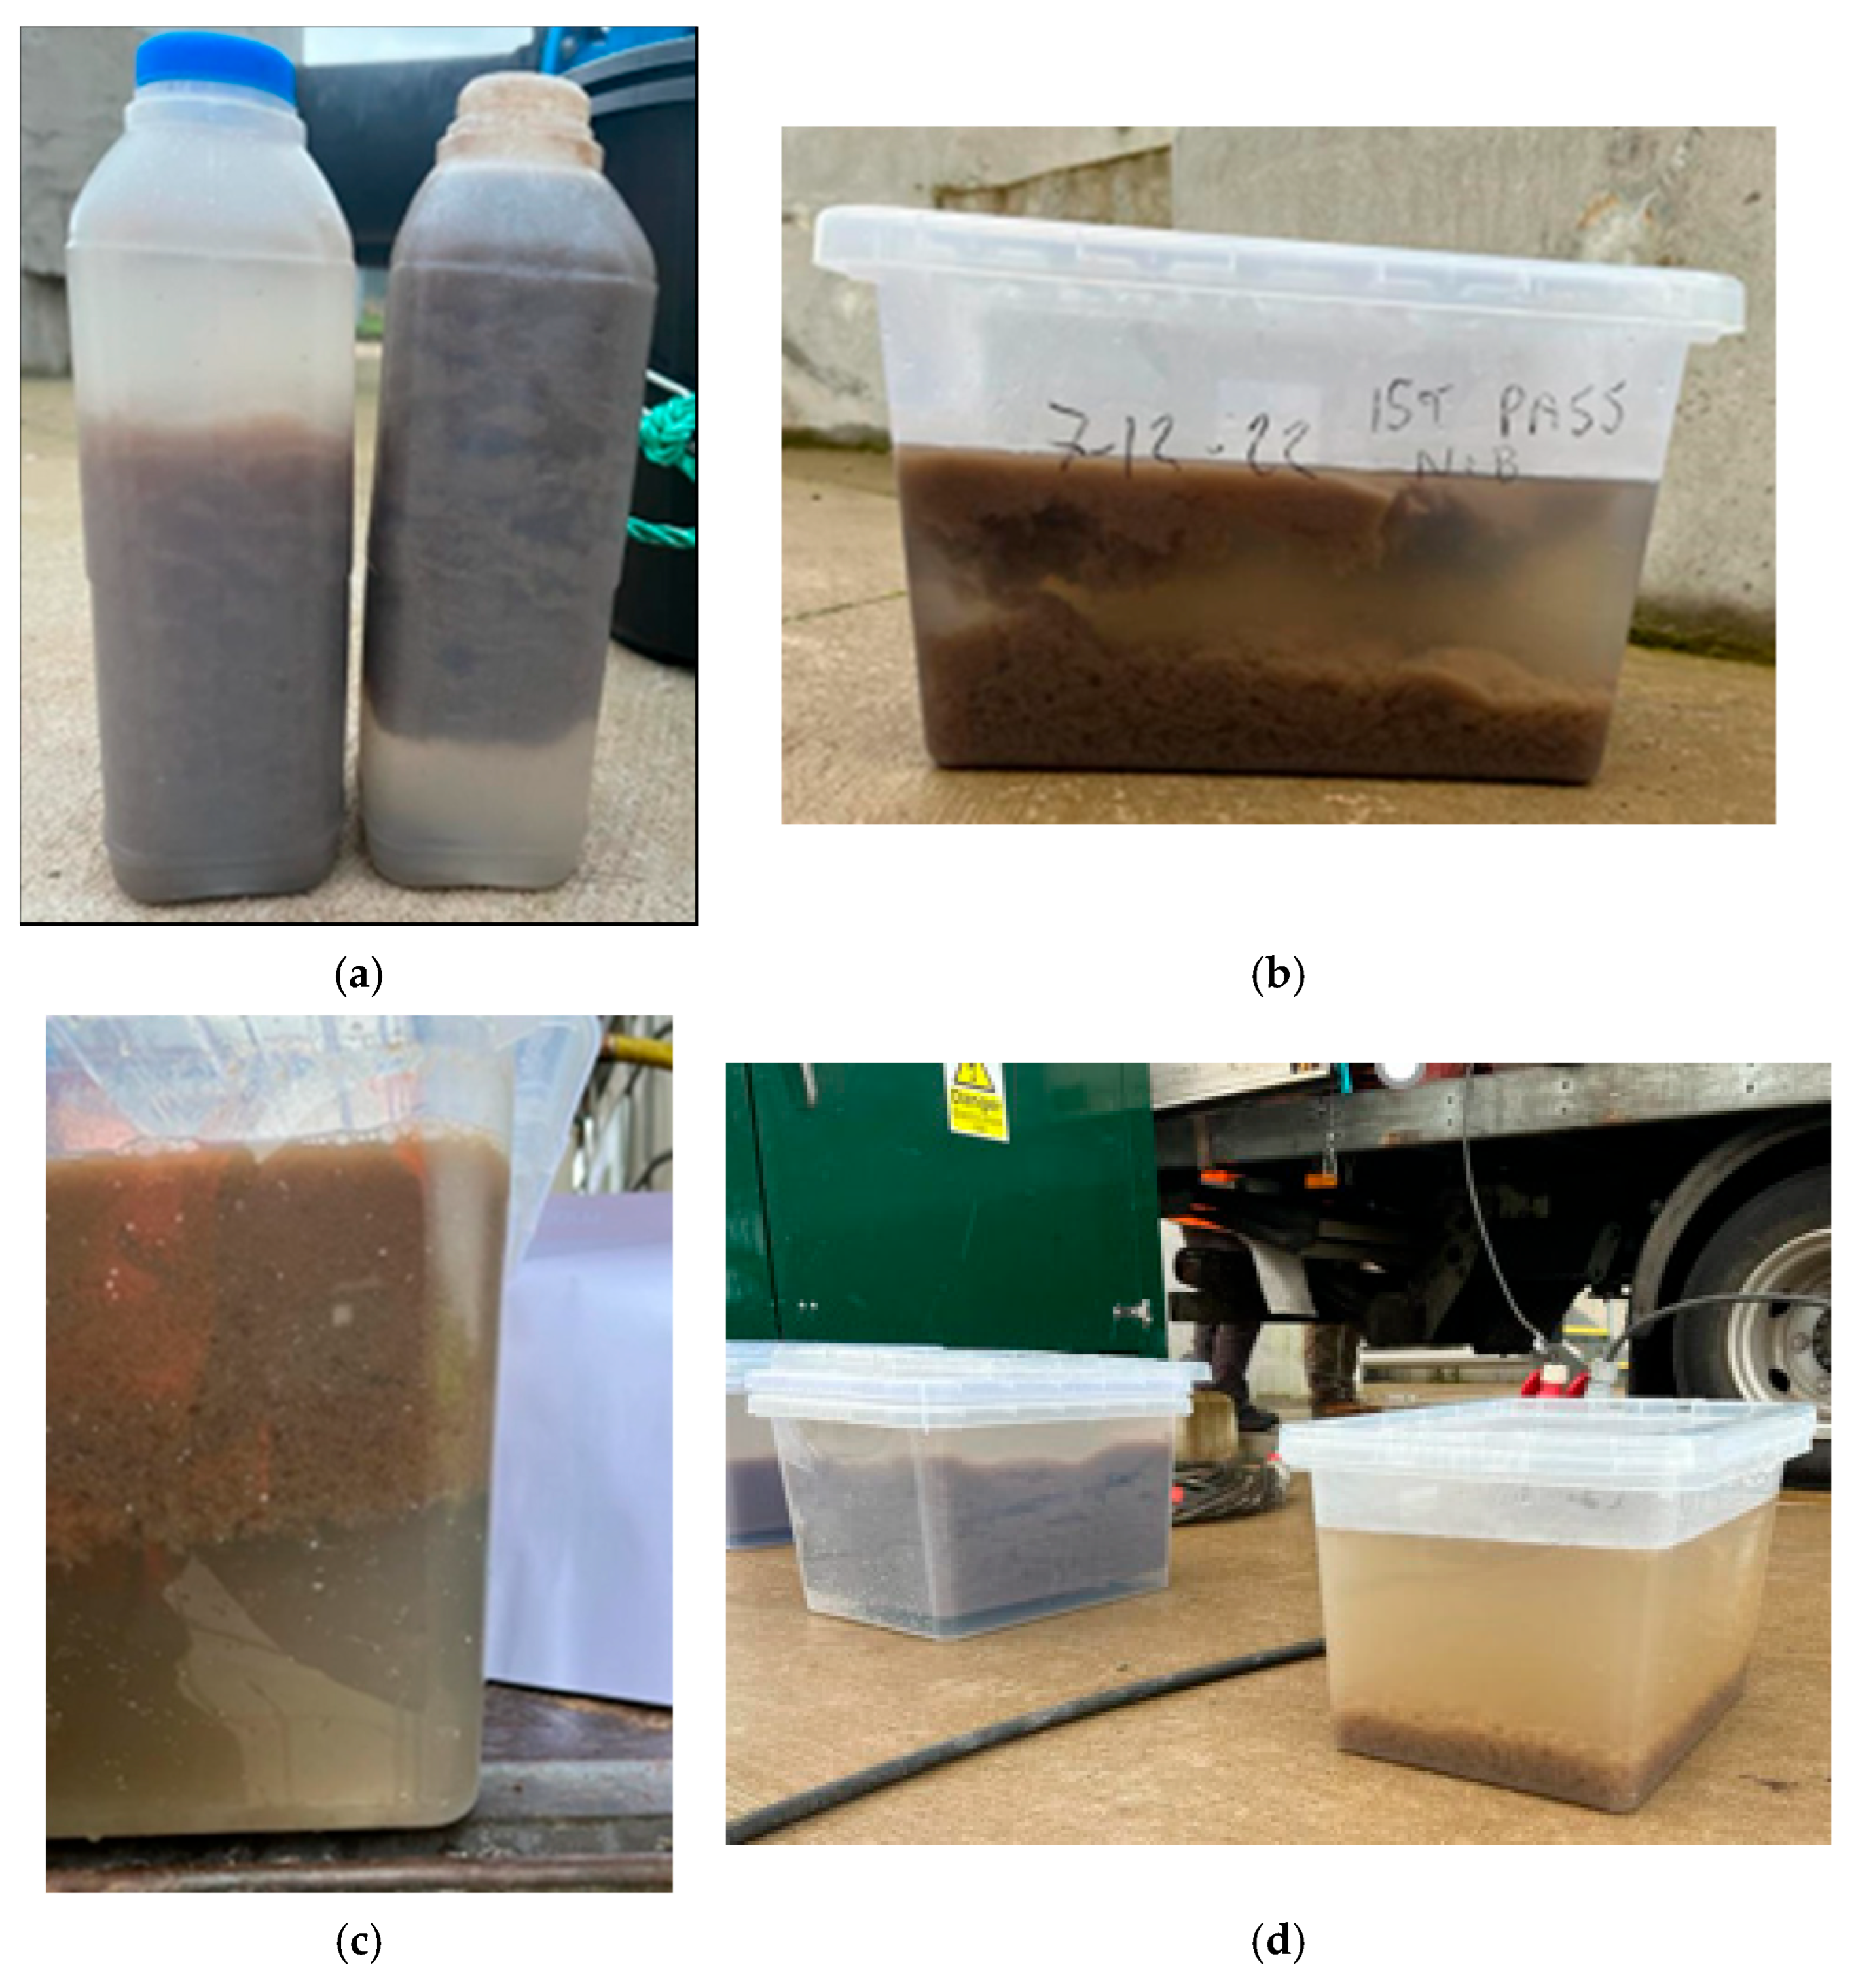
The settlement dynamics were slowed slightly initially upon contact with virgin NBs, although the overall time was not particularly affected, owing to faster settlement once the recruitment of micro-particulates took place around the NBs—actually making density-filtering ultimately more facile. Rising and settling are shown in
Figure 4.
The reason why there was some initial rise upwards is a result of the same principle behind nano-aeration enhancing Dissolved Air Flotation (DAF)—at least initially. This is a vivid illustration of carrier agency: there is a time lag whilst nano- and macro-particulates are attracted to the electrostatically attractive and naked surfaces of virgin, newly nucleated/created nanobubbles. This is simply a result of molecular diffusion and rearrangement forming an entourage or micron-sized colony—which is now subject to buoyancy forces and either rises or settles according to its aggregate density compared to the surrounding water. After this time has elapsed, settlement was then observed to occur quite rapidly, and there was no particular difference in settlement timescales. Still, this shows the potential for judiciously timed DAF operations, which is of interest to many WWTP operators.
Some water analysis is useful here, in the guise of an analysis on the Stirred Specific Volume Index (SSVI): this is related to an increase in the time taken prior to settling with incremental increases after each successive pass of NB generation—as shown in
Table 1.
It can be seen that there is a slight increase in sludge volume after the generation of virgin NBs, although it is not clear whether further settlement densification might take place given more time. There was little difference vis-à-vis the initial composition for more passes. Taken together, these results show that the increasing NB population resulting from the second and third passes for non-virgin NBs leads to slightly slower settlement, although there is a final acceleration in the latter stages of apparently more ordered settlement.
Aside from the more qualitative flotation analysis of
Figure 4, considering the flotation kinetics of conventional aeration spargers vis-à-vis NB-treated water from the system in
Figure 1, we measured mass removal times (via skimming) over an hour from 2.5 g/L of added 0.1 mm PETG beads to 10 L sampled from municipal water passed through the generator, as well as those exposed to a conventional Xylem Sanitaire Silver II fine-bubble sparger–aerator as a control, using 1 min of running in both cases (cf.
Figure 5). It can be seen that, after an initial relaxation time of around 3–4 min, the kinetics of NB-enhanced removal is of the order of 40% greater vis-à-vis fine-bubble approaches to DAF.
By way of further NB-based explanations, and commenting more broadly, if anything, these overall DAF observations in
Figure 4 and
Table 1, albeit preliminary, may well have positive implications for a reduction in Total Suspended Solids (TSS) and the densification of solids. If so, as seemingly suggested, this will enhance solid removal processing a great deal. Although various disparate fine- and nanobubble providers make such general settlement-related claims, their usage of energy-inefficient and biofouling membranes as the bubble generation approach, together with resultant thin-skinned bubbles, renders these less suitable: the bulk-like density of these bubbles and faster Stokes’ Law rising speeds makes them shorter-lived and less able to sustain enhanced oxygenation and settlement properties.
3.3. Nitrate, Nitrite, and Ammonia
There were good conversions to nitrate from, inter alia, nitrite—owing to reactive oxygen species (ROS)—cf.
Table 2. The values of initial samples are also compared to those for the passage without the generation of NBs, i.e., with the electric field action disabled—it is clear that neither of these control cases is equivalent to the case of NB generation. Over multiple passes, nitrite levels fell from 0.53 mg/L (N) to 0.09–0.1 mg/L (N) after the second pass. The ammonia level was already quite low in the initial sample at 16 mg/L (N) incoming into the AS lanes, and this was unchanged after one pass but dropped to 14 and 12 mg/L (N) after the second and third passes, respectively. Similarly, and very encouragingly, conversion to nitrate improved from the first to second/third pass.
For single-pass pure-oxygen usage, the nitrite conversion to nitrate is rather spectacular (albeit with other nitrogen sources also playing a part—catalysed especially by pure oxygen), whilst ammonia oxidation (despite influent levels not being problematic) is also notable—all of which are seen in the substantial increase in total oxidised nitrogen. BOD and COD reduction is also meaningful and important, and this study recommends leveraging this reduction if possible.
As can be seen in
Table 2, there were improvements in ammonia, nitrate, nitrite, BOD, and COD, and the percentage change data is instructive—with pure oxygenation being very useful, when available.
Commenting on NB-based explanations for these observed phenomena, the decline in nitrite levels from 0.53 mg/L (N) to 0.09–0.1 mg/L (N) after the second pass suggests a reorganisation of the NBs from the virgin state to a revised population in terms of ROS activity for oxidation chemistry (i.e., in going to the second pass instead for the first instance of non-virgin nanobubbles). The decrease in the ammonia level from 16 mg/L (N) incoming into the AS lanes to 14 and 12 mg/L (N) after the second and third passes, respectively, is also consistent with the reorganisation of non-virgin NBs (and the associated boost in ROS populations from that process). Similarly, the conversion to nitrate improved in going from the first to second/third pass—pointing to rises in ROS activity via the reorganisation of non-virgin NBs. Effectively, passage through the generator on subsequent passes helps to break up some of the corona/cloaks enveloping the NBs (cf. flotation/settlement dynamics in
Figure 4 and
Figure 5), which leads them to boost the ROS population and the accompanying oxidative activity. This is seen explicitly in the level of oxidised N increasing from 2.5 to 4.4 mg/L (or 0.9 to 3.7 mg/L) over three passes, with the major step change upon the second pass (i.e., the first occasion that non-virgin NB colonies and their electrostatically adsorbed colonies are disrupted); in parallel, there is a slight drop in the total N population from 24 to 22 mg/L (or 17.4 to 14.1 mg/L).
The largest improvements were seen in BOD, COD, and the nitrite-to-nitrate conversion upon the primary aeration on the first pass in the very creation of virgin nanobubbles in the first instance. However, the more subtle effects of reactive oxygen species (ROS) tend to be apparent with the subsequent passes in terms of the oxidation of ammonia in dealing with non-virgin NBs.
3.6. Development of Laboratory-Based Neural Network Models
Having observed positive aeration and DAF phenomena in a WWTP context, unambiguous positive effects in influent water processing, and subsequent AS-based phenomena of prolonged aeration for lower aerator energy (of the order of 25%, albeit preliminary), another potential positive course of study involves considering how one may deploy neural networks (NNs) in an attempt to use easier-to-measure approaches to gauge the level of NB production per se (as opposed to just the headline level of traditionally dissolved oxygen, which might potentially be misleading [
24]). This is important, given the level of ROS and electrostatic activity shift imparted by the generation of electric-field-generated nanobubbles [
24,
26,
27], in terms of a signature of nanobubble activity on the nanobubbly water; indeed, NN models may facilitate the advent of Model-Based Control (MBC) and the boosting of NB-enhanced WWTP operational performance with overall aeration energy minimisation. Of course, this requires the development of from-scratch NN models for NB generation estimation. AquaB granted trial access to its commercial machine learning model software for NB generation performance to allow select results to be reported on, albeit without details of parameters and functional forms.
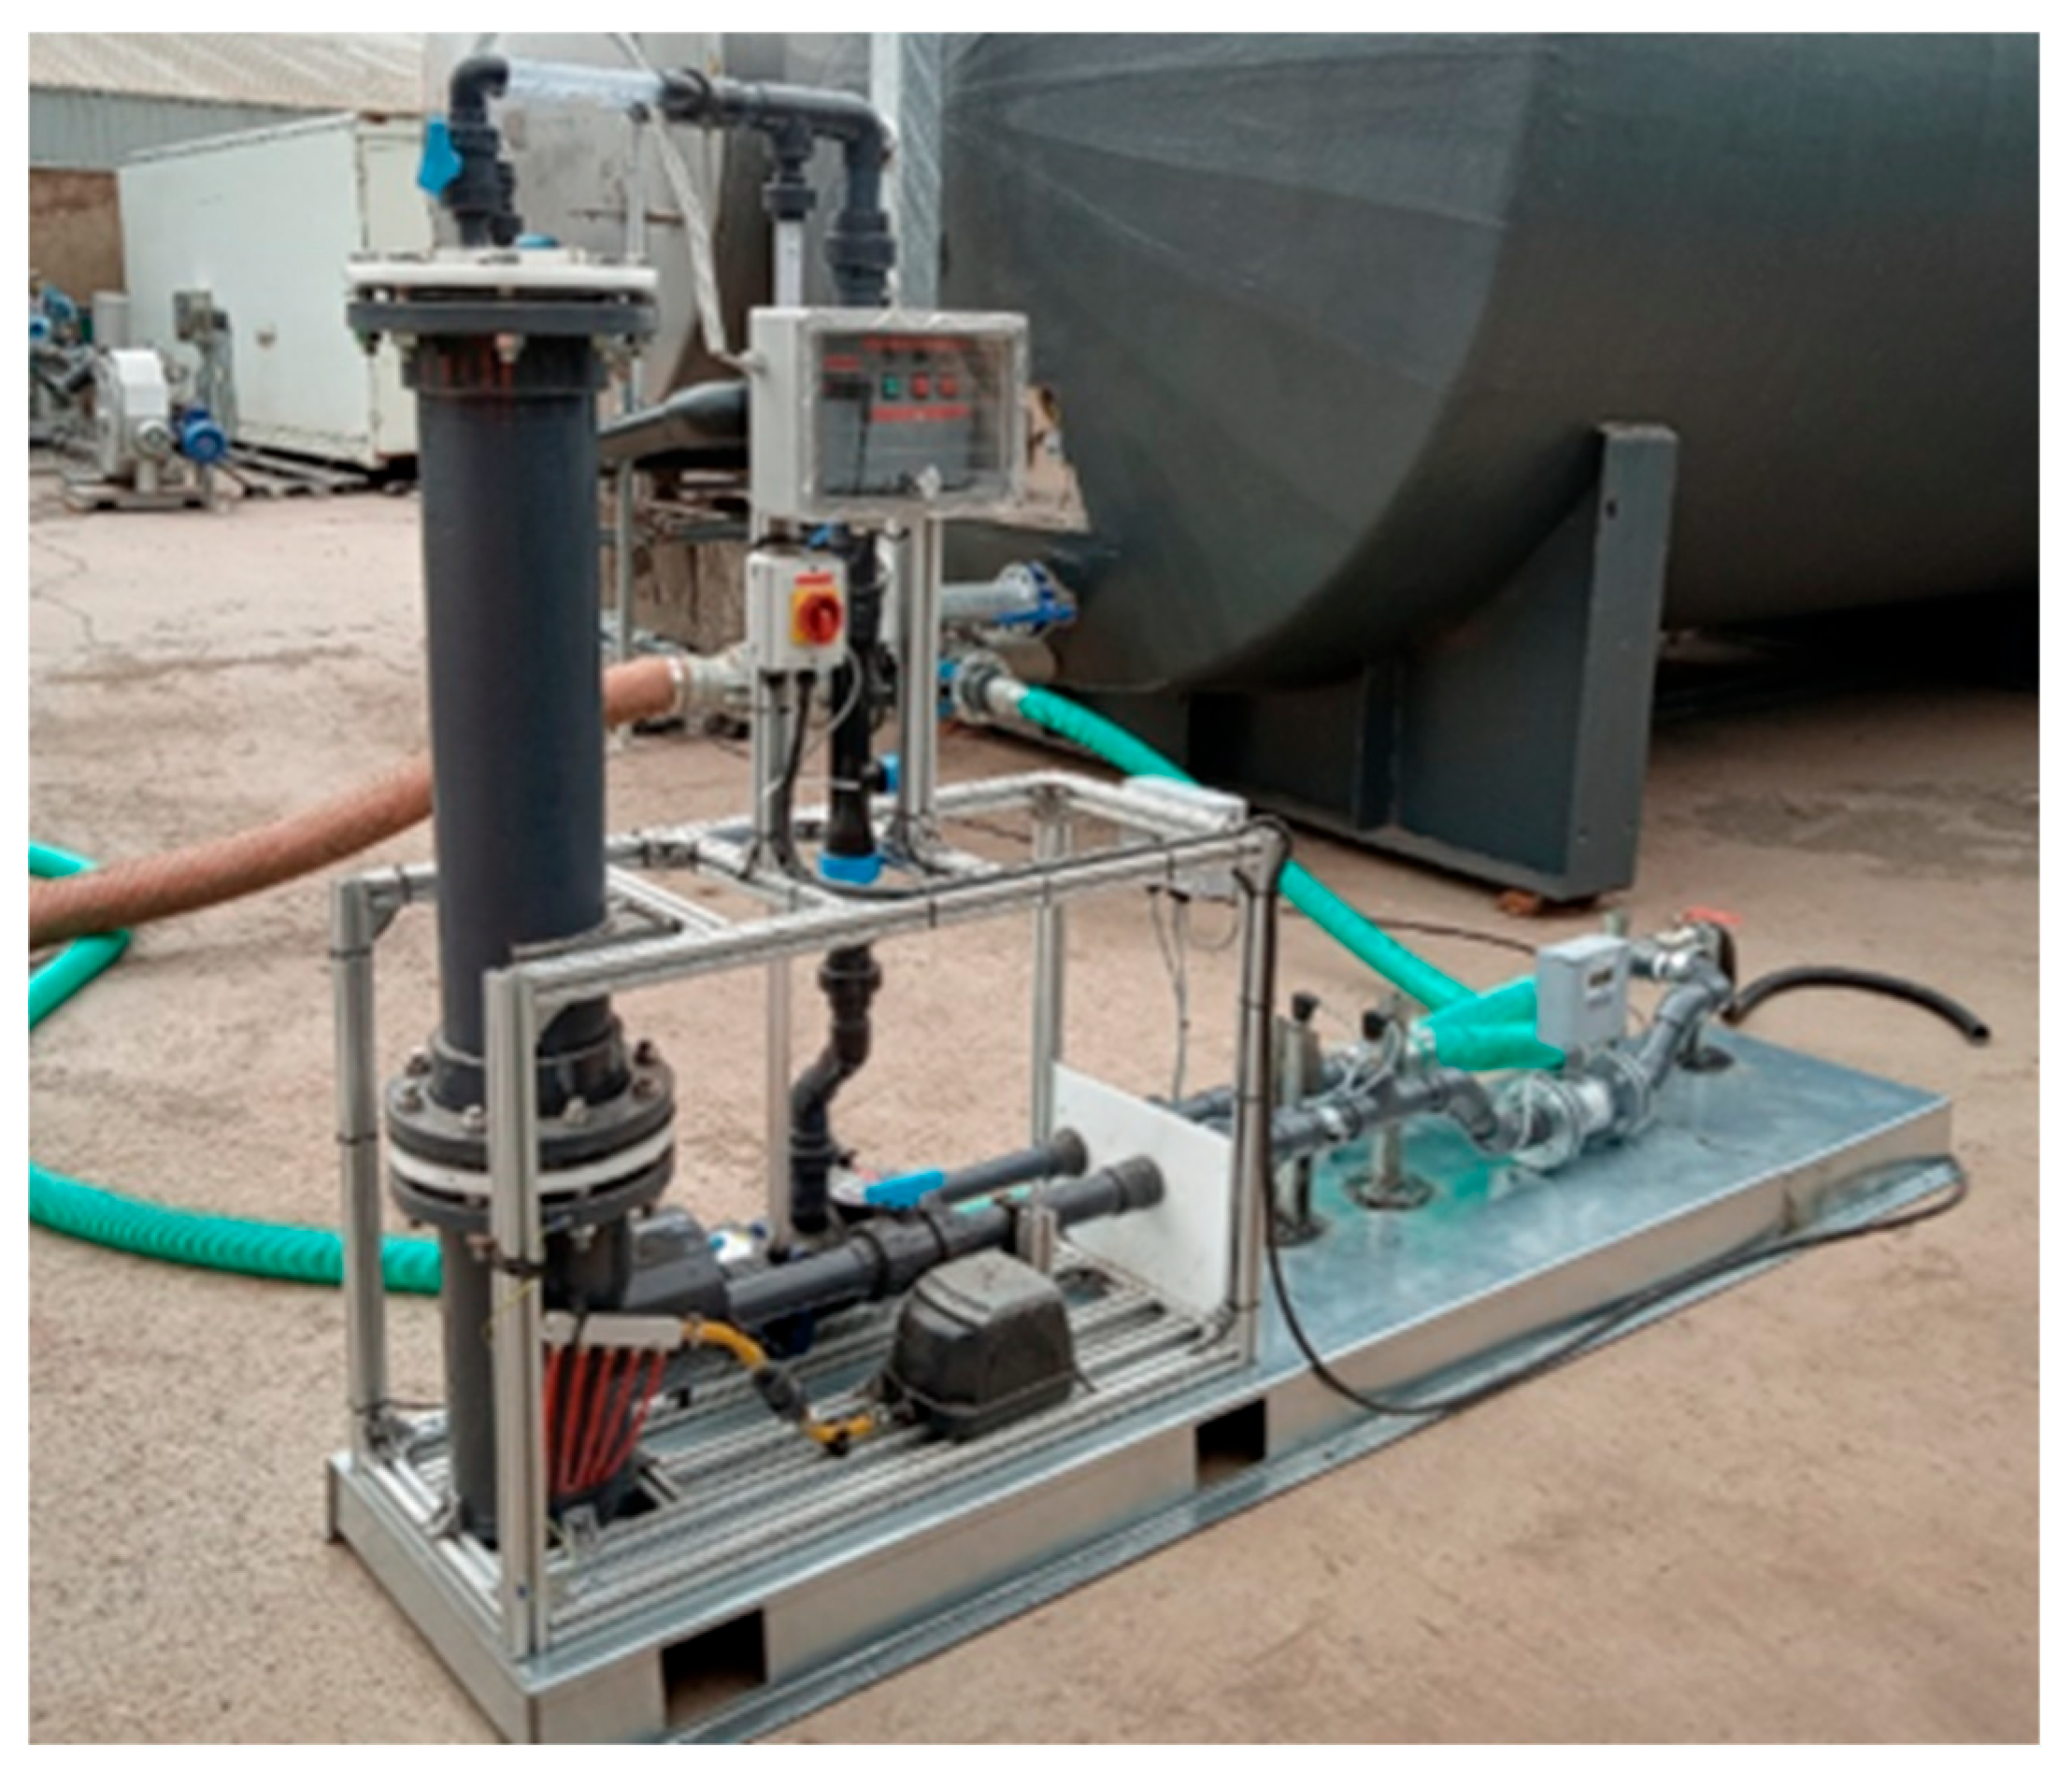
This NN model development starting point was used for deionised (DI) water and suitably filtered municipal water and for making connections (i.e., developing correlative models with) to the NB population (as the dependent variable) as measured by multi-angle DLS methods in the Malvern NTA Pro—which tends to show more consistent results than the Zetasizer Pro, given that the image analysis approach tends to be more consistent than a back-transform of the raw scattering light intensity signal, especially when taken in auto-correlation form [
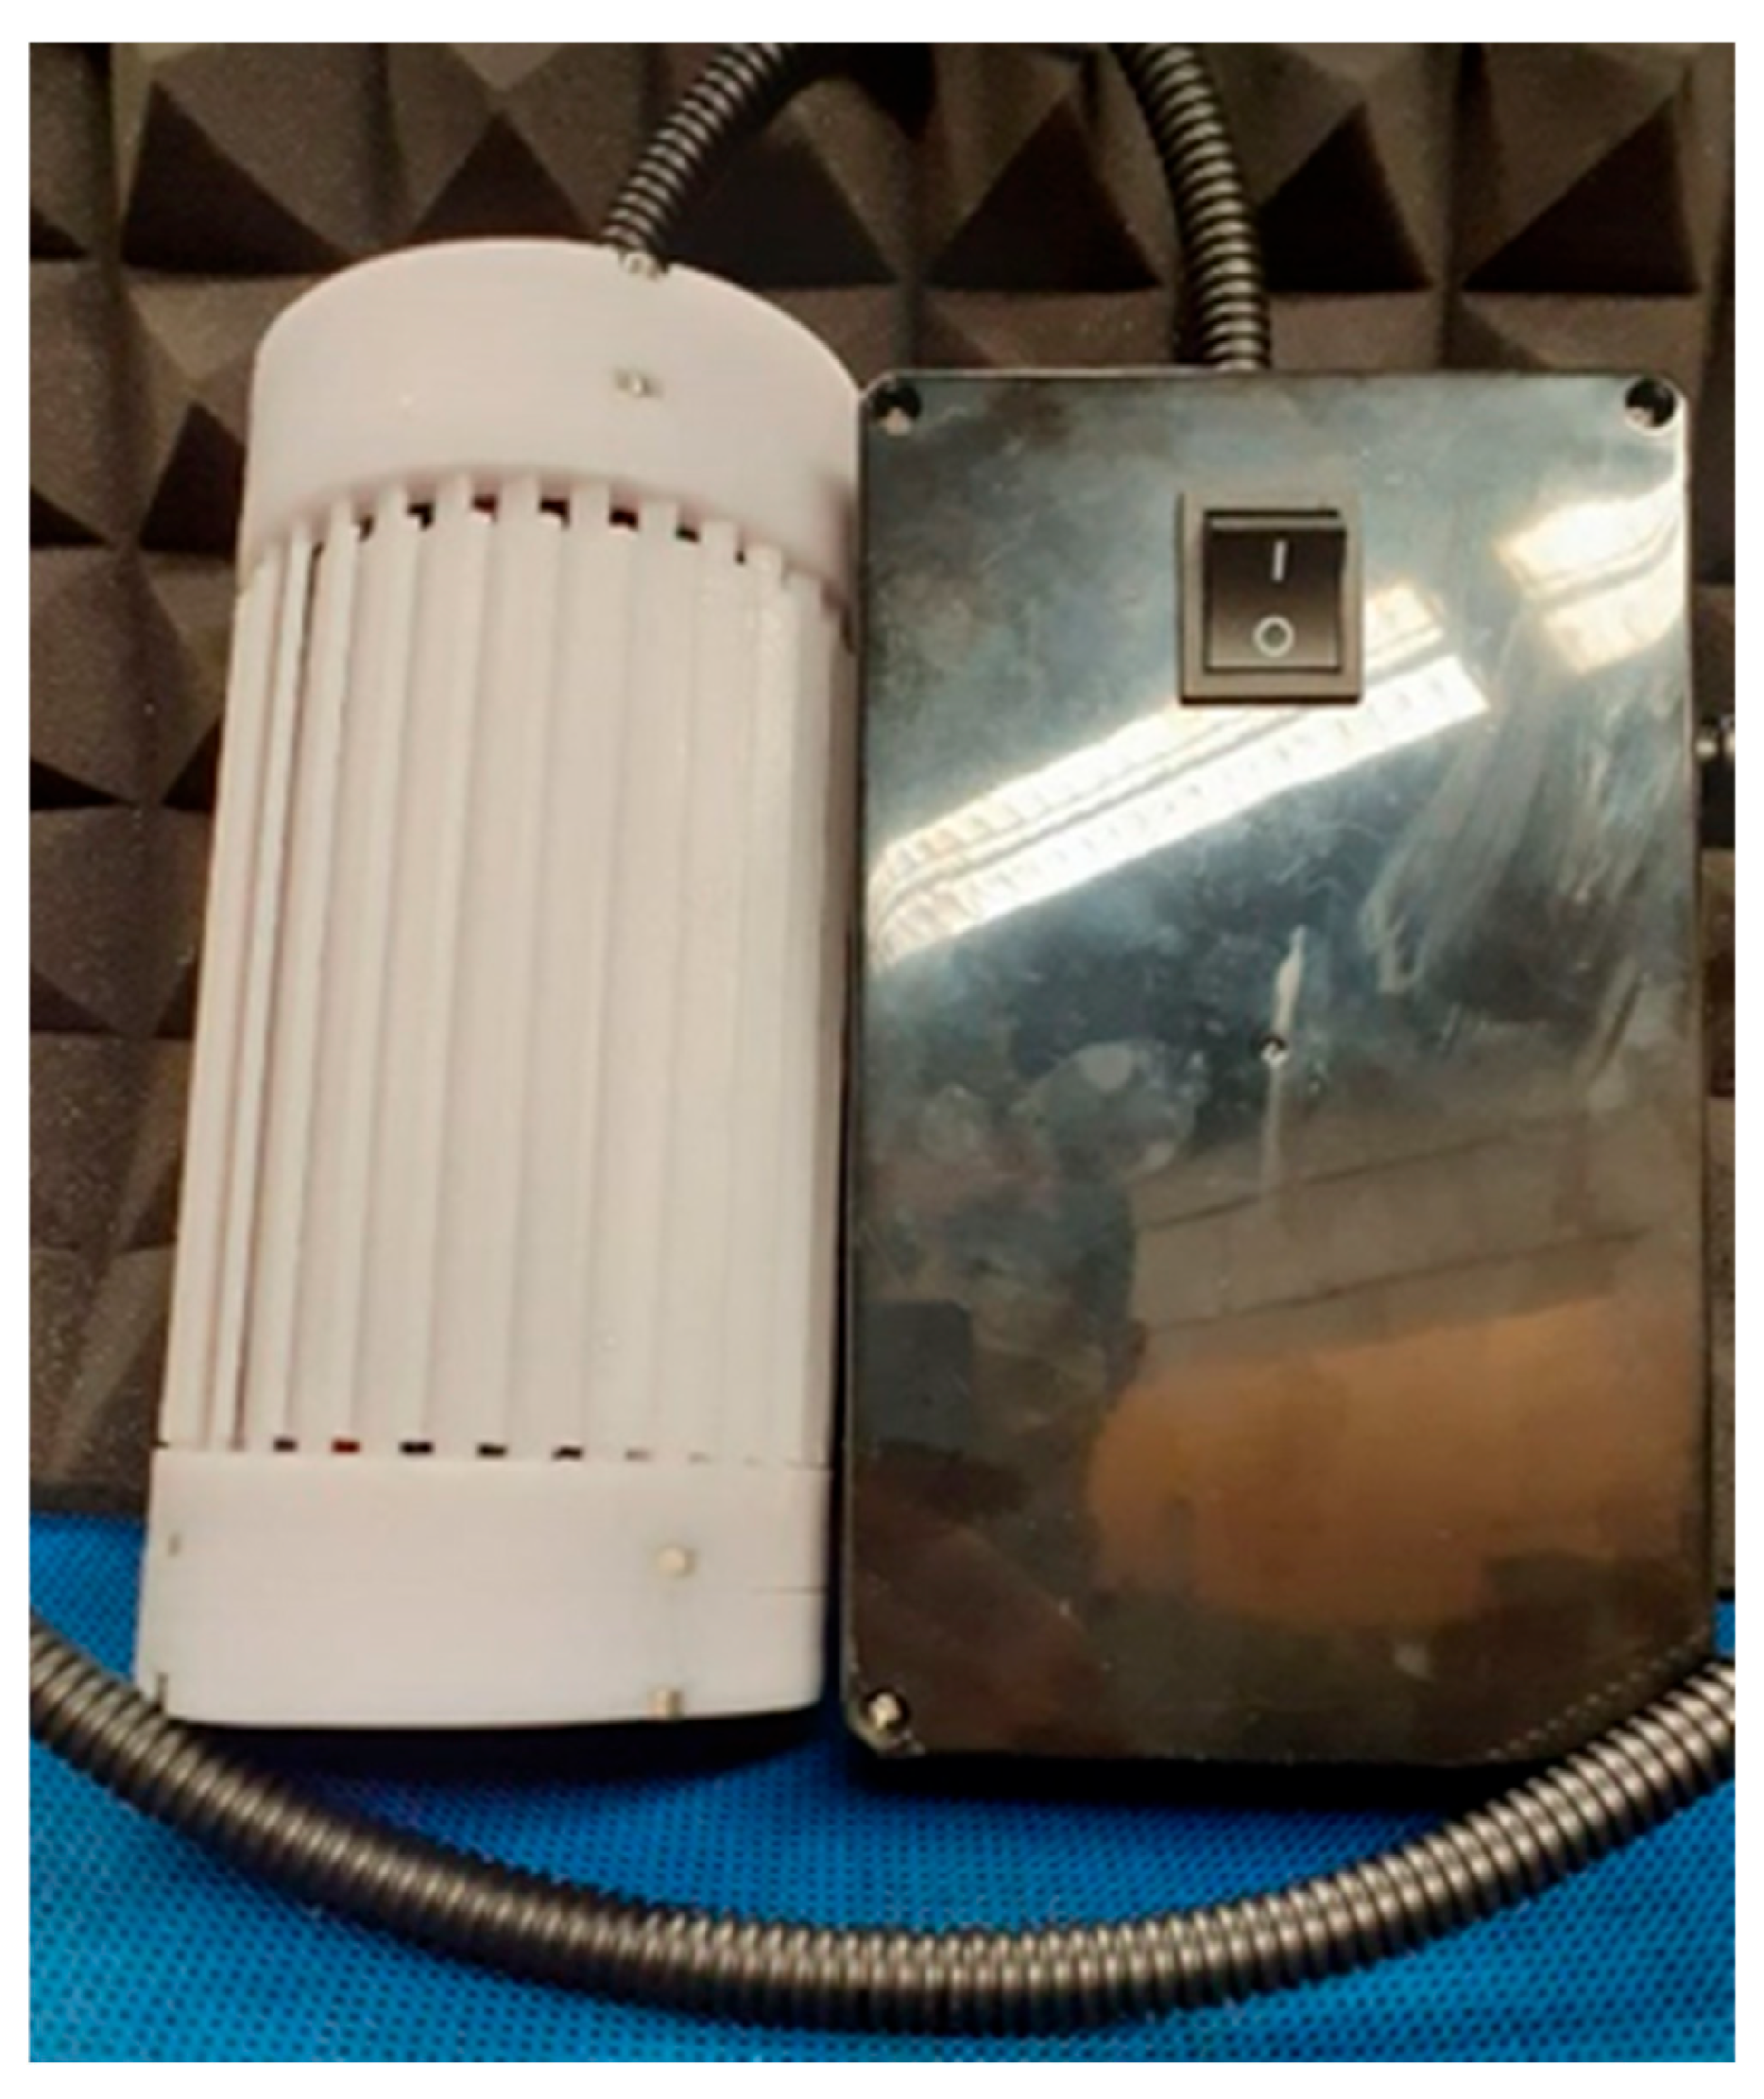
24]. For this purpose, a smaller-scale AquaB submersible NB generator suited for the laboratory is used—as shown in
Figure 6—as well as an AquaB pipe flow model [
24].
In terms of the municipal water source, a water reverse osmosis filter with three stages made by AquaClear Ltd. was applied to tap water in the Dublin area, and filtering was performed until the derived count rate in a Malvern Zetasizer Pro (made by Malvern Panalytical) was just under the 100 k.c.p.s. threshold to minimise the number of impurities that scatter light. For reproducibility and to enable the detection of acceptable levels of statistical error, this is crucial. It was discovered that background water samples did not contain any NBs when they were not run through water-flow-based NB generators or combined with submersible units.
In the case of the flow units, a Malvern Nanosight Pro was also used for comparison purposes in order to use the NTA particle/bubble-tracking approach as an arguably more consistent bubble-counting/detection metric than Zetasizer Pro multi-angle DLS (MA-DLS). The lower concentration detection limits for both types of Malvern instruments were on the order of around 106 NBs per mL for the relatively clean, filtered tap water (to slightly below a practical and feasible 100 k.c.p.s. threshold—a light scattering quality threshold).
The NBGs were then operated with both water sources at a range of temperatures from 2 to 40 °C in an effort to clarify several plausible dependent variables, including the water source and the level of flow turbulence (as per Reynolds number) for pipe flow, on the DLS-derived NB population (as the dependent variable), with DO and ORP as secondary dependent variables when using air as the NB generating fluid. A list of potential independent variables was identified—in the sense that they might subsequently show some level of inter-correlation—which must be explored; see
Table 3.
In each case—batch (submersible) and continuous flow (pipe model)—a two-level factorial design was set up, using a 27−4III-factorial design on a full-foldover alias structure symmetry—meaning that anything greater than the main effects interacting with two-way interactions can be eliminated (i.e., resolution III)—and main effects were disentangled from two-way interactions to gain a less ambiguous picture of their true underlying importance. This was performed in an effort to gauge the most important variables affecting the NB population (and, later, DO and ORP shift, which are partly correlated with the NB population as alternative field-measurable independent variables—i.e., as context-dependent, partially reliable proxies for the NB population—to be used and interpreted with care). Inter-collinearity correlation analysis was performed for these respective variables to assess information overlap, and it was found that the level of inter-correlation was relatively low—somewhat by design in independent variable selection (thus eliminating the need for, e.g., Principal Component Analysis—which simplifies matters).
The following main effects and two-way interactions were found from the 27−4III-factorial/foldover analysis, and the two symbolic expressions below show what essentially independent variables map onto the two NB population (dependent) variables, i.e., those that are causally linked (statistically):
Batch (NB pop.) ← Voltage, volume, air rate, temp., water source, temp. x voltage.
Pipe flow (NB pop.) ← Voltage, water flowrate, air rate, temp., water source, temp. x voltage, water flowrate x voltage.
All of these passed ANOVA and Fisher F-statistic statistical significance tests at the 95% level of certainty. The training and test sets of the data were chosen at random from the full accumulated data-set at approximately a ratio of 85:15% of the data quantity.
Multiple-variable (least-squares) linear regression models were then constructed for these models, and the level of r2 performance was good at about 91 and 93% for the batch and pipe flow models, respectively, in terms of predictive performance outside of the training data (and also still significant in both cases with respect to the χ2-testing procedure for the requisite number of the degrees of freedom of the main effects and two-factor interactions).
Prior to discussing equivalent neural network fits for these models, we can consider the linear regression model fits to the DO and ORP shift analogues (arising from formal 2
7−4III-factorial/foldover analysis). It was found that DO was less correlated to the NB population—unsurprisingly, as DO probes (e.g., optical, load resistance, etc.) do not measure the presence of NBs directly. Rather, it is titration methods that tend to more completely measure at least a good portion of the NB population. We found that the ORP shift is a more accurate and correlated proxy variable to be used for the NB population [
24,
26,
27], as it captures, relatively directly, the oxidative effect of the created NB population by the electric field approach (in terms of, e.g., electro-generated reactive oxygen species). Therefore, we also constructed equivalent statistically significant regression models for the ORP shift:
Batch (ORP shift) ← Voltage, volume, air rate, temp., temp. x voltage.
Pipe flow (ORP shift) ← Voltage, water flowrate, air rate, temp., temp. x voltage.
As we can see, the ORP shift tends to be a more robust, if imperfect, field measure of the presence of NBs and their population, as it is—crucially—less sensitive to the water source—to the point of being almost agnostic. The techno-commercial implications of this are hugely positive for field deployment and monitoring-and-control systems, in that DLS measurement is a highly technically specialised art/métier, requiring expensive and long-lead-time equipment and highly experienced laboratory personnel in time lag measurements, which work the best with clean water sources (highly filtered tap water or DI water being the best) to avoid meso- and microscopic particulates and dirt corrupting the raw laser scattering intensity signal and undermining the sound detection of nanoscale features (e.g., nanobubbles). In terms of the ORP model’s predictive statistical quality, the test set’s r2 performance was strong at around 93 and 96% for the batch and pipe flow models, respectively, with parallel χ2-test metrics also showing strong statistically significant goodness-of-fit performance for the associated number of main-effects/two-way degrees of freedom. Bearing in mind the democratic price of a good-quality ORP probe, and that reasonable measurements can be taken in a matter of minutes, this is a pragmatic measurement approach to take for real-world unit operations (vide infra).
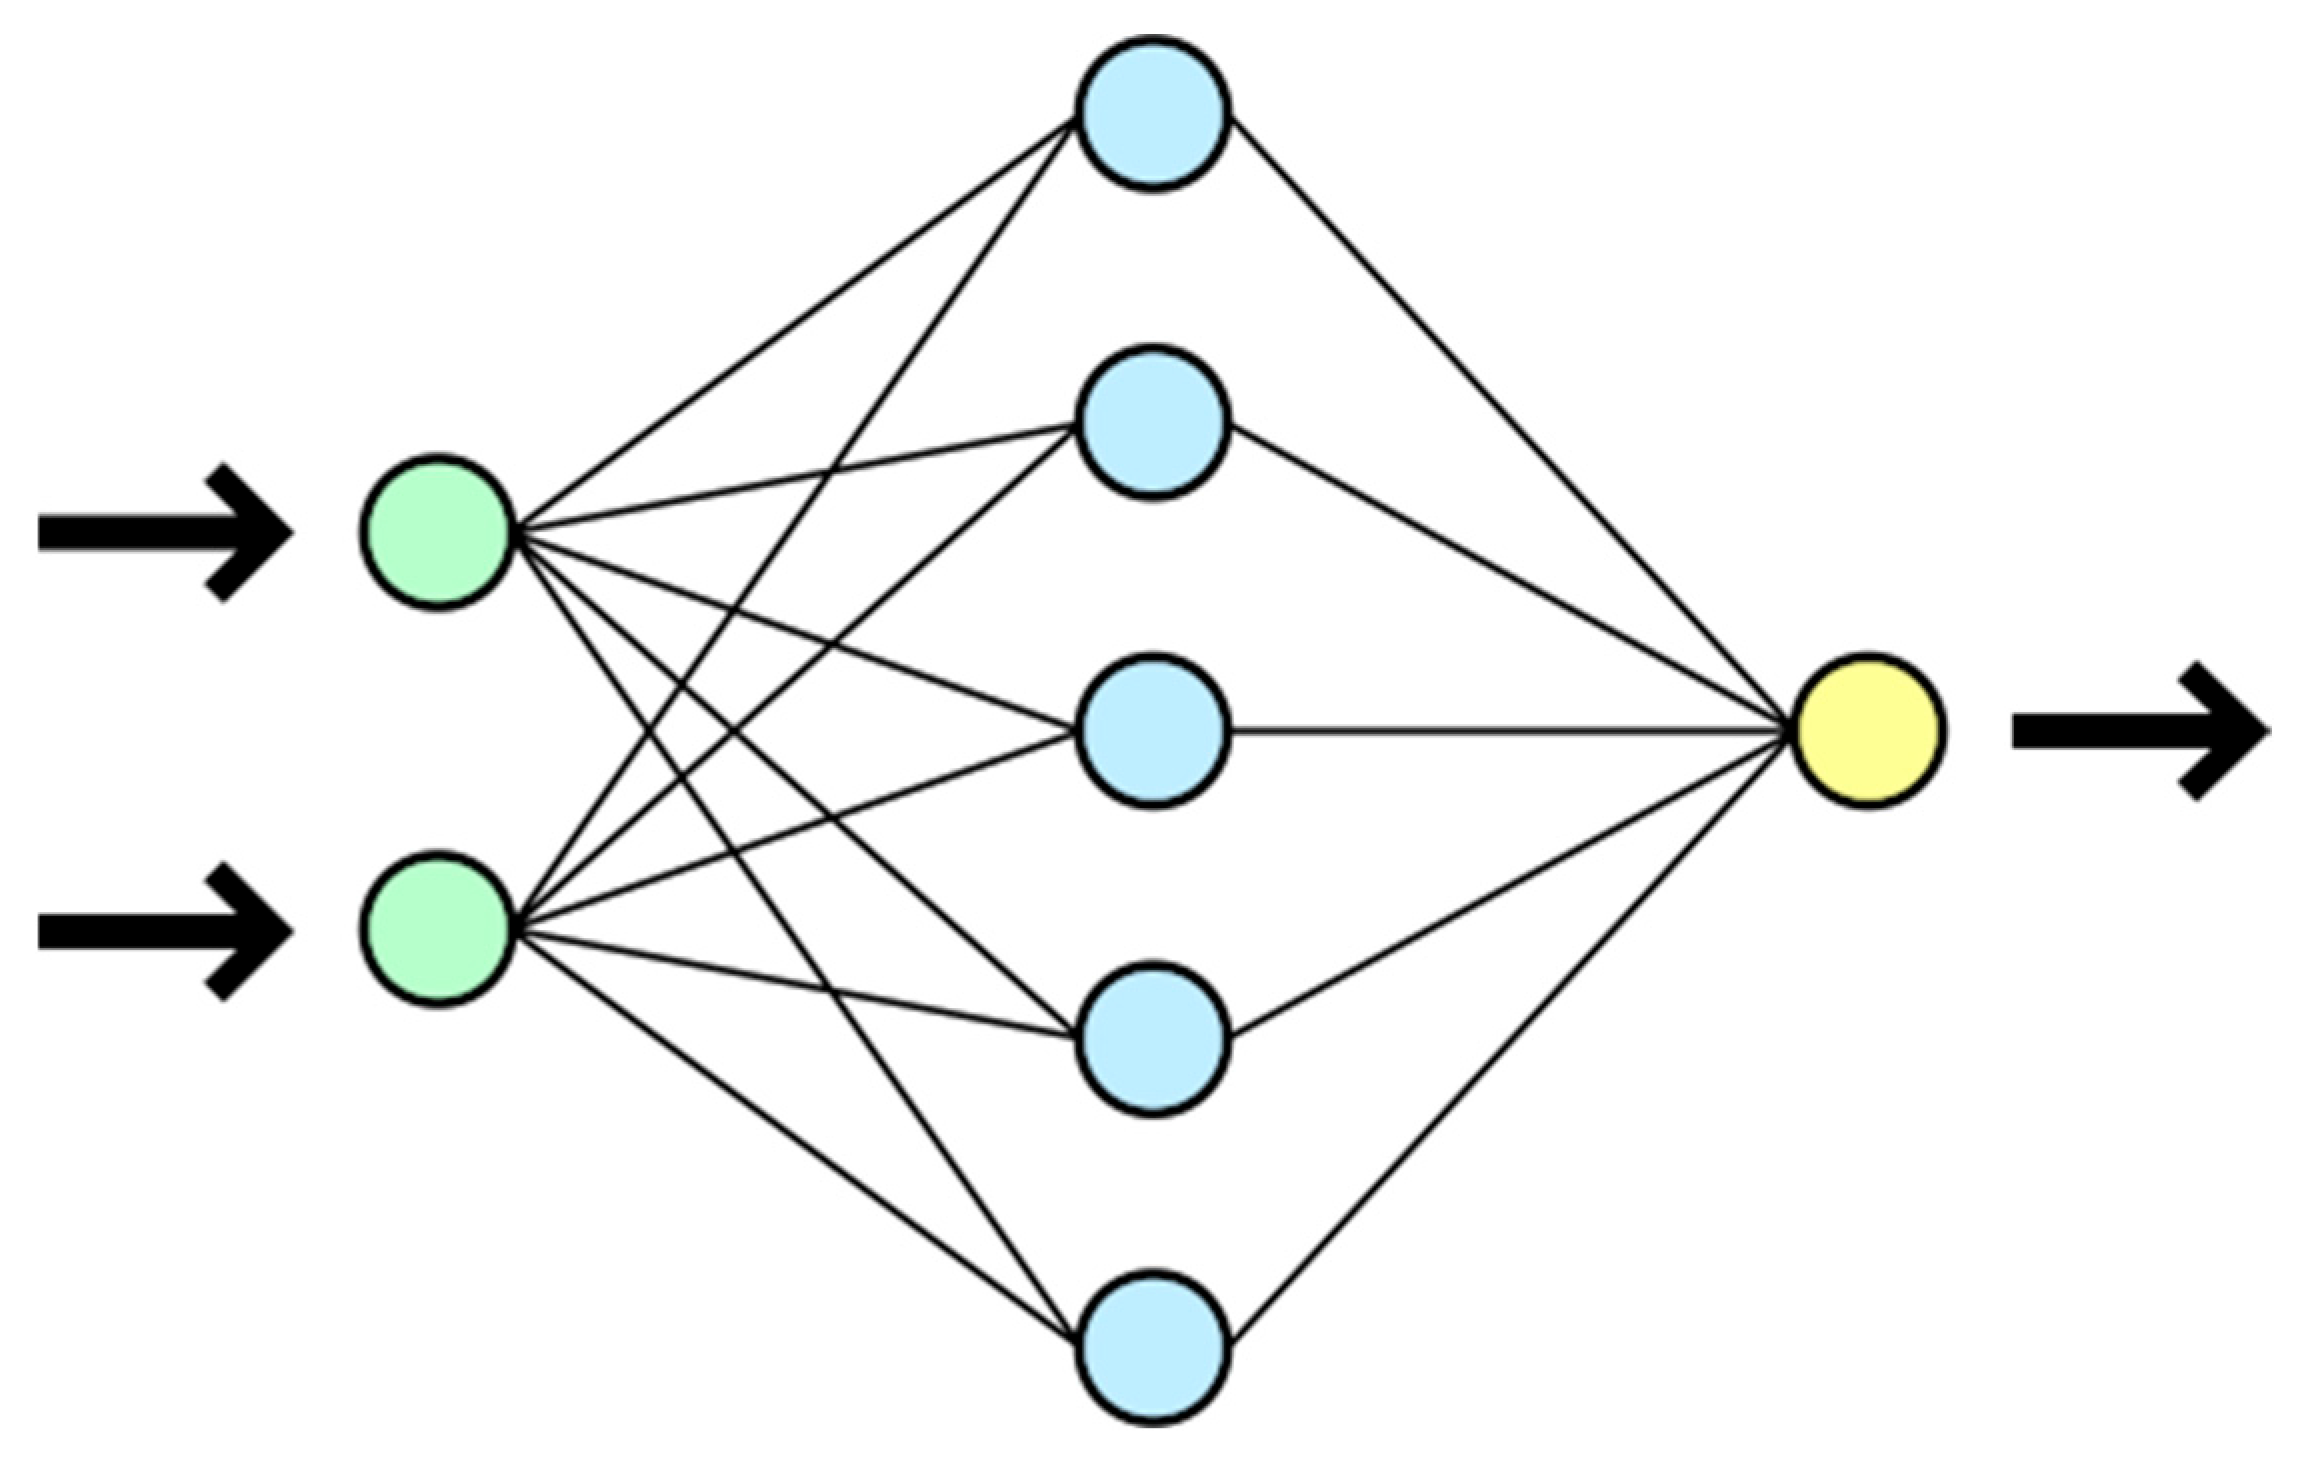
Having identified the appropriate independent variables using factorial/foldover approaches and eliminated inter-correlation problems, AI modelling was further used for the NB population and ORP shift metrics under both batch and flow modalities, in an attempt to improve performance over the by-now-trained multiple-variable linear regression models. Machine learning was then carried out by way of training neural networks for the above 2 × 2 sets of regression models, and a high-level overview of the neural network architecture is shown in
Figure 7. The form of the gradient descent approach was experimented with to minimise the square of the predictive deviations—favouring the back-propagation method. This allowed the weight functions to be adapted efficiently during the training process.
The training, validation, and test sets of the data were chosen at random from the full accumulated data suite at roughly a ratio of 70:20:10% of the data quantity. Using this approach, even better 2 × 2 model performance was obtained on the external test set compared to regression models, as shown in
Table 4.
Obviously, the prima facie correlative link (i.e., causal) established between the ORP shift and NB population is both essential and reassuring for the pragmatic and industrial use of the ORP shift as an accessible field measurement technique in either real-time or close-to-real-time approaches, in the real world, or in the wild, outside of the research lab in industrial nanobubble generators. This can aid in subsequent explorations.
3.7. Development of Field-Based Models
Having established the ORP shift as a robust metric highly (causally) correlated with the NB population, the goal of field testing for ML/NN model development is to gather as much all-year-round data as possible for outdoor operations—where seasonal variations can often be a factor—so that this can be taken into account in fit-for-purpose, outdoor-oriented field usage ORP shift models.
To this end, we applied NN fitting, as is evident in
Table 5, for the following modified set of easier-to-measure data (neglecting pH, as it was not found to be overly influential on the ORP shift or NB population for the laboratory investigations).
The 27−4III-factorial/foldover analysis led to the following field-rated NN models for the ORP shift (as a proxy for NB population and associated oxidative potency). The models are as follows:
Batch (ORP shift) ← Voltage, volume, air rate, temp., susp. solids, salinity, temp. x voltage, temp. x chlorophyll.
Pipe flow (ORP shift) ← Voltage, water flowrate, air rate, temp., susp. solids, salinity, temp. x voltage, temp. x salinity.
It can be seen that chlorophyll takes on a two-factor interaction importance in its relationship with temperature for water-body aeration, which is perhaps not particularly surprising, given the importance of chlorophyll in reservoirs and lakes (and, of course, its temperature sensitivity and, therefore, seasonality). Conversely, in turbulent-flow situations, where water is (by definition) much less stagnant (and chlorophyll levels are generally lower), there is a greater two-factor interaction between salinity and temperature.
Using the same training/validation/test split approach in the data partitioning as before, neural network r2 values of 88.2 and 89.6% performance are obtained for the submersible/batch and pipe/continuous flow cases, respectively (with χ2-testing showing goodness of fit for the degrees of freedom used in the factorial-determined models). This was typically 2–3% better than that of the corresponding linear regression models directly from 27−4III-factorial/foldover analysis. Although this is not quite as good as their laboratory ORP shift counterparts (either for linear regression or neural network approach), it must be kept in mind that the R&D laboratory is a much more highly controlled environment, where essentially complete control and mastery over the experiment itself and measurement procedures can be asserted at will.


