Article

Decoding Salinization Dynamics in Mediterranean Coastal Aquifers: A Case Study from a Wetland in Southern Italy

1
Water Research Institute, National Research Council (IRSA-CNR), 70132 Bari, Italy
2
Institute of Geosciences and Earth Resources, National Research Council (IGG-CNR), 56124 Pisa, Italy
3
Department of Earth Science, University of Pisa, 56126 Pisa, Italy
*
Author to whom correspondence should be addressed.
Environments 2025, 12(7), 227; https://doi.org/10.3390/environments12070227
Submission received: 30 May 2025 / Revised: 26 June 2025 / Accepted: 27 June 2025 / Published: 2 July 2025

Abstract

This study investigates the salinization processes affecting the coastal aquifer within the Torre Guaceto State Nature Reserve, a Mediterranean coastal area characterized by a unique ecological value of a brackish wetland threatened by water-intensive agricultural activities. Groundwater salinization threatens biodiversity, agriculture, and water resource sustainability. This work integrates hydrogeological monitoring, geochemical and isotopic analyses, and geophysical surveys to understand salinity dynamics and identify key drivers, such as seawater intrusion, irrigation practices, and climate change. Data collected during monitoring campaigns from 2022 to 2024 reveal significant seasonal and spatial variations in groundwater salinity influenced by natural and human-induced factors. The results indicate that salt recycling from irrigation and marine spray deposition are important local contributors to groundwater salinity, in addition to seawater intrusion. These findings highlight the urgent need for integrated groundwater management approaches considering the combined effects of agricultural practices, irrigation water quality, and climate variability tailored to Mediterranean coastal ecosystems.

1. Introduction

Coastal aquifers are vital groundwater resources that sustain human populations and ecosystems in some of the world’s most densely populated and economically significant regions. Positioned at the interface between terrestrial and marine environments, these aquifers exhibit a delicate balance where freshwater and saltwater interact dynamically [1]. Their importance extends beyond providing water for agriculture, industry, and domestic use, as they support crucial ecosystems like wetlands, estuaries, and coastal lagoons. These environments are biodiversity hotspots and deliver essential ecological services [2,3,4]. Despite their importance, coastal aquifers are among the most threatened hydrological systems globally. Groundwater salinization has emerged as a critical concern, jeopardizing the sustainability of these aquifers and the communities and ecosystems that depend on them, as well as reflecting the complex interplay between natural and anthropogenic processes [5,6,7]. This phenomenon occurs due to processes like seawater intrusion, the dissolution of geogenic salts, and agricultural practices such as irrigation with saline water. The resulting impacts include degraded water quality, reduced soil productivity, and economic losses, particularly in agriculture [8]. Seawater intrusion is recognized as the primary driver of salinization in coastal aquifers. Excessive groundwater extraction disrupts the natural hydraulic equilibrium, allowing seawater to encroach into freshwater aquifers. The severity of this process depends on factors such as aquifer geometry, extraction rates, local hydrological conditions, and climate anomalies [9]. Beyond seawater intrusion, agricultural activities further exacerbate the issue of salinization. Over-irrigation with saline water and the excessive use of fertilizers lead to salt accumulation in soils. These salts percolate into underlying aquifers during recharge events, especially in semi-arid regions. Additionally, atmospheric deposition of marine aerosols contributes to salinization, particularly in coastal zones. The threat to coastal aquifers is amplified by global change. Rising sea levels, one of the most evident consequences of global warming, intensify the risk of seawater intrusion, especially in low-lying coastal areas [4]. Moreover, changes in precipitation patterns, prolonged droughts, and elevated evapotranspiration rates further strain these aquifers by reducing freshwater recharge and concentrating salts [10]. These climate-induced shifts pose complex challenges for water resource management, particularly in regions grappling with water scarcity [5]. The consequences of salinization extend to the health of coastal ecosystems. Wetlands, often hydraulically connected to coastal aquifers, rely on freshwater discharge to maintain their ecological state. The saltwater intrusion into these systems disrupts vegetation patterns, reduces habitat quality, and alters nutrient cycling, jeopardizing biodiversity and ecosystem resilience [1,2,3]. These changes compound existing pressures on coastal ecosystems, including habitat loss, pollution, and land-use changes. Addressing the salinization of coastal aquifers requires a multifaceted approach, combining scientific research, technological innovation, and policy interventions. Scientifically, a comprehensive understanding of salinization processes is crucial for crafting effective management strategies. This necessitates the integration of disciplines such as hydrogeology, geochemistry, geophysics, and climate science [11,12]. Policy measures such as regulating groundwater extraction, promoting sustainable irrigation, and encouraging the reuse of treated wastewater are equally critical for mitigating salinization and ensuring the sustainable use of groundwater resources. Despite advancements, numerous challenges persist in managing coastal aquifers effectively. Developing integrated approaches that balance competing water demands while considering the natural and anthropogenic drivers of salinization is essential. Adaptive management practices, guided by continuous monitoring and analysis, are particularly important for addressing the uncertainties posed by climate change and socioeconomic developments.
The Apulia region in southern Italy is a noteworthy example of a Mediterranean coastal area. Its extensive coastline and karstic geology make its aquifer systems vulnerable to seawater intrusion and overextraction. With limited surface water resources, Apulia has long relied on groundwater to meet agricultural, industrial, and domestic needs, placing significant strain on its aquifers [13,14]. Despite these challenges, Apulia has also been a hub for innovative water management strategies, including strengthening monitoring networks, promoting scientific studies, implementing sustainable practices, and drafting specific guidelines [15]. These efforts aim to provide a more comprehensive understanding of aquifer dynamics and enable better decision-making for mitigating groundwater quantitative and qualitative depletion.
This paper focuses on the Torre Guaceto State Nature Reserve along the Apulian Adriatic coast of southern Italy as a case study for exploring salinization dynamics in Mediterranean coastal aquifers. The reserve, encompassing a brackish wetland and adjacent agricultural lands, offers an ideal setting for examining the interplay of natural and human drivers of groundwater salinity. Over the past two decades, the reserve has faced growing challenges from seawater intrusion, agricultural practices, and climate change. It is a valuable case for studying salinization processes and testing potential management strategies. This study presents a comprehensive assessment of the salinization dynamics in the Torre Guaceto aquifer, integrating data from hydrogeological monitoring, geochemical and isotopic analyses, and geophysical surveys conducted between 2022 and 2024. By employing these methods, the study identifies the primary drivers of salinization, evaluates their impacts on water resources and ecosystems, and proposes actionable recommendations for sustainable management. The findings enhance the understanding of salinization in a Mediterranean coastal aquifer and offer insights applicable to similar contexts across the region.

2. Study Area

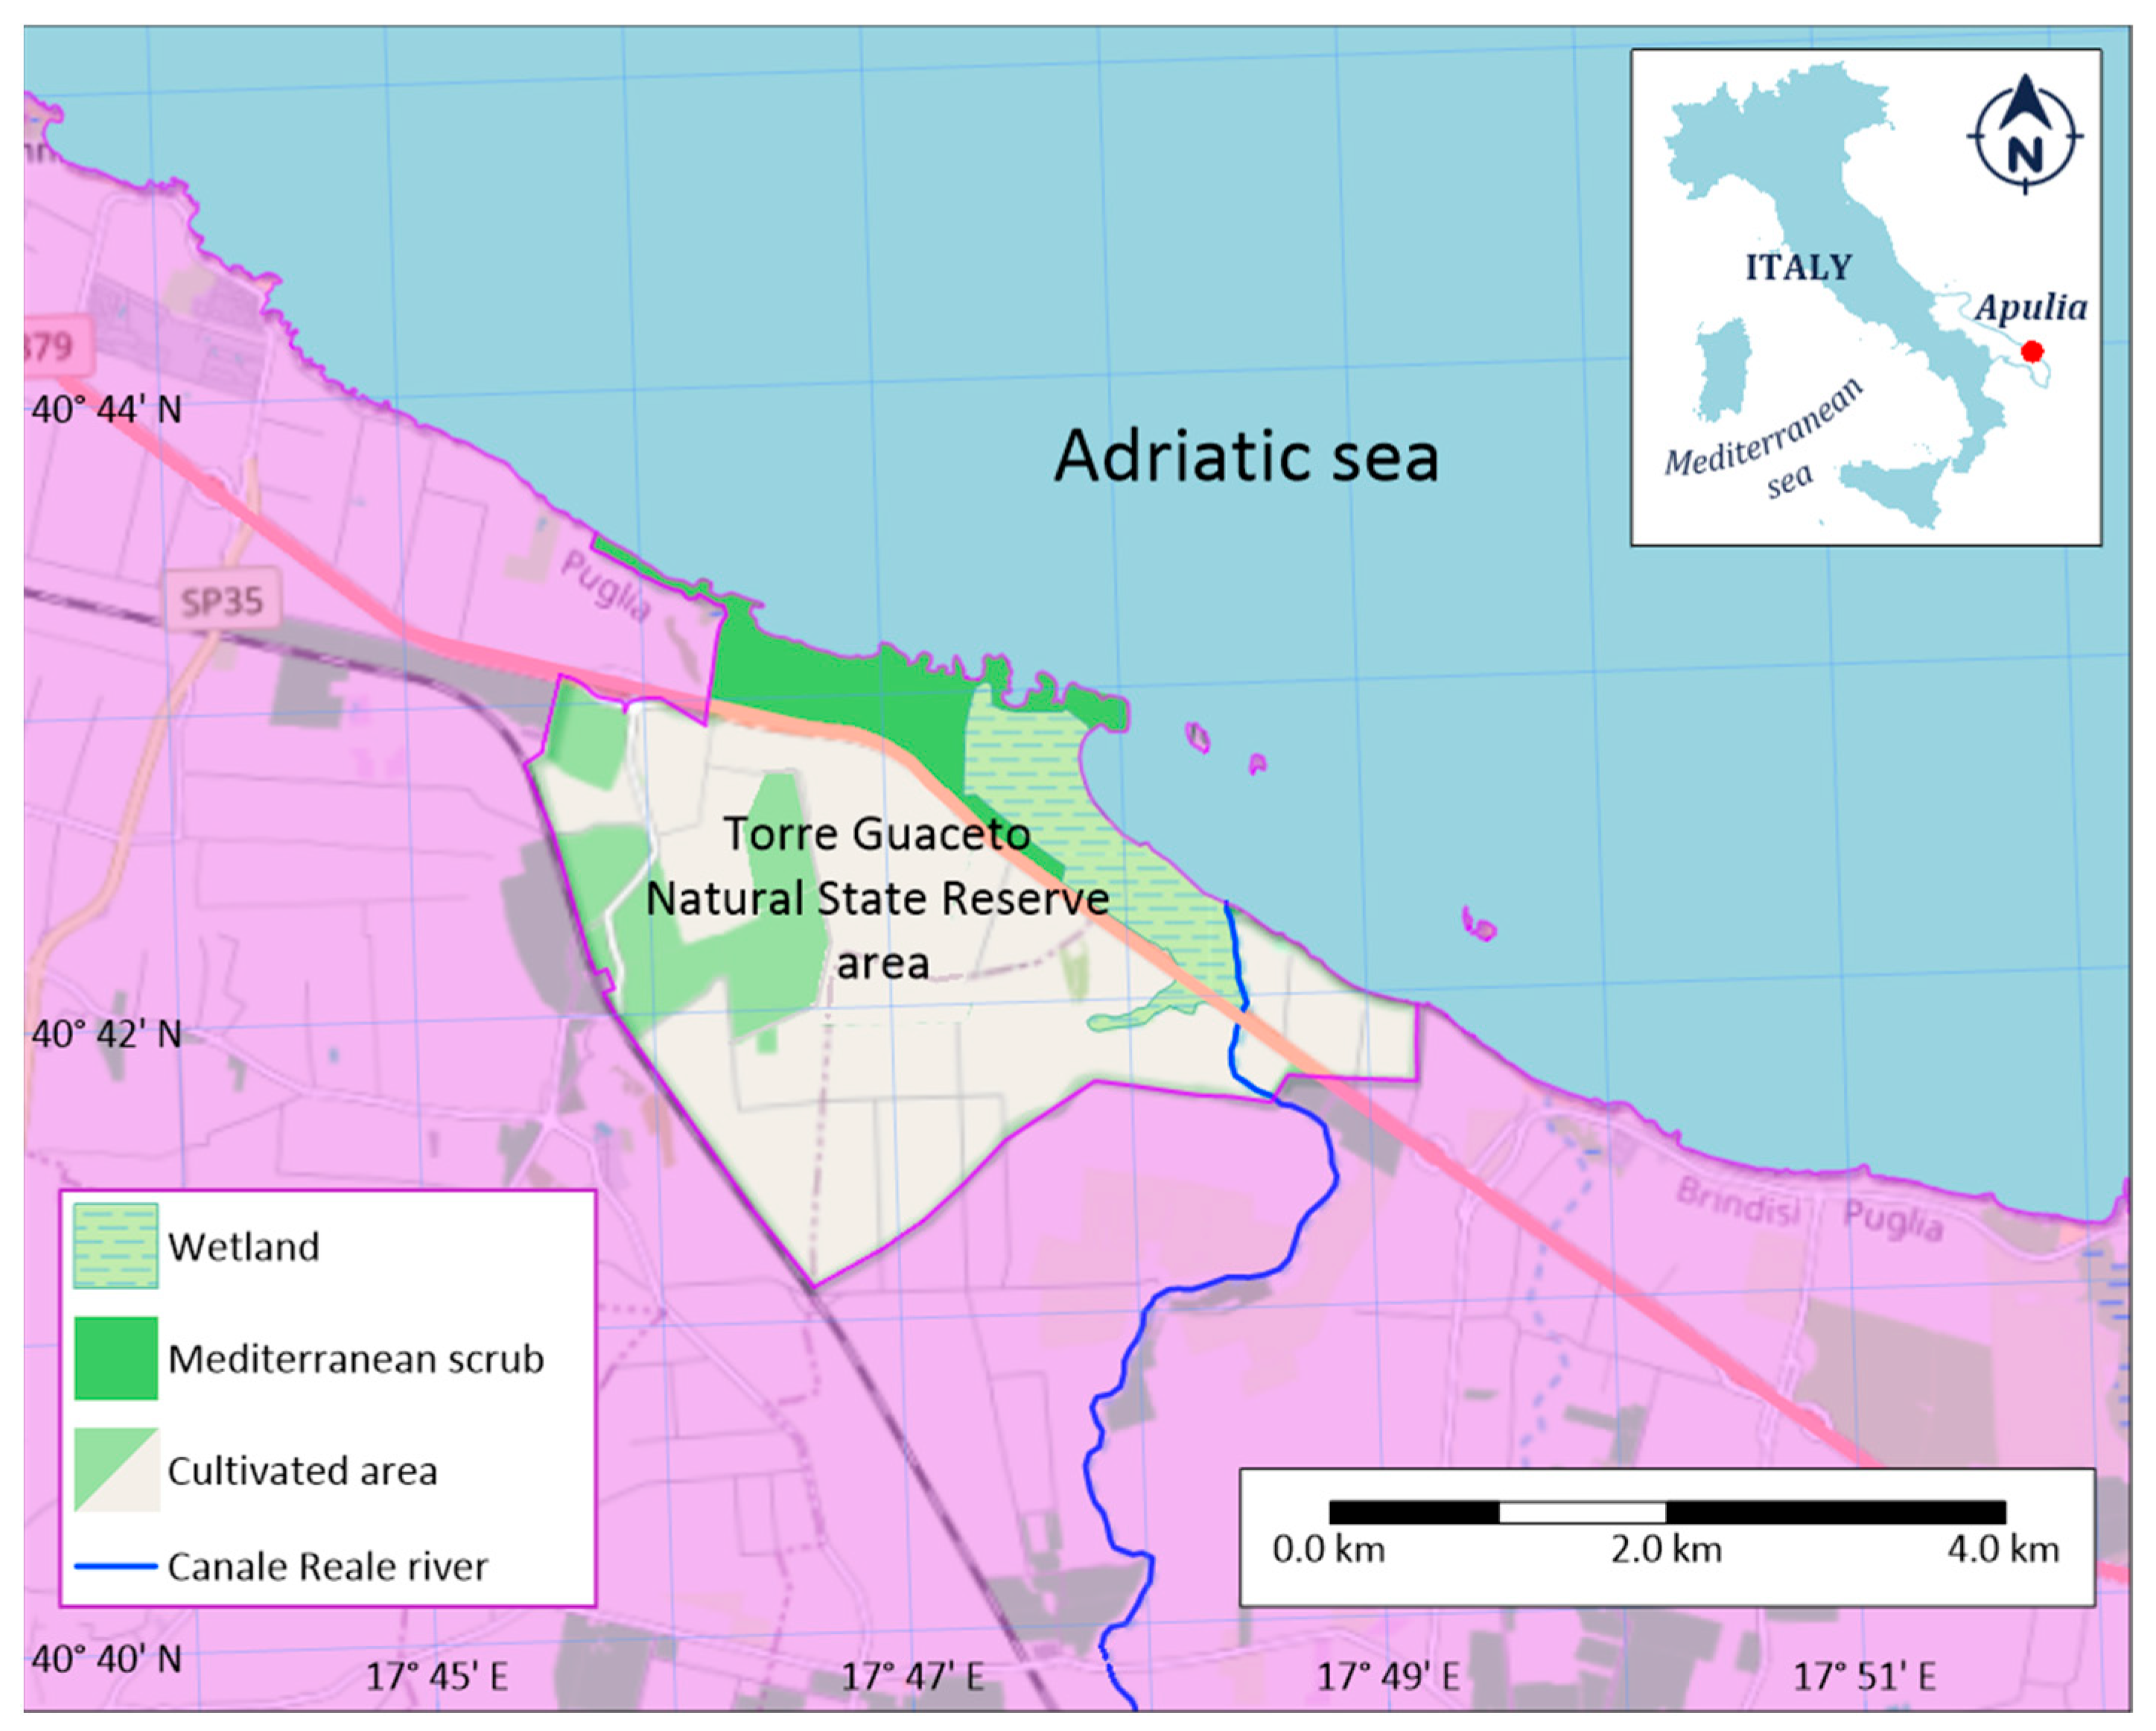
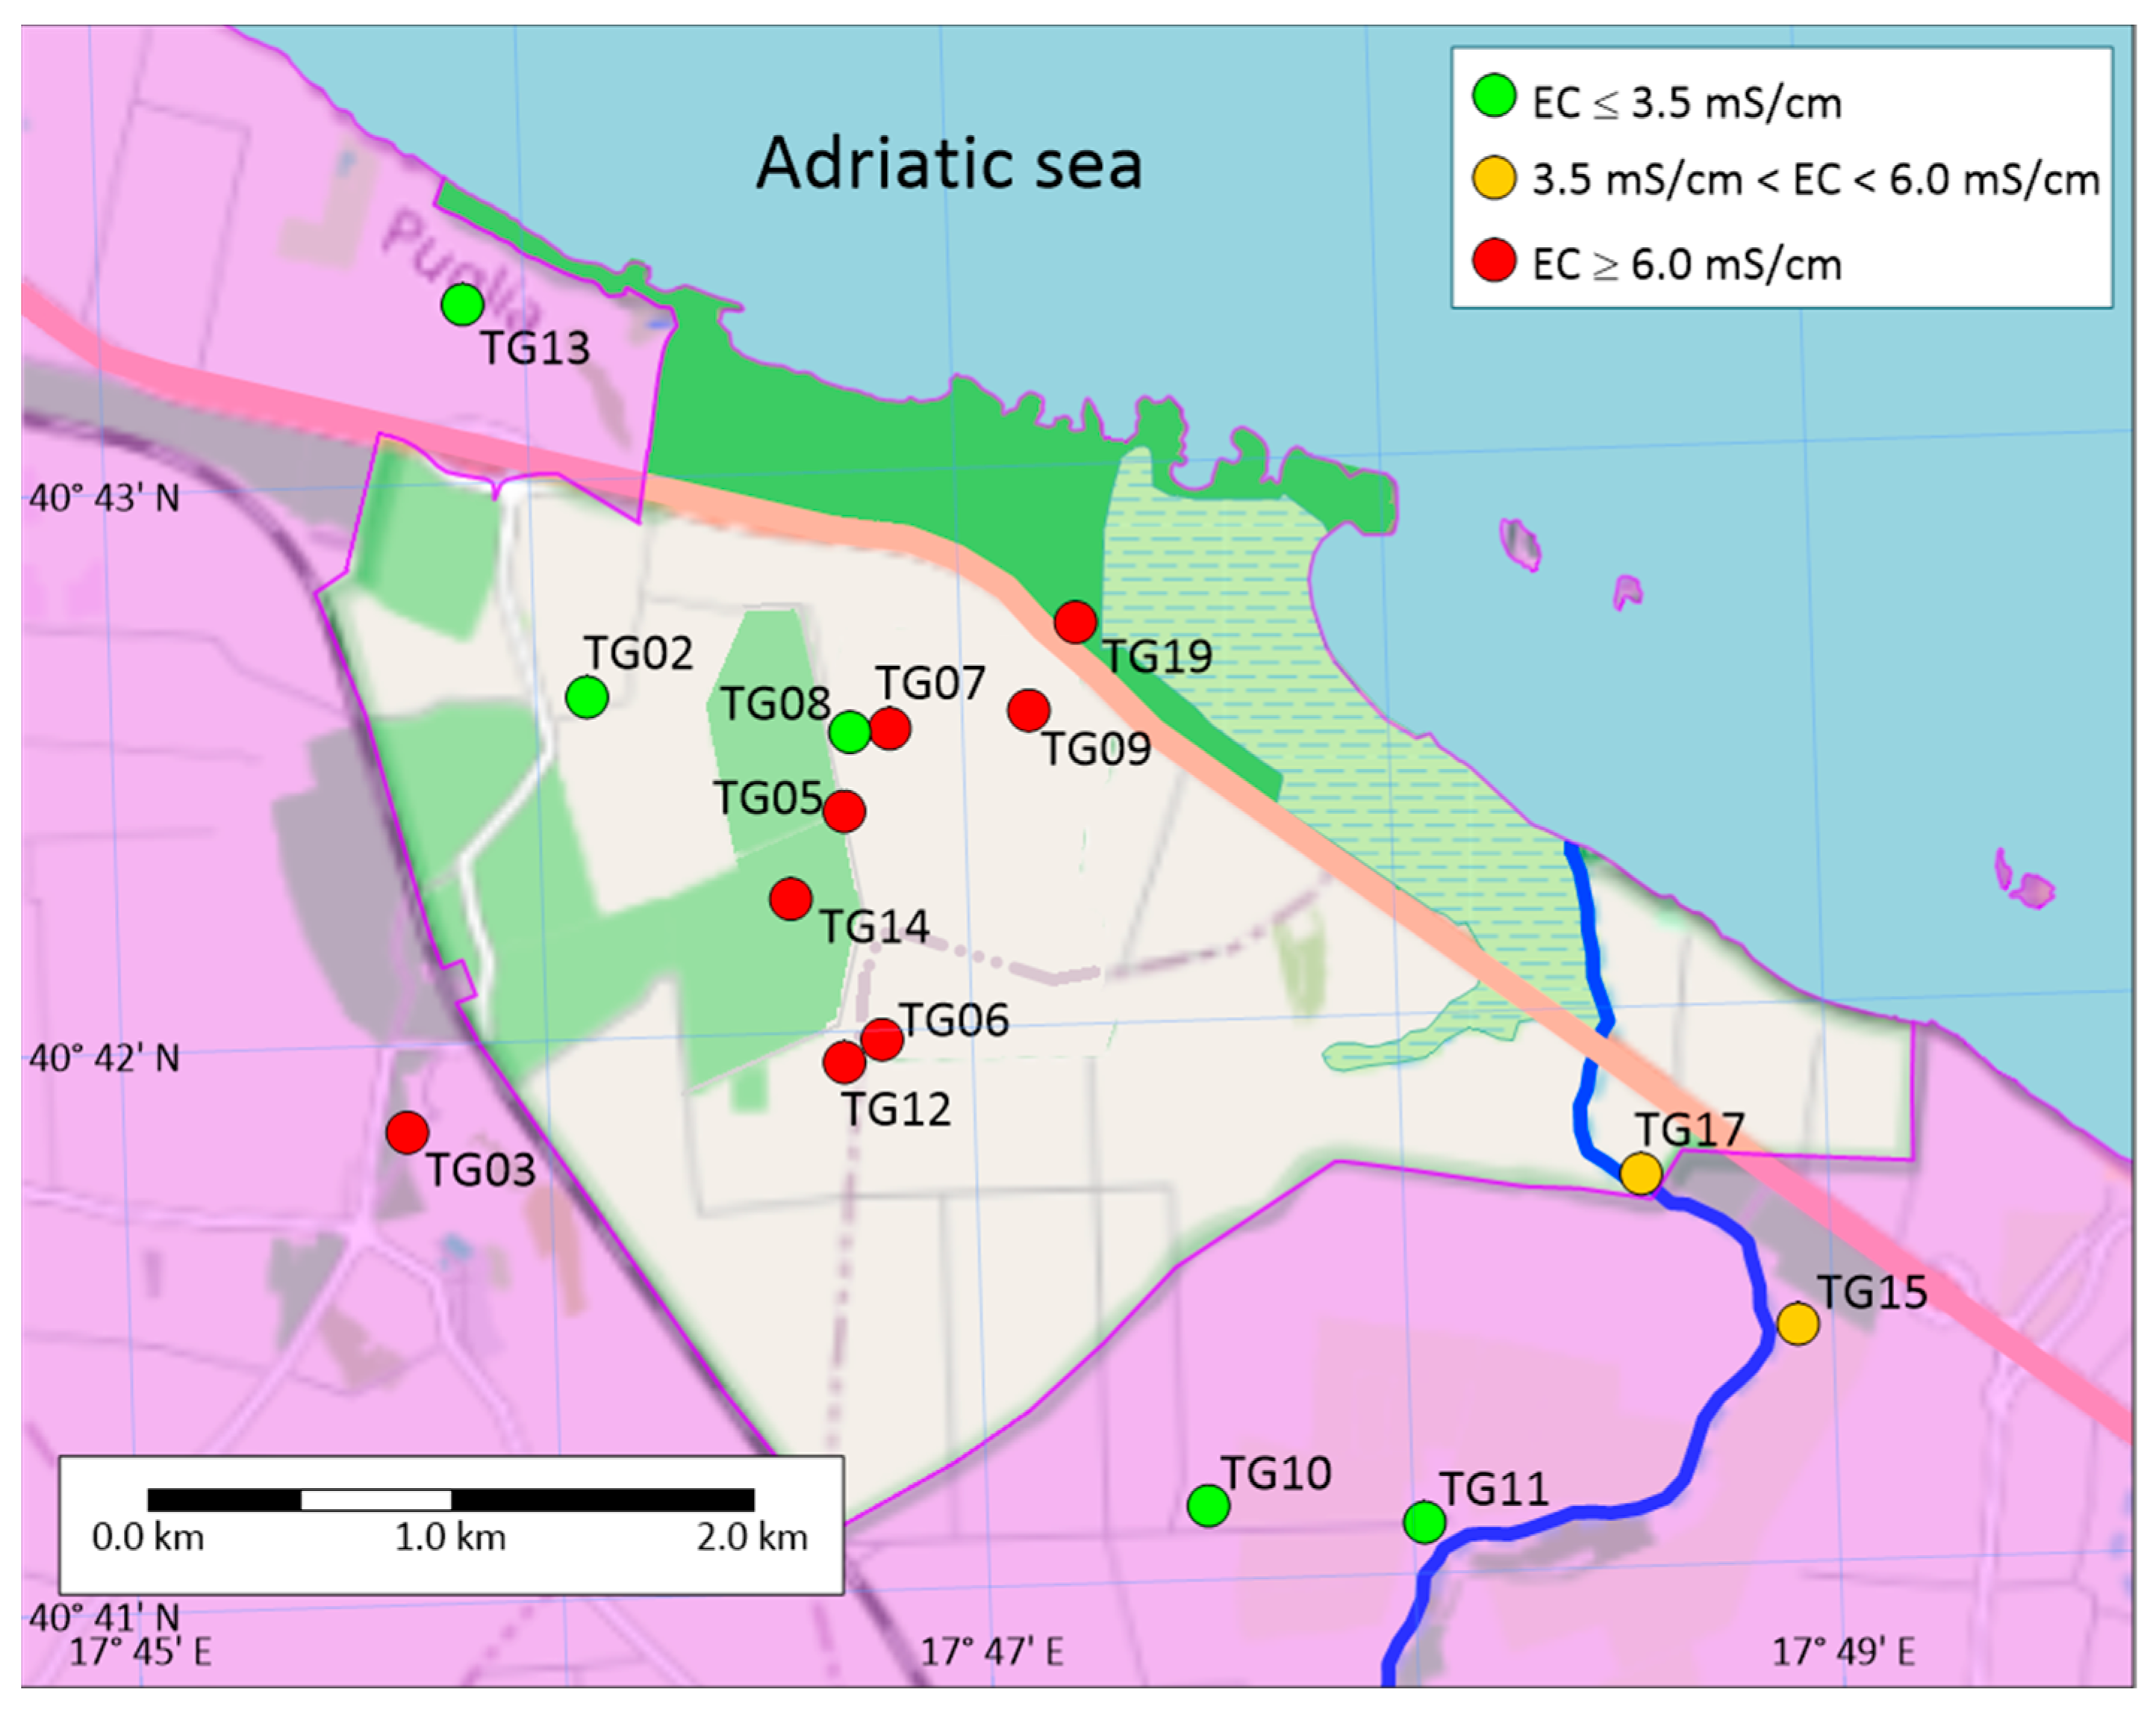
2.1. Geographic Context

The Torre Guaceto State Nature Reserve, located along the Adriatic coast of Apulia in southern Italy, is a protected natural area of ecological and cultural importance. It extends over 1120 hectares, encompassing diverse ecosystems, including 8 km of unspoiled coastline, Mediterranean scrublands, agricultural areas, and a 120-hectare brackish wetland (Figure 1). This wetland, positioned at the terminal section of the Canale Reale basin, is physically separated from the channel by artificial embankments to control water flow. It is primarily fed by numerous perennial freshwater springs, with episodic surface runoff contributing additional input during heavy rainfall events [16].

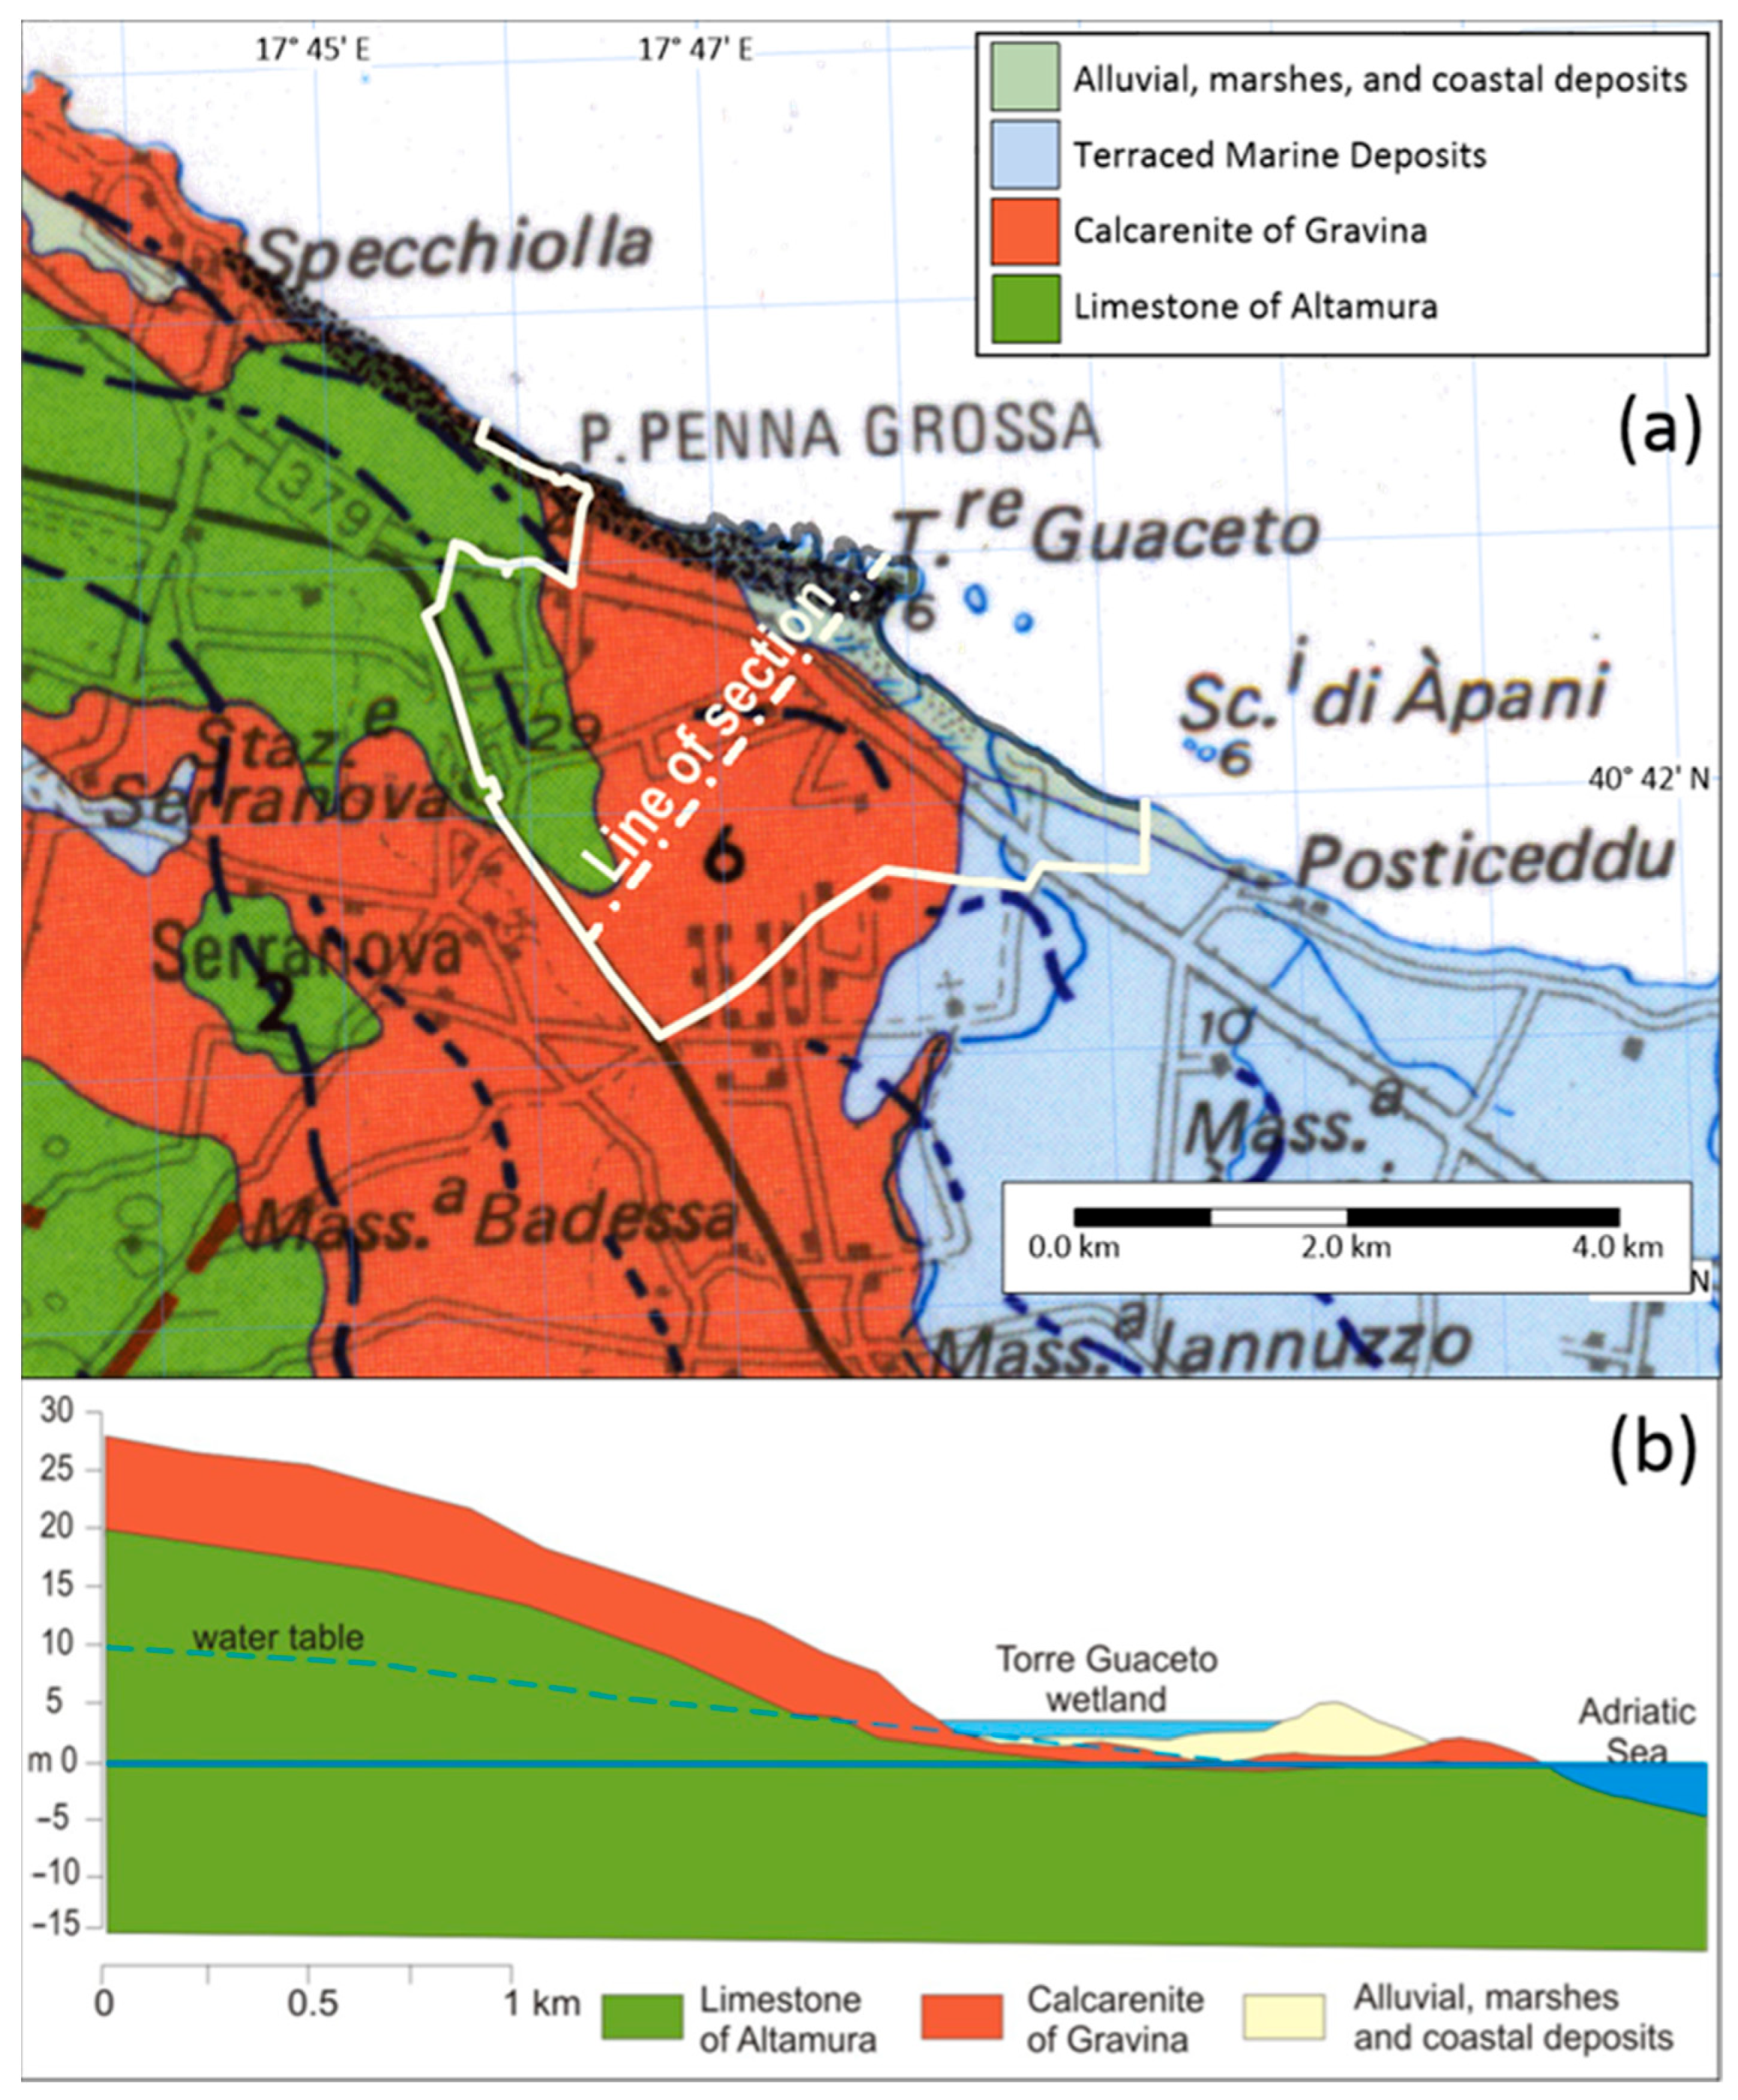
2.2. Geological and Hydrogeological Features

From a geological point of view, the study area falls within an important transition zone, known as Soglia Messapica (Messapian threshold), between two structural domains: the Murgia Plateau and the Salento peninsula. The Messapian threshold is a tectonically disturbed area that has undergone multiple geodynamic and tectonic events involving the carbonate basement. Hence, it is displaced in blocks bounded by normal sub-vertical faults, predominantly oriented E-W and NNW-SSE [17]. From the bottom to the top, the following geological units can be distinguished [18]:
  • Limestone of Altamura (Cretaceous), forming the carbonate basement, made up of calcareous and calcareous–dolomitic rocks, widely outcropping in the western part of the study area. Clayey sediments, known as terra rossa, are broadly interspersed into the carbonate formations;
  • Calcarenite of Gravina (upper Pliocene—lower Pleistocene), consisting of calcarenite sediments having a variable cementation degree, outcropping in the central part of the study area, with a thickness not exceeding 20–30 m;
  • Subapennine clays (lower Pleistocene) made of clay and sandy clay;
  • Terraced marine deposits (middle-upper Pleistocene) characterized by considerable variations of facies but generally made up of yellow sands and a base level of marly clays, and outcropping in the eastern part of the study area with a thickness not exceeding 10–20 m;
  • Alluvial, marshes, and coastal deposits (middle-upper Pleistocene—Holocene) with a small thickness and limited extension (Figure 2).
The main Torre Guaceto aquifer system is the deep aquifer hosted within the Cretaceous karstified and fractured carbonate rocks (Limestone of Altamura in Figure 2). Rainfall infiltrating the inner part of the Murgia Plateau mainly contributes to the aquifer recharge [19]. Groundwater flows towards the Adriatic coast and northwest Salento [20,21]. Freshwater floats on top of intruding saltwater, a natural condition aggravated by overexploitation and climate change that triggers water salinization phenomena, evidenced by a progressive migration of the salt wedge inland. Such observed salinization of the coastal aquifer jeopardizes the wetland’s ecological integrity and local agriculture sustainability. Finally, freshwater emerges as submarine and subaerial springs near the coast, contributing to the Torre Guaceto wetland.

2.3. Ecological Significance

Ecologically, the Torre Guaceto Reserve is a vital component of Mediterranean coastal ecosystems, exemplifying rich biodiversity and essential ecosystem services. Dense reed beds dominate the wetland, playing critical roles in nutrient cycling, sediment filtration, and habitat provision. These reed beds support diverse avian populations, including migratory species such as herons, flamingos, and various duck species, positioning the reserve as a crucial stop along the East Atlantic Flyway. The wetland’s designation as a Ramsar site highlights its global significance in water purification, carbon sequestration, and flood regulation. Furthermore, unique brackish water habitats within the wetland sustain euryhaline organisms, such as fish and crustaceans, emphasizing its importance for biodiversity conservation [22,23].
Surrounding the wetland, terrestrial landscapes comprise Mediterranean scrub vegetation featuring mastic trees, junipers, and wild olive trees, interspersed with agricultural land dedicated to traditional crop cultivation. Historically, agriculture, particularly olive oil production, has shaped the region’s economy, culture, and landscape. However, salinization linked to seawater intrusion poses significant challenges. Altered groundwater chemistry affects vegetation dynamics and soil health, threatening reed beds that underpin the ecosystem’s resilience. Additionally, salinity reduces the agricultural viability of surrounding land, compounded by marine aerosol deposition and irrigation practices using saline groundwater [24]. Climate change exacerbates these risks, with rising sea levels and shifting precipitation patterns intensifying groundwater salinization. Increased temperatures and reduced aquifer recharge rates further jeopardize the ecosystem’s stability, requiring adaptive management strategies.

2.4. Socioeconomic Context

In addition to its natural areas of undeniable ecological value, the Torre Guaceto Reserve encompasses agricultural zones dedicated to the traditional cultivation of crops such as olives, vegetables (primarily artichokes and tomatoes), and wine grapes. Groundwater is the primary irrigation source, enabling farmers to maintain productivity despite the semi-arid Mediterranean climate. However, the increasing salinity of irrigation water has led to reduced crop yields, particularly for salt-sensitive crops such as wine grapes. Farmers have also reported signs of soil degradation, including increased alkalinity and reduced permeability, which are linked to the use of saline water. Moreover, the Torre Guaceto reserve has become a focal point for ecotourism. The area’s rich biodiversity and unspoiled natural beauty attract visitors interested in birdwatching, hiking, and educational activities. Revenue from ecotourism supports local conservation efforts, including monitoring programs and habitat restoration initiatives. However, the influx of tourists, especially during peak seasons, has raised concerns about the pressure on the reserve’s natural resources, particularly groundwater. The Torre Guaceto Management Consortium, which includes local municipalities and WWF Italy, leads efforts to balance conservation and human activity. Management strategies emphasize community involvement, promoting sustainable agricultural practices and water-saving technologies. Initiatives such as organic farming and the reuse of treated wastewater for irrigation are being explored as viable solutions to reduce the reliance on groundwater extraction and mitigate salinity impacts.

3. Materials and Methods

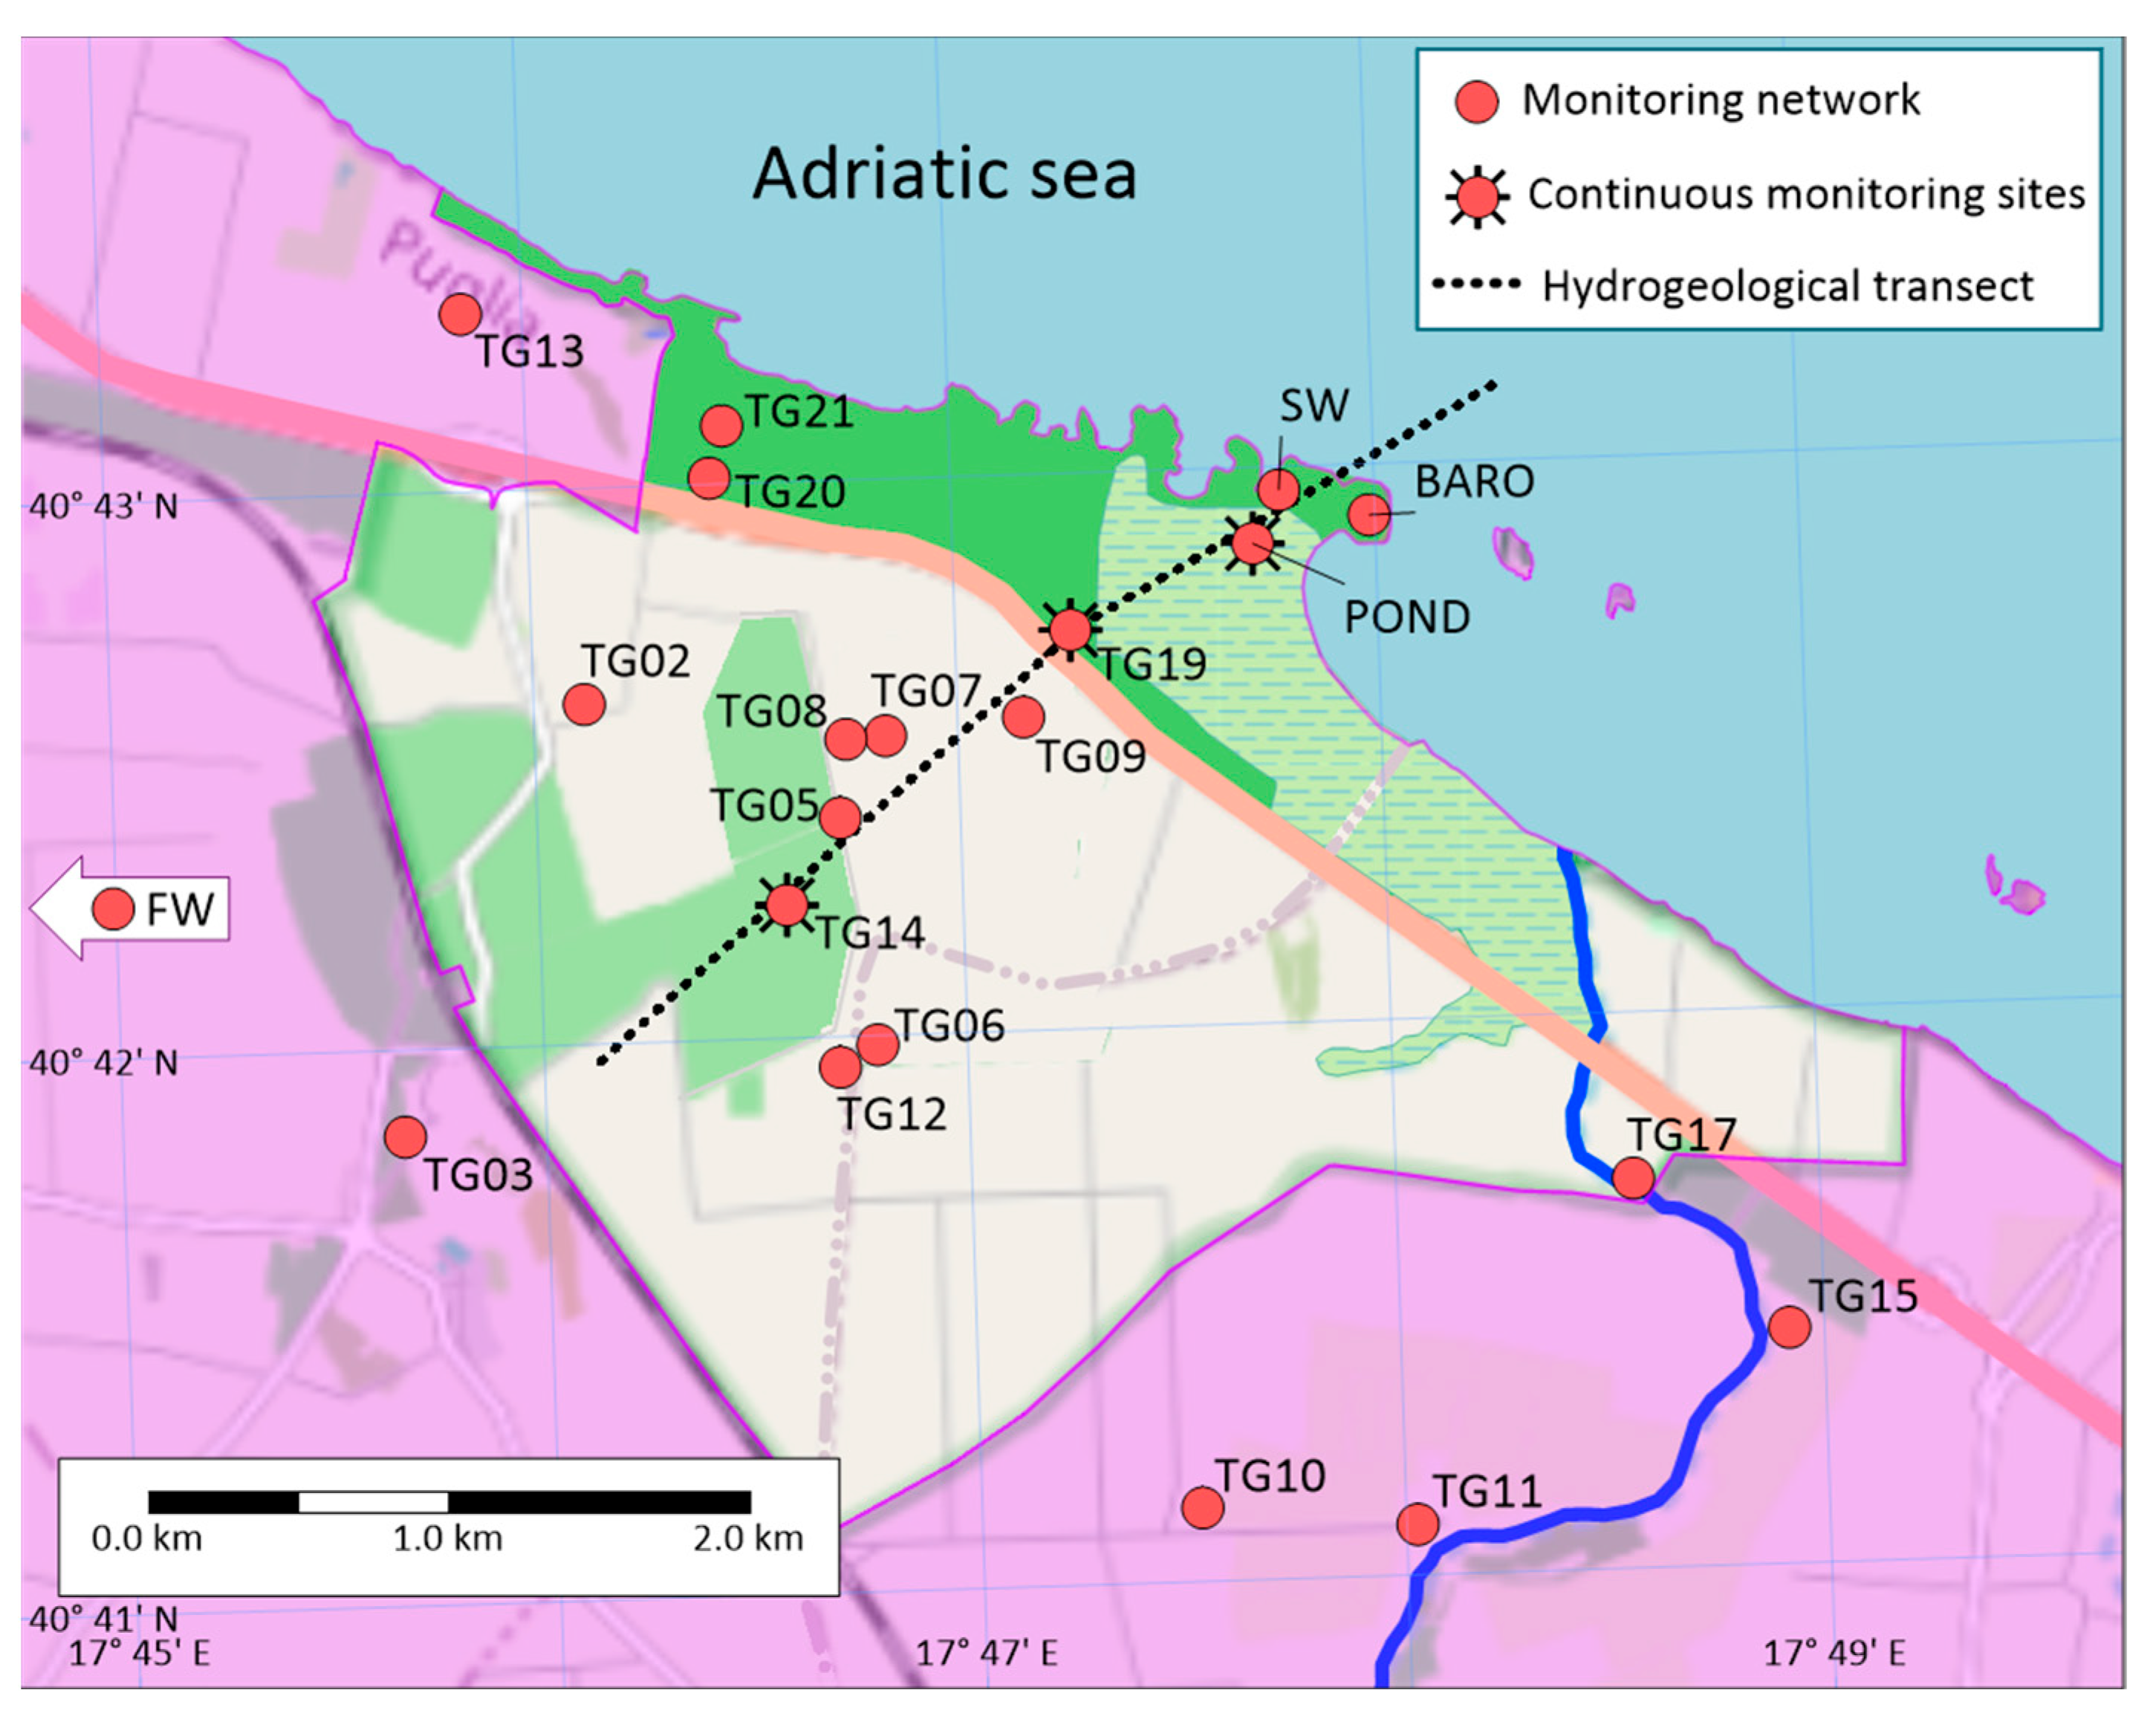
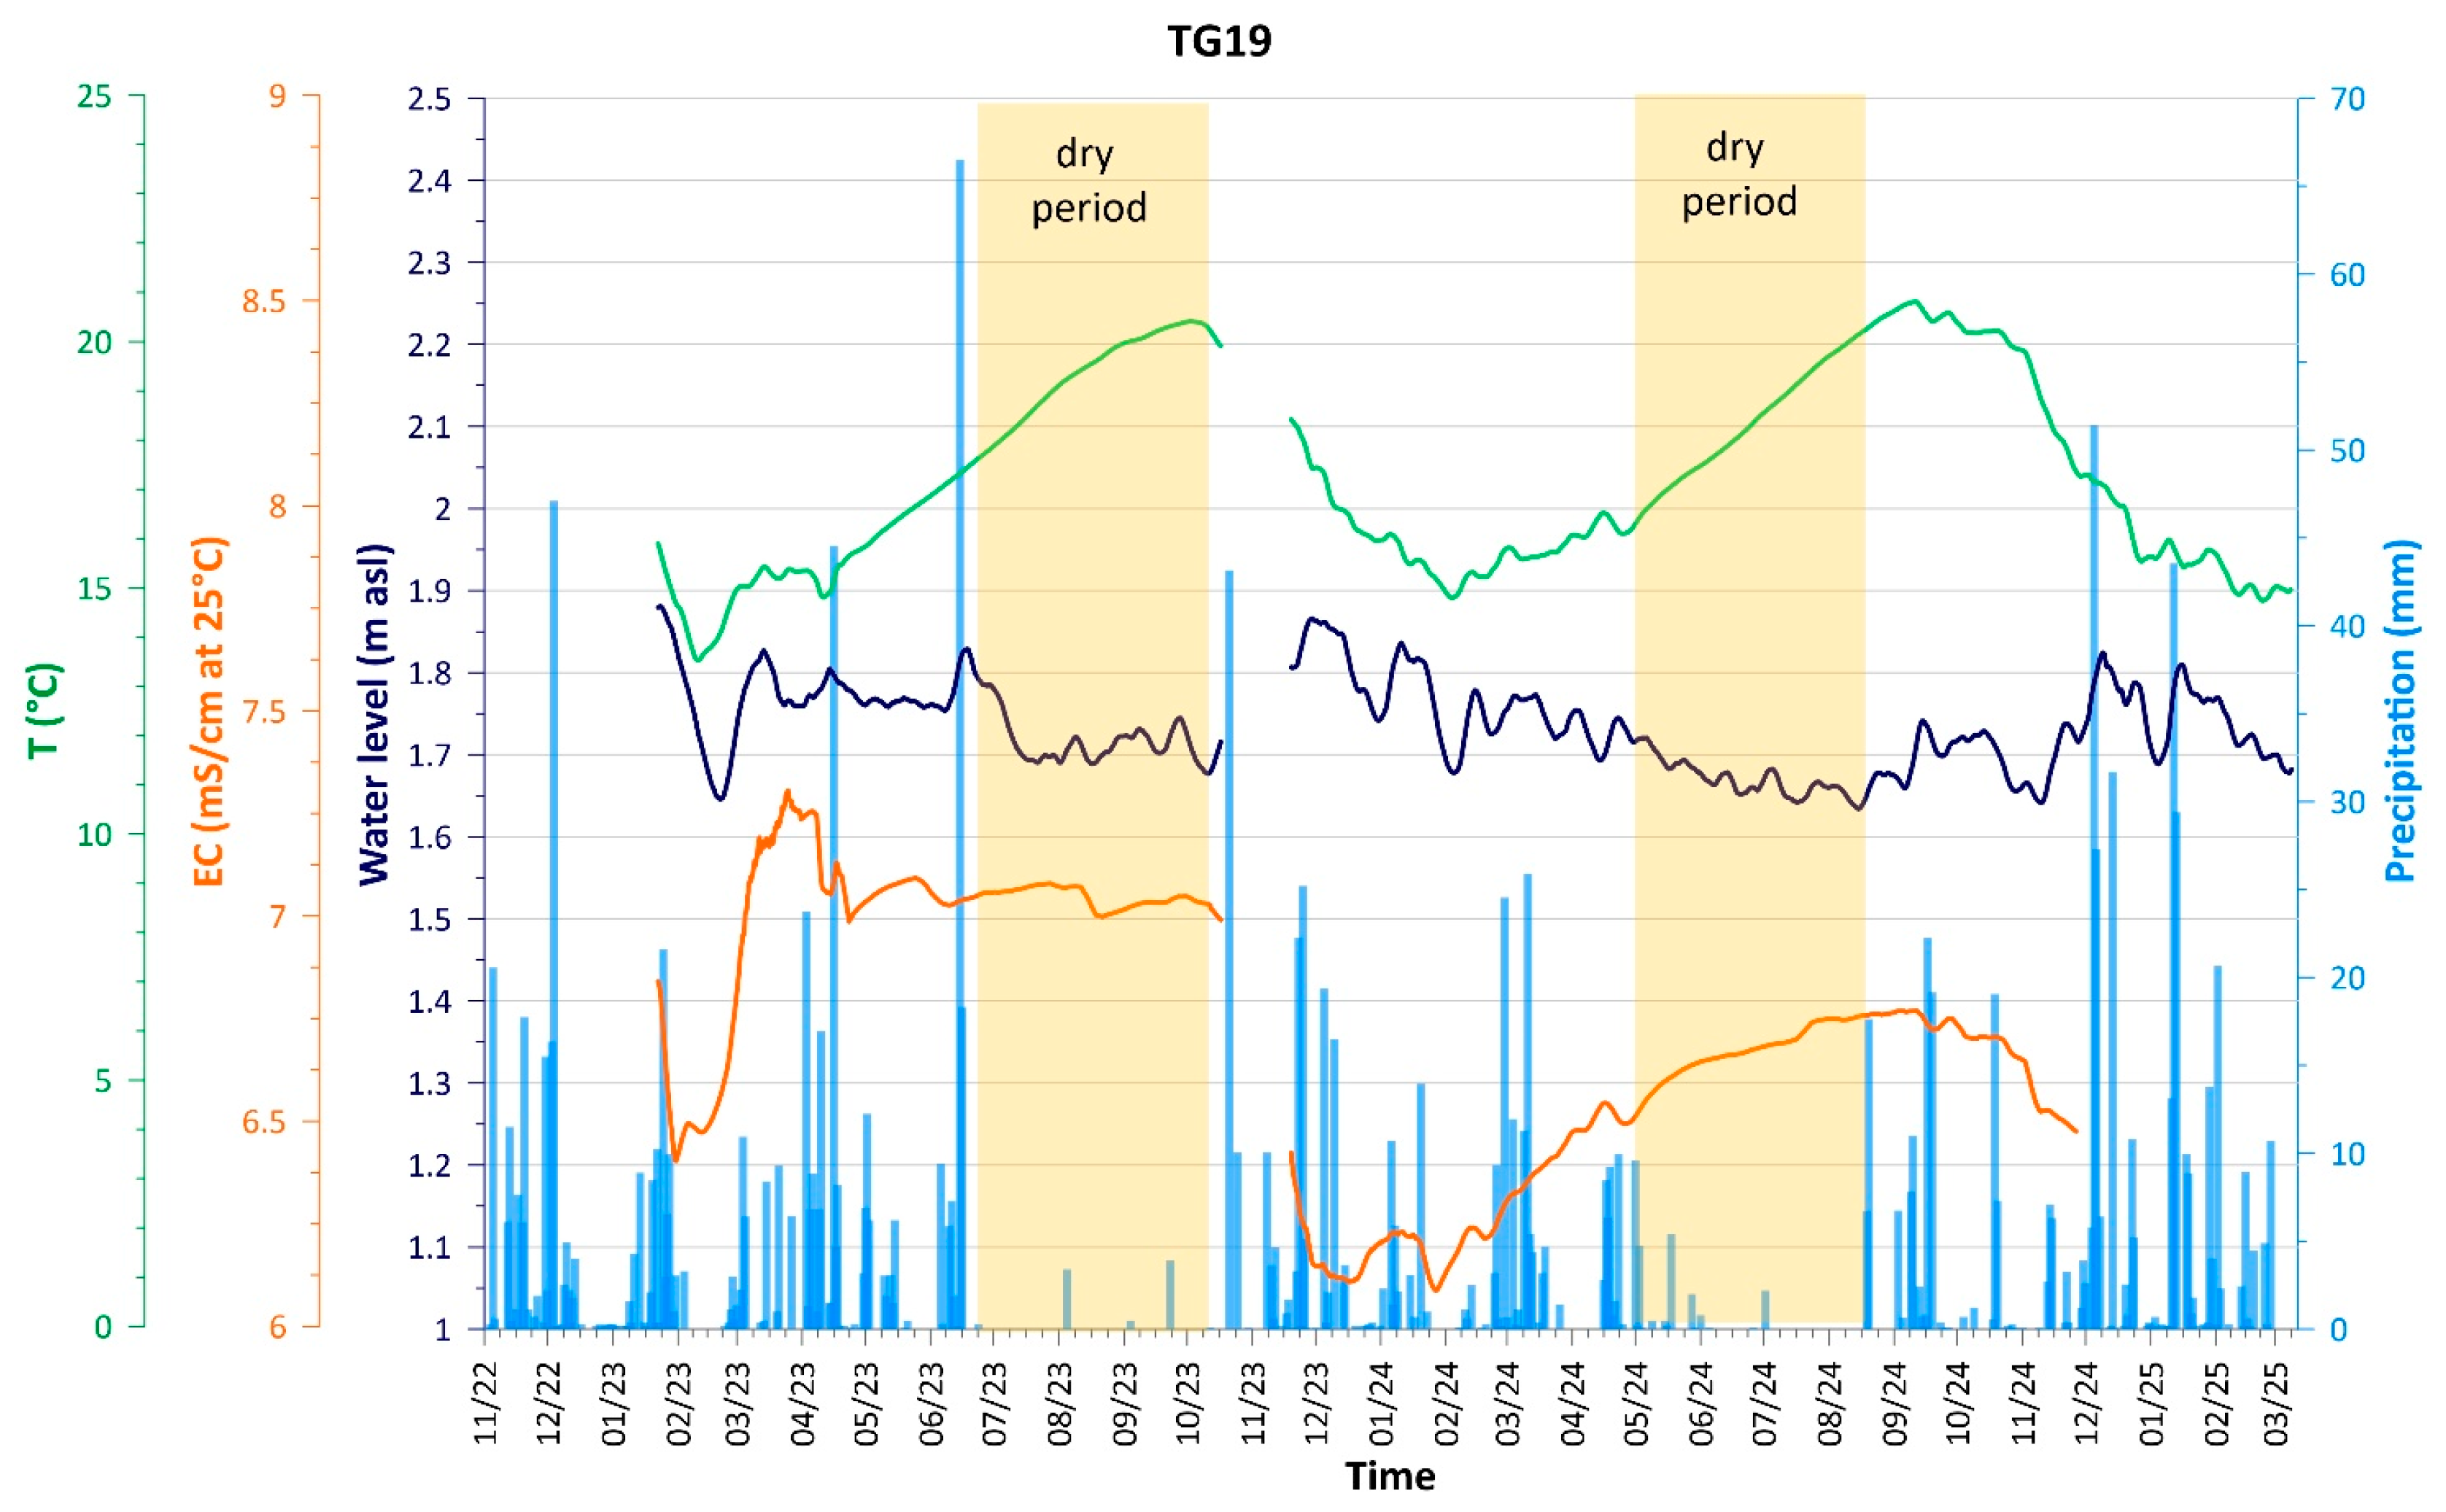
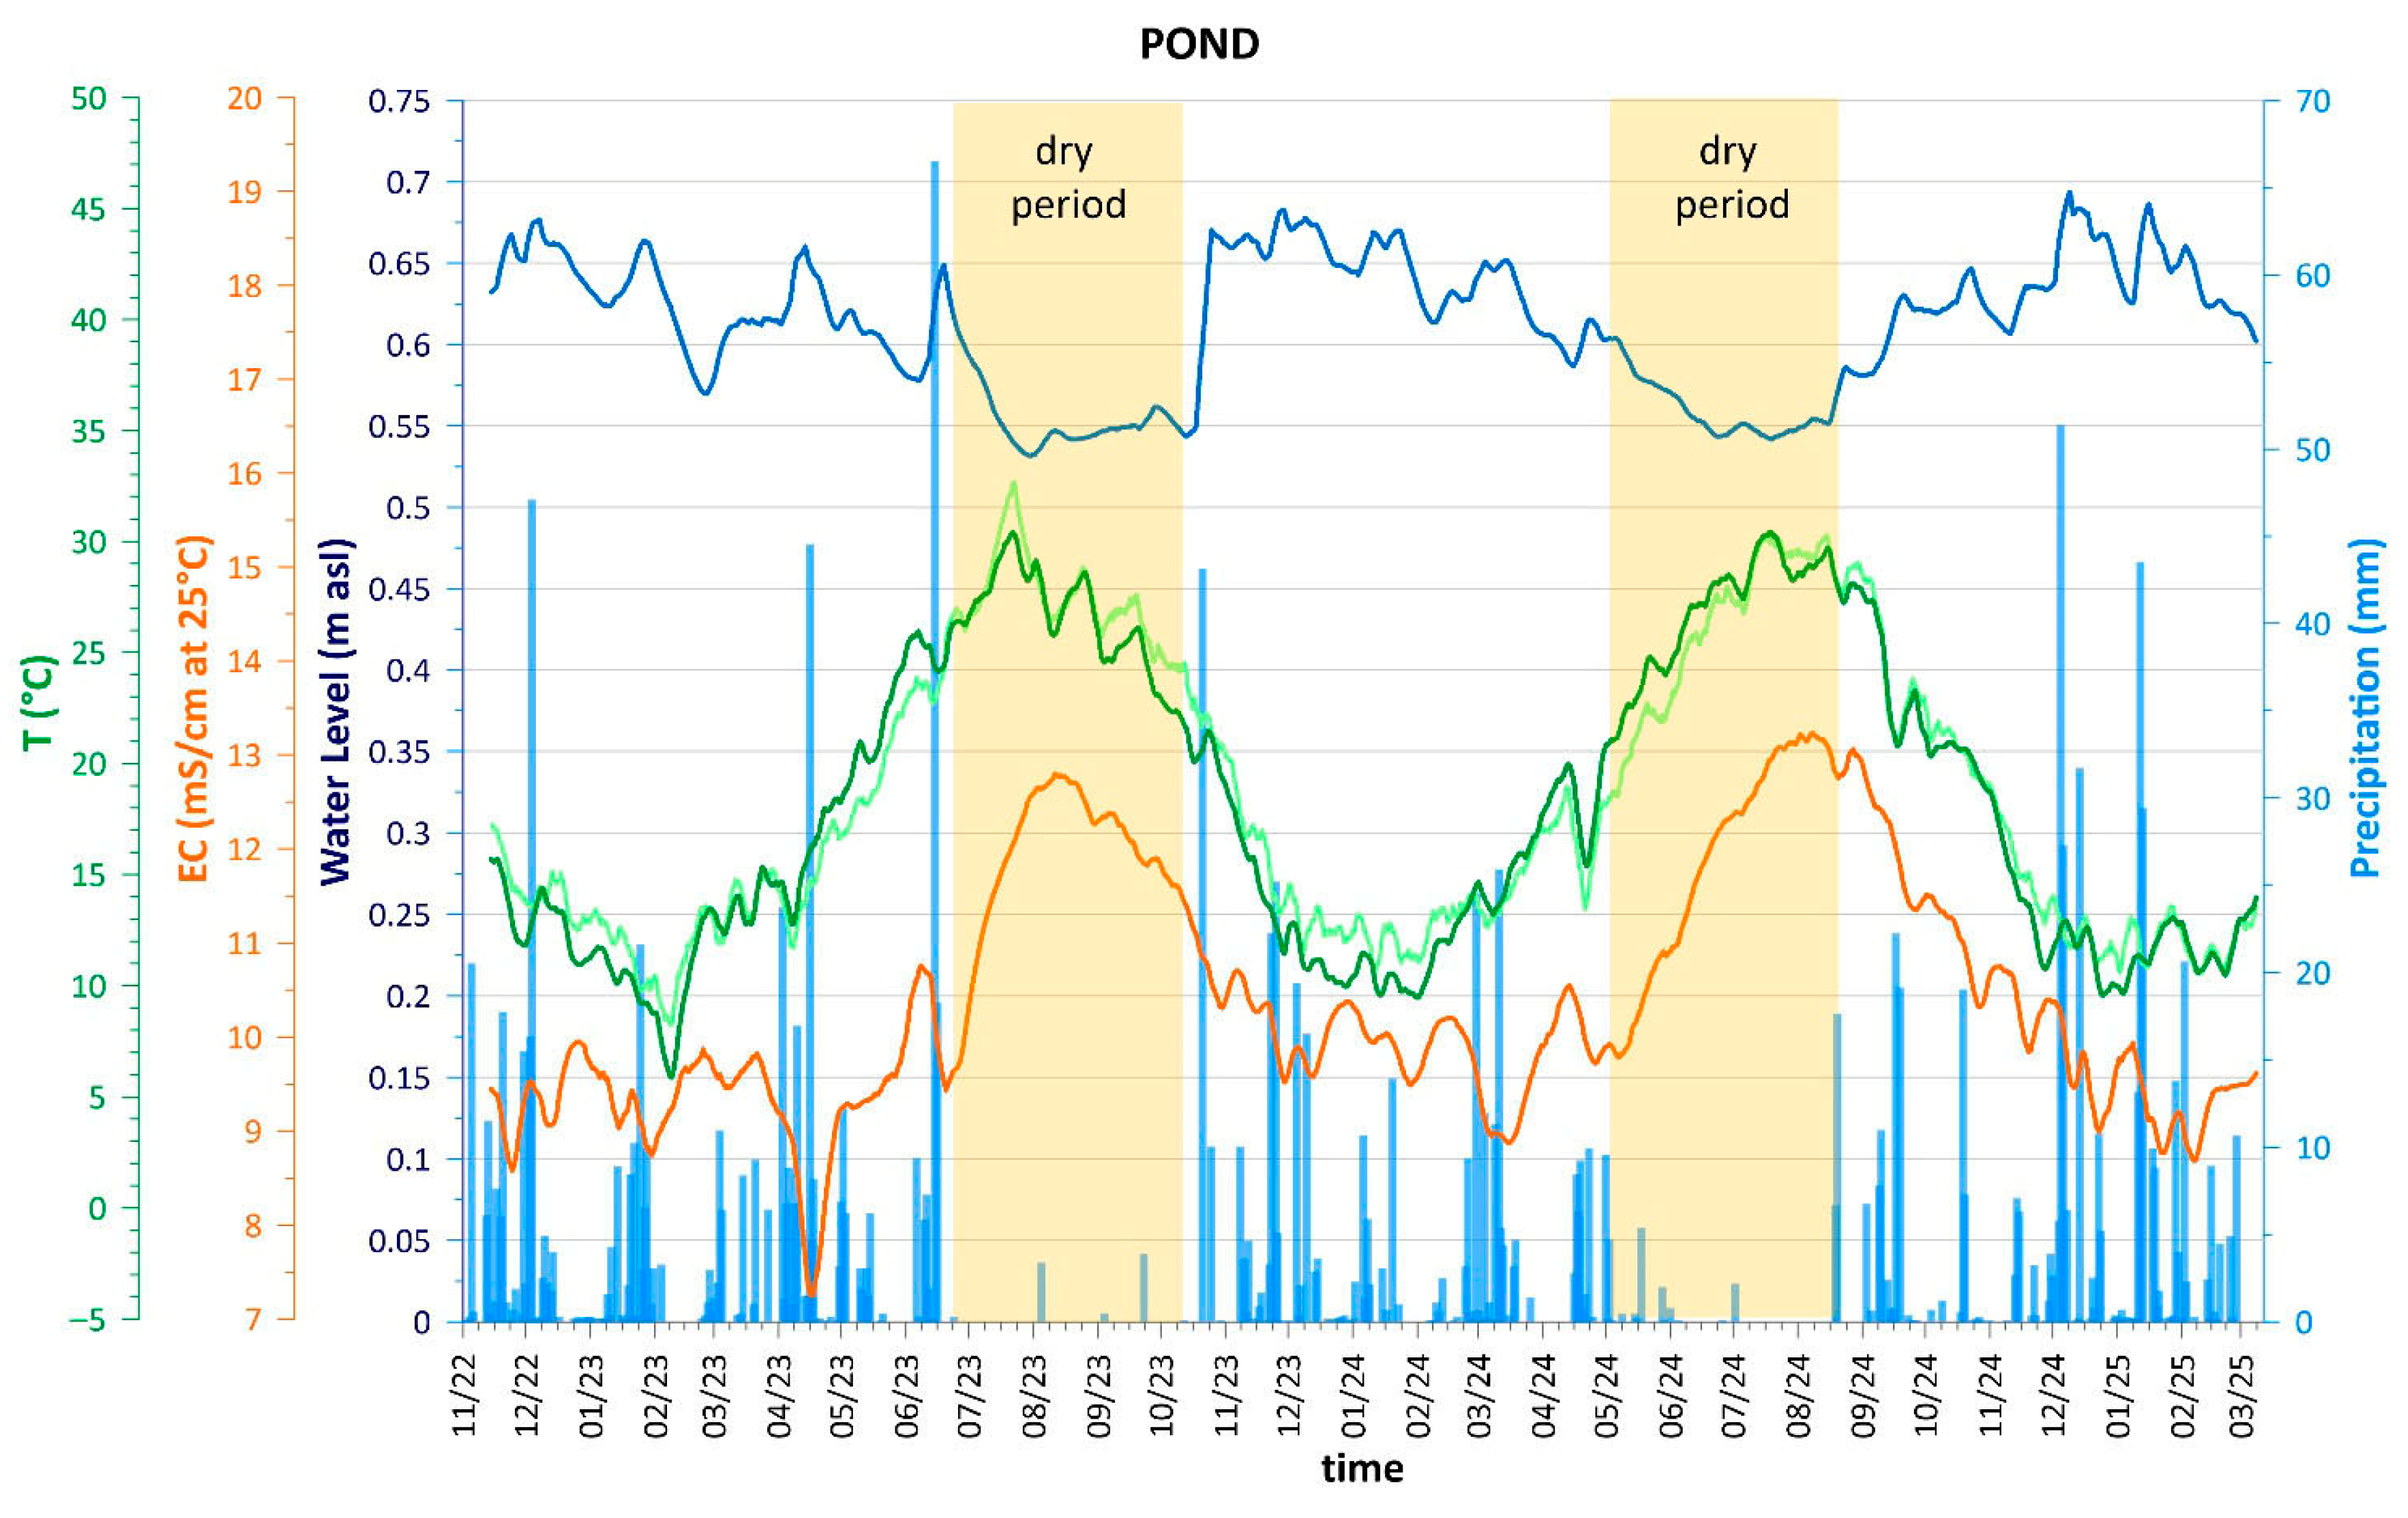
3.1. Monitoring Network and Data Collection

In this study, we established a network of 19 private and public wells to systematically monitor pH, temperature, electrical conductivity (EC), groundwater levels, and selected hydro-geochemical parameters (Figure 3).
In addition to these routine measurements, a vertical temperature and EC log was conducted in October 2023 in well TG14. The wells are situated at distances ranging from 0.3 to 3.5 km from the coastline, with depths varying from a few meters to 20 m. Furthermore, the monitoring network incorporates a surface water monitoring site located within the largest pond in the area (Table 1).
Additional monitoring points were strategically selected to represent key natural system end-members: fresh groundwater (FW) and seawater (SW). The FW site is located approximately 8.0 km inland near the town of Carovigno, while the SW site lies just a few meters offshore, at the seaward end of a transect perpendicular to the coastline that intersects continuously monitored locations, i.e., TG14, TG19, and pond. A submersible datalogger (CTD-Diver®—Van Essen Instruments, Delft, The Netherlands) was installed in the latter sites to acquire long-term, real-time electrical conductivity, temperature, and water pressure measurements. Finally, a barometer (BARO-Diver®—Van Essen Instruments, Delft, The Netherlands) was installed for simultaneous barometric pressure and air temperature measurements required to compensate for measurements from the CTD-Divers.
Several monitoring campaigns were carried out in different periods of the hydrological year from April 2022 to July 2024. Some campaigns included only in situ water level, temperature, and electrical conductivity (EC) measurements, while others involved geochemical and isotopic sampling. Table 2 provides details of the number and type of monitoring campaigns. The in situ EC (mS/cm, normalized to 25 °C) and temperature (°C) were measured using a portable conductivity meter (HD 2106.2—Delta OHM, GHM Group, Padova, Italy), while a phreatimeter was used for water levels. Finally, samples were collected at the pump outlet after purging (dynamic samples) in the 11 wells equipped with in-place pumps and using a bailer (static samples) in all the other monitoring points.

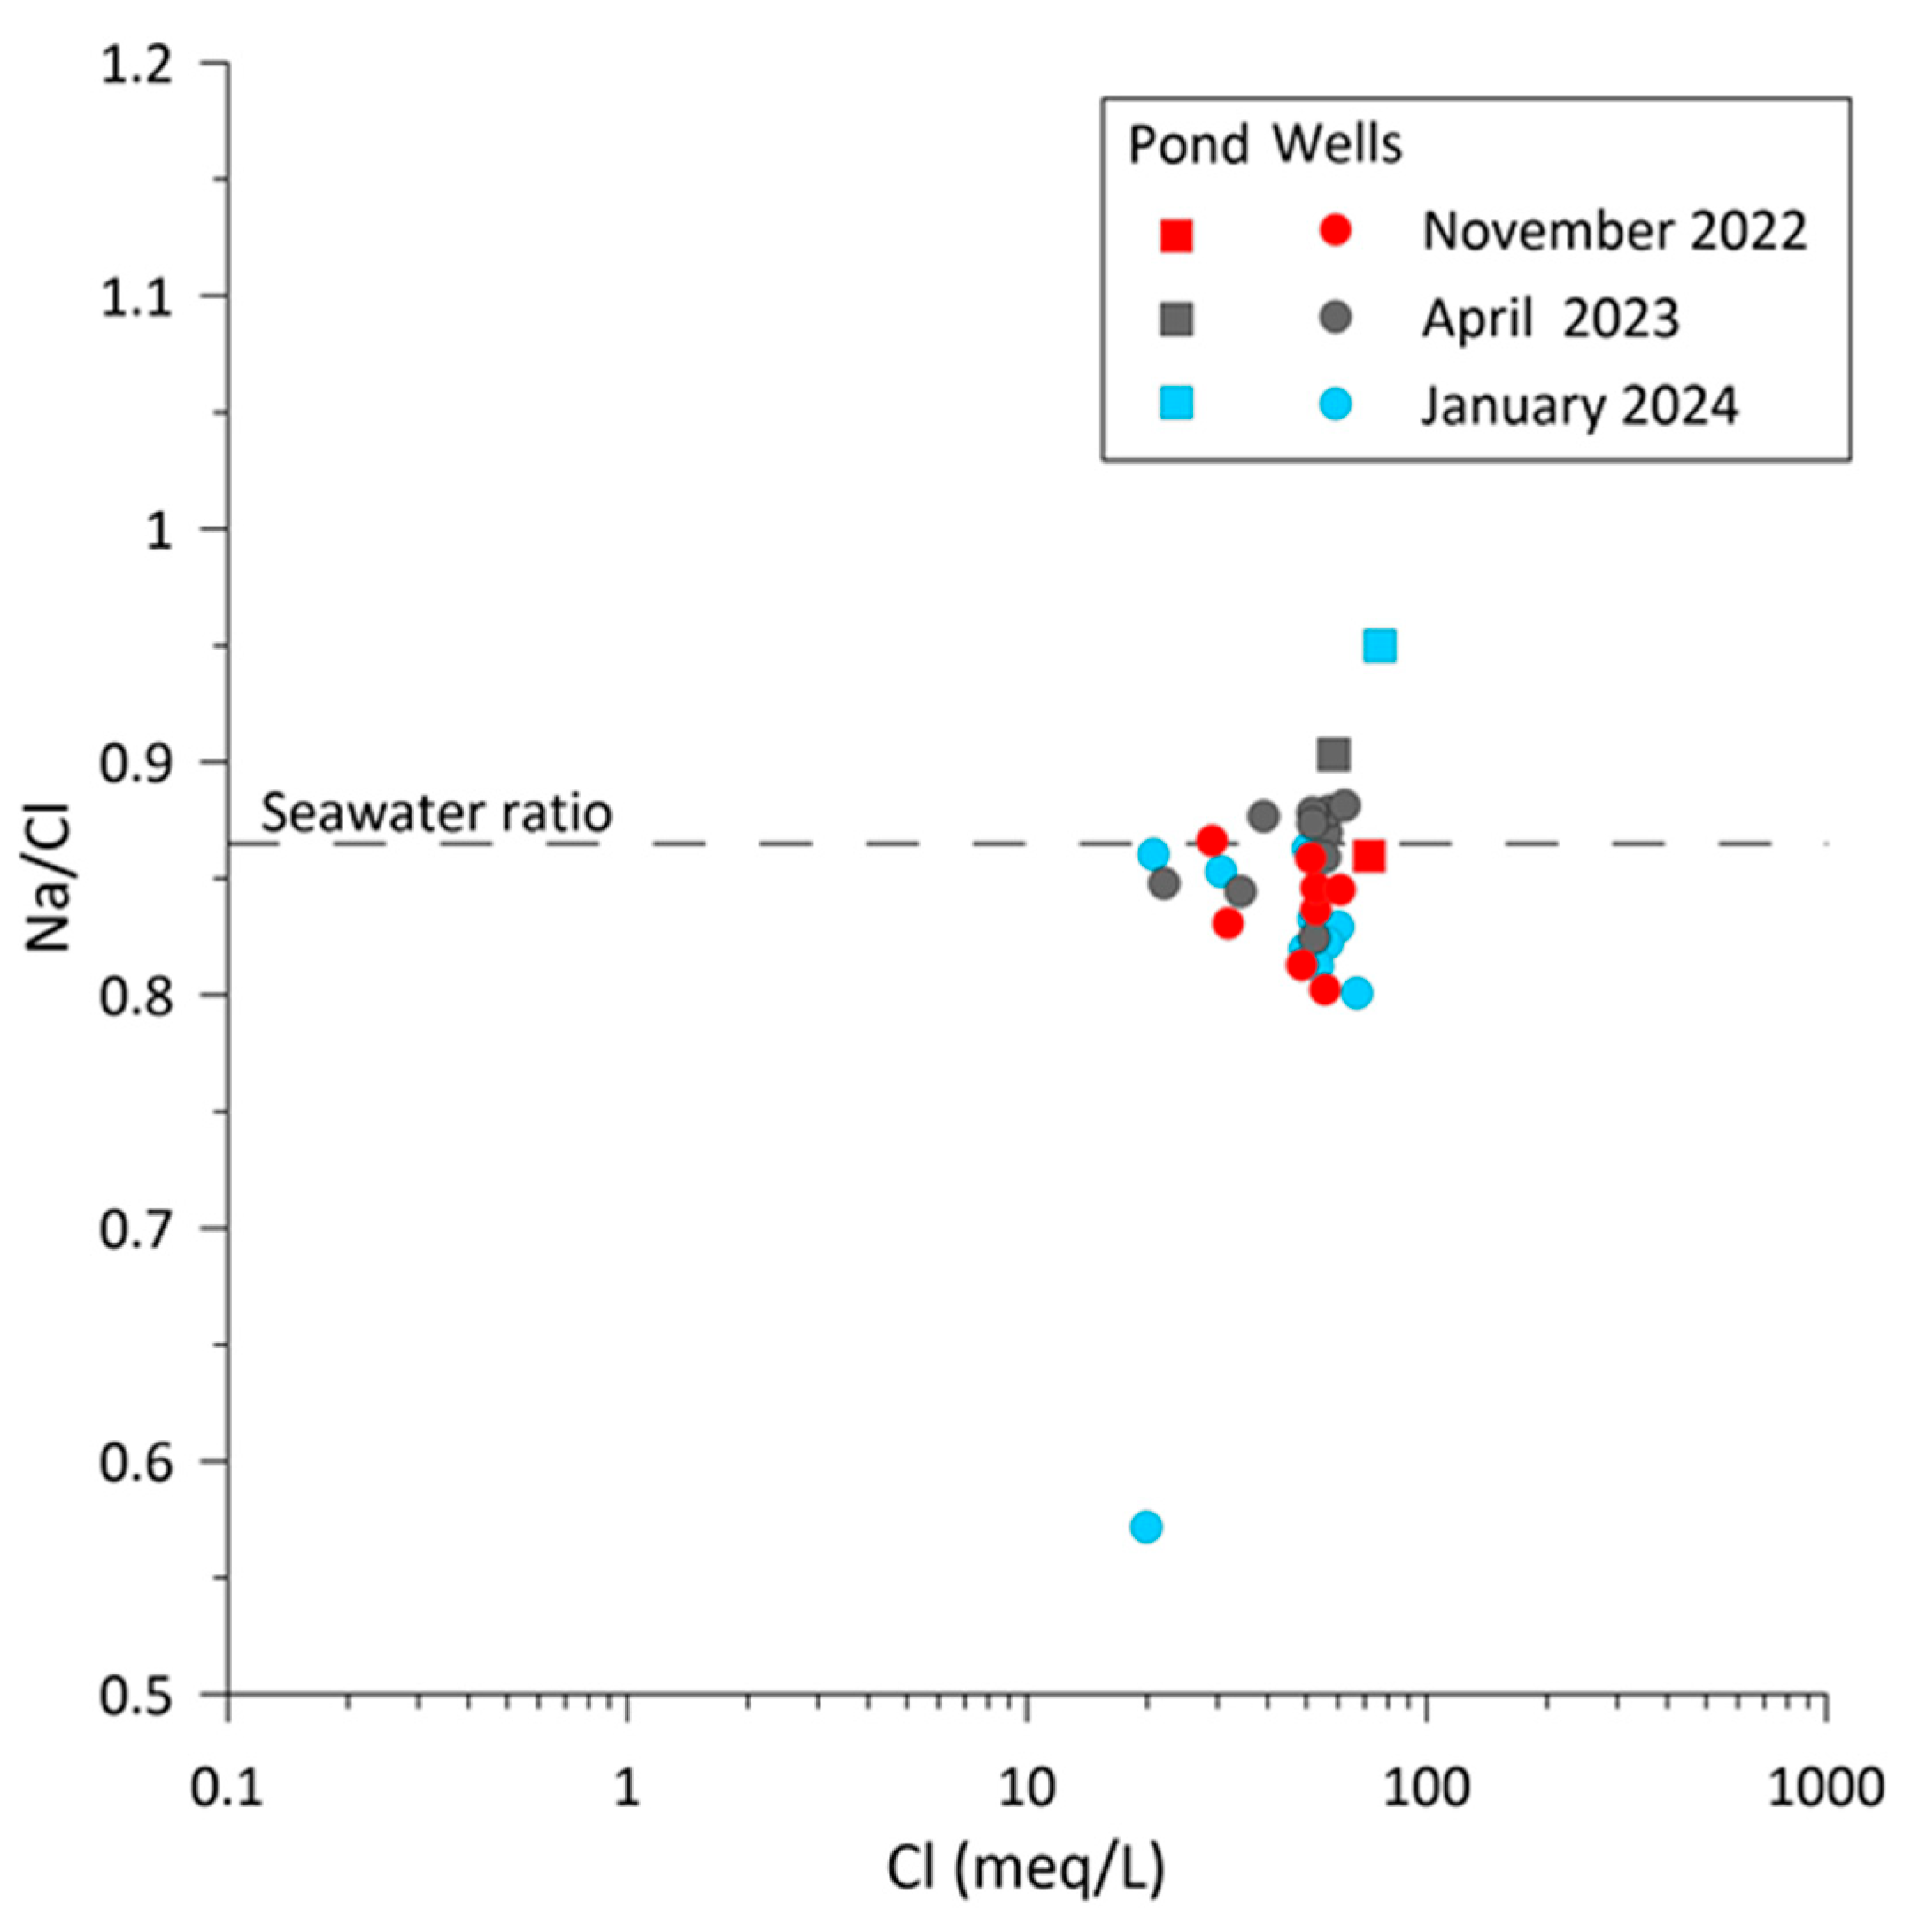
3.2. Geochemical and Isotopic Analyses

Water samples were analyzed for major cations (Ca, Mg, Na, K) and anions (HCO3, Cl, SO4, NO3) by ICP-mass spectrometry and ion-exchange chromatography, respectively. Furthermore, stable isotopes ( δ 18 O , δ D ) were measured. 18O/16O analyses were executed by a ThermoFinnigan MAT 252 IRMS (Thermo Fisher Scientific, Bremen, Germany). The values have been reported as conventional delta notation, δ18O, with a 0.1‰ accuracy. The D / H isotope ratio was measured by laser atomic absorption spectroscopy on a Liquid Water Isotope Analyzer—Los Gatos Research (ABB Group, San Jose, CA, USA). Isotopic ratios have been reported by δ D referred to as the international V-SMOW standard with a 0.1‰ accuracy.

3.3. Integration of Meteorological Data

Daily precipitation data were used to examine the impact of climatic variations on groundwater salinity. Precipitation records from the S. Vito dei Normanni (lat: 40.650; long: 17.700; elev.: 121 m above sea level—ASL) and Brindisi (lat: 40.634; long: 17.917; elev. 22 m ASL) weather stations, the nearest stations to Torre Guaceto within the Regional Weather Monitoring Network, were sourced from the Regional Civil Protection Agency’s website (data source: https://protezionecivile.regione.puglia.it/bollettini-pluviometrici (last access: 26 June 2025)). The daily average of the two timeseries was used to represent the entire area.

4. Results and Discussion

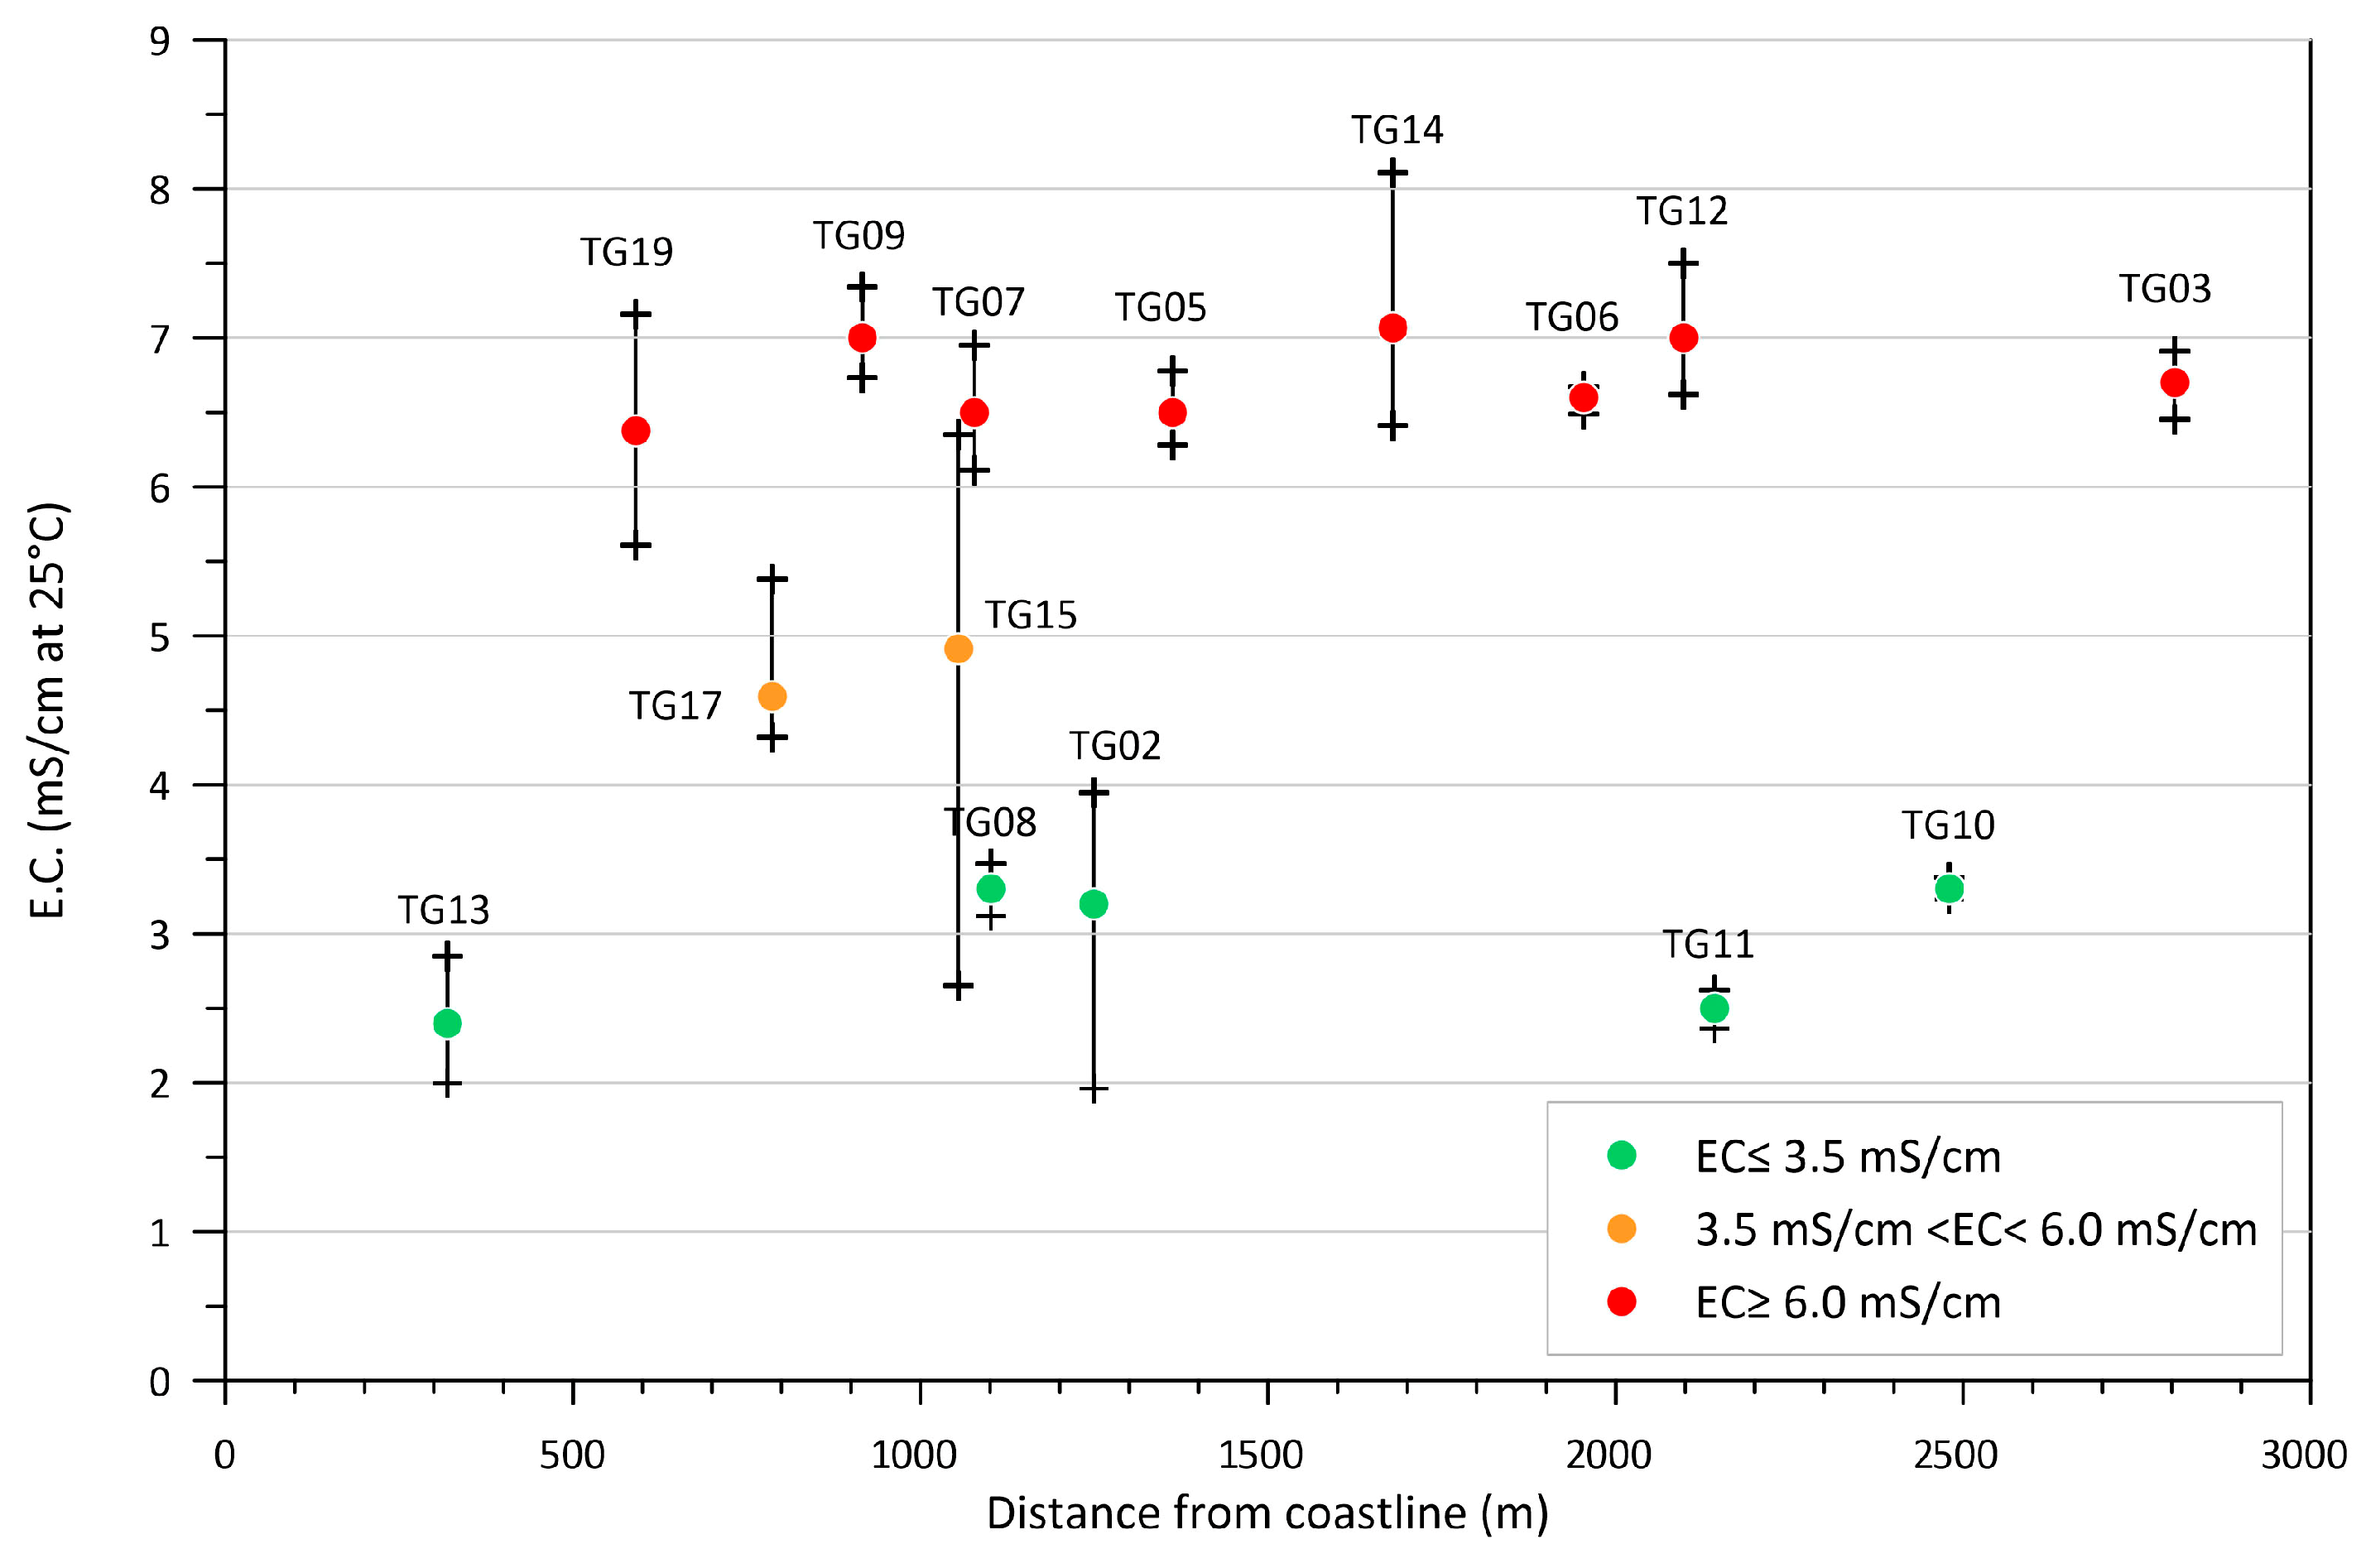
4.1. Hydrodynamic and Physicochemical Characterization

Table 3 presents the main statistics of the physicochemical parameters measured at each monitoring site during the campaigns carried out as part of this study. The pH values in all the groundwater samples ranged from 6.9 to 7.4, indicating conditions close to neutrality. Temperatures varied between 10.7 °C and 23.3 °C, while electrical conductivity (EC) spanned from 2.0 mS/cm to 8.1 mS/cm, highlighting significant spatial variations in groundwater salinity.
Generally, the min–max EC values in Table 3 differ by around 1.0 mS/cm, allowing us to hypothesize a moderate variability of such parameter in almost all the groundwater monitoring wells. The average EC column in Table 3 reports values from previous campaigns of 2019, when available, next to those more recent. The average values slightly differ from period to period, verifying the above hypothesis. Contrary to expectations, plotting the average EC values at each monitoring well against their respective distances from the coastline revealed no apparent negative correlation between the two parameters (Figure 4).
The evident lack of spatial structure in the salinization of samples across the studied area suggests a second potential cause of groundwater salinization, which is diffused throughout the same region and may be more dominant than seawater intrusion. This process is known as “salt recycling from irrigation” and occurs when salinized irrigation water is applied to crops during the dry season, releasing salts into the soil. During the wet season, precipitation infiltrates the soil, dissolves these salts, and transports them to the groundwater. Subsequently, the saline groundwater is pumped out for further irrigation, creating a cycle of continuous salt recycling between the soil and groundwater, leading to salinity growth in both.
Furthermore, we can group the wells by average EC values: a first group characterized by values greater than 6.5 mS/cm (wells TG03-TG05-TG06-TG07-TG09-TG12), a second group with values smaller than 3.5 mS/cm (TG02-TG08-TG10-TG11-TG13), and a third one with intermediate values (TG15-TG17). The map displaying the positions of the classified monitoring sites (Figure 5) reveals that those most salinized were all lined perpendicularly to the coast, in the central part of the study area and that most salinized (TG06) and less salinized (TG10) wells lay at the same distance from the sea or very close to each other (TG07 and TG08). This allows us to hypothesize other factors influencing the salinity of the samples, such as the different well depths or the high rock anisotropy, which can lead the monitoring wells to intercept different groundwater levels or flow paths.
The electrical conductivity (EC) log recorded at well TG14, located at the innermost part of the transect, appears to support this hypothesis by revealing a vertical salinity stratification that increased with depth (Figure 6).
Specifically, the log identified three distinct levels: the first, extending to a depth of one meter below the water table, with EC values ranging from 7.0 to 7.5 mS/cm; the second, reaching the depth of 21 m, characterized by a constant EC value of 7.5 mS/cm; and the third, extending to the bottom of the well, where EC values rose to 8.5 mS/cm or higher. Similarly, the temperature log indicated an approximate 0.5 °C decrease within the first meter below the water table, remained nearly constant at around 18.8 °C down to a depth of 21 m, and then exhibited a slight increase toward the bottom of the well (Figure 6).
Concerning the pond (Pond), the pH still revealed an almost stationary condition close to neutrality. Regarding the other two physicochemical parameters (i.e., temperature and EC) in Table 3, they ranged from 10 °C to 18 °C, with an average value of 15 °C, and from 7.0 mS/cm to 10 mS/cm, with an average value of 8.5 mS/cm, respectively. Nevertheless, data from the continuous monitoring carried out within the pond vastly improved the knowledge of the system. A detailed description of such a dataset will be provided in the following. As previously mentioned, the time series analysis of water level, temperature, and electrical conductivity (EC) were recorded at the three sites equipped for continuous monitoring. These parameters were measured every three hours from November 2022 to March 2025 along a hydrogeological transect passing through the central part of the study area (Figure 3). Figure 7, Figure 8 and Figure 9 present the one-week moving averages of these parameters compared with daily precipitation at the three monitoring sites over the observation period.
Figure 7 shows the temperature (T), water level, and EC values recorded in well TG14 by a probe positioned at a depth of approximately 6.5 m below the free water surface. The water level related well to precipitation, rising consistently following significant rainfall events and declining during the dry periods, even with extensive water extraction for irrigation. Throughout the observation period, it fluctuated between a minimum of around 2.5 m ASL in August 2024 and a maximum of approximately 2.9 m ASL in December 2022. Plot in Figure 7 indicates a nearly constant EC during dry periods and a slight increase during wet periods. Once more, this suggests a potential direct influence of water infiltrating from the soil on groundwater salinity.
Figure 8 shows the same parameters of Figure 7 recorded in well TG19. This well was a rectangular dug hole measuring about 2.0 by 1.0 m and approximately 3.5 m deep, intercepting the shallow part of the aquifer. The probe was positioned approximately one meter below the free water surface. Contrary to TG14, the temperature varied from 13 °C in winter to 21 °C in summer, reflecting the characteristics of the well. Even in this well, the water level related well to precipitation, rising consistently following significant rainfall and decreasing during the dry periods. Throughout the observation period, it fluctuated between a minimum of around 1.6 m ASL in August 2024 and a maximum of approximately 2.9 m ASL in January 2023.
Even for this monitoring well, the EC increased during the wet periods and remained nearly constant during the dry periods. It is significant to note that, although wells TG14 and TG19 showed similar general behavior for water level and EC, they represent two different field conditions. First, they were positioned at very different distances from the sea: TG14 was 1700 m from the coastline, while TG19 was 600 m from the coastline, more than 1.0 km downstream of the former along the transect. The water table was 13.0 m and 1.5 m below the ground at the former and the latter, respectively. TG14 was drilled to a depth of approximately 25.0 m, while TG19 was dug to no more than 4 m deep. Finally, TG14 was surrounded by cultivated land, while TG19 was in the middle of a Mediterranean scrub area. Salinization in TG19, which intercepted already salinized water from upstream, can still be attributed to the combined effects of seawater intrusion and soil salt infiltration through precipitation. However, unlike TG14, the origin of soil salt around TG19 may have been primarily due to the marine aerosol deposition.
In coastal regions, salt-laden aerosols from sea spray settle onto the land surface, gradually accumulating in the soil. During rainfall events, precipitation infiltrates the soil, dissolving these accumulated salts and transporting them downward into the groundwater system. Over time, this process can contribute to groundwater salinization, particularly in areas with low natural flushing rates or limited freshwater recharge. Marine spray deposition represents a diffuse and atmospheric-driven source of coastal soil salinity, often exacerbated by climate conditions, wind patterns, and land use practices [25].
Figure 9 illustrates the water temperature, water level, and EC trends recorded in the wetland pond. It also shows, in light green, the air temperature at the BARO-Diver® probe.
The CTD-Diver® was positioned approximately 0.7 m below the pond’s water surface, corresponding to about 0.11 m below the mean sea level. Upon analyzing the graph, several observations can be made. Temperatures fluctuated over time, ranging from 6 °C to 10 °C in winter, reaching more than 30 °C in summer. Given the pond’s small size, which entailed moderate thermal inertia, the air and water temperatures showed a strong correlation. Precipitation significantly affects EC, causing a rapid decrease during rainy events, followed by an equally swift restoration to the initial value. During the summer, EC increased significantly from approximately 9.5 mS/cm to more than 13.0 mS/cm. In contrast to EC, the pond’s water level was directly correlated to precipitation, rising swiftly with significant rainfall and decreasing during dry periods because of high evaporation rates. Figure 9 illustrates a consistently low water level, around 0.55m ASL, resulting from a rapid drawdown at the onset of the two dry periods, followed by a similar rise as soon as precipitation resumed. During rainy periods, the pond level never exceeded 0.70 m ASL, a limit attributed to an outflow threshold that regulated water exchange between the pond and the shoreline.
The detailed physicochemical analysis of the monitored waters in the study area revealed significant spatial variations in salinity, with EC ranging from 2.0 mS/cm to over 10.0 mS/cm. However, the current body of knowledge does not confirm a clear salinization pattern perpendicular to the coast as expected. Data from continuous monitoring sites indicate that EC values increased during wet seasons, likely due to salt recycling processes associated with irrigation return flows and marine aerosol deposition. Given the overlapping phenomena contributing to such a pronounced and widespread salinization of the water body, we analyzed the main hydrochemical parameters in the collected samples.

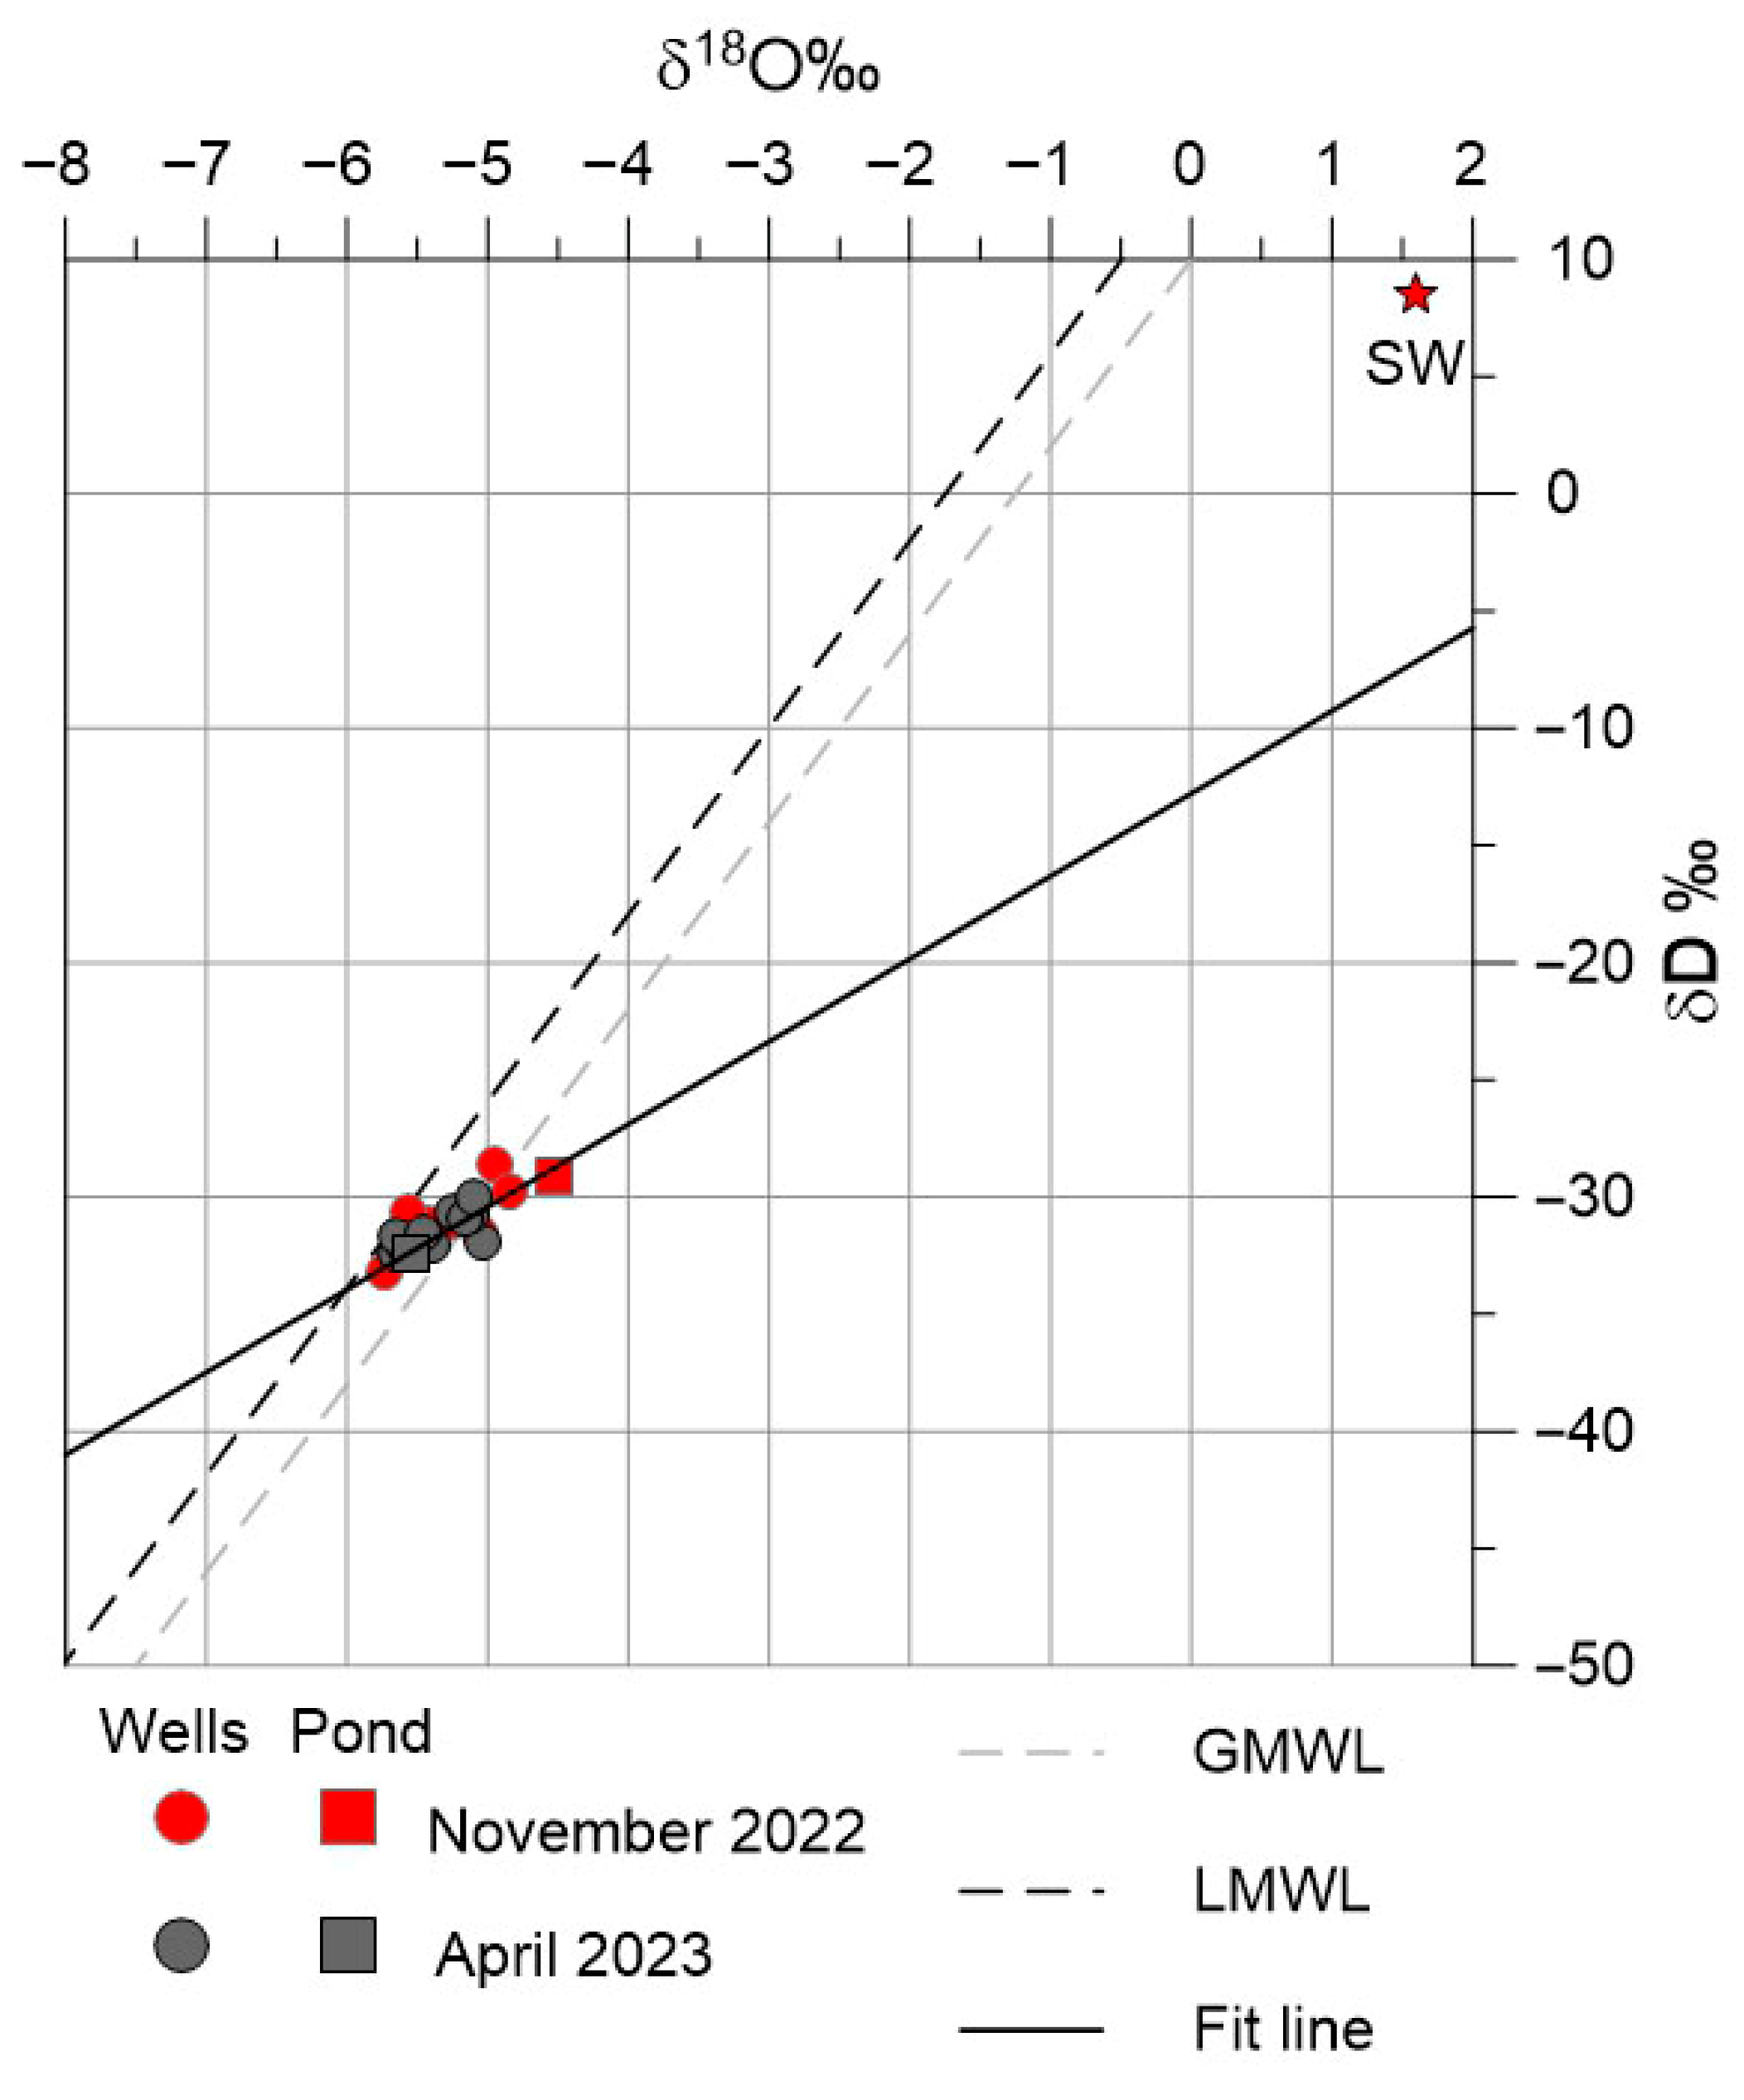
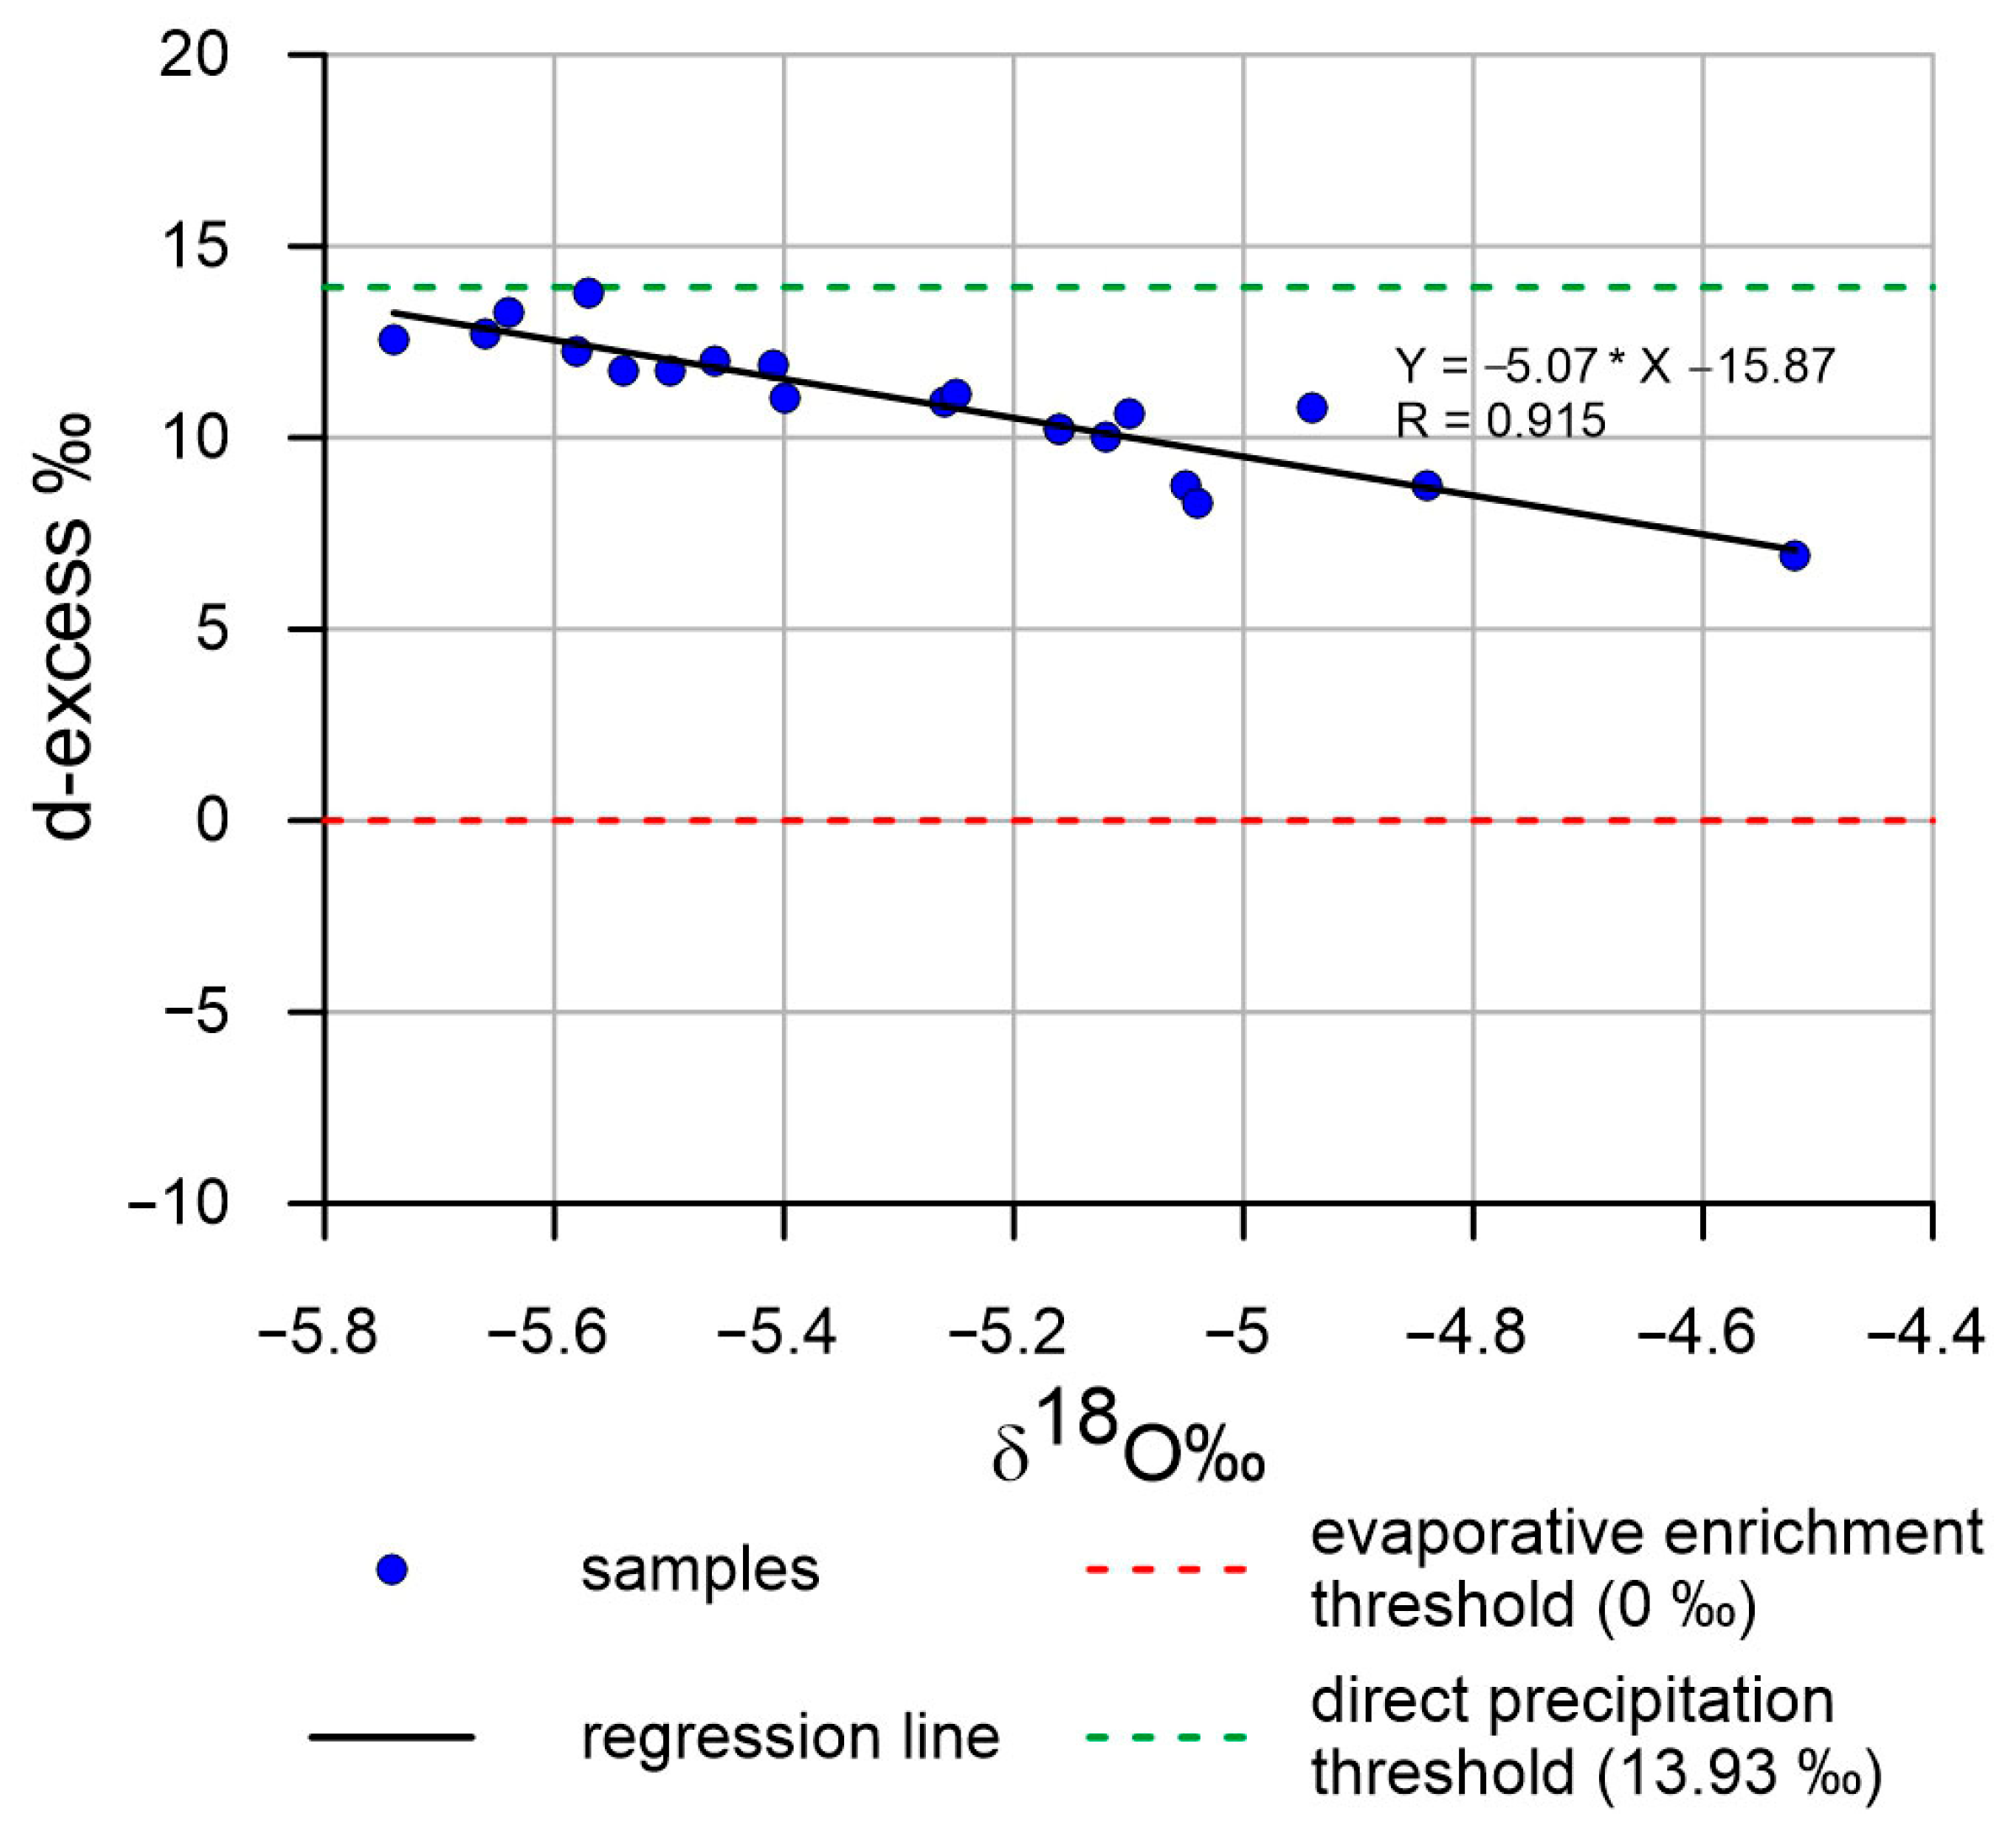
4.2. Geochemical and Isotopic Characterization

Table S1 of Supplementary Materials shows some statistics of the main hydrochemical and isotopic parameters measured at the CNR laboratories in the water samples collected over the study area. The mean values of the main salinity parameters in Table S1 are in good accordance with those of EC measured at the same monitoring sites and confirm a total absence of spatial structure. In particular, the correlation between EC and chloride, sulphate, magnesium, sodium, and potassium in groundwater is constantly higher than 0.9.
The Chebotarev diagram [26] allows us to represent the chemical analysis results, account for the major water constituents, and facilitate comparisons across different monitoring points (Figure 10). The graph also includes two end-members: seawater (SW) and freshwater (FW), as detailed in Table S1.
All sampled points are clustered around the SW end-member, indicating that the groundwater in the study area was highly salinized and characterized by a Na-Cl hydrochemical facies, with sodium and chloride being the dominant ions in the water. According to a novel approach by Fidelibus et al. [27], which defines various salinization levels within the same hydrochemical facies, more than 87% of the samples belonged to the second salinization stage, predominantly classified as B-NaCl facies. The prefix ‘B’ denotes brackish water, with chloride concentrations ranging from 1000 to 3000 mg/L. Furthermore, the samples did not align along the theoretical FW-SW mixing line but diverged toward higher Ca-Mg concentrations. These anomalies can be attributed to a rock–water interaction process within the karst aquifer [28]. Specifically, the calcium absorbed into the clayey phase, interspersed into the carbonate formations, is released into solution in exchange for dissolved sodium. This type of reaction is known as inverse exchange [29]. Finally, samples collected at the end (April) and middle (January) of the rainy period were positioned farther from the SW end-member, indicating they were slightly less salinized than those from November, at the end of the dry season.
Another useful tool to investigate groundwater salinity source is the Na+/Cl vs. Cl diagram [30,31] (Figure 11). The x-axis represents chloride concentrations (Cl, meq/L), while the y-axis shows the Na+/Cl molar ratio. A reference line at Na+/Cl = 0.86, corresponding to the theoretical ratio in seawater, is included for comparison.
Several samples plotted close to or slightly above and below this seawater line, suggesting that seawater intrusion was a major contributor to groundwater salinization in the area. However, some samples deviated from this trend. Specifically, samples with Na+/Cl ratios below 0.86 may indicate reverse cation exchange processes, where sodium is removed from the solution and replaced by calcium or magnesium. Conversely, samples with Na+/Cl ratios above 0.86 may reflect anthropogenic influences—such as the use of sodium-rich fertilizers in agriculture—or evaporative concentration, during which preferential chloride precipitation or selective retention of Cl in the unsaturated zone leads to relative enrichment of Na+. Notably, the highest Na+/Cl values were observed in the lake, where evaporation effects are undoubtedly more intense.
These findings confirm that seawater intrusion is a dominant process influencing groundwater chemistry in the area. Nonetheless, additional geochemical mechanisms—both natural and anthropogenic—also play a significant role in shaping the observed groundwater composition.
As previously stated, the stable isotopes ( δ 18 O , δ D ) of the water sampled were measured. The results are presented in Table S1. Isotope values were found to vary between −5.01 and −5.74 in δ18O with a mean of −5.35‰ (n = 19) and from −30.9 to −33.2 in δ D with a mean of −31.5‰ (n = 19). The stable isotope compositions of all investigated groundwater samples are plotted on the conventional δ18O–δD diagram (Figure 12), alongside the global meteoric water line (GMWL: δD = 8 × δ18O + 10), as defined by Craig (1961) [32], and the local meteoric water line (LMWL: δD = 7.97 × δ18O + 13.93). The LMWL was derived from a study on the isotopic composition of precipitation in the Apulia region, conducted by the National Research Council of Italy within the framework of the Tiziano project, an initiative for qualitative and quantitative groundwater monitoring funded by the Regional Administration.
The distribution of data points in the diagram provides insights into the origin and groundwater recharge mechanisms. Figure 11 reveals that only a few samples were clustered around the LMWL. The fitted data curve diverges from both the LMWL and the seawater end-member (SW), indicating notable isotopic enrichment due to evaporation, which increases the proportion of heavier isotopes in the residual water. This suggests that the aquifer recharge is not rapid, and the recharging meteoric water remains in the vadose zone for a long period.
To further investigate the influence of evaporation on groundwater recharge, isotopic analyses were performed using both δ18O and deuterium excess (d-excess) values. The d-excess was calculated using the Equation (1):
d e x c e s s = δ D 7.97 δ 18 O
based on the LMWL. This approach ensures greater accuracy, as the use of LMWL reflects the specific climatic and isotopic conditions of the study area, which may differ significantly from global averages [33,34].
The d-excess parameter is a sensitive indicator of non-equilibrium evaporation pro-cesses and is widely used to distinguish between different recharge mechanisms [35,36]. Figure 13 shows d-excess vs. δ18O in groundwater samples.
Samples in this plot can be clustered based on the d-excess value. Samples clustering near the local meteoric signature value of 13.93‰ (i.e., intercept of the LMWL) suggest minimal isotopic alteration and are likely associated with relatively rapid infiltration of precipitation, with limited exposure to evaporative conditions. In contrast, samples approaching the value of 0.00‰ indicate groundwater that has undergone significant evaporation prior to or during infiltration.
All our samples were spread in the d-excess range 13.79‰ to 6.92‰ reflecting a transitional regime, where the isotopic composition has been partially modified by evaporation, either during surface residence, infiltration through the unsaturated zone, or mixing with older, evaporated waters, indicating that most of the sampled waters does not represent neither purely direct recharge nor fully evaporated end-members.
Furthermore, the correlation between δ18O and d-excess values reveals a negative slope in the regression line, indicating a progressive evaporative trend. As δ18O becomes less negative (i.e., more enriched), d-excess values decrease, which is a typical signature of evaporation under non-equilibrium conditions. This trend may also reflect seasonal variability in recharge, where different climatic conditions influence the degree of evaporation prior to infiltration.
These findings provide robust isotopic evidence for a mixed recharge regime in the study area, where evaporation and mixing processes play a critical role in groundwater dynamics. Finally, stable isotope analyses further confirmed evaporation processes as a significant contributor to salinization, consistent with findings in other Mediterranean regions experiencing similar climatic conditions [37].

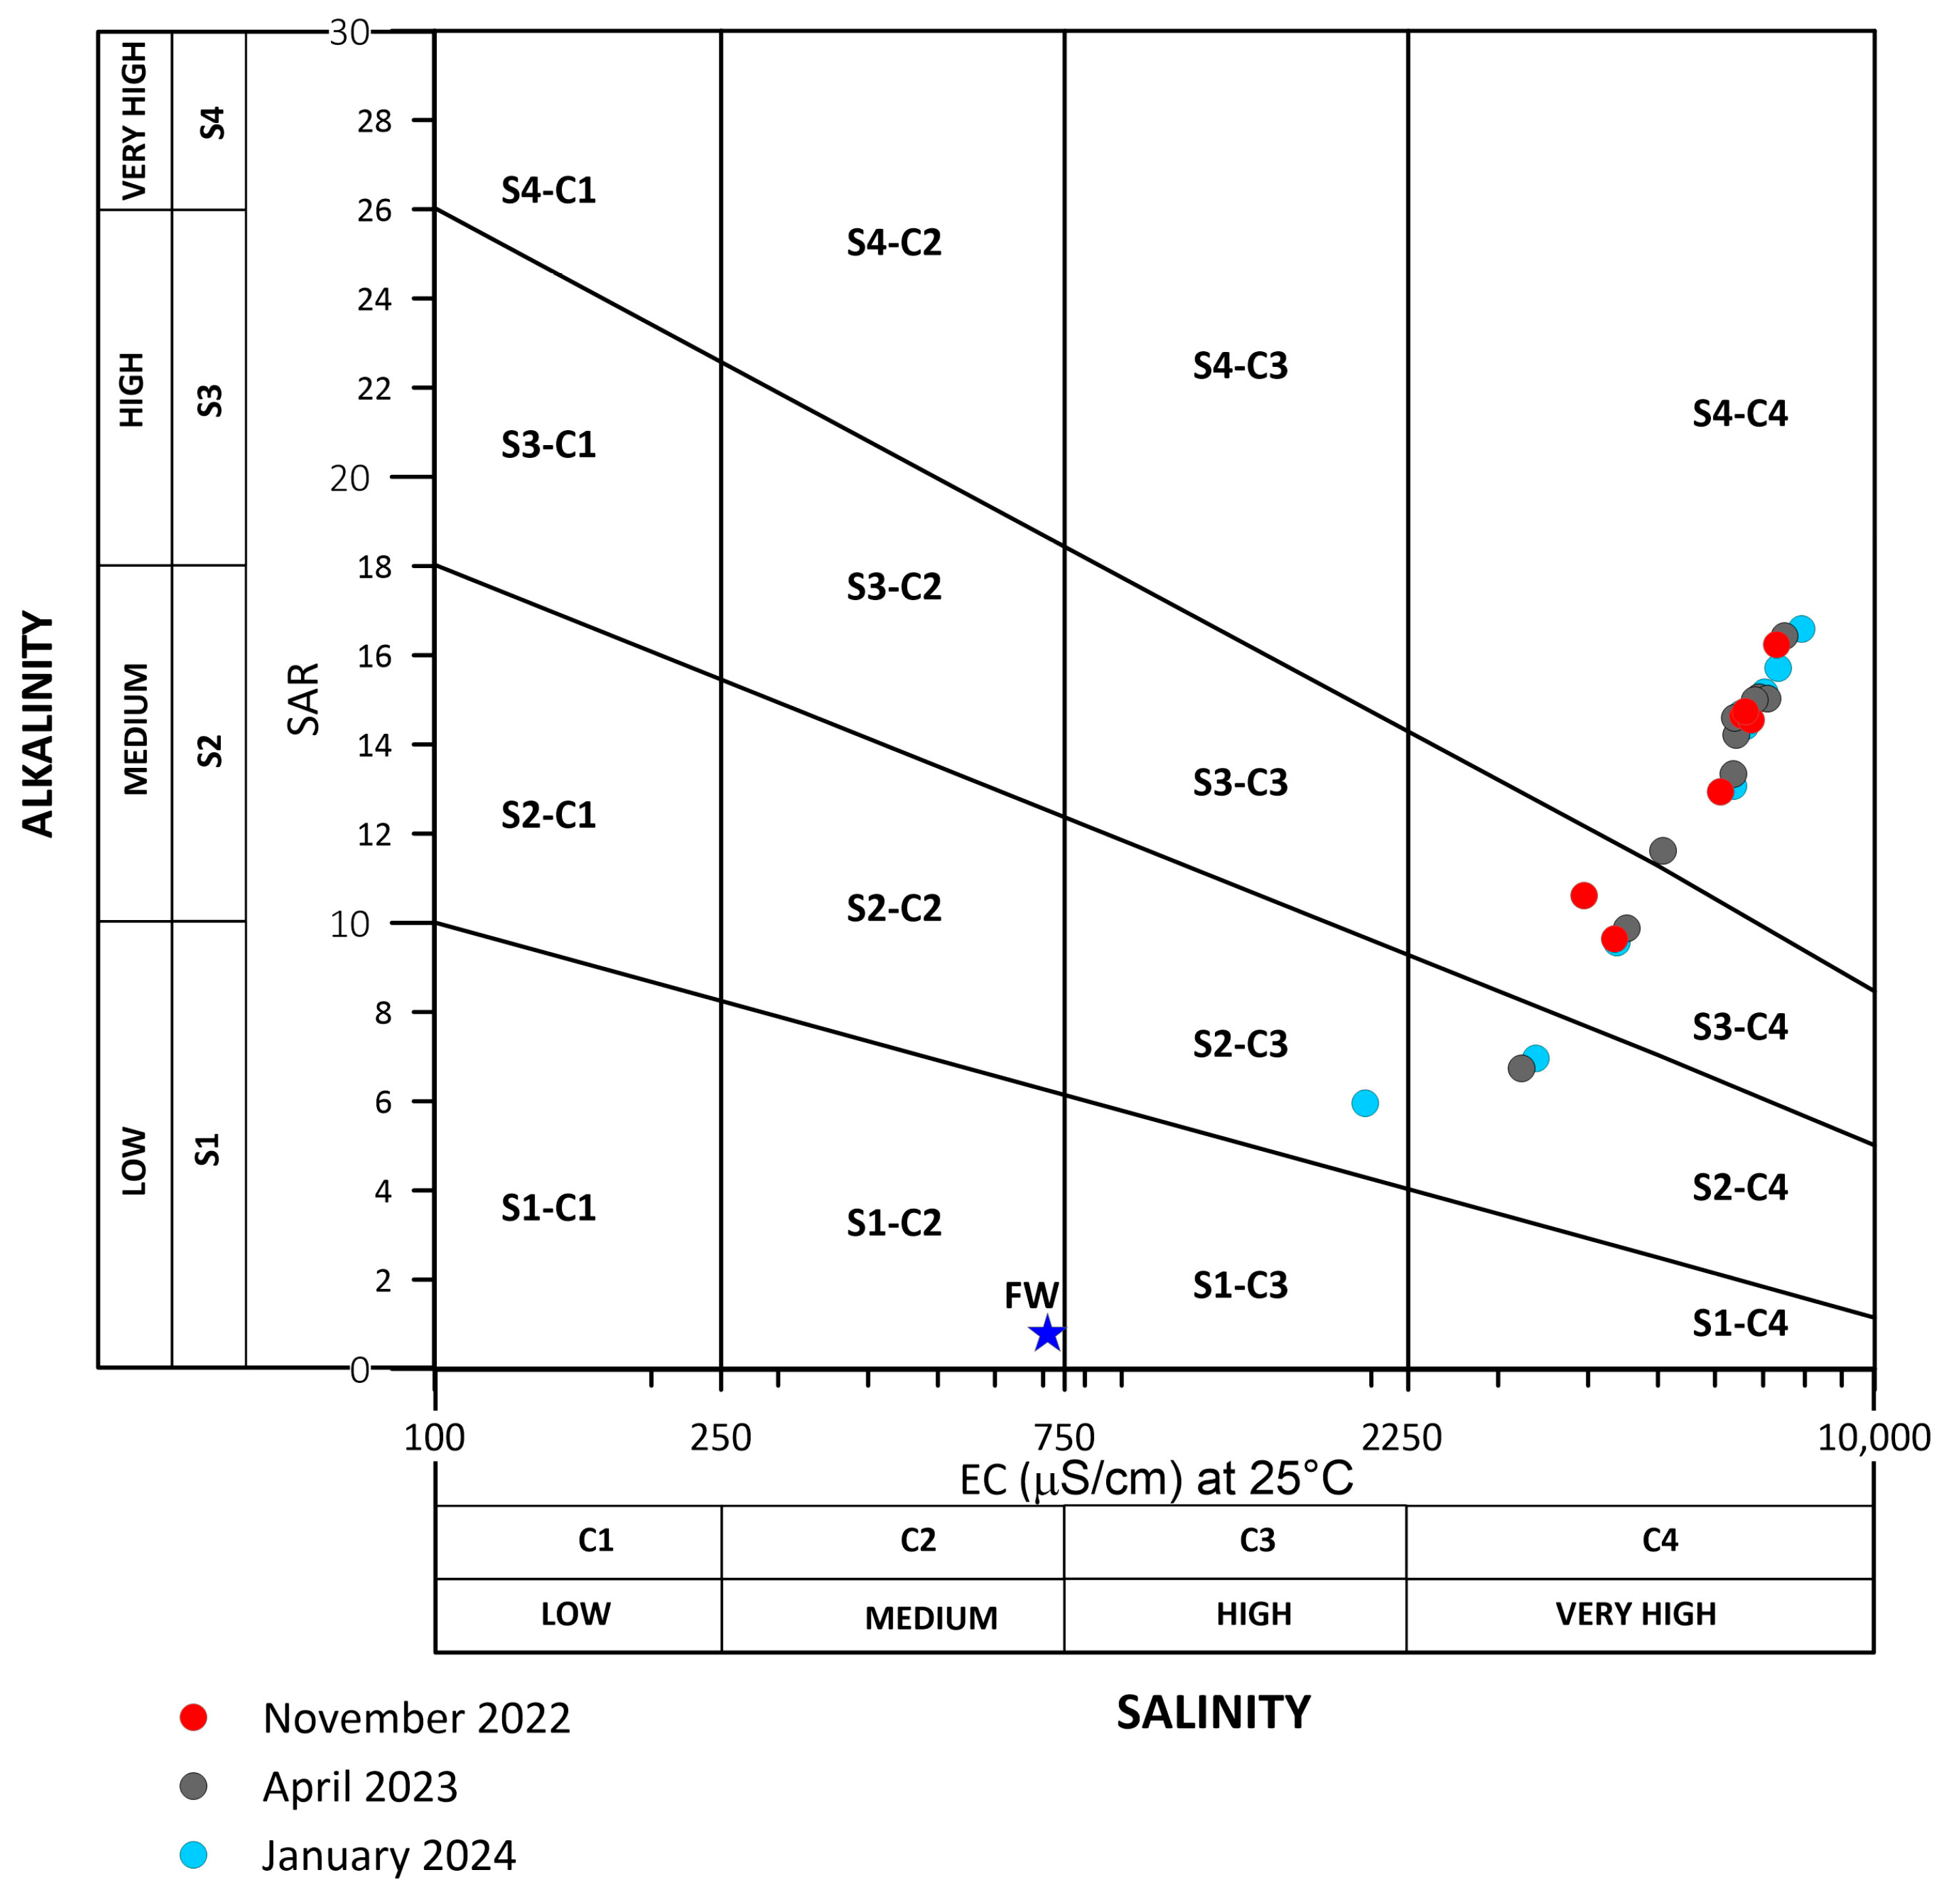
4.3. Water Quality for Irrigation

Since many monitoring wells are currently in use, their suitability for irrigation use was also assessed. It is well established that excessive salinity adversely impacts soil structure and fertility, inhibits plant growth, reduces crop yields, and disrupts microbial activity, ultimately rendering the land unsuitable for agricultural use [38]. The Wilcox diagram [39] was employed to evaluate this type of hazard. This diagram integrates salinity, expressed as EC, with the sodium adsorption ratio (SAR), the latter representing the ratio of sodium ions relative to the calcium and magnesium ions, expressed in milliequivalents per liter (meq/L) (Equation (2)).
S A R = N a + C a 2 + + M g 2 + 2
The plot in Figure 14 evidences that SAR values in the sampled water frequently exceeded 10, indicating an alkalinity hazard ranging from moderate to very high.
Concurrently, EC values consistently exceeded 2250 µS/cm, placing most samples within the S4-C4 category, corresponding to very high salinity and alkalinity risks. The remaining samples fell into the S3-C4 and S2-C4 categories, indicating very high salinity risk combined with high (S3) or moderate (S2) alkalinity risk, respectively, and into the S2-C3 category, which reflects a moderate alkalinity risk but still a high salinity hazard. Finally, it is worth noting that the FW sample exhibited excellent quality for irrigation purposes, confirming its selection as the freshwater end-member for the study area.
The high levels of salinity and alkalinity detected in the water samples compel farmers to adopt appropriate soil management practices, such as the application of gypsum (CaSO4), and highlight the urgent need for sustainable irrigation strategies, including the reuse of treated wastewater, to mitigate these adverse effects.

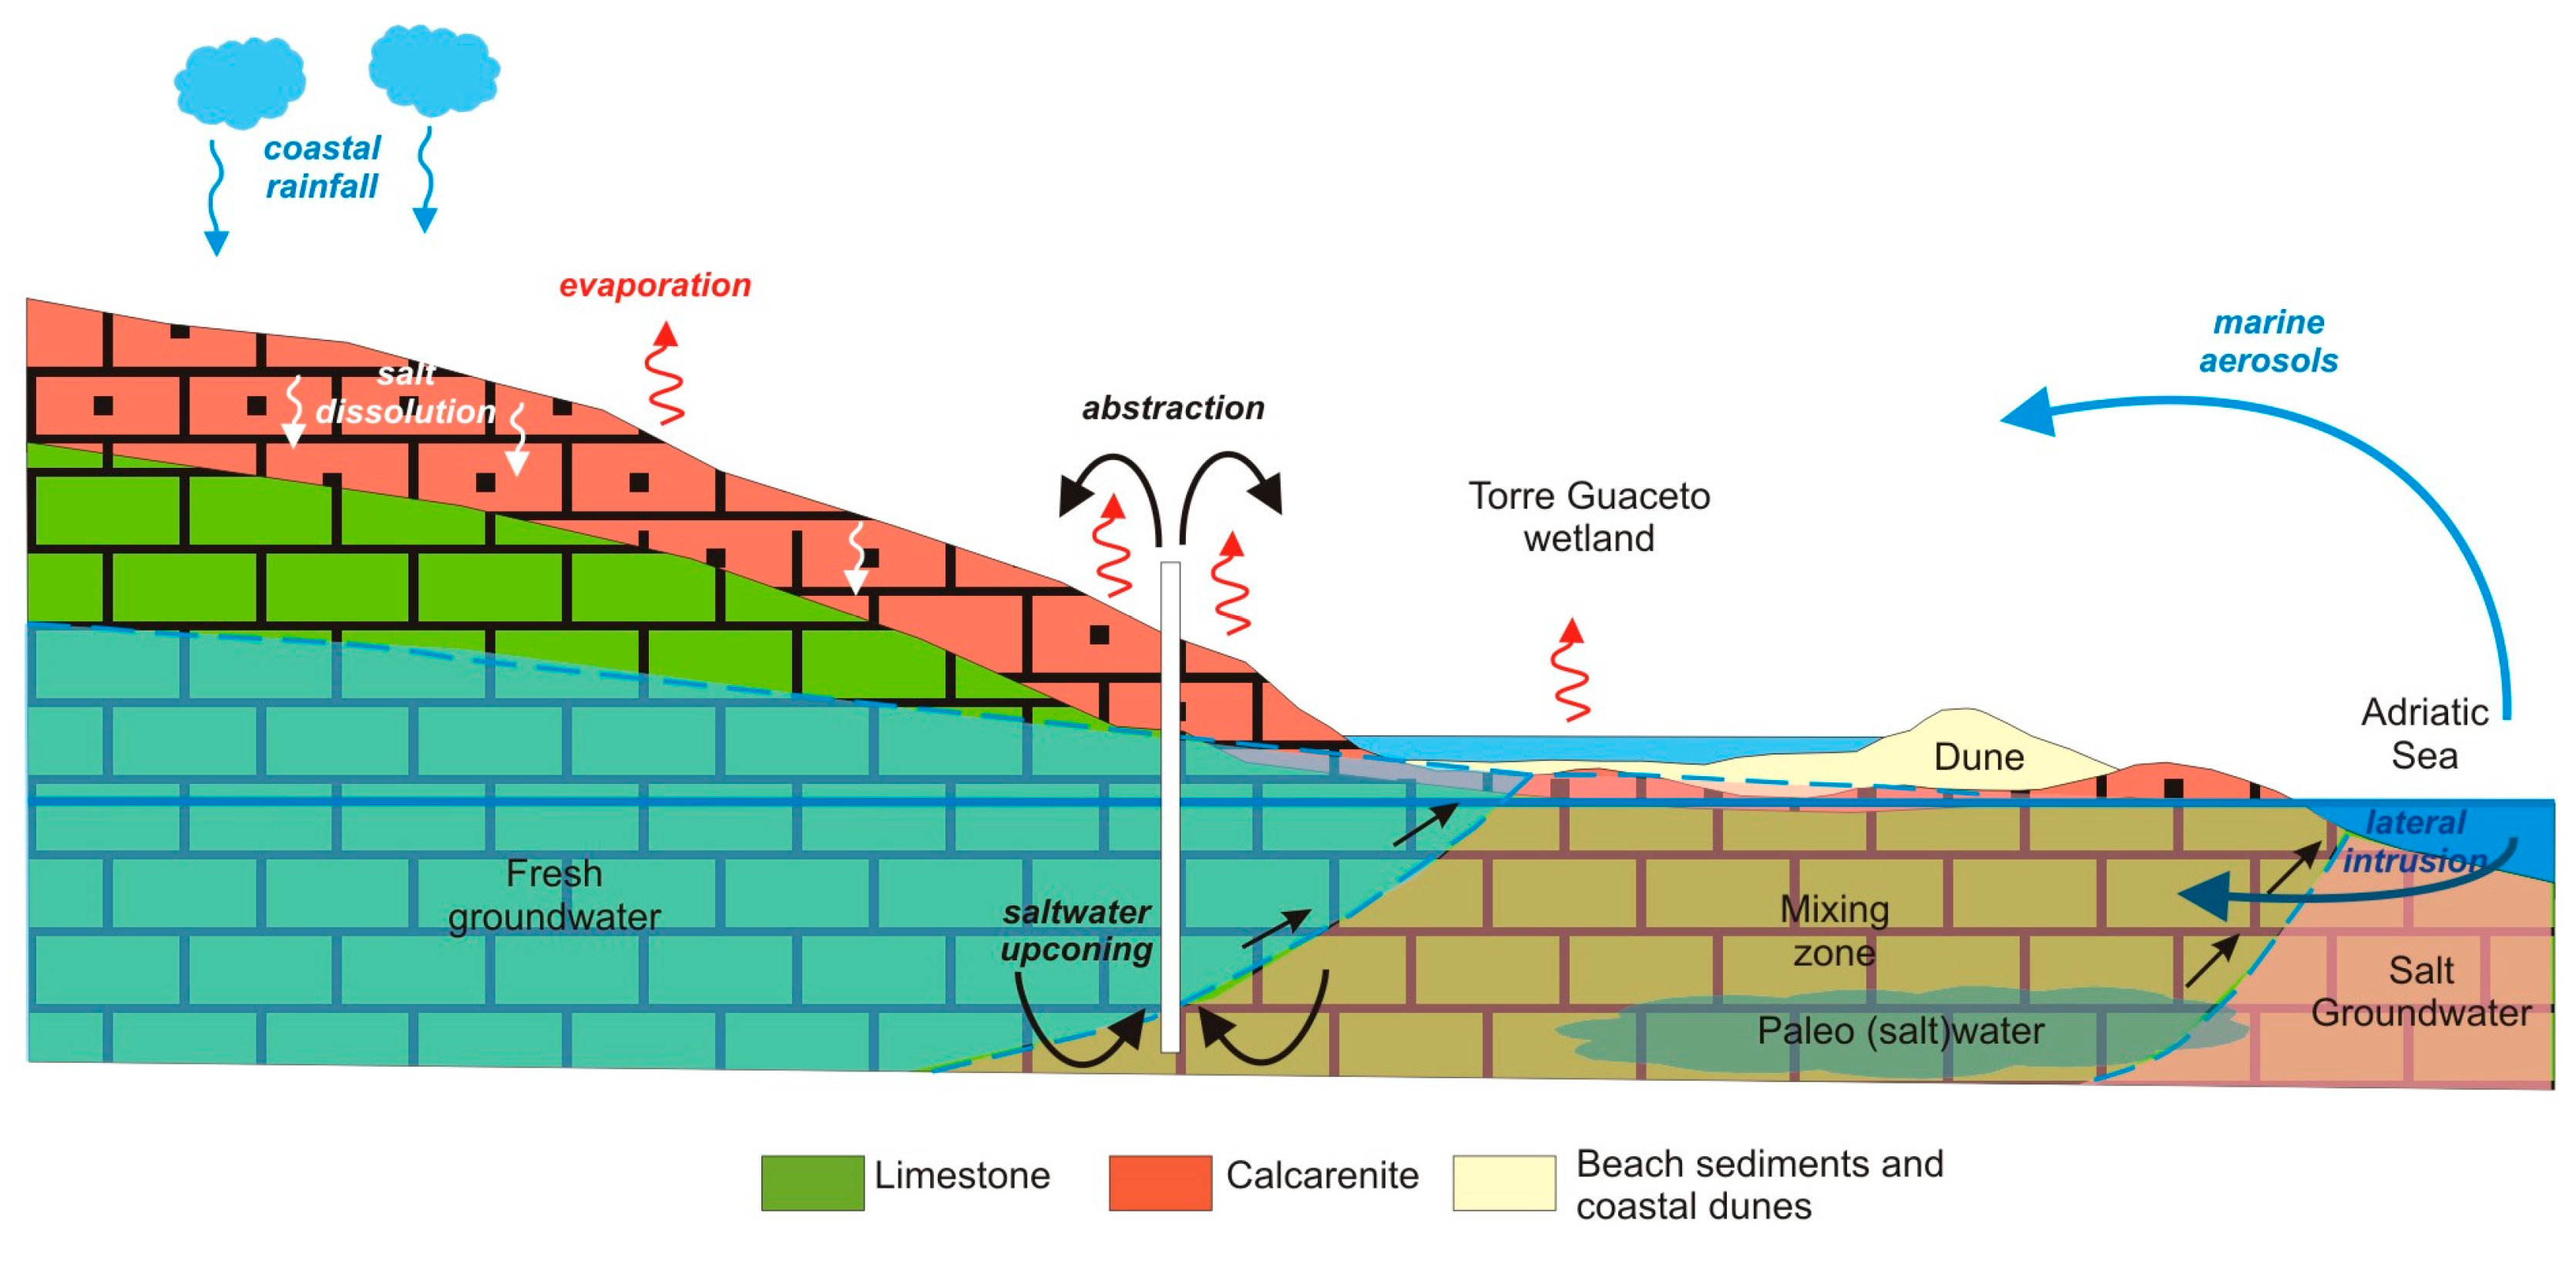
4.4. Conceptual Model, Discussion, and Management Implications

By integrating existing geological and hydrogeological data with newly acquired hydrogeochemical and isotopic evidence, this study enabled the development of a hydrogeological conceptual model for the Torre Guaceto area, synthesizing the natural and anthropogenic drivers contributing to the salinization of this vulnerable coastal ecosystem (Figure 15).
It reveals a distinct hydrogeological framework characterized by a thick, karstified carbonate aquifer composed of massive or stratified formations. Faults and fractures segment the aquifer into multiple blocks. The central portion of the study area is predominantly covered by calcarenite, which overlies the aquifer and forms a significant part of the vadose zone, especially near the coastline. Groundwater generally flows northeastward, discharging into major springs that sustain the Torre Guaceto wetland. Understanding wetland–groundwater interactions is essential for managing salinization in Mediterranean karst systems [40], especially where flow pathways are strongly influenced by the spatial distribution and orientation of faults and fractures. Freshwater floats above intruded seawater, forming a broad mixing zone. Overexploitation of groundwater for irrigation has intensified upconing, raising the fresh–saltwater interface. In addition, the repeated use of saline groundwater for irrigation and the deposition of marine aerosols have led to progressive salt accumulation in surface soil layers.
Climate change intensifies these challenges by raising temperatures and altering precipitation patterns, which collectively increase evapotranspiration and reduce aquifer recharge. Combined with rising sea levels, these processes accelerate the inland intrusion of seawater into coastal aquifers.
Geochemical and isotopic analyses confirm the complex, multifactorial nature of salinization processes affecting the Torre Guaceto aquifer. While seawater intrusion remains a dominant factor, particularly in areas with high groundwater abstraction, other processes contribute significantly. The absence of a clear spatial pattern in groundwater salinity suggests the influence of diffuse mechanisms.
One such process is salt recycling from irrigation, which occurs when salinized irrigation water is applied to crops during the dry season, releasing salt into the soil, and may be even more influential than seawater intrusion in certain parts of the study area. Another important contributor is marine spray deposition. Salt-laden aerosols from sea spray settle on the land surface and accumulate in the soil. This atmospheric-driven process is particularly relevant in coastal areas with limited natural flushing or low freshwater recharge, and may be exacerbated by prevailing wind patterns, climate variability, and land use practices. Soil-accumulated salts from the two above processes are then mobilized during the wet season by infiltrating precipitation, which transports them into the aquifer. The looped use of saline groundwater for irrigation perpetuates this cycle, leading to a progressive increase in soil and groundwater salinity.
Beyond its hydrogeological implications, salt accumulation in the soil poses a serious threat to agriculture. Monitoring data revealed elevated sodium adsorption ratio (SAR) and electrical conductivity (EC) values, which are known to degrade soil structure and fertility, inhibit plant growth, and reduce crop yields. Over time, these effects can render land unsuitable for agricultural use. Ultimately, these findings underscore the urgent need for sustainable irrigation practices and integrated salinity management strategies, both to safeguard agricultural productivity and preserve water resources and the surrounding ecosystem.
Building on these findings, several management implications and recommendations emerge. Strengthening the monitoring infrastructure is essential to detect early signs of degradation and to track spatial and temporal trends in groundwater salinity. Expanding the current network with additional wells and incorporating remote sensing technologies would enhance data resolution and support more informed decision-making. At the same time, promoting sustainable agricultural practices—such as drip irrigation, the reuse of treated wastewater, and the adoption of salt-tolerant crops—can help reduce pressure on groundwater resources and mitigate the impact of salinity on crop yields.
Furthermore, integrating climate and sea-level data into groundwater management frameworks is vital for long-term resilience. Collaborations with meteorological services and coastal researchers can support the development of predictive models and adaptive planning tools. Engaging local stakeholders, including farmers, conservation groups, and policymakers, is also crucial to ensure the successful implementation of water use strategies. Finally, further research is needed to refine the understanding of salinity sources and their interactions. Investigating the relative contributions of seawater intrusion, soil salt leaching, and atmospheric deposition—potentially through innovative tools such as passive samplers—can inform more targeted and effective mitigation strategies.

5. Conclusions

This study provides a comprehensive assessment of salinization dynamics in the Torre Guaceto coastal aquifer, revealing the complex interplay between natural processes and human activities. The integrated analysis of hydrogeological, geochemical, and isotopic data highlights seawater intrusion and irrigation-related salt recycling as the primary drivers of groundwater salinity. These processes are exacerbated by groundwater over-extraction, limited recharge, and climate-related factors such as evaporation and reduced rainfall. The findings show that elevated salinity levels pose significant risks to both the wetland ecosystem and agricultural sustainability. High EC and SAR values indicate that current water quality may compromise soil health and crop productivity, particularly for traditional crops like olives and grapes. The study underscores the urgent need for integrated groundwater management strategies that consider seawater intrusion, irrigation practices, and climate variability. Strengthening monitoring networks, promoting sustainable irrigation, and incorporating climate data into planning are essential steps toward mitigating salinization and preserving the ecological and agricultural value of the area. These insights contribute to a broader understanding of salinization in Mediterranean coastal aquifers and offer a transferable framework for sustainable water resource management in similar settings.

Supplementary Materials

The following supporting information can be downloaded at: https://www.mdpi.com/article/10.3390/environments12070227/s1, Table S1. Main statistics of the hydro-chemical and isotopic parameters measured in the laboratory from samples collected during this study.

Author Contributions

Conceptualization, G.P., R.M., M.M., M.D. and I.P.; methodology, G.P., R.M., and I.P.; validation, G.P. and R.M.; formal analysis, G.P., R.M. and I.P.; investigation, G.P., R.M., M.M., M.D. and I.P.; data curation, G.P. and R.M.; writing—original draft preparation, G.P. and R.M.; writing—review and editing, G.P., R.M. and I.P.; visualization, G.P. and R.M.; supervision, G.P. and R.M.; project administration, G.P.; funding acquisition, G.P. All authors have read and agreed to the published version of the manuscript.

Funding

Some of the research activities presented in this paper were carried out within the framework of the INTERACTION project, funded by the Belmont Forum under the Collaborative Research Action (CRA) call on the theme “Towards Sustainability of Soils and Groundwater for Society.” The project received support through a grant from the Belmont Forum, administered by the Earth System Science and Environmental Technologies Department of the National Research Council of Italy (Belmont Forum–CNR: B55F21001250007), (https://belmontforum.org/projects?fwp_project_call=soils2020, accessed on 29 May 2025).

Data Availability Statement

The data presented in this study are openly available in Zenodo at https://doi.org/10.5281/zenodo.15675832. Interaction Project—Torre Guaceto study area groundwater monitoring data (1.0.0) (dataset). The dataset is licensed under the Creative Commons Attribution 4.0 International (CC BY 4.0) license.

Acknowledgments

The authors sincerely thank the Management Consortium of Torre Guaceto, and in particular President Rocco Malatesta and Scientific Director Sandro Cicolella, for their kind hospitality and for granting the CNR team access to conduct research activities within the Torre Guaceto Marine Protected Area and Natural State Reserve (Italy).

Conflicts of Interest

The authors declare no conflicts of interest.

Abbreviations

The following abbreviations are used in this manuscript:
CNRNational Research Council of Italy
IRSAWater Research Institute (Istituto di Ricerca Sulle Acque)
IGGInstitute of Geosciences and Earth Resources (Istituto di Geoscienze e Georisorse)
ECElectrical Conductivity
FWFreshwater End-Member
SWSeawater End-Member
ASLAbove Sea Level
BGLBelow Ground Level
GMWLGlobal Meteoric Water Line
LMWLLocal Meteoric Water Line
SARSodium Adsorption Ratio

References

  1. Barbieri, M. Groundwater salinity: Origin, impact, and potential remedial measures and management solutions. Front. Water. 2023, 5, 1202576. [Google Scholar] [CrossRef]
  2. Pappa, D.; Kaliampakos, D. Unveiling the Non-Market Value of a Fragile Coastal Wetland: A CVM Approach in the Amvrakikos Gulf, Greece. Environments 2025, 12, 59. [Google Scholar] [CrossRef]
  3. Middleton, B.A.; Boudell, J. Salinification of coastal wetlands and freshwater management to support resilience. Ecosyst. Health Sustain. 2023, 9, 0083. [Google Scholar] [CrossRef]
  4. Zhang, Y.; Li, W.; Sun, G.; King, J.S. Coastal wetland resilience to climate variability: A hydrologic perspective. J. Hydrol. 2019, 568, 275–284. [Google Scholar] [CrossRef]
  5. Agbasi, J.C.; Abu, M.; Pande, C.B.; Uwajingba, H.C.; Abba, S.I.; Egbueri, J.C. Groundwater Salinization in Coastal Regions and the Control Mechanisms: Insights for Sustainable Groundwater Development and Management. In Sustainable Groundwater and Environment: Challenges and Solutions; Li, P., He, X., Wu, J., Elumalai, V., Eds.; Springer Nature: Cham, Switzerland, 2025; pp. 165–191. [Google Scholar] [CrossRef]
  6. Mastrocicco, M.; Colombani, N. The issue of groundwater salinization in coastal areas of the Mediterranean region: A review. Water 2021, 13, 90. [Google Scholar] [CrossRef]
  7. Huang, G.; Li, L. Groundwater Chemistry and Quality in Coastal Aquifers. Water 2024, 16, 2041. [Google Scholar] [CrossRef]
  8. Zaccaria, D.; Passarella, G.; D’Agostino, D.; Giordano, R.; Solis, S.S. Risk Assessment of Aquifer Salinization in a Large-Scale Coastal Irrigation Scheme, Italy. Clean-Soil Air Water 2016, 44, 371–382. [Google Scholar] [CrossRef]
  9. Passarella, G.; Bruno, D.; Lay-Ekuakille, A.; Maggi, S.; Masciale, R.; Zaccaria, D. Spatial and temporal classification of coastal regions using bioclimatic indices in a Mediterranean environment. Sci. Total Environ. 2020, 700, 134415. [Google Scholar] [CrossRef]
  10. Doglioni, A.; Simeone, V. Effects of climatic changes on groundwater availability in a semi-arid Mediterranean region. In IAEG/AEG Annual Meeting Proceedings, San Francisco, California, 2018; Shakoor, A., Cato, K., Eds.; Springer Nature: Cham, Switzerland, 2019; Volume 4, pp. 105–110. [Google Scholar] [CrossRef]
  11. Kreis, M.B.; Taupin, J.D.; Patris, N.; Lachassagne, P.; Vergnaud-Ayraud, V.; Burte, J.D.P.; Leduc, C.; Martins, E.S.P.R. Multidisciplinary approach to understand the salinization of fractured crystalline aquifers in semi-arid region. Proc. IAHS 2024, 385, 393–398. [Google Scholar] [CrossRef]
  12. Martínez-Santos, P.; Sánchez-Alcón, A. Assessment of groundwater–surface water interactions in a Mediterranean wetland using hydrological and isotopic tools. Water 2022, 14, 345. [Google Scholar] [CrossRef]
  13. Passarella, G.; Barca, E.; Sollitto, D.; Masciale, R.; Bruno, D.E. Cross-calibration of two independent groundwater balance models and evaluation of unknown terms: The case of the shallow aquifer of “Tavoliere di Puglia” (South Italy). Water Resour. Manag. 2017, 31, 327–340. [Google Scholar] [CrossRef]
  14. Frollini, E.; Parrone, D.; Ghergo, S.; Masciale, R.; Passarella, G.; Pennisi, M.; Preziosi, E. An integrated approach for investigating the salinity evolution in a Mediterranean coastal karst aquifer. Water 2022, 14, 1725. [Google Scholar] [CrossRef]
  15. Polemio, M. Monitoring and management of karstic coastal aquifers in Apulia (southern Italy). Water 2016, 8, 148. [Google Scholar] [CrossRef]
  16. Portoghese, I.; Brigida, S.; Masciale, R.; Passarella, G. Assessing transmission losses through ephemeral streams: A methodological approach based on the infiltration of treated effluents released into streams. Water 2022, 14, 3758. [Google Scholar] [CrossRef]
  17. Tozzi, M. Assetto tettonico dell’avampaese apulo meridionale (Murge meridionali—Salento) sulla base di dati strutturali. Geol. Romana 1993, 29, 95–111. [Google Scholar]
  18. Ciaranfi, N.; Pieri, P.; Ricchetti, G. Note alla carta geologica delle Murge e del Salento (Puglia centromeridionale). Mem. Soc. Geol. Ital. 1988, 41, 449–460. [Google Scholar]
  19. Fidelibus, M.D.; Tulipano, L.; D’Amelio, P. Convective thermal field reconstruction by ordinary kriging in karstic aquifers (Puglia, Italy): Geostatistical analysis of anisotropy. In Advances in Research in Karst Media; Carrasco, F., Valsero, J.J.D., LaMoreaux, J.W., Eds.; Springer: Berlin/Heidelberg, Germany, 2010; pp. 203–208. Available online: https://www.researchgate.net/publication/227131699_Convective_Thermal_Field_Reconstruction_by_Ordinary_Kriging_in_Karstic_Aquifers_Puglia_Italy_Geostatistical_Analysis_of_Anisotropy (accessed on 20 June 2025).
  20. Maggiore, M.; Pagliarulo, P. Circolazione idrica ed equilibri idrogeologici negli acquiferi della Puglia. Geol. Territ. 2004, 1, 13–35. [Google Scholar]
  21. Cotecchia, V.; Grassi, D.; Polemio, M. Carbonate aquifers in Apulia and seawater intrusion. G. Geol. Appl. 2005, 1, 219–231. [Google Scholar]
  22. Basset, A.; Sangiorgio, F.; Pinna, M. Monitoring with benthic macroinvertebrates: Advantages and disadvantages of body size descriptors. Aquat. Conserv. Mar. Freshw. Ecosyst. 2004, 14, S43–S58. [Google Scholar] [CrossRef]
  23. Lapietra, I.; Lisco, S.; Mastronuzzi, G.; Milli, S.; Pierri, C.; Sabatier, F.; Scardino, G.; Moretti, M. Morpho-sedimentary dynamics of Torre Guaceto beach (Southern Adriatic Sea, Italy). J. Earth Syst. Sci. 2022, 131, 64. [Google Scholar] [CrossRef]
  24. Milnes, E.; Renard, P. The problem of salt recycling and seawater intrusion in coastal irrigated plains: An example from the Kiti aquifer (Southern Cyprus). J. Hydrol. 2004, 288, 327–343. [Google Scholar] [CrossRef]
  25. Manca, F.; Capelli, G.; Tuccimei, P. Sea salt aerosol groundwater salinization in the Litorale Romano Natural Reserve (Rome, Central Italy). Environ. Earth Sci. 2015, 73, 4179–4190. [Google Scholar] [CrossRef]
  26. Chebotarev, I.I. Metamorphism of natural waters in the crust of weathering. Geochim. Cosmochim. Acta 1955, 8, 22–48. [Google Scholar] [CrossRef]
  27. Fidelibus, M.D.; Balacco, G.; Alfio, M.R.; Arfaoui, M.; Bassukas, D.; Güler, C.; Tziritis, E. A chloride threshold to identify the onset of seawater/saltwater intrusion and a novel categorization of groundwater in coastal aquifers. J. Hydrol. 2025, 653, 132775. [Google Scholar] [CrossRef]
  28. Salvadori, M.; Pennisi, M.; Masciale, R.; Fidelibus, M.D.; Frollini, E.; Ghergo, S.; Parrone, D.; Preziosi, E.; Passarella, G. Isotopic study for evaluating complex groundwater circulation patterns, hydrogeological zoning, and water-rock interaction in a Mediterranean coastal karst environment. Sci. Total Environ. 2024, 955, 176850. [Google Scholar] [CrossRef] [PubMed]
  29. Giménez, E.; Morell, I. Hydrogeochemical analysis of salinization processes in the coastal aquifer of Oropesa (Castellón, Spain). Environ. Geol. 1997, 29, 118–131. [Google Scholar] [CrossRef]
  30. Tiwari, A.K.; Pisciotta, A.; De Maio, M. Evaluation of groundwater salinization and pollution level on Favignana Island, Italy. Environ. Pollut. 2019, 249, 969–981. [Google Scholar] [CrossRef]
  31. Abu-Alnaeem, M.F.; Yusoff, I.; Ng, T.F.; Alias, Y.; Raksmey, M. Assessment of groundwater salinity and quality in Gaza coastal aquifer, Gaza Strip, Palestine: An integrated statistical, geostatistical and hydrogeochemical approaches study. Sci. Total Environ. 2018, 615, 972–989. [Google Scholar] [CrossRef]
  32. Craig, H. Isotopic variations in meteoric waters. Science 1961, 133, 1702–1703. [Google Scholar] [CrossRef]
  33. Casellas, E.; Latron, J.; Cayuela, C.; Bech, J.; Udina, M.; Sola, Y.; Llorens, P. Moisture origin and characteristics of the isotopic signature of rainfall in a Mediterranean mountain catchment (Vallcebre, eastern Pyrenees). J. Hydrol. 2019, 575, 767–779. [Google Scholar] [CrossRef]
  34. Kendall, C.; McDonnell, J.J. (Eds.) Isotope Tracers in Catchment Hydrology; Elsevier: Amsterdam, The Netherlands, 2012. [Google Scholar]
  35. Liu, F.; Hu, X.; Zhen, P.; Zou, J.; Zhang, J. Characterizing groundwater recharge sources within reduced pumped aquifers in the Heilonggang region, North China Plain. J. Geochem. Explor. 2023, 247, 107176. [Google Scholar] [CrossRef]
  36. Clark, I.D.; Fritz, P. Environmental Isotopes in Hydrogeology; CRC Press: Boca Raton, FL, USA, 2013. [Google Scholar]
  37. Benettin, P.; Volkmann, T.H.M.; von Freyberg, J.; Frentress, J.; Penna, D.; Dawson, T.E.; Kirchner, J.W. Effects of climatic seasonality on the isotopic composition of evaporating soil waters. Hydrol. Earth Syst. Sci. 2018, 22, 2881–2890. [Google Scholar] [CrossRef]
  38. Tarolli, P.; Luo, J.; Park, E.; Barcaccia, G.; Masin, R. Soil salinization in agriculture: Mitigation and adaptation strategies combining nature-based solutions and bioengineering. iScience 2024, 27, 108830. [Google Scholar] [CrossRef] [PubMed]
  39. Wilcox, L. Classification and Use of Irrigation Waters; US Department of Agriculture: Washington, DC, USA, 1955; Circular No. 969; 19p.
  40. Pérez-Martín, M.Á.; Pulido-Velazquez, M. Comparative analysis of runoff and evaporation assessment methods to evaluate wetland–groundwater interaction in Mediterranean evaporitic-karst aquatic ecosystem. Water 2021, 13, 1482. [Google Scholar] [CrossRef]
Figure 1. Map of the Torre Guaceto State Reserve, illustrating the location of the wetland, Canale Reale river, and surrounding ecosystems.
Environments 12 00227 g001
Figure 2. (a) Geological map focusing on the main formations outcropping in the study area (modified after [18]); (b) hydrogeological section.
Environments 12 00227 g002
Figure 3. Groundwater monitoring network in the Torre Guaceto area.
Environments 12 00227 g003
Figure 4. Scatterplot of the average, min, and max EC values at each monitoring well plotted against their corresponding distances from the coastline.
Environments 12 00227 g004
Figure 5. Spatial distribution of EC values measured at the monitoring points.
Environments 12 00227 g005
Figure 6. Electrical conductivity and temperature vertical logs in well TG14.
Environments 12 00227 g006
Figure 7. One-week moving averages of temperature (T), electrical conductivity (EC), and water levels, compared to daily precipitation in well TG14.
Environments 12 00227 g007
Figure 8. One-week moving averages of temperature (T), electrical conductivity (EC), and water levels, compared to daily precipitation in well TG19.
Environments 12 00227 g008
Figure 9. One-week moving averages of water temperature (dark green), air temperature at the BARO-Diver® probe (light green) (T), electrical conductivity (EC), and water levels, compared to daily precipitation in the pond.
Environments 12 00227 g009
Figure 10. Chebotarev’s classification diagram of groundwater samples collected during monitoring campaigns.
Environments 12 00227 g010
Figure 11. Ionic ratio Na/Cl versus Cl.
Environments 12 00227 g011
Figure 12. δ D versus δ 18 O relationship for groundwater in the study area.
Environments 12 00227 g012
Figure 13. d-excess vs. δ 18 O relationship for groundwater in the study area.
Environments 12 00227 g013
Figure 14. Wilcox diagram for irrigation water quality assessment.
Environments 12 00227 g014
Figure 15. Hydrogeological conceptual model of the Torre Guaceto area.
Environments 12 00227 g015
Table 1. Torre Guaceto monitoring sites.
NameType
of Well
SamplingCoordinate XCoordinate YGround
Elevation
Distance from
Coastline
Reference Point
Elevation
Water
Table
Well
Depth *
DDDDm ASLmm ASLm ASLm BGL
TG02DrilledPump17.7686840.7102315.01249.11--20–25
TG03DrilledPump17.7611440.6974345.02803.94--20–25
TG05DrilledPump17.7787040.7065612.01362.8812.541.9720–25
TG06DrilledPump17.7798140.6997819.01954.23--20–25
TG07DrilledPump17.7805340.7090211.01077.18--20–25
TG08DugBailer17.7789540.7086411.01101.1811.000.9920–25
TG09DrilledPump17.7894840.705618.0916.69--20–25
TG10DrilledPump17.7920240.6855721.02479.80--20–25
TG11DrilledPump17.8004540.6849320.02142.64--20–25
TG12DrilledPump17.7783340.6991319.02097.45--20–25
TG13DugBailer17.7643040.7219513.0319.5213.483.1720–25
TG14DrilledPump17.7739940.7034215.01679.3815.702.6725.0
TG15DrilledPump17.8153040.6904010.01054.38--20–25
TG17DrilledPump17.8093640.695025.0786.46--20–25
TG19DugBailer17.7878740.711973.0590.203.351.754.0
PondPondBailer17.7951640.714391.2180.00-0.61-
FWDrilledPump17.6579540.69329135.08286.00---
SWSeaBailer17.7962540.7159700.00---
BAROAir-17.7997840.71514-----
* The depths of wells TG14 and TG19 BGL are known. For the remaining wells, mostly equipped with pumps, direct depth measurements were not feasible. The depths generally range between 20 m and 25 m BGL, according to information provided by the well owners.
Table 2. Monitoring campaigns.
CampaignPeriodType of Monitoring
On-SiteSampling
IApril 2022x
IIJune–July 2022x
IIIOctober–November 2022xx
IVJanuary 2023x
VApril 2023xx
VIJune 2023x
VIIOctober–November 2023x
VIIIJanuary 2024xx
IXJuly 2024x
Table 3. Main statistics of the on-site measured parameters. The EC values reported in brackets originate from a 2019 Torre Guaceto Consortium monitoring campaign. (*) Hydrochemical parameters in samples from these monitoring sites were also analyzed at the CNR laboratories.
Monitoring SitepHT (°C)EC (mS/cm at 25 °C)
nMeanminmaxnMeanminmaxnMeanminmax
TG02 *27.27.17.2518.918.519.253.2 (3.5)2.04.0
TG03 *37.17.17.2518.918.419.856.7 (6.8)6.56.9
TG05----319.719.320.036.5 (7.0)6.36.8
TG06----219.119.019.126.6 (7.0)6.56.7
TG07 *37.17.07.2518.918.019.456.5 (6.7)6.17.0
TG08----217.517.317.623.3 (3.5)3.13.5
TG09 *37.17.07.1419.117.920.047.0 (6.4)6.77.3
TG10 *27.17.07.2416.810.719.243.3 (3.6)3.23.4
TG11----220.720.221.122.5 (2.4)2.42.6
TG12 *37.07.07.1519.018.719.557.0 (7.3)6.67.5
TG13----318.317.618.732.4 (3.1)2.02.9
TG14 *37.27.17.4418.717.420.147.16.48.1
TG15----318.718.419.034.92.76.4
TG17 *37.17.07.3818.314.020.184.64.35.4
TG19 *37.16.97.3517.714.423.356.45.67.2
Groundwater-7.16.97.4-18.710.723.3-5.22.08.1
Pond *37.57.47.5314.99.718.638.57.19.7
FW *16.9--116.0--10.7--
SW *18.1--118.5--152.6--
Disclaimer/Publisher’s Note: The statements, opinions and data contained in all publications are solely those of the individual author(s) and contributor(s) and not of MDPI and/or the editor(s). MDPI and/or the editor(s) disclaim responsibility for any injury to people or property resulting from any ideas, methods, instructions or products referred to in the content.

