Next Article in Journal
Modeling Air Pollution in Metropolitan Lima: A Statistical and Artificial Neural Network Approach
Previous Article in Journal
Reviewing Treatment Options for Organohalogen Contamination: From Established Methods to Fungal Prospects
 
 
Due to scheduled maintenance work on our database systems, there may be short service disruptions on this website between 10:00 and 11:00 CEST on June 14th.
Article

A Multidimensional Assessment of CO2-Intensive Economies Through the Green Economy Index Framework

by
Halina Falfushynska
Faculty of Economics, Anhalt University of Applied Sciences, Strenzfelder Allee 28, 06406 Bernburg, Germany
Environments 2025, 12(6), 195; https://doi.org/10.3390/environments12060195
Submission received: 24 April 2025 / Revised: 27 May 2025 / Accepted: 3 June 2025 / Published: 9 June 2025

Abstract

:
Despite growing international consensus on the urgency of climate action, global CO2 emissions have continued to rise, exposing a critical implementation gap between environmental ambition and reality. This study explores the readiness and structural capacity of the world’s most CO2-intensive countries to transition toward a green and hydrogen-based economy. We introduce and apply the Green Economy Index, a composite measure integrating 31 indicators across four core dimensions—political and regulatory efficiency, socio-economic status, infrastructure, and sustainable targets. Using data from 29 countries emitting over 200 Mt of CO2 in 2022, the analysis combines principal component analysis, Random Forest modeling, and network-based correlation analysis to classify nations into frontrunners, transitional performers, and structural laggers. The results reveal significant disparities in green economy readiness, with high-income countries showing institutional maturity and infrastructural robustness, while middle-income nations remain constrained by fossil fuel dependencies and governance challenges. Importantly, we highlight the growing utility of machine learning and multivariate statistics in capturing complex sustainability interdependencies. The Green Economy Index framework offers a relevant tool to benchmark progress, diagnose barriers, and guide targeted interventions in global decarbonization efforts.

1. Introduction

The global imperative to combat climate change has brought focus to the sources, consequences, and quantification of CO2 emissions. Despite the establishment of international frameworks such as the Paris Agreement and the widespread adoption of national climate action plans, global carbon emissions have continued their upward trajectory. Between 2021 and 2024 alone, global CO2 emissions rose from 36.2 to 37.41 billion metric tons [1]. During the same period, the average anomaly in land–sea surface temperature increased from 1.12 °C to 1.54 °C [2]. This widening gap between policy commitments and real-world outcomes highlights a critical disconnect between climate ambition and effective implementation. Against this backdrop, the concept of a “green economy” has emerged as a promising paradigm for addressing the intertwined challenges of environmental sustainability, economic resilience, and social inclusion. By promoting low-carbon growth, resource efficiency, and equitable development, the green economy together with the circular economy and bioeconomy is increasingly seen not merely as an environmental initiative, but as a comprehensive strategy for systemic transformation toward a more sustainable future [3].
Monitoring and evaluating progress toward a green economy presents significant challenges due to the inherently complex and multidimensional nature of sustainability transitions. These processes span diverse domains, including regulatory governance, economic and financial systems, technological readiness, and environmental performance. The intricate interplay among these dimensions produces a vast, heterogeneous, and often unstructured data landscape, which renders traditional evaluation tools inadequate for capturing the full spectrum of changes occurring in the shift toward sustainability. In response to this complexity, the Hydrogen Economy Index has recently been introduced as a comprehensive assessment framework. This index consolidates eight critical dimensions to assess a country’s overall suitability for the production and export of green hydrogen, a key pillar in future clean energy strategies [4]. Similarly, a broader Green Economy Index has been developed to provide a holistic view by integrating economic, social, and environmental indicators into a composite score. While such indices offer valuable insights, their findings have largely been validated through comparative studies by institutions like the Global Green Growth Institute and the European Union [5]. In line with this multidimensional approach, Saudi Arabia’s green transition has been assessed using the EEPSE Green Economy Index (EEPSE GEI), built upon the QHIM framework, which encompasses five key systems: Education, Economy, Politics, Society, and Environment. While political and educational systems showed consistent progress, the environmental and economic pillars remained relatively weak. These findings highlight the critical need for robust, multidimensional metrics like the EEPSE GEI and Hydrogen Economy Index to move beyond fragmented evaluations [6]. By capturing the multifaceted nature of sustainability, such metrics can guide policymakers in developing targeted, data-driven strategies to support green transition and hydrogen economy development.
Accurate assessment of CO2 emissions and effective policy design are essential components of this transition. In recent years, machine learning has emerged as a transformative tool in this domain. With its capacity to process high-dimensional datasets and detect complex, non-linear relationships, machine learning offers an alternative to traditional econometric approaches. Beyond forecasting emissions, machine learning models can uncover hidden drivers of environmental impact, classify countries by their development trajectories, and detect policy-relevant patterns that often remain obscure in classical analyses. For example, recent studies on China’s green economy transition highlight a strong correlation between investment in the research and development sector, patent activity, and progress in sustainable energy, particularly within high-energy-consumption sectors. Furthermore, the short-term impact of green innovation appears to outweigh long-term effects, underscoring the importance of sustained investment and policy support [7].
Machine learning has also facilitated the development of key performance indicators to benchmark machine learning-accelerated energy research workflows, enhancing comparative analysis and optimization [8]. Complementary insights from multivariate statistical models provide a broader global perspective. Analysis of 88 countries from 1990 to 2020 shows a gradual increase in average sustainability scores—from 0.15 to 0.24—despite the overall slow pace of the transition. Steady improvements were observed in the dimensions of energy availability and affordability, with the fastest climbers primarily being emerging Asian economies and energy-exporting nations. In contrast, progress in environmental sustainability and technological development varied more widely, with the most dynamic gains concentrated in European countries [9].
Despite the availability of various sustainability metrics, limited research offers a comprehensive macro-structural and machine-learning diagnostic of green economy preparedness specifically designed for high-CO2-emitting nations. Consequently, we examine the following subsequent research inquiries: (i) How can the preparedness of CO2-intensive economies for a green transition be thoroughly evaluated?; (ii) what structural distinctions characterize green frontrunners, transitional performers, and laggards?; and (iii) how do income group dynamics influence the predictive significance of green economy drivers? The analysis covers 29 countries, selected based on annual CO2 emissions exceeding 200 Mt, ranging from China—the world’s largest emitter—to Pakistan, with 199.3 Mt in 2022 [10]. To explore the abovementioned question, we analyzed the interdependence between current CO2 emissions and a wide array of indicators reflecting energy consumption patterns, economic structure, and environmental governance. A composite index was developed based on four core dimensions: political governance, economic structure, infrastructure, and environmental performance.

2. Materials and Methods

In this study, we analyzed the relationships between national CO2 emissions and a set of key variables that are widely recognized as influential determinants of emission levels. These variables include energy use per capita, the proportion of alternative and nuclear energy in the national energy mix, GDP generated per unit of energy consumed, and the economic significance of oil and natural gas rents as a percentage of GDP. We also incorporated indicators of direct fossil fuel consumption, specifically emissions from oil and coal usage, as well as CO2 emissions related to electricity and heat production. Additional metrics considered were the net revenues from oil and natural gas (calculated as revenue minus production costs) and CO2 emissions arising from the manufacturing and industrial sectors. The data originated from [10,11,12,13,14,15].
Our analysis focused on 29 countries, each with annual CO2 emissions exceeding 200 million metric tons in 2022, placing them among the world’s top emitters [10]. While these countries differ structurally, their environmental impact and global relevance justify their inclusion. Comparability is ensured via min–max normalization and by analyzing high- and middle-income countries separately in all statistical models. Taiwan was excluded due to data gaps in several key indicators [13].
This study introduces the Green Economy Index (GEI) as a comprehensive and comparative framework for assessing the readiness and potential of countries to transition toward a hydrogen-based economy. The GEI is built upon four principal dimensions: political and regulatory efficiency, socio-economic status, infrastructure, and sustainable targets. These dimensions are derived from an integration of established sustainability assessment frameworks (e.g., EEPSE GEI, Hydrogen Economy Index) [4,6] and reflect the multi-layered prerequisites for a functional green economy. Specifically, political and regulatory efficiency provides the necessary governance framework, enabling the implementation and enforcement of environmental regulations, carbon pricing mechanisms, and clean energy incentives. Socio-economic status reflects a society’s capacity to finance and support the transition, as well as the public’s readiness to adopt sustainable practices. Infrastructure represents the physical systems required to deploy green technologies and services at scale. Finally, sustainable targets offer strategic direction and accountability, ensuring that the transition is guided by measurable and long-term goals. The inclusion of variables such as political stability, property rights, and infrastructure quality is grounded in transition theory, which views sustainability shifts as system-wide transformations requiring institutional, economic, and infrastructural alignment.
To capture the multifaceted nature of a green economy, a total of 31 indicators were selected and grouped under the abovementioned dimensions. These indicators were chosen based on (1) their prevalence in peer-reviewed sustainability transition research, (2) their inclusion in well-established global indices (e.g., World Bank Governance Indicators, Heritage Foundation’s Index of Economic Freedom, Global Wind Atlas), and (3) their relevance to energy transition and green economy readiness as shown in previous literature and modeling studies [13,16,17,18,19,20,21,22,23,24] (https://fragilestatesindex.org/global-data/ (accessed on 6 May 2025)).
Political and regulatory efficiency: This dimension captures the stability and effectiveness of governance, as well as the quality of institutions and regulatory frameworks critical for enabling a green hydrogen economy. Indicators include the following: the Fragile State Index (0–120), political stability (0–100), property rights (0–100), the Regulatory Quality Index (0–100), and governance effectiveness (−2.5 to 2.5).
Socio-economic status: This dimension evaluates a country’s broader economic environment and its capacity to support sustainable innovation and investment. It includes the following: the Human Capital Index (0–1), social inclusion (0–100), economic freedom (0–100), business freedom (0–100), monetary freedom (0–100), industry (including construction), value added (annual % growth), trade freedom (0–100), investment freedom (0–100), financial freedom (0–100), the Innovation Index (0–100), and the Globalization Index (0–100).
Infrastructure: This component assesses the availability and quality of critical physical infrastructure necessary for a renewable energy carrier, e.g., green hydrogen or ammonia logistics and export. Indicators include the following: quality of railroad infrastructure (0–7) and quality of port infrastructure (0–7).
Sustainable targets: This dimension measures a country’s progress in green growth, renewable energy development, and carbon emissions control. It integrates the following: the Green Growth Index (0–100), green economic opportunities (0–100), wind power density, PV output, renewable power generation (billion kWh), wind electricity capacity (million kW), solar electricity capacity (million kW), hydroelectricity capacity (million kW), wind electricity generation (billion kWh), solar electricity generation (billion kWh), hydroelectricity generation (billion kWh), CO2 emissions (tons), and CO2 emissions per capita.
Index calculation: The GEI is determined by taking the element-wise average of four normalized sub-indices: the Political and Regulatory Efficiency Index (IPR), the Socio-Economic Index (ISE), the Infrastructure Index (II), and the Sustainable Targets Index (IST). Sub-indices are computed as the arithmetic mean of n normalized indicators: I = 1 n i = 1 n x i , where xi represents the individual normalized values of the target indicators, and n is the total number of indicators used.
To ensure comparability across indicators with different units and scales, all raw indicator values are normalized using min–max scaling, defined as x i   = x x m i n x m a x x m i n , where xi is the normalized value of x, xmin is the minimum value in the dataset, and xmax is the maximum value in the dataset (Supplementary Table S1). This normalization procedure rescales the values to the range [0, 1], preserving the relative differences between data points while eliminating distortions caused by differing measurement scales.
The GEI was calculated as the arithmetic mean of four contributing indices:
G E I = 1 4 i 1 4 I i
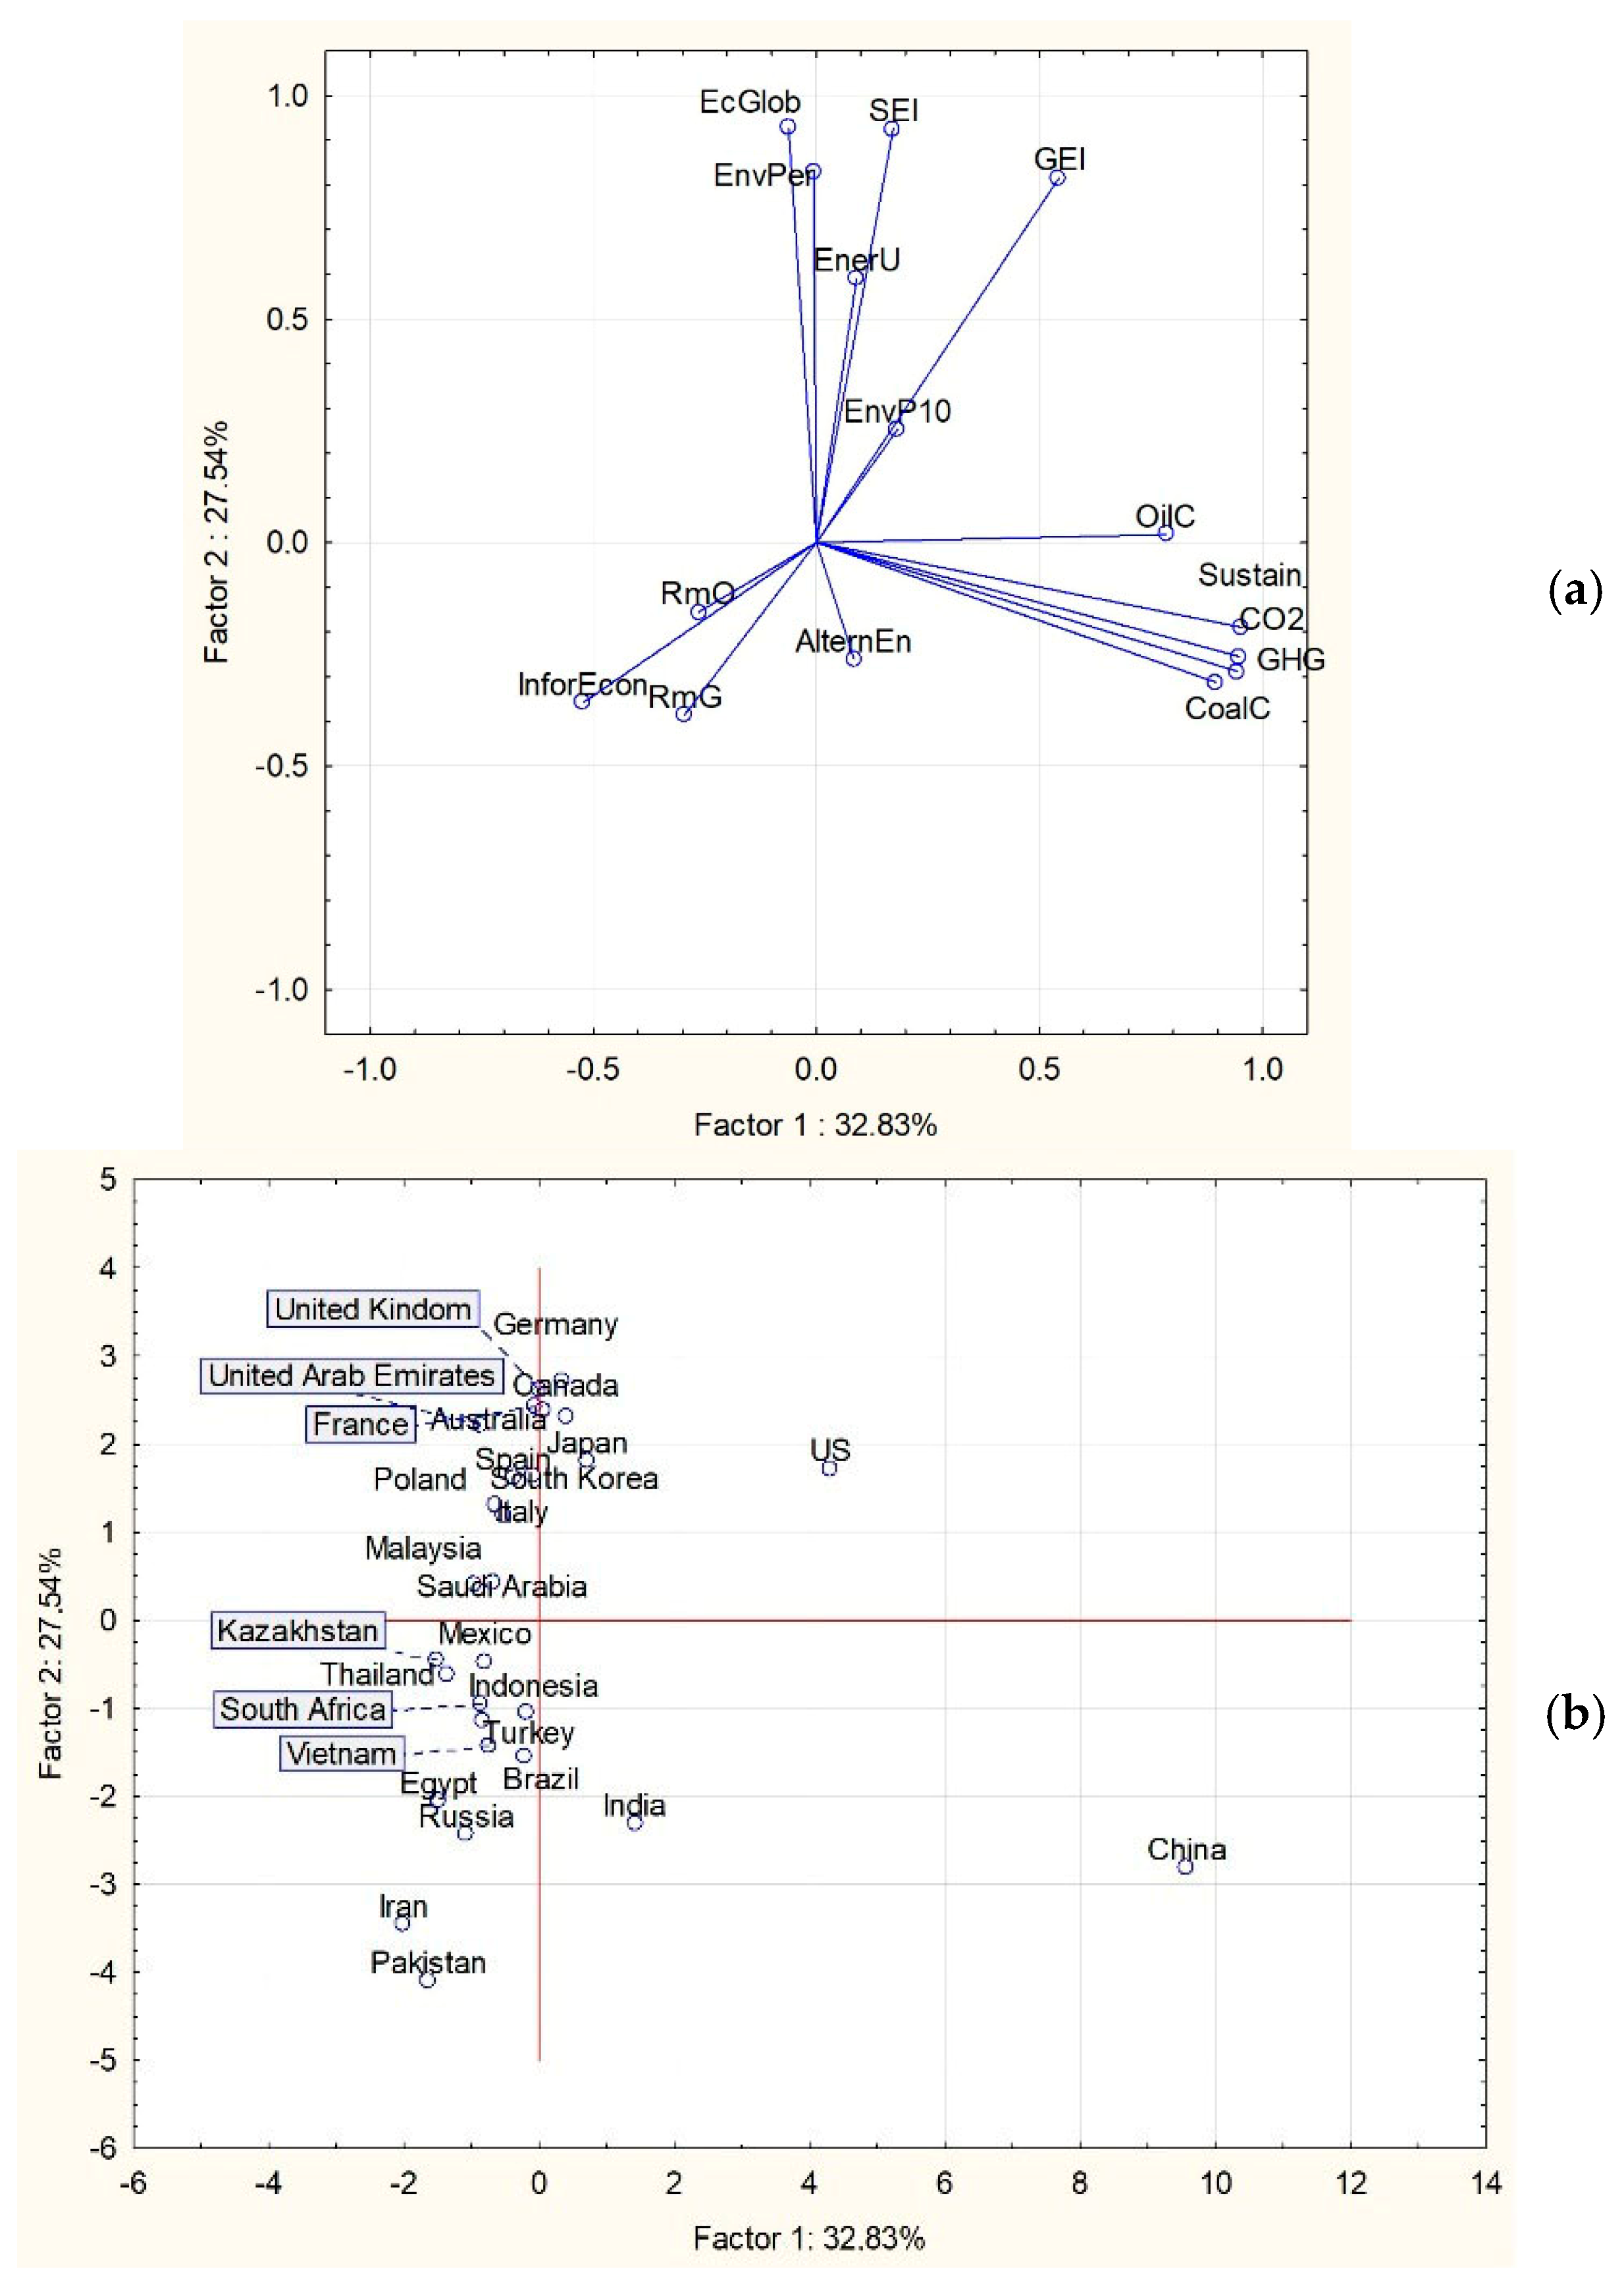
The calculations were executed using MATLAB R2015a, ensuring precise numerical analysis and reproducibility. The collected data were analyzed using descriptive statistics, partial least squares discriminant analysis, Random Forest analysis, DSPC network, heatmap distribution, and correlation analyses using StatSoft Statistica v12.0 and MetaboAnalyst (
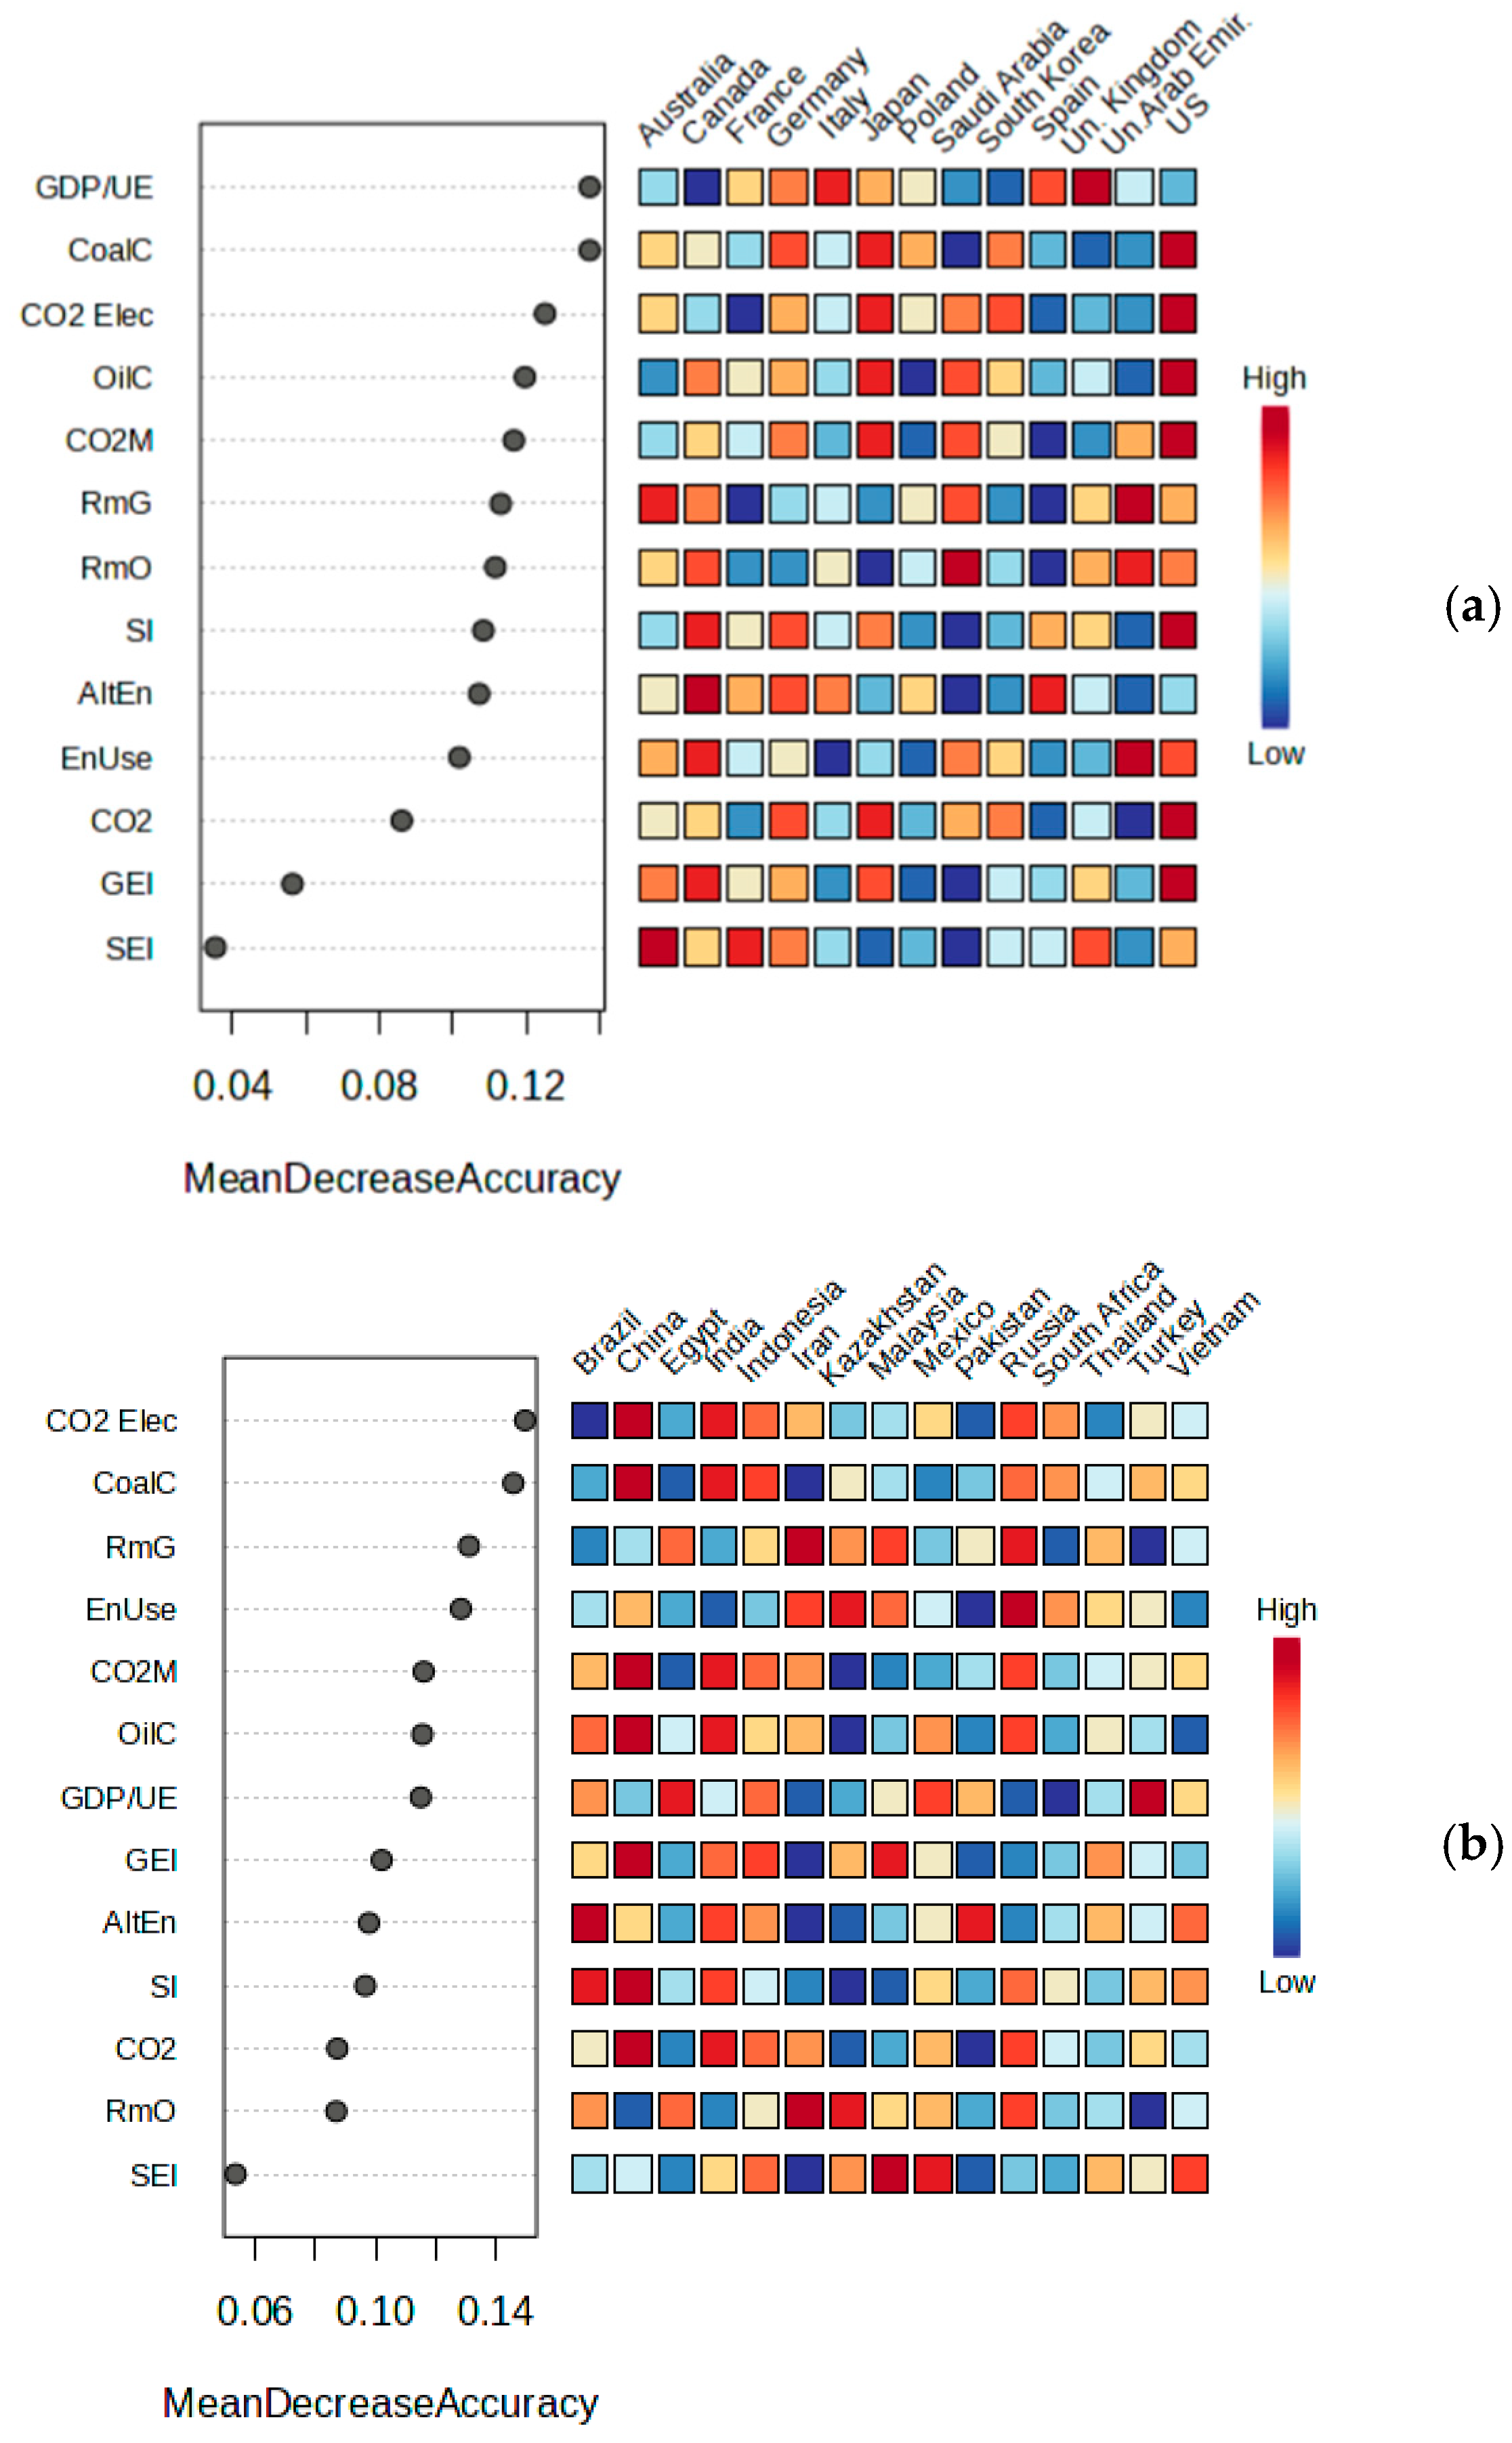
https://www.metaboanalyst.ca/ (accessed on 6 May 2025)) to identify trends and patterns in public perception. In particularly, PCA was applied to reduce dimensionality and identify latent structures among variables, revealing two dominant components: one related to fossil fuel intensity, the other to eco-efficiency. Random Forest analysis was used to assess the predictive importance of individual indicators in shaping the GEI, stratified by income groups (high- vs. middle-income countries). Correlation network analysis visualized the interdependencies among variables, highlighting how structural factors (e.g., fossil fuel revenues, energy use) co-vary with sustainability outcomes.

3. Results

3.1. Green Economy Index Scores and Country Clusters

The analysis revealed considerable disparities in Green Economy Index (GEI) scores across the 28 countries studied. The contribution of the present findings in assessing sustainability or green growth lies in combining a multidimensional indicator framework with machine learning-based diagnostics to reveal structural and policy-relevant drivers of green economy performance. Unlike previous models that treat sustainability in isolated dimensions [4,5,6], our Green Economy Index model synthesizes institutional, economic, infrastructural, and environmental variables to reflect transition readiness in CO2-intensive economies. The highest GEI scores were observed in the United States, China, Canada, Japan, Australia, and Germany (Table 1), indicating strong performance across multiple dimensions. These countries typically exhibit high governance effectiveness, robust infrastructure, and significant investments in green innovation and renewable energy capacities. By contrast, countries such as Iran, Pakistan, Russia, Egypt, and South Africa ranked in the lower segment (Table 1), highlighting structural challenges in governance, economic freedom, or sustainability performance. For clarity and consistency with the analytical narrative, countries in Table 1 have been ordered by descending GEI score, highlighting relative performance tiers from frontrunners to structural laggards.
The most influential component in shaping overall GEI scores, the Political and Regulatory Efficiency Index, ranged from 0.52 in Iran to 4.64 in Australia (Table 1). Countries such as Germany, Canada, the United Kingdom, and Japan consistently scored above 4.0, reflecting strong institutional frameworks, property rights enforcement, and regulatory quality. Conversely, lower scores in countries like Pakistan, Egypt, and Russia underscore governance weaknesses that may hinder green policy implementation.
The Sustainability Index is the most volatile and revealing dimension, with China as a clear outlier due to massive investment in renewable energy (wind, solar, hydro) and significant power output. Other countries, including Brazil, Canada, and Germany, also displayed significant sustainability scores above 0.48, driven by a mix of energy transition policies and low-carbon technology adoption (Table 1). Conversely, oil-dependent and fossil fuel-intensive economies such as Saudi Arabia, Russia, and UAE scored lowest, emphasizing a gap between green potential and actual implementation.
Scores in the category of the Socio-Economic Index showed relatively narrow variance, with most countries clustering between 0.5 and 0.75. Leading countries such as France, the United Kingdom, and Germany demonstrate higher human capital development and social inclusion. In contrast, Pakistan and Iran displayed the lowest scores, suggesting critical gaps in education and inclusive economic participation.
The Infrastructure Index dimension, which integrates transport quality, varied from 0.407 to 0.900. Countries like Egypt, Vietnam, and India showed infrastructure limitations that may constrain renewable energy deployment and green growth.

3.2. Principal Component Analysis: Structural Underpinnings

To further explore the underlying structure of the indicators related to CO2 emissions, energy use, and sustainability, a principal component analysis (PCA) was conducted. The analysis yielded two primary factors that together explain a substantial portion of the variance in the data (Figure 1). Factor 1 is strongly and positively associated with traditional environmental pressure indicators, namely CO2 emissions (0.949), greenhouse gas emissions (0.944), Sustainability Index (0.953), coal consumption (0.895), and oil consumption (0.784). These high loadings suggest that factor 1 represents a dimension of carbon-intensive economic activity and fossil fuel dependence. The strong correlation with the Sustainability Index (0.953) may indicate that sustainability, as currently measured, is still largely aligned with conventional economic outputs or infrastructural factors linked to emissions. On the contrary, the informal economy (−0.522) and raw material governance (−0.295) have negative loadings, implying that lower institutional capacity and unregulated sectors are inversely related to this emission-heavy pathway.
Factor 2 is dominated by indicators associated with environmental policy performance and ecological globalization: economic globalization (0.927), Socio-Ecological Index (0.926), Green Economy Index (0.816), environmental performance (0.829), and energy use per unit of GDP (0.590). This component appears to capture a green transition trajectory characterized by eco-efficiency, environmental governance, and international engagement.

3.3. Machine Learning Insights: Random Forest Analysis

Building on the PCA findings, Random Forest analysis was employed on an expanded dataset. Due to PCA-based clustering aligned with income levels (Figure 1b, the analysis was conducted separately for high-income and middle-income countries. For high-income countries, the variables with the highest mean decrease in accuracy, and thus the greatest importance for predicting the GEI, were the following: GDP per unit of energy use, revenue minus production cost of oil, coal and oil consumption, and CO2 emissions from manufacturing and electricity generation (Figure 2). These results emphasize that in high-income economies, energy efficiency and economic returns from fossil fuel production remain dominant forces shaping green economic performance. Notably, the socio-economic and sustainability indices were less influential, suggesting these countries have more homogenous policies in these areas or that their influence on the GEI is indirect.
In contrast, the most important variables for middle-income countries were the following: coal consumption, CO2 emissions from electricity generation, oil consumption and per capita energy use, CO2 from manufacturing, and GDP energy efficiency. This pattern points to a stronger dependency on fossil fuel consumption and lower efficiency in energy use. The relatively lower importance of alternative energy and socio-economic indicators suggests that these countries are still in an earlier phase of the green transition, where a basic energy system structure dominates green economy outcomes.

3.4. Correlation Network Analysis

To further interpret these findings, correlation networks were constructed for each group of countries. These reveal the relational architecture of variables and provide deeper insight into how they interact. The high-income network shows a dense cluster connecting fossil fuel consumption (coal, oil), CO2 emissions (from electricity and industry), and energy revenue (Figure 3a). Here, the GEI is closely tied to CO2 from electricity and oil-related revenues, indicating that even in advanced economies, green performance is shaped by the legacy of carbon-intensive economic models.
Moreover, GDP per unit of energy use is positively connected to sustainability, showing that energy efficiency supports broader green goals. However, alternative and nuclear energy appears weakly integrated, hinting at the need for stronger policy and technological support for renewables.
In the middle-income group, the network reveals the following: a central role of CO2 emissions, especially from electricity and manufacturing (Figure 3b), as well as strong associations between energy use per capita, coal/oil consumption, and low sustainability scores, with alternative and nuclear energy and energy efficiency beginning to connect to the core network, indicating early-stage transitions. Importantly, the GEI is linked not only to emissions but also to cleaner energy variables, suggesting that middle-income countries that begin investing in renewables and efficiency already experience measurable GEI benefits.

4. Discussion

CO2 emissions remain a key determinant in shaping national green economy performance, acting as both a pressure indicator and a critical variable in evaluating sustainability transitions. This study conceptually advances the green economy knowledge by offering a diagnostic model that combines policy, structural, and outcome-based indicators through integrative machine learning tools and multivariate statistics. While prior indices such as the EEPSE GEI provide valuable benchmarking [4,5,6], they do not disentangle the predictive relevance of green transition drivers across heterogeneous country profiles. By introducing stratified Random Forest modeling and PCA clustering, we address this gap and provide context-sensitive insight into transition bottlenecks.
A robust correlation between high GEI scores and the capacity of nations to decouple economic growth from carbon-intensive activities has been demonstrated. Significantly, although the GEI provides a useful composite viewpoint, the results underscore the importance of critically interpreting overall GEI rankings. A high total GEI may result from exceptional performance in one category offsetting shortcomings in others. Some nations with significant renewable energy capability performed favorably on the Sustainability Index yet demonstrated governance deficiencies or infrastructural constraints. This highlights the multifaceted nature of green transitions, wherein sustainable results rely on continuous advancement across all structural aspects. The GEI should be regarded not just as a summary metric but also as a diagnostic instrument that identifies imbalances and prompts additional examination of the specific factors influencing national green performance.
Using Random Forest analysis, principal component analysis, and correlation network analysis, we identified CO2 emissions and fossil fuel consumption as dominant contributors to environmental pressure. These variables significantly influence the classification of countries within green economy clusters. Notably, CO2 emissions positively correlate with fossil fuel usage and energy use per capita but exhibit a negative association with GDP per unit of energy use, underscoring inefficiencies in carbon-intensive economies. Our findings align with results discovered by Mitić and colleagues [25], who reported a dynamic interaction between CO2 emissions, energy availability, employment, and GDP, with significant long-run equilibrium adjustments. Additionally, variance decomposition supported the role of CO2 as a systemic driver over time. Similarly, Lau et al. (2023) highlighted that while income and technological development may increase emissions, stronger institutional frameworks and high GREENQ scores can mitigate these effects [26], supporting our conclusions on policy relevance and institutional leverage in reducing CO2 outputs.
The positive association between energy use per capita and environmental performance suggests that energy productivity plays a key role in sustainability outcomes. This is supported by regional evidence from South Asia, where Sri Lanka and Bangladesh have maintained a steady relationship between energy efficiency and environmental performance, in contrast to India, which has shown more volatile trends [27]. Global studies emphasize energy efficiency as a major lever for emission reductions, potentially contributing up to 40% of the total mitigation potential. Chen et al. (2024) further confirmed a positive relationship between energy efficiency and economic growth, cautioning, however, that without appropriate governance, gains in efficiency may be offset by increased consumption [28]. Therefore, enhancing energy efficiency is essential not only for environmental sustainability but also for economic resilience. Achieving long-term improvements requires diversifying energy sources, reducing dependence on fossil fuels, and strengthening institutional capacities through education, technology transfer, and policy reform. These measures can support countries like Pakistan in decoupling energy use from environmental harm while promoting inclusive and sustained economic development.
Green economy frontrunners such as the United States, Germany, and Canada consistently demonstrate strong performance across all dimensions of the Green Economy Index. Although these countries have historically contributed significantly to global CO2 emissions, the past decade has seen a marked decline in their emission levels [29,30], particularly in the case of Germany and the United Kingdom, reflecting the effectiveness of recent policy interventions and energy transition measures. Notably, Germany, the United Kingdom, and France are projected to achieve the most accelerated pace of decarbonization, with average annual carbon emission reduction rates of approximately 5% [31]. In comparison, Japan, the United States, Canada, and Italy are advancing at a more moderate rate, with annual reductions ranging between 2% and 3% [31]. Achieving national carbon neutrality targets by 2050 will demand substantial efforts in carbon sequestration. As reported, the estimated volumes of CO2 equivalent that need to be sequestered by mid-century include 91.47 MtCO2e for Germany, 23.97 MtCO2e for the United Kingdom, 69.74 MtCO2e for Italy, 494.03 MtCO2e for Japan, and 2461.28 MtCO2e for the United States [31]. These ambitious targets are supported by robust institutional frameworks, as well as significant public and private investment in green technologies. For example, Germany alone invested USD 89.12 billion in clean technologies in 2023 [32]. High levels of public awareness and private sector engagement further position these countries as global frontrunners in renewable energy innovation, circular economy practices, and climate governance.
Transitional performers including China, Indonesia, Malaysia, and Brazil display notable sector-specific progress, suggesting substantial green growth potential, albeit with uneven advancement across GEI dimensions. China’s CO2 emissions are projected to decline in 2024 for the first time since the pandemic, driven by record levels of low-carbon energy capacity, enhanced hydroelectric power generation, and decreased emissions from heavy industry and electricity production [33]. Strategic strengths are evident in these countries’ targeted efforts: China maintains a dominant global position in solar panel and battery manufacturing, while Indonesia has made noteworthy strides in forest conservation. These developments underscore the potential for leadership in selected areas of sustainability. Nevertheless, climate strategies in the Global South cannot follow a uniform trajectory [34]. The heterogeneity of national contexts, shaped by differing developmental stages, socio-economic priorities, and institutional capacities, demands differentiated approaches to climate action. These countries often face inherent trade-offs between sustaining economic growth and pursuing environmental goals, leading to complex policy tensions that can hinder coherent and comprehensive green transitions.
Structural laggers in terms of green economy and green hydrogen transition, such as Iran, Pakistan, and Russia, face the most complex and deep-rooted obstacles to green transition. These countries are typified by weak institutional capacities, limited green investment, persistent dependence on fossil fuel-based energy systems, and low prioritization of sustainability in policymaking. The continued presence of high CO2 emissions, minimal environmental transparency, and inadequate infrastructure for renewable energy development hinder their transition efforts. Moreover, geopolitical instability and macroeconomic vulnerabilities often restrict access to international climate finance, technical expertise, and green innovation networks.
The more detailed analysis of country classifications based on income levels reveals distinct dynamics in the green economy transition. In high-income economies, factors such as economic energy efficiency, fossil fuel dependency, and CO2 emissions particularly from manufacturing and industry intensity play a critical role. The strong presence of revenue-related indicators underscores the ongoing significance of resource-based activities, even as these countries shift toward cleaner energy sources. Our findings align with earlier research emphasizing that fossil fuel consumption remains a major barrier to green development [35,36]. However, the mitigating effects of circular economy practices and innovation marginally more advanced in high-income countries compared to middle-income economies [37] are noteworthy [35]. Interestingly, sustainability and socio-economic indices appear to be of lower importance in predictive models for high-income countries. This may reflect the more institutionalized and standardized nature of sustainability policies in these contexts, reducing their variability and thus their influence in statistical modeling.
In contrast, middle-income countries exhibit a different pattern. Here, CO2 emissions from electricity and heat production, energy consumption, and fossil fuel intensity are key determinants of green economy performance. The significant impact of emissions from electricity generation suggests a heavy reliance on coal-based energy and inefficient infrastructure. Revenue indicators, in turn, play a notable role, indicating continued economic dependence on oil and gas exploitation. The lower influence of socio-economic and sustainability indices may be attributed to systemic challenges in policy execution and limited institutional capacity, which restrict the effectiveness and variability of these measures. Given these disparities, governments, particularly in developing countries, are encouraged to prioritize circular economy innovations [38]. Such strategies are essential to mitigating the adverse effects of fossil fuel use, possible adverse effects of manufacturing and commissioning renewable energy installations [39], and CO2 emissions, fostering sustainable economic growth and addressing the broader challenges of global climate change.
The findings of this study highlight the multifaceted nature of sustainability transitions in middle-income countries, where structural dependencies on fossil fuels and complex interdependencies among energy, emissions, and economic variables shape both challenges and opportunities for decarbonization. In our correlation network analysis, middle-income countries exhibit a more fragmented yet increasingly complex system. Strong and persistent associations between CO2 emissions (from electricity and manufacturing sectors) and indicators such as energy use per capita, coal, and oil consumption reveal the central role of fossil fuel-based infrastructures. These relationships underline the systemic inertia that characterizes these economies, which are often locked into carbon-intensive development paths. As suggested, these countries stand to gain substantially from a shift toward low-carbon development—both globally, through emission reductions, and locally, via improvements in public health and economic diversification [40]. Yet, the dominance of resource extraction and early-stage industrial processing in their economies complicates this transition.
The correlation of fossil fuel parameters and the Sustainability Index corroborates this structural challenge. Coal and oil consumption, alongside industrial CO2 emissions, remain the strongest predictors of sustainability performance, indicating that legacy energy systems still overwhelmingly dictate environmental outcomes. This is especially significant in middle-income contexts, where foundational energy transitions—not just sectoral decarbonization—are urgently needed. In contrast, high-income countries, having largely stabilized their energy infrastructure, require targeted interventions in entrenched sectors to achieve further decarbonization. Using a two-regime Markov-switching model, a consistent negative relationship between fossil fuel production and renewable energy has been identified, supporting the “lobby effect” theory, which posits that fossil fuel incumbents actively resist the shift to renewables [41].
The results provide actionable insights for policy. High-income countries should focus on decarbonizing hard-to-abate sectors and reducing fossil fuel revenue dependencies. In middle-income economies, the focus must shift to foundational changes—investments in green infrastructure, reforms in energy pricing, and enhanced institutional capacity. International support through climate finance and technology transfer is essential to close the implementation gap. The GEI framework can serve as a monitoring tool for tracking progress and aligning national strategies with global decarbonization goals.

5. Conclusions

This study highlights the diverse and income-sensitive drivers of the Green Economy Index, demonstrating that countries at different stages of economic development face distinct challenges and priorities in their green transitions. While PCA and network analysis reveal underlying systemic interconnections, Random Forest analysis highlights the most statistically influential drivers of green transition. For high-income countries, the findings underscore the importance of improving energy productivity, reducing CO2 emissions from industrial sectors, and rethinking the economic reliance on fossil fuel revenues, particularly oil. These economies are at a stage where incremental innovations in efficiency, technological upgrades, and deep decarbonization strategies—especially in hard-to-abate sectors—are central to advancing green growth. In contrast, middle-income countries are primarily constrained by high coal consumption, inefficient electricity generation, and rising per capita energy use, which collectively contribute significantly to their carbon footprints. Here, the green transition demands large-scale investment in renewable infrastructure, modernization of energy systems, and structural changes to reduce dependence on fossil fuel-based energy production. Across both groups, the low importance of sustainability and socio-economic indices suggests that while these metrics are vital in theory, they may not yet be sufficiently integrated or impactful in practice to drive measurable changes in GEI outcomes. This calls for more robust policy enforcement, institutional capacity building, and community-based engagement to ensure that sustainability is not just a policy goal but a measurable force in economic transformation.
Future research should integrate temporal dynamics and lifecycle carbon accounting into the GEI, enhancing its predictive capacity. Additionally, stronger integration of circular economy indicators and just transition metrics will be essential. Policymakers might embrace such tools not only for benchmarking, but also to design inclusive, actionable strategies that advance the global green and hydrogen economy agenda in a rapidly warming world.

Supplementary Materials

The following supporting information can be downloaded at https://www.mdpi.com/article/10.3390/environments12060195/s1, Table S1: Initial data used to determine the Political and Regulatory Efficiency Index (IPR), Socio-Economic Index (ISE), Infrastructure Index (II), and Sustainable Targets Index (IST), along with the calculation of the overall Green Economy Index.

Funding

This research was partially funded by the BMBF Project Professor*innengewinnung und Nachwuchsentwicklung zur Etablierung eines Centers of Advanced Scientific Education (CASE)—Professor recruitment and junior staff development to establish a Centre of Advanced Scientific Education.

Data Availability Statement

The data presented in this study were derived from the following resources available in the public domain: [10,11,12,13,14,15].

Conflicts of Interest

The author declares no conflicts of interest.

References

  1. Statista. Annual Carbon Dioxide (CO2) Emissions Worldwide from 1940 to 2024. Statista. Available online: https://www.statista.com/statistics/276629/global-co2-emissions/ (accessed on 6 May 2025).
  2. Ritchie, H.; Rosado, P.; Roser, M. CO2 and Greenhouse Gas Emissions. Available online: https://ourworldindata.org/co2-and-greenhouse-gas-emissions (accessed on 6 May 2025).
  3. D’Amato, D.; Korhonen, J. Integrating the Green Economy, Circular Economy and Bioeconomy in a Strategic Sustainability Framework. Ecol. Econ. 2021, 188, 107143. [Google Scholar] [CrossRef]
  4. Baumgarten, J.; Schneider, C.P.; Möst, D. Hydrogen Economy Index—A Comparative Assessment of the Political and Economic Perspective in the MENA Region for a Clean Hydrogen Economy. Int. J. Hydrogen Energy 2025, 101, 1503–1517. [Google Scholar] [CrossRef]
  5. Niță, D.; Stoicuța, N.; Nițescu, A.; Dobre-Baron, O.; Isac, C. Constructing a Quantification Tool of the Progress towards the Green Economy: Aggregation Perspective. Equilib. Q. J. Econ. Econ. Policy 2024, 19, 1139–1184. [Google Scholar] [CrossRef]
  6. Chaaben, N.; Elleuch, Z.; Hamdi, B.; Kahouli, B. Green Economy Performance and Sustainable Development Achievement: Empirical Evidence from Saudi Arabia. Env. Dev. Sustain. 2022, 26, 549–564. [Google Scholar] [CrossRef] [PubMed]
  7. Chen, W.; Zou, W.; Zhong, K.; Aliyeva, A. Machine Learning Assessment under the Development of Green Technology Innovation: A Perspective of Energy Transition. Renew. Energy 2023, 214, 65–73. [Google Scholar] [CrossRef]
  8. Yao, Z.; Lum, Y.; Johnston, A.; Mejia-Mendoza, L.M.; Zhou, X.; Wen, Y.; Aspuru-Guzik, A.; Sargent, E.H.; Seh, Z.W. Machine Learning for a Sustainable Energy Future. Nat. Rev. Mater. 2022, 8, 202–215. [Google Scholar] [CrossRef] [PubMed]
  9. Li, Z.; Niu, S.; Wang, J.; Tan, Y.; Wang, Z. Multidimensional Assessment of Energy Transition and Policy Implications. Renew. Energy 2025, 238, 121870. [Google Scholar] [CrossRef]
  10. CO2 Emissions by Country. Worldometer. Available online: https://www.worldometers.info/co2-emissions/co2-emissions-by-country (accessed on 6 May 2025).
  11. GHG Emissions of All World Countries. EDGAR. Available online: https://edgar.jrc.ec.europa.eu/report_2024 (accessed on 6 May 2025).
  12. World Nuclear Association. Country Profiles. World Nuclear Association. Available online: https://world-nuclear.org/information-library/country-profiles (accessed on 6 May 2025).
  13. The Global Economy. Available online: https://www.theglobaleconomy.com (accessed on 6 May 2025).
  14. Yale Center for Environmental Law & Policy. Environmental Performance Index. Available online: https://epi.yale.edu/measure/2024/EPI (accessed on 6 May 2025).
  15. Informal Economy Database. Worldbank. Available online: https://www.worldbank.org/en/research/brief/informal-economy-database (accessed on 6 May 2025).
  16. Political Stability and Absence of Violence/Terrorism: Percentile Rank. Available online: https://data.worldbank.org/indicator/PV.PER.RNK (accessed on 6 May 2025).
  17. Index of Economic Freedom. The Heritage Foundation. Available online: https://www.heritage.org/index/ (accessed on 6 May 2025).
  18. Regulatory Quality: Percentile Rank. Available online: https://data.worldbank.org/indicator/RQ.PER.RNK (accessed on 6 May 2025).
  19. Worldwide Governance Indicators. Available online: https://www.worldbank.org/en/publication/worldwide-governance-indicators/interactive-data-access (accessed on 6 May 2025).
  20. Human Capital Index. Available online: https://en.wikipedia.org/wiki/Human_Capital_Index (accessed on 6 May 2025).
  21. Green Growth Index. Available online: https://ggindex-simtool.gggi.org/ (accessed on 6 May 2025).
  22. World Development Indicators. Available online: https://databank.worldbank.org/reports.aspx?source=2&series=NV.IND.TOTL.KD.ZG&country=WLD (accessed on 6 May 2025).
  23. Global Solar Atlas. Available online: https://globalsolaratlas.info (accessed on 6 May 2025).
  24. Global Wind Atlas. Available online: https://globalwindatlas.info/en (accessed on 6 May 2025).
  25. Mitić, P.; Fedajev, A.; Radulescu, M.; Rehman, A. The Relationship between CO2 Emissions, Economic Growth, Available Energy, and Employment in SEE Countries. Environ. Sci. Pollut. Res. 2022, 30, 16140–16155. [Google Scholar] [CrossRef] [PubMed]
  26. Lau, C.K.; Gozgor, G.; Mahalik, M.K.; Patel, G.; Li, J. Introducing a New Measure of Energy Transition: Green Quality of Energy Mix and Its Impact on CO2 Emissions. Energy Econ. 2023, 122, 106702. [Google Scholar] [CrossRef]
  27. Hou, Y.; Iqbal, W.; Muhammad Shaikh, G.; Iqbal, N.; Ahmad Solangi, Y.; Fatima, A. Measuring Energy Efficiency and Environmental Performance: A Case of South Asia. Processes 2019, 7, 325. [Google Scholar] [CrossRef]
  28. Chen, W.; Alharthi, M.; Zhang, J.; Khan, I. The Need for Energy Efficiency and Economic Prosperity in a Sustainable Environment. Gondwana Res. 2024, 127, 22–35. [Google Scholar] [CrossRef]
  29. EDGAR. GHG Emissions of All World Countries. 2023. Available online: https://edgar.jrc.ec.europa.eu/report_2023 (accessed on 6 May 2025).
  30. Falfushynska, H.; Holz, M. Power-to-X Strategies: A Key Driver for Decarbonization and Renewable Energy Integration in Economies. In Applied Innovations in Information and Communication Technology; Dovgyi, S., Siemens, E., Globa, L., Kopiika, O., Stryzhak, O., Eds.; Lecture Notes in Networks and Systems; Springer Nature: Cham, Switzerland, 2025; Volume 1338, pp. 414–430. [Google Scholar] [CrossRef]
  31. Xu, G.; Huang, Z.; Jiang, M.; Rehman, H.U. “Gray” Prediction of Carbon Neutral Pathways in the G7 Economies by 2050. Appl. Energy 2024, 373, 123924. [Google Scholar] [CrossRef]
  32. Seizing the Clean Tech Opportunity in Germany. Available online: https://zerocarbon-analytics.org/archives/energy/seizing-the-clean-tech-opportunity-in-germany (accessed on 6 May 2025).
  33. 4 Essential Insights from China on Financing the Energy Transition. Available online: https://www.weforum.org/stories/2024/08/china-green-financing-energy-transition/ (accessed on 6 May 2025).
  34. Fuhr, H. The Rise of the Global South and the Rise in Carbon Emissions. Third World Q. 2021, 42, 2724–2746. [Google Scholar] [CrossRef]
  35. Zhang, Y. Circular Economy Innovations: Balancing Fossil Fuel Impact on Green Economic Development. Heliyon 2024, 10, e36708. [Google Scholar] [CrossRef] [PubMed]
  36. Dalei, N.N.; Gupta, A. Adoption of Renewable Energy to Phase down Fossil Fuel Energy Consumption and Mitigate Territorial Emissions: Evidence from BRICS Group Countries Using Panel FGLS and Panel GEE Models. Discov. Sustain. 2024, 5, 52. [Google Scholar] [CrossRef]
  37. Betancourt Morales, C.M.; Zartha Sossa, J.W. Circular Economy in Latin America: A Systematic Literature Review. Bus. Strat. Environ. 2020, 29, 2479–2497. [Google Scholar] [CrossRef]
  38. Murshed, M. Can Renewable Energy Transition Drive Green Growth? The Role of Good Governance in Promoting Carbon Emission-Adjusted Economic Growth in Next Eleven Countries. Innov. Green Dev. 2024, 3, 100123. [Google Scholar] [CrossRef]
  39. Falfushynska, H. Navigating Environmental Concerns: Assessing the Ecological Footprint of Photovoltaic-Produced Energy. Environments 2024, 11, 140. [Google Scholar] [CrossRef]
  40. Roberts, J.T.; Steinberger, J.K.; Dietz, T.; Lamb, W.F.; York, R.; Jorgenson, A.K.; Givens, J.E.; Baer, P.; Schor, J.B. Four Agendas for Research and Policy on Emissions Mitigation and Well-Being. Glob. Sustain. 2020, 3, e3. [Google Scholar] [CrossRef]
  41. Ankrah, I.; Appiah-Kubi, M.; Antwi, E.O.; Amenyah, I.D.; Musah, M.; Sackey, F.G.; Asravor, R.; Sikayena, I. A Spotlight on Fossil Fuel Lobby and Energy Transition Possibilities in Emerging Oil-Producing Economies. Heliyon 2025, 11, e41287. [Google Scholar] [CrossRef] [PubMed]
Figure 1. Principal component analysis of country-dependent indicators related to CO2 emissions, energy use, and sustainability. (a) Loadings of indicators related to CO2 emissions, energy use, and sustainability on two main factors. (b) Scores of studied countries on each factor. CO2: CO2 emission, GHG: greenhouse gas emission, EnerU: energy use per capita, AlterEn: alternative and nuclear energy, % of total energy use, EcGlob: economic globalization, RmO: revenue minus production cost of oil, % of GDP, RmG: revenue minus production cost of natural gas, % of GDP, OilC: oil consumption, CoalC: coal consumption, GEI: Green Economy Index, SEI: Socio-Economic Index, EnvPer: Environmental Performance Index, EnvP10: Environmental Performance Index, delta for 10 years, InforEcon: DGE model-based estimates of informal output. Data originate from [10,11,12,13,14,15].
Environments 12 00195 g001
Figure 2. Variable importance and cross-country variation in sustainability drivers based on Random Forest analysis. (a) Sustainability drivers in high-income countries. (b) Sustainability drivers in middle-income countries. CO2: CO2 emission, CO2 El: CO2 emission related to electricity and heat, EnUse: energy use per capita, kg oil eq, AltEn: alternative and nuclear energy, % of total energy use, GDP/UE: GDP per unit of energy used, GDP per oil eq, RmO: revenue minus production cost of oil, % of GDP, RmG: revenue minus production cost of natural gas, % of GDP, OilC: oil consumption, thousand barrels per day, CoalC: coal consumption, thousand short tons, SEI: Socio-Economic Index, SI: Sustainability Index, CO2M: CO2 related to manufacturing and industry, Gg. Data originate from [10,11,12,13,14,15].
Environments 12 00195 g002
Figure 3. Interdependencies between CO2 emissions, energy use, and sustainability indicators in high-income (a) and middle-income (b) countries. (a) Intercorrelations between selected indicators in high-income countries. (b) Intercorrelations between selected indicators in middle-income countries. CO2: CO2 emission, CO2 El: CO2 emission related to electricity and heat, EnUse: energy use per capita, kg oil eq, AltEn: alternative and nuclear energy, % of total energy use, GDP/UE: GDP per unit of energy used, GDP per oil eq, RmO: revenue minus production cost of oil, % of GDP, RmG: revenue minus production cost of natural gas, % of GDP, OilC: oil consumption, thousand barrels per day, CoalC: coal consumption, thousand short tons, SEI: Socio-Economic Index, SI: Sustainability Index, CO2M: CO2 related to manufacturing and industry, Gg. Lines in red color show positive relations, lines in blue color show negative relations. Data originate from [10,11,12,13,14,15].
Environments 12 00195 g003
Table 1. Comparative assessment of political, socio-economic, infrastructure, and sustainability indicators in the calculation of the Green Economy Index for selected countries.
CountryPolitical and Regulatory IndexSocio-Economic IndexInfrastructure IndexSustainability IndexGreen Economy Index
USA4.250.730.771.221.74
Canada4.420.710.690.601.61
China2.040.580.643.141.60
Australia4.640.760.660.311.59
Japan4.350.670.900.461.59
Germany4.290.730.720.491.56
United Kingdom4.350.740.680.391.54
France3.990.750.730.381.46
South Korea4.020.710.810.241.45
Spain3.590.710.770.411.37
United Arabian Emirates3.870.670.720.191.36
Italy3.510.700.630.371.30
Poland3.600.690.600.231.28
Malaysia3.480.650.740.221.27
Saudi Arabia3.280.610.660.171.18
Indonesia2.910.630.640.261.11
India2.360.590.640.601.10
Thailand2.760.600.490.261.03
Kazakhstan2.600.630.540.210.99
Brazil2.100.570.410.830.97
Mexico2.280.650.540.320.95
Turkey2.200.580.590.330.92
South Africa2.200.540.540.270.88
Vietnam2.010.640.530.350.88
Egypt1.500.530.610.260.72
Russia0.890.550.690.410.63
Pakistan1.200.460.560.240.62
Iran0.520.440.530.230.43
The Green Economy Index and its sub-indices were calculated using data originating from [13,16,17,18,19,20,21,22,23,24].
Disclaimer/Publisher’s Note: The statements, opinions and data contained in all publications are solely those of the individual author(s) and contributor(s) and not of MDPI and/or the editor(s). MDPI and/or the editor(s) disclaim responsibility for any injury to people or property resulting from any ideas, methods, instructions or products referred to in the content.

