Review

The Sustainable Management of Nitrogen Fertilizers for Environmental Impact Mitigation by Biochar Applications to Soils: A Review from the Past Decade

by
Yudai Kohira
1,*,
Desalew Fentie
1,2,
Mekuanint Lewoyehu
1,3,
Tassapak Wutisirirattanachai
1,
Ashenafei Gezahegn
4,
Milkiyas Ahmed
5,
Shinichi Akizuki
6,
Solomon Addisu
7 and
Shinjiro Sato
1
1
Graduate School of Science and Engineering, Soka University, Tokyo 192-8577, Japan
2
College of Agriculture Food and Climate Science, Injibara University, Injibara P.O. Box 40, Ethiopia
3
Department of Chemistry, Bahir Dar University, Bahir Dar P.O. Box 79, Ethiopia
4
Department of Natural Resources Management, College of Agriculture and Environmental Sciences, Debark University, Debark P.O. Box 90, Ethiopia
5
College of Agriculture and Veterinary Medicine, Jimma University, Jimma P.O. Box 307, Ethiopia
6
Institute of Plankton Eco-engineering, Soka University, Tokyo 192-8577, Japan
7
College of Agriculture and Environmental Science, Bahir Dar University, Bahir Dar P.O. Box 79, Ethiopia
*
Author to whom correspondence should be addressed.
Environments 2025, 12(6), 182; https://doi.org/10.3390/environments12060182
Submission received: 7 May 2025 / Revised: 26 May 2025 / Accepted: 28 May 2025 / Published: 30 May 2025

Abstract

This review assesses biochar’s potential to mitigate nitrogen (N) losses when co-applied with N fertilizers, emphasizing mechanisms linked to its measurable physicochemical properties. The mitigation of ammonia (NH3) volatilization shows variable effects from its cation exchange capacity (−21.7% to 20.4%) and specific surface area (SSA; −23.8% to 39.1%). However, the biochar pH (influencing mitigation from −45.0% to −9.0%) and application rate are key factors, with clayey soils exhibiting the greatest mitigation (−52.2%), potentially due to their high bulk density. High SSA biochar, often from high pyrolysis temperatures, reduces nitrate-N (NO3-N) leaching (up to −26.6%) by improving the soil’s water-holding capacity. A co-application with organic fertilizers shows a pronounced mitigation (up to −39.0%) due to a slower N release coupled with biochar adsorption. A high SSA also plays an important role in mitigating nitrous oxide (N2O) emissions (up to −25.9%). A higher biochar C/N ratio promotes microbial N immobilization, contributing to N2O reductions (+1.5% to −34.2%). Mitigation is greater in sandy/loamy soils (−18.7% to −7.9%) than in clayey soils, where emissions might increase (+18.0%). Overall, biochar applications demonstrate significant potential to mitigate N losses and improve N use efficiency, thereby supporting sustainable agriculture; however, its effectiveness is optimized when biochar properties (e.g., high SSA and appropriate C/N ratio) and application strategies are tailored to specific soil types and N sources.

Graphical Abstract

1. Introduction

Nitrogen (N) fertilizer is a common fertilizer in modern agriculture and is used in large quantities to meet the increasing food demand of a growing world population [1]. Since the global spread of inorganic N fertilizer, the world population has continued to increase explosively along with the dramatic increase in the crop yield per acre of agricultural land, reaching a peak of about 9.7 billion in 2050 and 10.4 billion in 2080, and is projected to remain at that level until 2100 [2]. However, the intensive use of chemical N fertilizers, such as urea-, ammonium-N (NH4+-N)-, and nitrate-N (NO3-N)-based fertilizers, has led to pressing environmental concerns. These include ammonia (NH3) volatilization contributing to air pollution, nitrate (NO3-N) leaching causing groundwater contamination and eutrophication, and emissions of nitrous oxide (N2O), a potent greenhouse gas with a global warming potential approximately 265–298 times that of carbon dioxide (CO2) [3,4,5]. These N losses from the soil not only pose environmental risks but also reduce the N use efficiency (NUE) of crops [6], challenging the sustainability of agricultural systems.
Compared to chemical fertilizers, organic fertilizers have a lower environmental impact, prevent the destruction of soil microflora, and provide a continuous supply of nutrients over a long period [7,8,9]. However, organic fertilizers have some disadvantages, including a nutrient imbalance, difficulty in storage and handling, and limited availability of feedstock, and thus have not become as popular as chemical fertilizers [10,11]. Therefore, it is necessary to find more sustainable ways to improve crop NUE while mitigating N losses from the soil regardless of fertilizer type.
Biochar, a carbonaceous material produced from the pyrolysis of organic materials under anoxic conditions [12], has garnered increasing attention as a soil amendment with the potential to mitigate these N-related environmental issues. Previous studies indicate that biochar applications can reduce NH3 and N2O gas emissions and decrease NO3-N leaching [6,13,14], thereby improving soil fertility and potentially increasing crop yields when co-applied with fertilizers [15,16].
Despite these promising findings, a clear and comprehensive understanding of the mechanisms by which biochar mitigates various N losses, particularly focusing on the role of its specific physicochemical properties, remains an area requiring further synthesis, especially from research conducted over the past decade. An earlier review published about 10 years ago touched upon the exhaustive N loss mitigation effects of biochar but lacked a detailed data analysis, reporting mainly general tendencies. More recent reviews and meta-analyses have often concentrated on individual N loss pathways, such as NH3 volatilization, NO3-N leaching, or N2O emissions, rather than a simultaneous, integrated assessment. Consequently, there is a limited number of studies that comprehensively evaluate the effects of biochar on all three major N loss pathways when co-applied with N fertilizers and critically link these effects to a range of biochar’s inherent physicochemical properties based on recent quantitative data.
This review aims to address this knowledge gap by systematically evaluating the interaction between pristine biochar and N fertilizers across multiple N loss pathways (NH3 volatilization, NO3-N leaching, and N2O emissions), based on quantitative data from studies published between 2014 and 2023. The novelty of this study lies in its focused analysis of how biochar’s overall physicochemical characteristics—such as its pH, cation exchange capacity (CEC), specific surface area (SSA), total carbon (TC), total nitrogen (TN), C/N ratio, and ash content—influence its N loss mitigation performance. By examining these relationships, this research seeks to provide a new, integrated understanding of how different biochar feedstocks and pyrolysis conditions affect N retention and loss. Ultimately, this study offers insights into optimizing biochar applications for an improved N use efficiency and reduced environmental impacts, contributing to the development of more sustainable agricultural practices.
The subsequent sections of this review are structured as follows: Section 2 details the methodology for the data compilation and analysis. Section 3, ‘Results and Discussion’, forms the core of this paper. It begins with an analysis of biochar physicochemical properties based on feedstock types (Section 3.1). It then systematically evaluates the mitigation effects of biochar on NH3 volatilization (Section 3.2), NO3-N leaching (Section 3.3), and N2O emission (Section 3.4). Each of these subsections is further divided to discuss the influence of biochar’s intrinsic physicochemical properties first, followed by the impact of various experimental conditions. Principal component analyses (PCA) are also presented within these sections to elucidate complex interactions. Finally, Section 4 provides overall conclusions and suggests directions for future research.

2. Materials and Methods

2.1. Data Compilation

Data on changes in NH3 volatilization, NO3-N leaching, and N2O emission by biochar application were collected by searching published literature on the Scopus and Google Scholar databases using combinations of keywords of “biochar” AND “ammonia” OR “NH3” AND “volatilization” AND “nitrate” OR “NO3” AND “leaching” AND “nitrous oxide” OR “N2O” AND “emission” in the title field and “soil” in the topic field for the period between 2014 and 2023 (for 10 years). The initial search on Scopus and Google Scholar databases yielded approximately 450 articles. After screening titles and abstracts for relevance to the keywords and scope, around 150 articles were selected for full-text review before applying the detailed inclusion/exclusion criteria outlined below. Among those, studies that satisfied the following conditions were finally included in this review: studies (i) included at least three replicates per treatment; (ii) contained paired control (fertilizer alone) and biochar application (fertilizer + biochar); (iii) reported cumulative NH3 volatilization, NO3-N leaching, or N2O emission data with experimental-unit area; (iv) conducted by pristine (i.e., unmodified) biochar without chemical and physical modifications; and (v) written in English. Conversely, studies were excluded if they: (a) were themselves review articles or meta-analyses; (b) did not provide quantitative, replicable data for both control (fertilizer alone) and biochar co-application treatments regarding cumulative N losses; (c) utilized biochar that had undergone significant chemical or physical modifications beyond typical pristine production (as this study focused on pristine biochar); (d) lacked clear reporting of essential experimental details such as biochar application rates or fundamental production conditions relevant to its properties; or (e) were not published in English. This focused selection aimed to enhance comparability and ensure the reliability of the synthesized data. Based on these inclusion/exclusion criteria, 20 studies for NH3 volatilization (n = 101), 29 studies for NO3-N leaching (n = 102), and 23 studies for N2O emission (n = 100) were selected. Here, “n” refers to the total number of individual data points (observations or treatment means from replicated experiments) extracted from the compiled studies for each respective N loss pathway. This study focused exclusively on pristine biochar. Modified biochar often possesses specific chemical or physical properties (e.g., altered surface functional groups or attached nanoparticles) that can complicate its effects on N loss. In contrast, pristine biochar retains the characteristics typically obtained under standard production conditions, making it more suitable for elucidating the fundamental relationship between biochar properties and soil N dynamics. By adopting this criterion, we aimed to enhance the comparability between studies and ensure that the interpretation of results remains consistent and reliable. Data were collected from tables and figures of these selected studies. The selected total of 72 studies were listed in Table 1.
When collecting data, if actual measured values were described in the text, those values were collected. When actual measured values were not described in the text, data were extracted directly from the figure using WebPlotDigitizer (version 4.7) (available at https://automeris.io/WebPlotDigitizer.html; accessed on 10 September 2024). This tool is widely utilized as an efficient and accurate method for extracting numerical data from published graphs and figures [81]. To ensure accuracy, we conducted the following validation steps: First, we used graphs with known numerical data and extracted the data using WebPlotDigitizer. The extracted values were then compared with the original data, confirming a margin of error within ±0.1%. Additionally, all data extraction processes were independently performed by two researchers, and their results were cross-checked to ensure precision. These measures enhance the reliability of the extracted data. Either the mean or experimental unit-level data were collected depending on data availability. In this case, biochar application rates per unit area were calculated using the area of the experimental vessel and the amount of biochar applied. Soil texture was largely classified into the following three categories: clayey (clay, silty clay, and sandy clay), loamy (silt, sandy clay loam, slay loam, silty clay loam, loam, and silty loam), and sandy (sand, loamy sand, and sandy loam) soils following the methodology from previous study [82].

2.2. Data Analysis

Changes in NH3 volatilization, NO3-N leaching, and N2O emission with biochar treatments to the corresponding control treatments (i.e., fertilizer alone) (referred to as “reduction index (Rindex)” hereafter) were calculated with the following Equation (1):
R i n d e x ( % ) = V B T V C T / V C T × 100
where VBT represents NH3 volatilization, NO3-N leaching, and N2O emission in biochar treatment and VCT represents that of fertilizer alone condition (control), respectively [82]. Positive or negative Rindex values indicate that N loss is enhanced or mitigated by biochar soil application compared to control, respectively.
Differences in Rindex among biochar pyrolysis temperature, biochar physicochemical properties (pH, CEC, specific surface area (SSA), total C (TC), total N (TN), C-to-N ratio (C/N ratio), and ash content), biochar application rate to soil, experimental types, fertilizer types, and soil type (texture and initial pH) were assessed by one-way analysis of variance (ANOVA) using the statistical software Statistica 6.1 (StatSoft. Inc., Tulsa, OK, USA). A Tukey honestly significant difference (HSD) analysis was performed for multiple comparisons of the treatment effects. Statistical significances were determined at p < 0.05. Principal component analysis (PCA) was performed to investigate the important components in the large data set, and the parameters for biochar physicochemical properties were introduced as the analysis variables in the PCA. Correlations among biochar physicochemical properties were computed with Pearson’s two-tailed test at p < 0.05. Pearson correlation analysis was distinguished by biochar feedstock, and it was performed for lignocellulosic feedstock (n = 92) and non-lignocellulosic feedstock (n = 31). The PCA and Pearson correlation analysis and graph creation were both conducted by Origin software (OriginPro 2024).

3. Results and Discussion

3.1. Biochar Physicochemical Properties

The physicochemical properties of biochar have been found to be highly dependent on the feedstock type and pyrolysis temperature [83]. In this study, biochar produced from lignocellulosic (e.g., wood, agricultural residues, herbaceous plants, etc.) and non-lignocellulosic feedstock (e.g., animal manure, municipal waste, microbial biomass, etc.) was broadly classified and evaluated.
Firstly, for lignocellulosic feedstock, the pyrolysis temperature of the biochar showed a significant positive correlation with the pH (r = 0.36; p < 0.001), SSA (r = 0.51; p < 0.001), and C/N ratio (r = 0.30; p < 0.01; Figure 1). As the pyrolysis temperature of the biochar increases, the pH increases due to the enrichment of alkaline components (K, Ca, Mg, etc.), especially carbonates, and the decomposition of surface acidic functional groups on biochar [84]. The SSA and porosity of the biochar have also been found to vary significantly with the pyrolysis temperature, probably due to the decomposition and/or volatilization of organic matter and the formation of micropores [85]. In addition, the aromaticity of C in biochar increases with increasing pyrolysis temperatures, while N decreases with volatilization, resulting in an increase in the C/N ratio [86,87]. Similarly, for biochar derived from non-lignocellulosic feedstock, the pyrolysis temperature was very strongly and significantly positively correlated with the pH (r = 0.69; p < 0.001) and C/N ratio (r = 0.48; p < 0.01; Figure 2). However, differently from the case of the lignocellulosic feedstock, the positive correlation between the pyrolysis temperature and SSA (r = 0.44) was not significant. This suggests that, compared to lignocellulosic feedstocks, the structure in non-lignocellulosic feedstock is fragile without structured cell walls and is heterogeneous with a high ash content and that pores do not simply develop as the pyrolysis temperature increases [88]. This could be supported by the non-significant but positive correlation between the pyrolysis temperature and ash content (r = 0.54). A negative correlation was observed between the pyrolysis temperature and TN (r = −0.40; p < 0.05). This significance was because biochar made from non-lignocellulosic feedstock, such as animal manure, generally contains a high amount of N compared with that of lignocellulosic feedstock, and the N reduction amount is proportionally high with the increasing pyrolysis temperature.
In lignocellulosic feedstock biochar (Figure 1), highly significant positive and negative correlations were found between the C/N ratio and TC (r = 0.47; p < 0.001) and the C/N ratio and TN (r = −0.54; p < 0.001). On the other hand, for non-lignocellulosic feedstock biochar (Figure 2), there was no correlation between the C/N ratio and TC (r = −0.011) and there was a significant negative correlation between the C/N ratio and TN (r = −0.53; p < 0.01). This result suggested that in lignocellulosic biochar the increase in C and decrease in N directly affect the C/N ratio, while in non-lignocellulosic biochar the increase or decrease in C is not relevant, and the decrease in N contributes significantly to the C/N ratio. Therefore, although there was a significant positive correlation between the pyrolysis temperature and C/N ratio for both biochar feedstock types (r = 0.30 to 0.48; p < 0.01; Figure 1 and Figure 2), the causes of the change in the C/N ratio were different.

3.2. Mitigation of Ammonia Volatilization

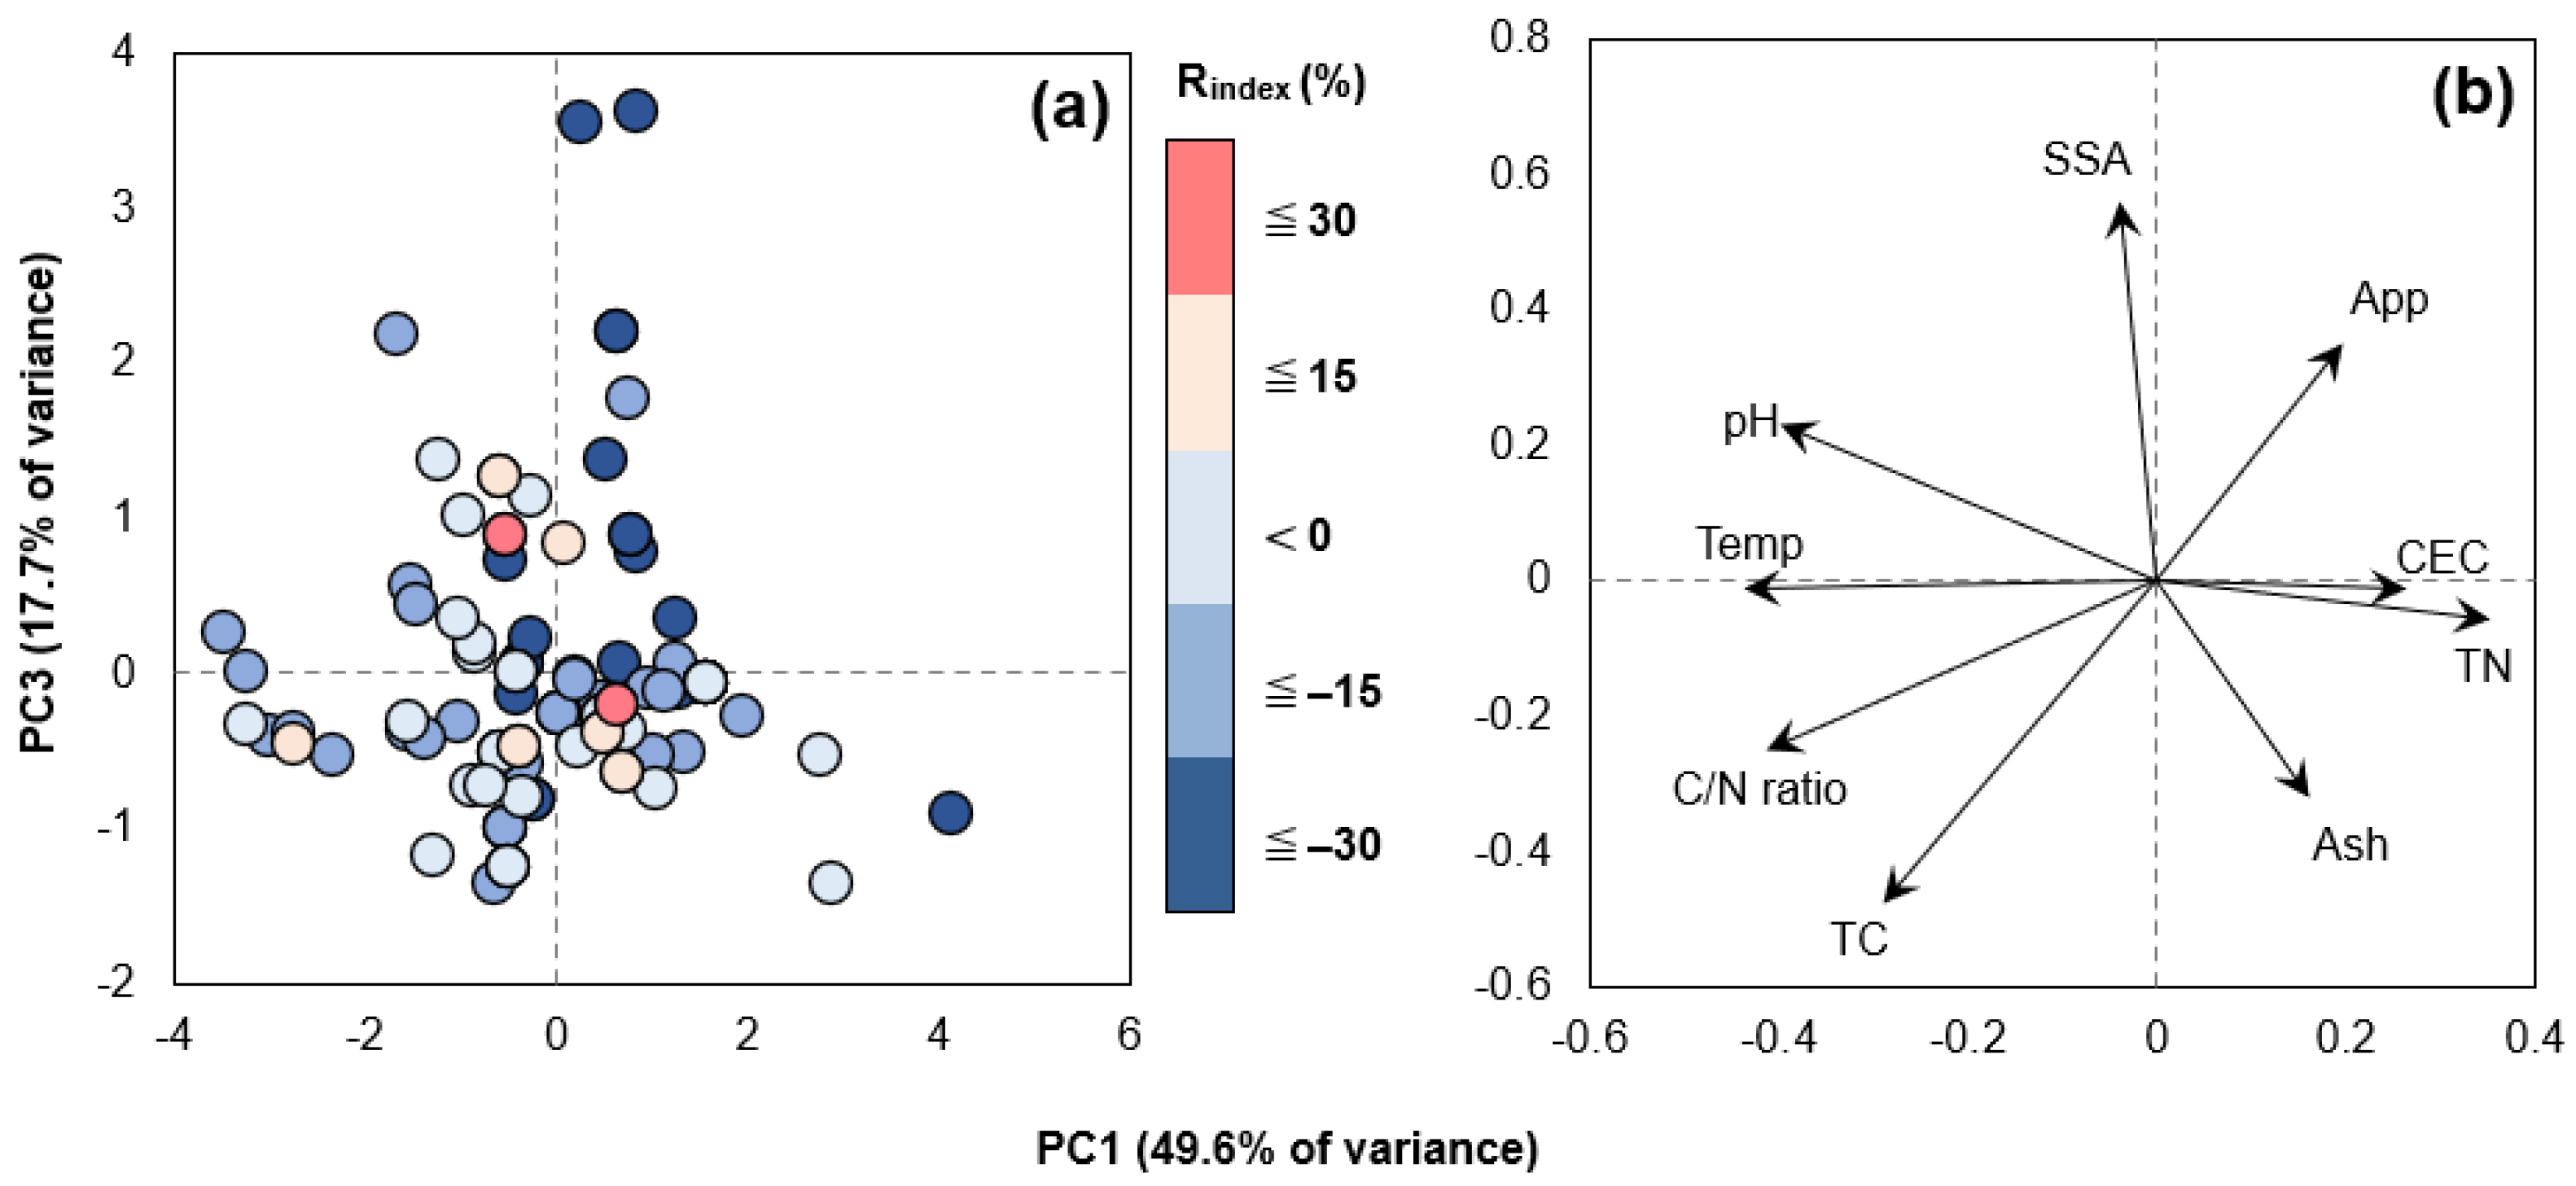
3.2.1. Effect of Biochar Physicochemical Properties

It is well known that the decrease in the NH3 volatilization was related to the change in soil physicochemical properties and microbial activities [34]. From the results, the biochar pyrolysis temperature increased from low to high and the Rindex also increased (−34.4% to −9.2%; Figure 3a), indicating that the effect of biochar on the NH3 volatilization mitigation was weakened. This is probably due to the influence of the biochar pH. In general, NH3 volatilization would easily occur with soil pH increases [89]. Biochar has a high pH and when applied to soil, a liming effect (i.e., increasing soil pH) would immediately occur. In fact, in this study, it was shown that biochar with a high pH increased the Rindex, which was a similar trend to the pyrolysis temperature (Figure 3b). In this study, there was a significant positive correlation between the biochar pyrolysis temperature and pH (Figure 1 and Figure 2), clearly suggesting that the biochar pH was closely related to the increasing NH3 volatilization. More specifically, the biochar pH is highly related to the ash content in biochar [90]. In this study, the NH3 volatilization was significantly enhanced when the biochar ash content was more than 16% (25.1%), compared to less than 15% (−52.2%; Figure 3h), suggesting that the effect of the pH change was substantial for the NH3 volatilization.
A previous study concluded that biochar applications increased the soil CEC, leading to a mitigated NH3 volatilization because of the increased NH4+-N adsorption (i.e., retention) capacity compared to soil without biochar [17]. In addition, another previous study also reported that the biochar SSA was probably responsible for the NH4+-N adsorption and mitigating the NH3 volatilization [22]. Based on this knowledge, we hypothesized that biochar with a high CEC and SSA would improve the soil N retention capacity through adsorption and could decrease the NH3 volatilization. However, in this study, the biochar CEC (Figure 3c) showed a negative Rindex only below 20 cmol+ kg−1 (−21.7%), while biochar with a high CEC (above 21 cmol+ kg−1) conversely enhanced the NH3 volatilization (2.3% to 20.4%). The biochar’s SSA (Figure 3d) was −23.8% and −7.7% below 51 m2 g−1 and above 101 m2 g−1, respectively, while a SSA of 51–100 m2 g−1 substantially enhanced the NH3 volatilization (39.1%). These results showed different tendencies from our hypothesis. These results probably suggested that soil applications of biochar with a high CEC and SSA would not always contribute to the NH3 volatilization mitigation because the soil pH could increase due to the high pH of the biochar. There may be an inexplicable and subtle equilibrium between the biochar CEC and SSA, the soil pH, and the NH3 volatilization upon biochar applications to the soil. According to the boosted regression tree (BRT) analysis from a previous study [91], the soil pH (18.3%) and biochar pH (16.4%) were the first and second most important explanatory variables for the NH3 volatilization response to biochar applications, respectively. Indeed, several previous studies have observed that a rapid increase in the soil pH after a biochar application enhanced the NH3 volatilization [19,24,31]. However, a previous study also reported that biochar characteristics (TC, SSA, and CEC) and the biochar application rate are equally important variables for NH3 volatilization [91].
The biochar C/N ratio and Rindex results (Figure 3g) for biochar showed that it mitigated NH3 volatilization in all ranges, but the effect weakened as the C/N ratio increased (−22.3% to −12.0%). This was possibly because of the decreased nitrifying microbial activity. From a previous study, an increase in the soil C/N ratio inhibits nitrification [92]. A previous study reported that under N fertilization, nitrification rates, ammonia-oxidizing bacteria (AOB), and ammonia-oxidizing archaea (AOA) gene copy numbers responded negatively to biochar applications [93]. They concluded that the biochar application suppressed the nitrification in soil by altering the AOB and AOA community structure and decreased the relative abundance of key functional ammonia-oxidizers, such as Nitrosospira, Nitrosomonas, and Nitrosopumilus. Therefore, it was considered that the application of biochar with a high C/N ratio in this study weakened the mitigation effect for the NH3 volatilization due to the prolonged NH4+-N residence time by inhibiting nitrification. In addition, a previous study documented that the application of biochar with a high C/N ratio (i.e., produced by a high pyrolysis temperature) in soil could increase the soil pH and simultaneously increase the NH3 volatilization [21].
Increasing the biochar application rate (Figure 3i) reduced the NH3 volatilization up to a moderate level of application (≦50 t ha−1; −13.3% to −27.8%), but conversely enhanced the NH3 volatilization at amounts above a certain level (51 t ha−1≦; 7.6%). A previous study reported that increasing the biochar application rate from 10 to 60 t ha−1 in paddy fields significantly enhanced the NH3 volatilization [24]. They concluded this phenomenon was mainly due to the increased pH of the surface floodwater and soil and the suppressed nitrification process induced by the biochar application. Another possible mechanism for the increased NH3 volatilization with increasing biochar application rates could also be attributed to the improved gas exchange capability of the soil due to the drastic reduction in the soil bulk density (BD) and the concomitant increase in the pore connectivity caused by a large amount of biochar applications [28,94]. This study suggested that a biochar application of up to 50 t ha−1 is suitable for the mitigation of NH3 volatilization because it prevents excessive soil pH increases and soil BD decreases.
For the PCA, the Pearson correlation coefficient between the NH3 volatilization Rindex and PC1 was 0.328 (p < 0.001). Thus, the PCA results were applied with PC1 and PC2 as the x-axis and y-axis, respectively (Figure 4). In this scores plot (Figure 4a), data on the Rindex in NH3 volatilization due to biochar applications were shown as points. When PC1 was a positive value, the data indicate an increasing NH3 volatilization due to the biochar application, while when PC1 was a negative value, the data indicate a decrease in the NH3 volatilization due to the biochar application. From the results of the vectors plot (Figure 4b), PC1 was related to the biochar ash content, C/N ratio, pyrolysis temperature, pH, CEC, SSA, and, slightly, to the biochar application rate. These arrows indicated the contributions of different variables to the main components, and the vector length corresponded to the importance of the variables. The scores plot result (Figure 4a) showed that PC1 and PC2 tended to have a high Rindex in the positive value areas (i.e., the upper-right corner of the graph). It was shown that the biochar C/N ratio, CEC, pyrolysis temperature, and pH were particularly important vectors for this range (Figure 4b). This result indicated that these factors may have negatively influenced the NH3 volatilization mitigation. On the other hand, the TN showed negative values in PC1 and a completely opposite direction to the ash content. This result suggested that the biochar TN may have had a positive effect on the NH3 volatilization mitigation. These results were almost consistent with Figure 3.

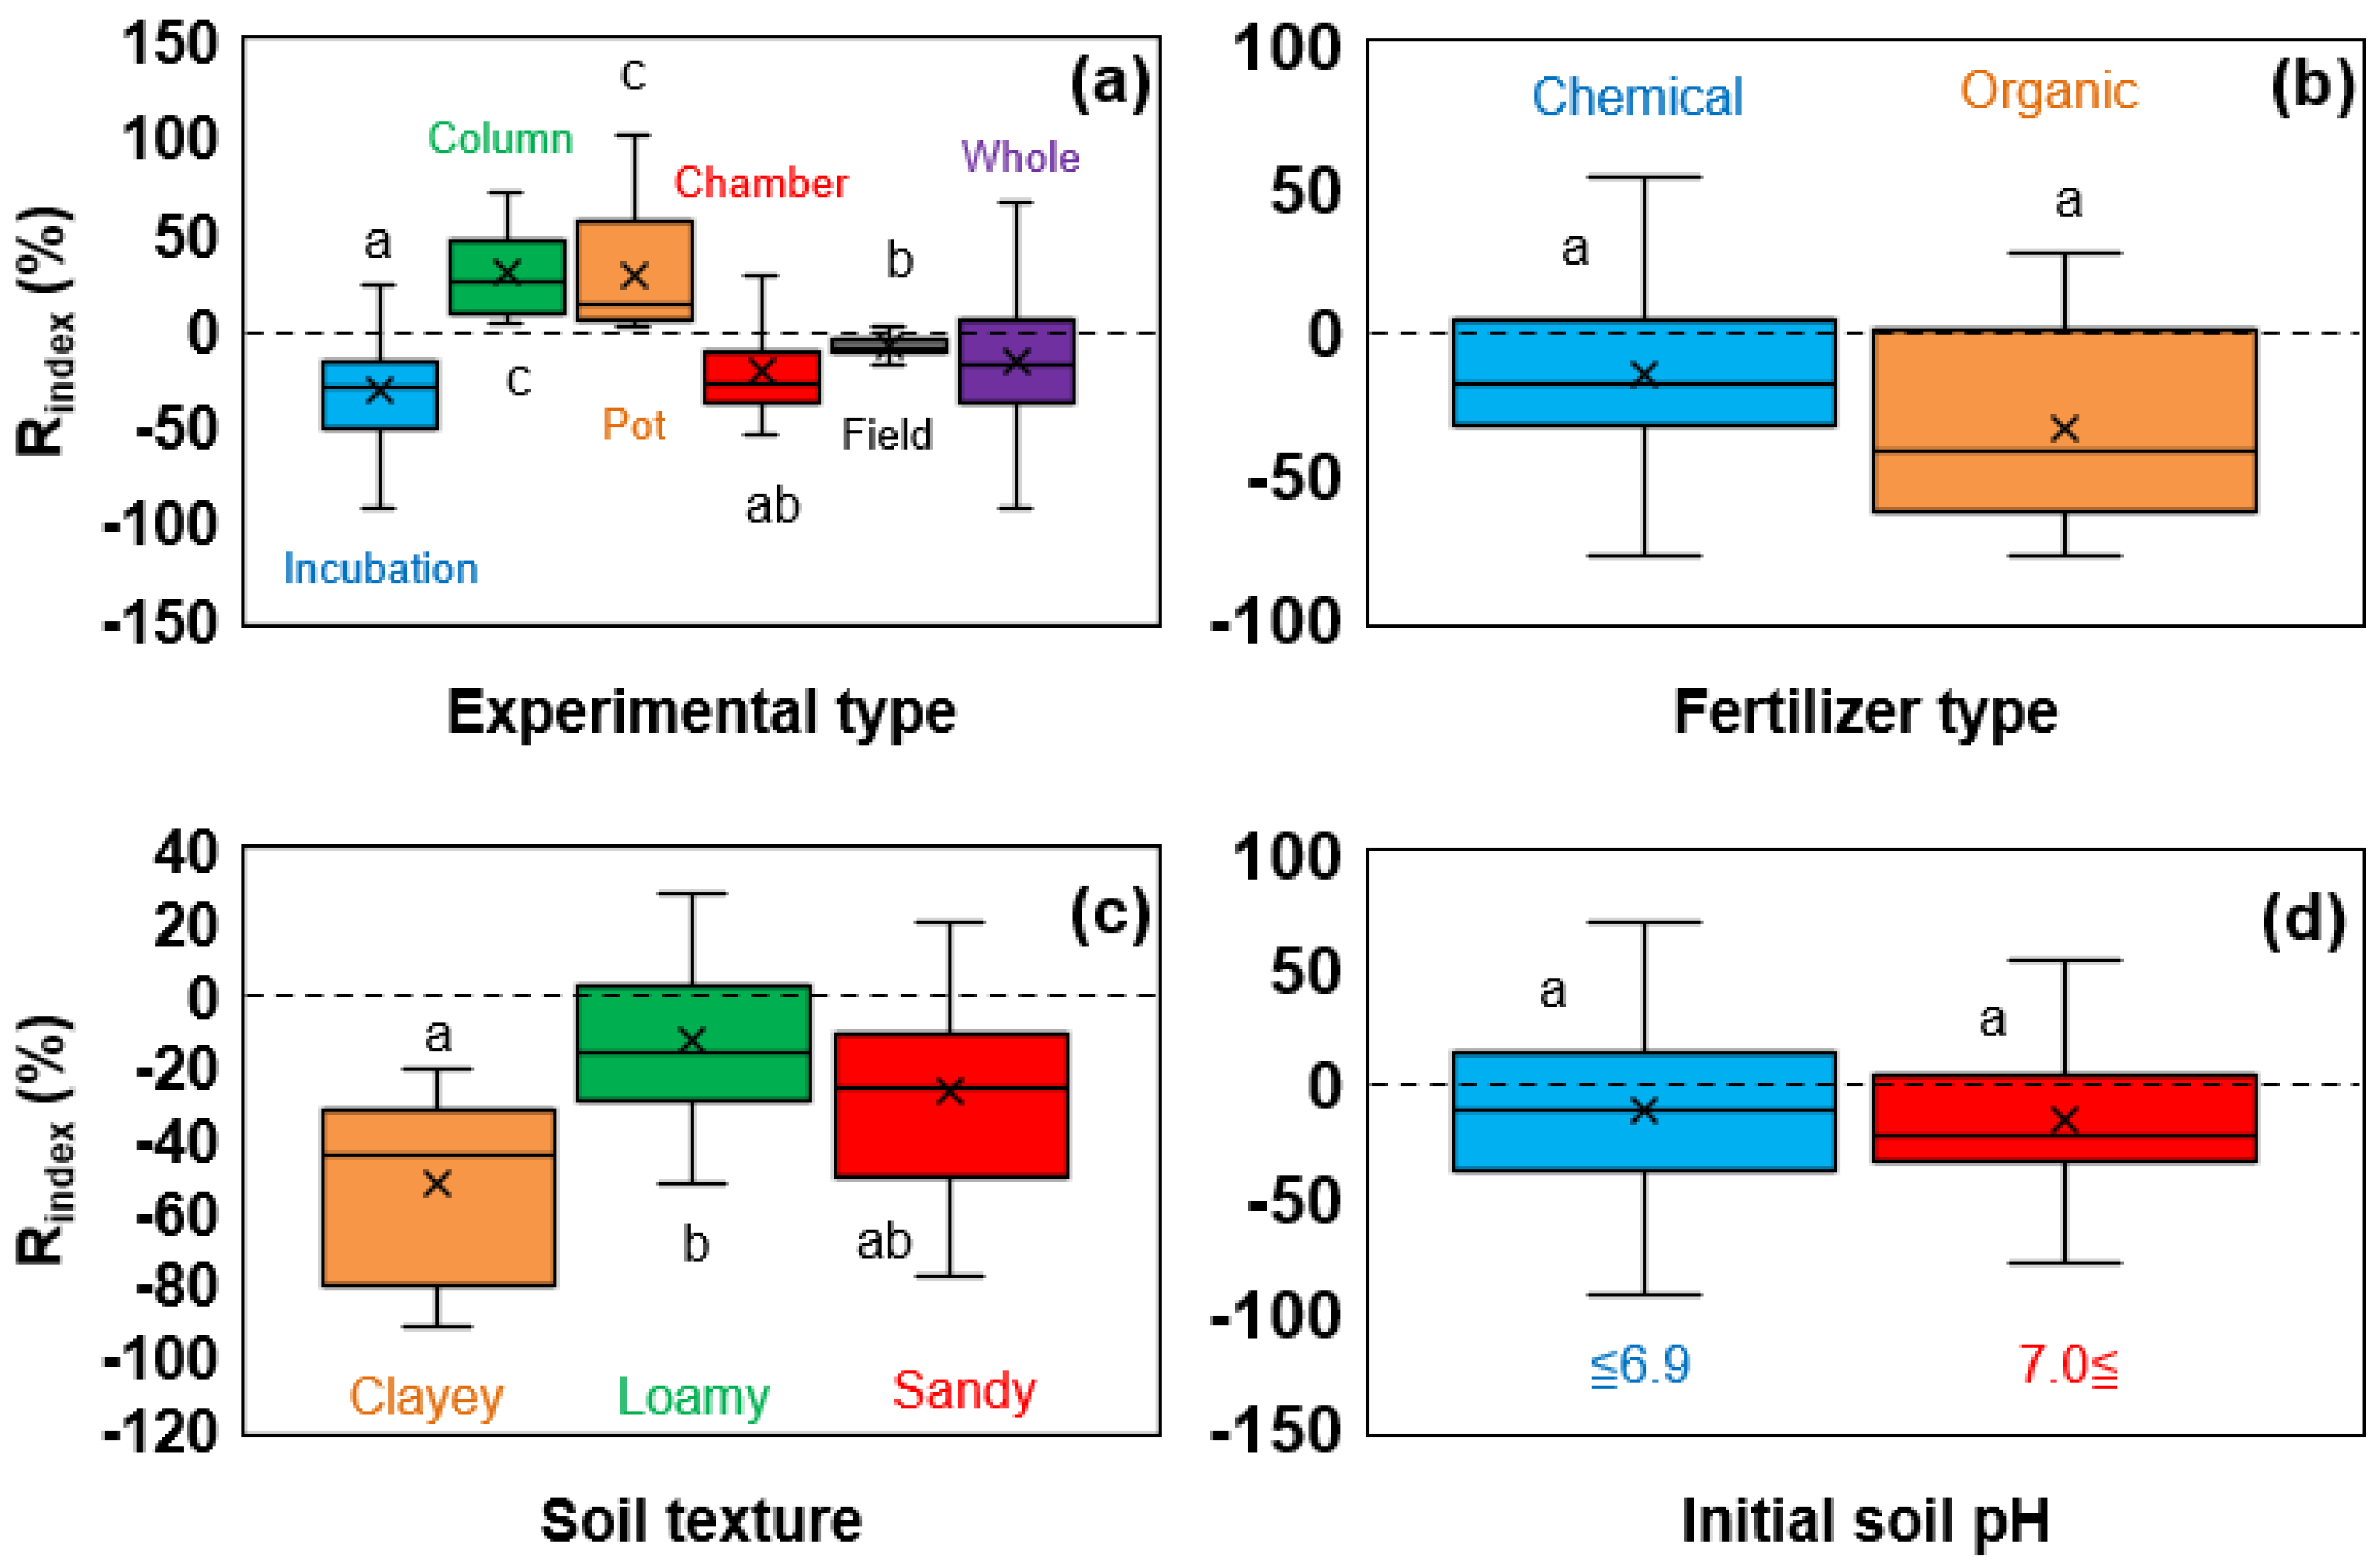
3.2.2. Effect of Various Experimental Conditions

The effects of various experimental conditions on the NH3 volatilization from biochar applications were investigated (Figure 5). The experimental types (Figure 5a) showed the NH3 volatilization-mitigating effects in the incubation (−31.5%), chamber (−20.7%), and field (−8.4%), while the column (30.8%) and pot (29.0%) showed NH3 volatilization-enhancing effects. Although the overall NH3 volatilization mitigation effect (whole) was shown at −16.1%, these results indicate that the effect of biochar applications on NH3 volatilization varies greatly depending on the experimental conditions. Therefore, it cannot be generalized that the application of biochar causes NH3 volatilization mitigations at all times.
The co-application of the organic fertilizer and biochar was more effective in mitigating NH3 volatilization (−33.3%) than that of the chemical fertilizer (−14.1%; Figure 5b). This may be because the chemical fertilizers in this study had a higher number of urea samples (n = 79 out of 88 for chemical fertilizer). Urea initially increases the soil pH around granules due to the formation of carbonate during hydrolysis, following the equation of [95]:
C O ( N H 2 ) 2 + 2 H 2 O 2 N H 4 + + C O 3 2
In addition, because the activity of urease, a soil enzyme for the hydrolysis of urea, increases when the soil pH is alkaline [96], the increased pH caused by the biochar may have accelerated hydrolysis. Therefore, urea was considered less effective in mitigating the NH3 volatilization by biochar due to its tendency to easily and rapidly generate NH3 after fertilization.
The NH3 volatilization Rindex results for different soil textures showed significant differences among soil types (Figure 5c). The maximum NH3 volatilization mitigation effect of −52.2% was observed on clayey soils and smaller effects of −26.6% on sandy soils and −12.7% on loamy soils. This may be attributed to the change in the magnitude of the reduction in the soil BD due to the biochar application. As described above, when the soil BD is reduced, the soil gas exchange capability increases. The NH3 volatilization mitigation effect of biochar may have been highly influenced by the soil’s original BD, assuming that the biochar application changes the soil BD in similar magnitudes in different textured soils. Therefore, the Rindex in clayey soils was more pronounced because of their higher original BD and cohesive structure compared to loamy and sandy soils. A similar result was observed in a previous study [91].
Rindex results with a different initial soil pH did not change significantly (Figure 5d). The Rindex was −11.0% for acidic soils (below pH 6.9), while it was −15.5% for neutral to alkaline soils (above pH 7.0). As discussed earlier, it was shown that a greater NH3 volatilization would be observed in soils with more biochar applications since the biochar pH was the primary factor in enhancing the NH3 volatilization, but in this study, the results showed insignificant Rindex values between acidic and alkaline soils. Therefore, the initial soil pH may not be an important factor, suggesting that the NH3 volatilization mitigation effect was maintained even in alkaline soils.

3.3. Mitigation of Nitrate Leaching

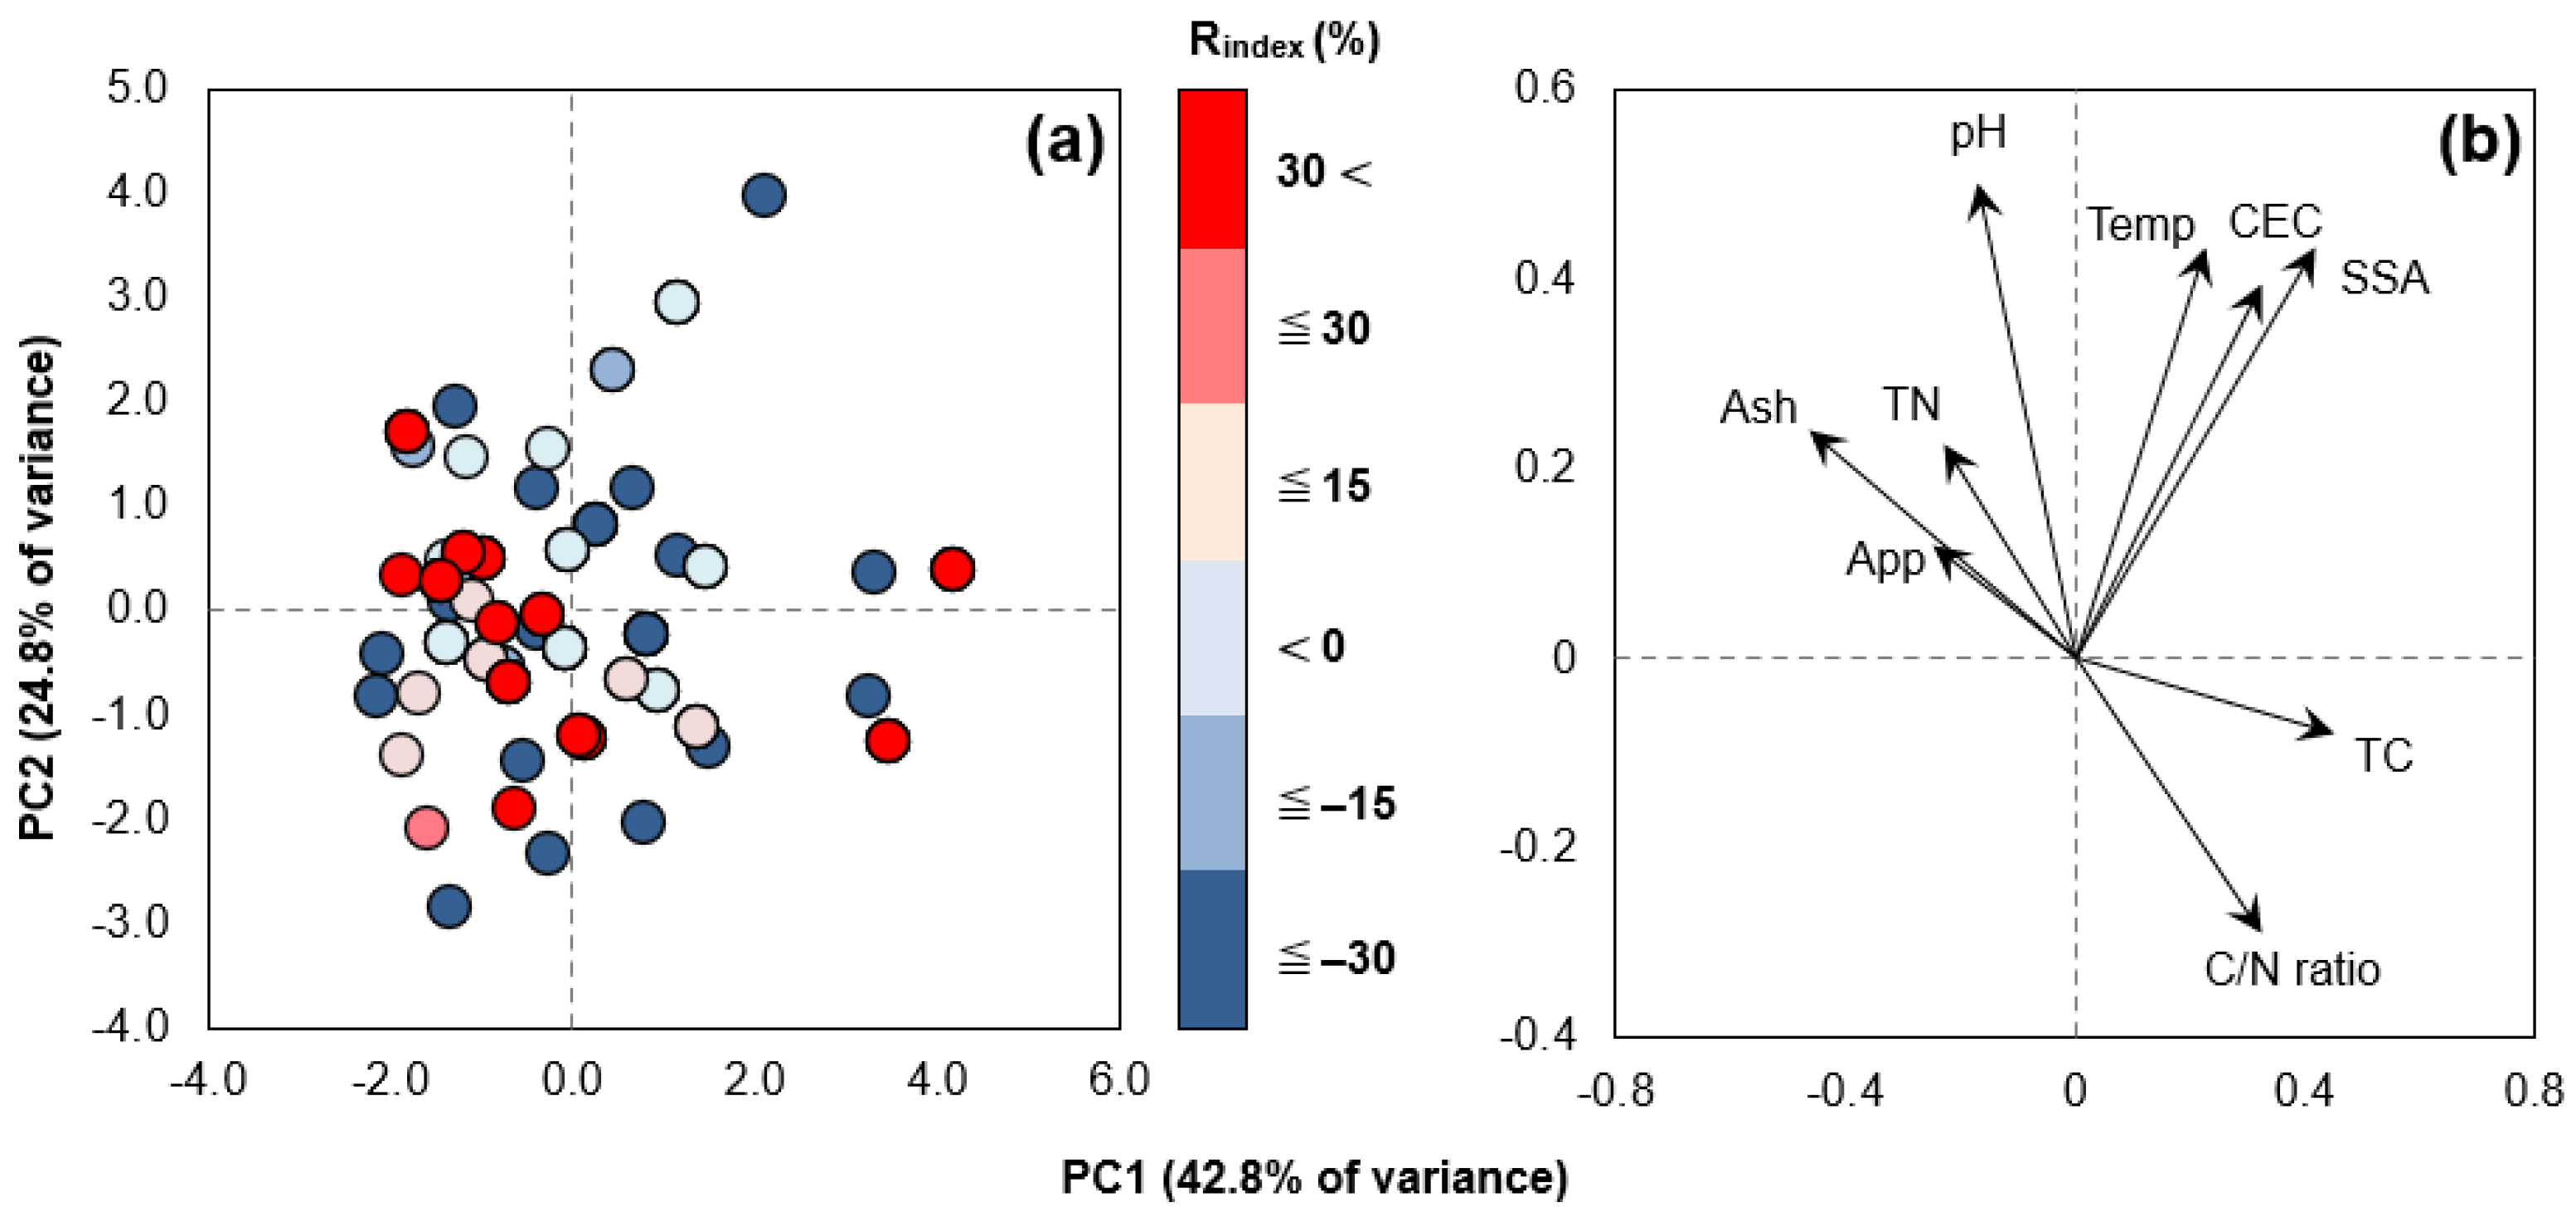
3.3.1. Effect of Biochar Physicochemical Properties

When biochar was applied to soil, the Rindex for the NO3-N leaching was generally negative regardless of physicochemical properties (Figure 6). In general, the amount of NO3-N leaching depends mainly on the water-holding capacity (WHC) of the soil, with a high WHC resulting low NO3-N leaching [97]. It is known that biochar applications to soil can significantly improve the soil WHC, but this soil WHC improvement effect varies greatly depending on biochar properties, such as the particle size, SSA, and porosity, with a smaller particle size and a larger SSA being more effective [98]. Therefore, it has been reported that biochar pyrolyzed at high temperatures resulted in a higher SSA and porosity than that at lower temperatures, which improved the soil WHC after the application to the soil [99]. In this study, Rindex results for different biochar pyrolysis temperatures (−19.6% to −26.9%; Figure 6a) and SSAs (−17.6% to −22.6%; Figure 6d) showed a trend of a decreasing NO3-N leaching with increasing values in each parameter, even though there were no significant differences. Furthermore, the biochar SSA probably contributed to the adsorption and retention of NO3-N, which may have reduced the mobility of NO3-N in soil [100].
Due to changes in the biochar pH (Figure 6b), the Rindex showed negative values (−10.0% to −28.2%) under all conditions, but particular trends and significant differences were not observed. Several previous studies have shown that biochar could have increased the soil pH and subsequent microbial colonization, thereby enhancing the soil microbial and enzyme activity and affecting soil N dynamics [62,96]. However, this study suggested that the change in the biochar pH was not an important factor for NO3-N leaching. In addition, there was no significant change in the Rindex with differences in the biochar ash content (−11.6% to −12.3%; Figure 6h), which is closely related to the change in the biochar pH.
Due to the change in the biochar CEC, the Rindex showed some differences ranging from −18.9% to −27.3%, but these were also insignificant (Figure 6c). Previous studies have suggested that biochar could adsorb NO3-N through pore filling, not through chemical adsorption, such as electrostatic interactions and ion exchange [101,102]. In general, biochar has a negative surface charge and is repelled by NO3-N in soil [103], suggesting that the effect of the biochar CEC may not be related to NO3-N leaching.
Among the biochar physicochemical properties in this study, only the biochar TC significantly affected the mitigation of NO3-N leaching, with the highest TC showing the highest mitigation effect (−18.4% to −33.8%; Figure 6e). In addition, although it was insignificant, a decreasing trend in the Rindex was observed with increasing biochar C/N ratios (−15.4% to −24.9%; Figure 6g). These results may have attributed to the high C content of biochar creating soil aggregates. A previous study assessed the C content of different sizes of aggregates (>1000, 250–1000, 100–250, 53–100, and 25–53 µm) in soils affected by the application of biochar to clarify its potential and mechanism for mitigating NO3-N leaching from soils [37]. Their results showed that the biochar application increased the C content of soil aggregates between 53 and 1000 µm in size, which corresponded to the mesopores that could hold the available water in the soil. This was associated with a significant increase in the WHC (average increase of 9%) compared to the control, which may have affected the mitigation of the NO3-N leaching.
Another possible mechanism is a decrease in the soil BD, which was not included in the data set in this study. According to a previous study [61], the soil BD was lower in the biochar-applied soils (1.27–1.28 g cm−3) than that in the control (1.33 g cm−3). They discussed that the low BD possibly increased the soil WHC. Indeed, in this study, as the biochar application rate increased, the Rindex showed a decreasing trend, which was especially significant at application rates above 51 t ha−1 (Figure 6i). Therefore, it was suggested that the decrease in the soil BD improved the soil water retention and was effective in mitigating NO3-N leaching.
Other important perspectives on the effects of the soil microbial activity to mitigate NO3-N leaching were also suggested by a previous study [27]. They used a functional gene-specific qPCR (to investigate soil nitrifying bacteria) to elucidate the mechanism of the biochar NO3-N leaching mitigation by the co-application of digestate and biochar. Their results showed that in all soil layers, the amount of soil AOB was markedly reduced in the biochar-applied soil compared to the control, showing that NO3-N leaching was mitigated by the delayed nitrification due to a reduction in the soil nitrifying bacteria.
The PCA results showed a Pearson correlation coefficient of −0.468 (p < 0.001) between the Rindex of the NO3-N leaching and PC3. Thus, the PCA results were applied with PC1 and PC3 as the x-axis and y-axis, respectively (Figure 7). This scores plot (Figure 7a) indicates Rindex data regarding NO3-N leaching by biochar applications. In this case, due to the negative Pearson’s correlation (r = −0.468), the data points with positive values of PC3 indicate mitigated NO3-N leaching due to biochar applications, and conversely, the data points with negative PC3 values indicate enhanced NO3-N leaching. The results of the vectors plot (Figure 7b) showed that PC3 was strongly associated with the SSA and the application rate of the biochar. The results of the scores plot (Figure 7a) showed that PC1 and PC3 tended to have a lower Rindex in the positive value range (i.e., the upper-right corner of the graph). Thus, the biochar application rate was a particularly important vector in this range (Figure 7b). The results suggested that the SSA and application rate of the biochar were negatively correlated with NO3-N leaching, indicating the promotion of mitigation.

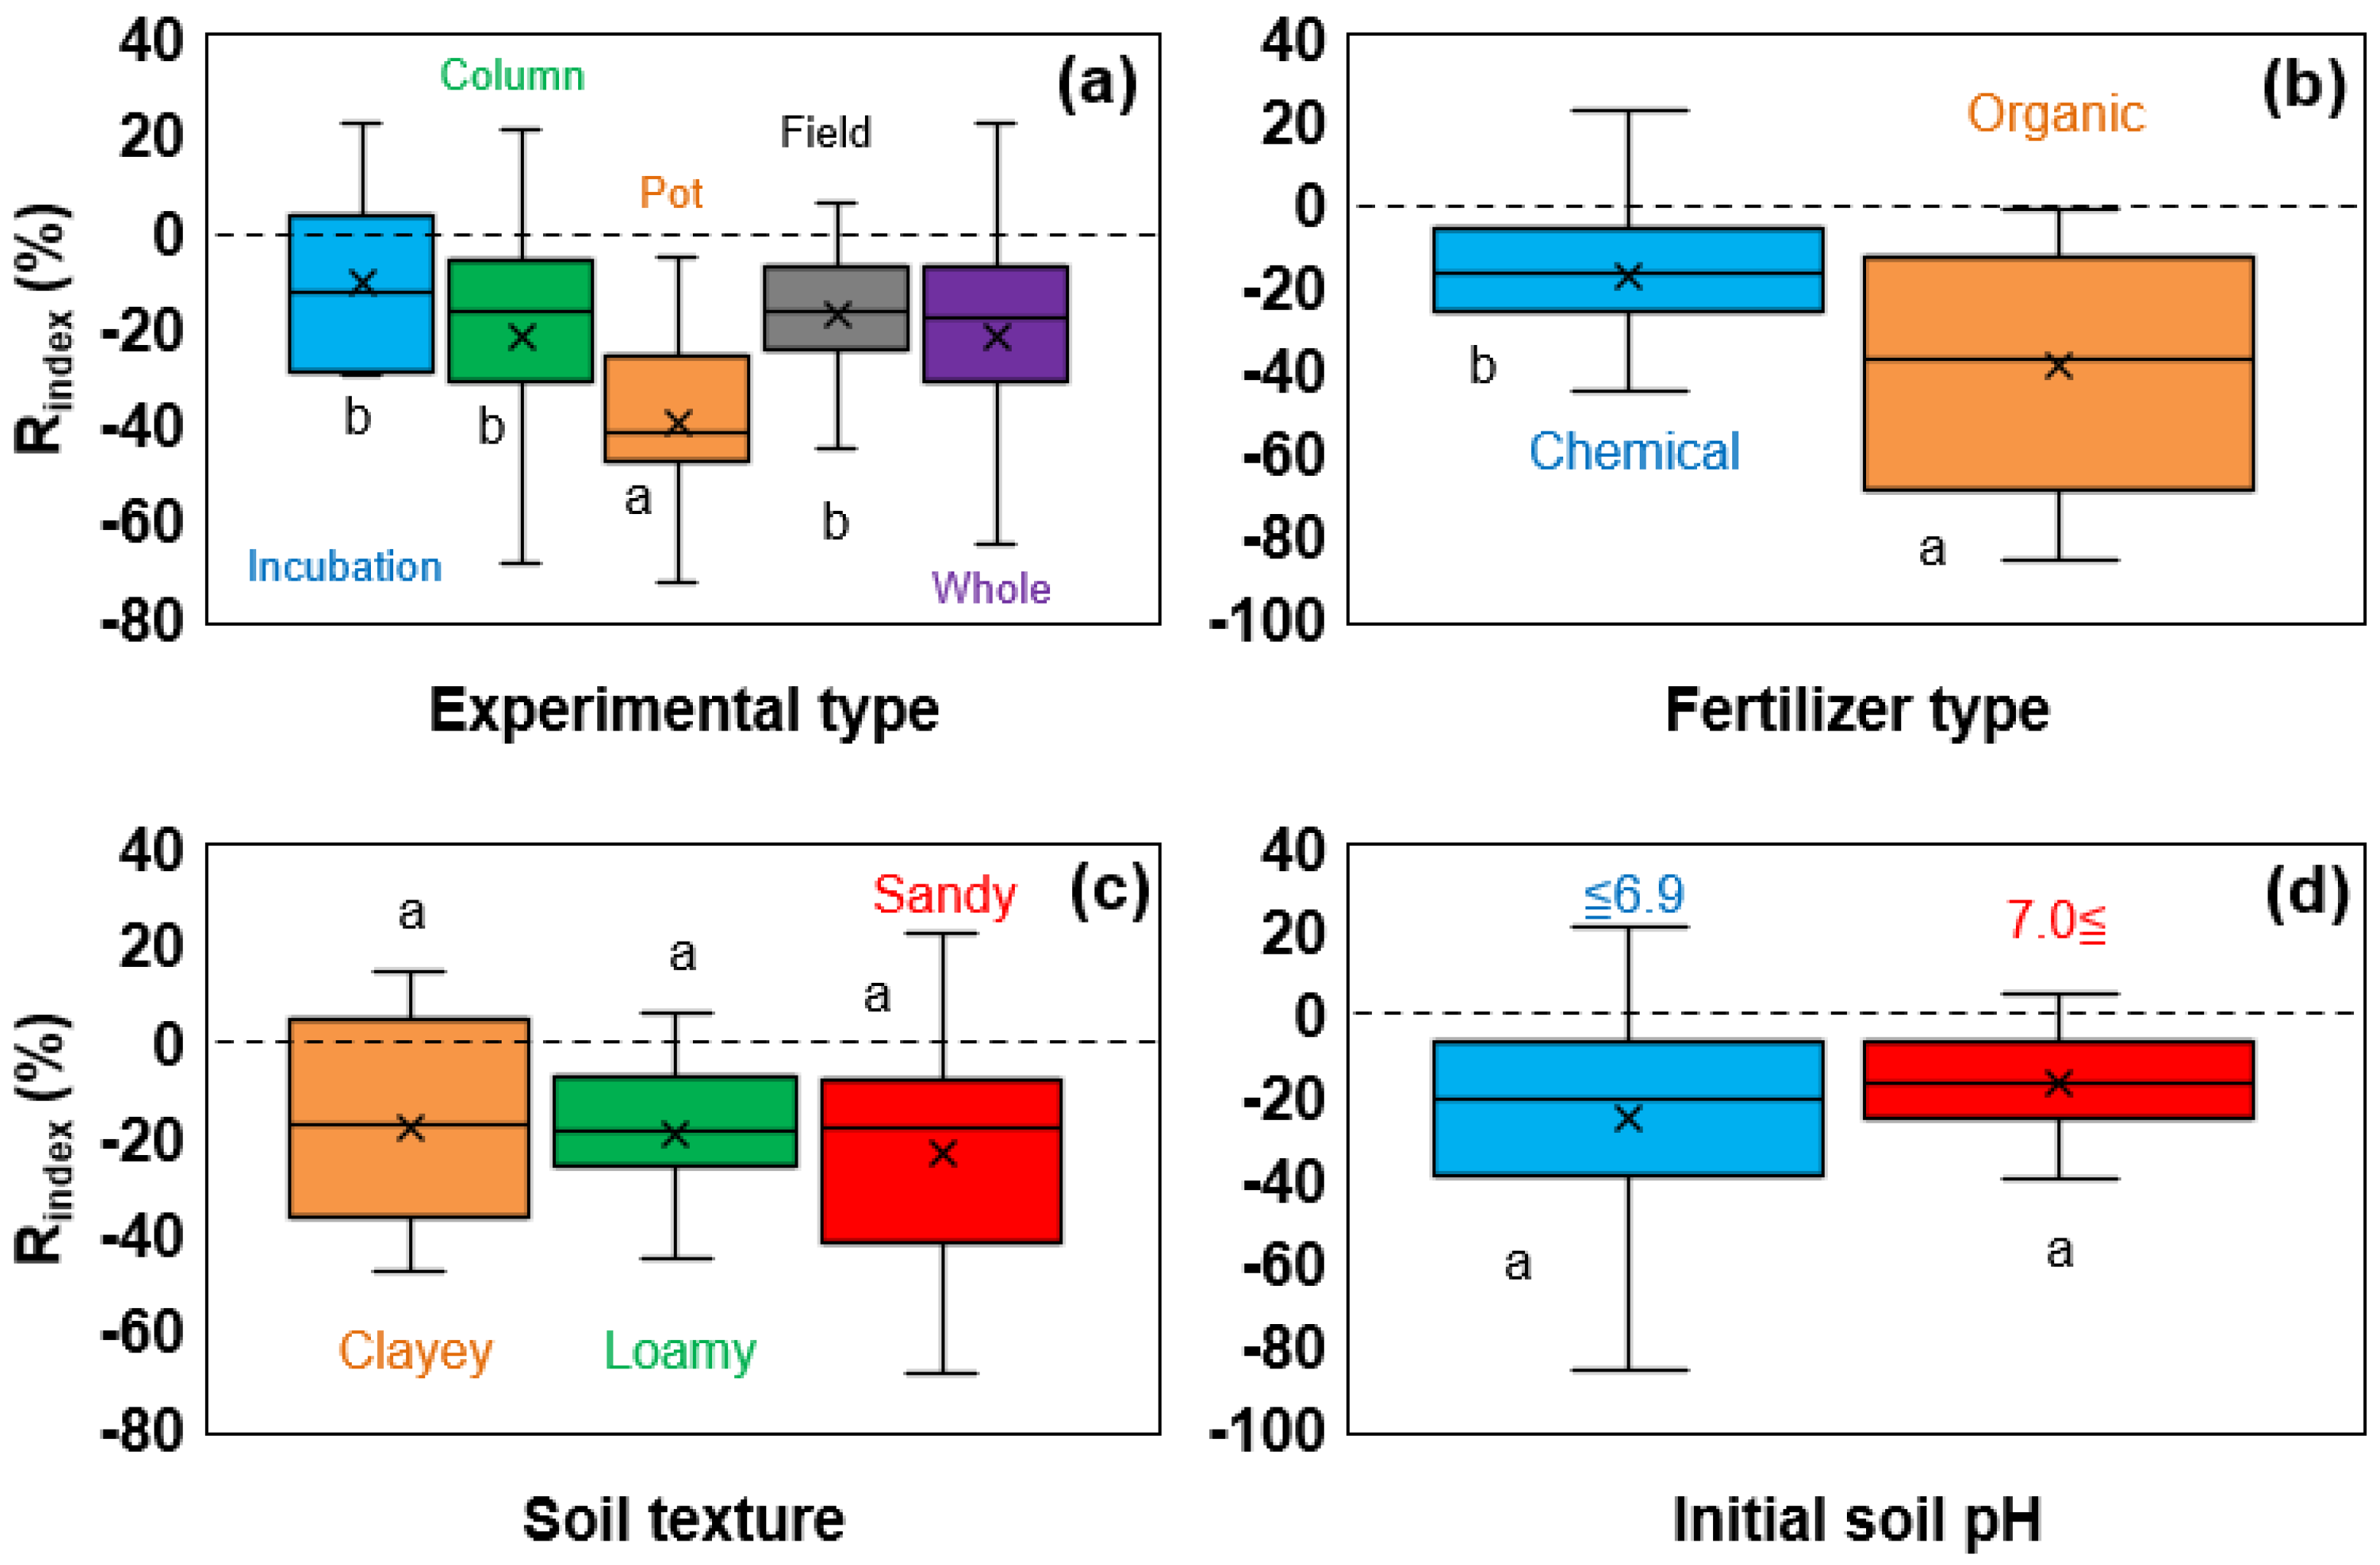
3.3.2. Effect of Various Experimental Conditions

According to a previous study, results obtained under field conditions are often different from laboratory studies [104]. Results of the change in the Rindex by different experimental types (Figure 8a) showed no significant differences among incubation, column, and field experiments (−10.7% to −21.5%), but a significant mitigation was only observed in the pot experiment (−39.4%). This difference in this study was probably because of variations in soil homogeneity and the influence of the root system. Firstly, the homogeneity of the soil can be obtained in pot experiments probably due to a homogeneous mixing of soil and biochar in the pots compared to other experiments, as well as the ease of moisture management. Secondly, regarding the effect of the root system in pot experiments, plant roots can likely be evenly distributed in the entire pots, and the effect of the biochar application on plant growth and NO3-N absorption by plant roots may be pronounced in pot experiments. Therefore, the NO3-N leaching mitigation is probably more pronounced in the pot than in other experiments. In fact, the results of a previous meta-analysis showed that the mean rate of change in crop productivity after biochar applications compared to a control was almost three times higher in pot than in field experiments, suggesting that the biochar NO3-N leaching mitigation effect may be more easily manifested in pot experiments [105].
The difference in fertilizer types (Figure 8b) showed a significant mitigation effect in organic fertilizers (−38.7%) than that in chemical fertilizers (−17.6%). Organic fertilizers undergo a microbial decomposition reaction in the soil that gradually releases inorganic N. Because this process is slow-acting, NO3-N does not increase rapidly in the soil which allows biochar to adsorb and retain NO3-N for a long period [106]. On the other hand, chemical fertilizers supply inorganic N directly and immediately, which causes a rapid increase in the NO3-N concentration and makes it difficult for biochar to adsorb NO3-N adequately.
For different soil textures, results (Figure 8c) showed that biochar applications resulted in an Rindex of −17.6%, −19.2%, and −23.4% for clayey, loamy, and sandy soils, respectively. However, there were no significant differences among all soil textures. In general, sandy soils have a lower water- and nutrient-holding capacity than other soil types due to their physical characteristics [107]. Previous studies have suggested that biochar was more effective in mitigating NO3-N leaching when it was applied to sandy soils than to clayey soils, and this study showed a similar trend.
Differences in the initial soil pH had no significant influences on the Rindex, yet negative Rindex values were observed in both soils’ pH (−24.8% to −16.5%; Figure 8d). This means that biochar maintains a mitigation effect on NO3-N leaching regardless of the initial soil pH range, indicating that the soil pH may not be important to consider with biochar applications to soil.

3.4. Mitigation of Nitrous Oxide Emission

3.4.1. Effect of Biochar Physicochemical Properties

The Rindex of N2O from biochar soil applications was negative under almost all properties, indicating that biochar was effective in mitigating N2O emissions (Figure 9). There was a mitigating trend in N2O emissions with increasing biochar pyrolysis temperatures (−6.1% to −23.6%), but those differences were not significant (Figure 9a). Previous studies have suggested that the mitigation in N2O emissions from biochar was due to the trapping of N2O gas in the biochar pore structure [76,108]. Therefore, it was expected that the SSA was an important parameter for the N2O emission mitigation, which is closely related to the biochar pore structure. The results of this study showed that biochar applications increased N2O emissions when the biochar’s SSA was less than 50 m2 g−1 (4.1%), while a significant decrease was observed when the biochar’s SSA was more than 51 m2 g−1 (−25.9%), but this was not significant (Figure 9d).
Other possible mechanisms include the improved aeration of biochar-applied soils, which increases the oxygen availability and affects redox conditions in the soil and mitigates N2O emissions by limiting the denitrifying bacteria and enzyme activity [70,76]. Soil aeration is closely related to the soil BD, and a biochar soil application generally improves aeration by significantly reducing the soil BD [109]. Therefore, it was expected that N2O emissions would be mitigated as the biochar application rate increased. However, this study could not observe a clear trend or significant difference between the Rindex and the biochar application rate, but the highest mitigation was observed for biochar applications of more than 51 t ha−1 (−20.7%; Figure 9i).
Previous studies have shown a negative correlation between N2O emissions and the soil pH [72]. The increase in the soil pH inhibits the reductase activity responsible for the conversion of NO3 and NO2 to N2O and stimulates the N2O reductase activity that catalyzes the reaction of N2O to N2 [110,111,112]. In addition to enzymes, it was also found that the application of biochar significantly increased the number of N2O-reducing bacteria (e.g., nosZ denitrifiers), which promoted and accelerated the reduction of N2O to N2, resulting in mitigated N2O emissions [113]. However, in this study, the N2O emission mitigation effect weakened with an increasing biochar pH, although there was no significant difference (−24.7% to −6.2%; Figure 9b). This conflict results from the previous studies’ suggestion that an increased soil pH was not the primary mechanism for N2O emission mitigation. As mentioned above, since the pyrolysis temperature was strongly positively correlated with the biochar pH (Figure 1 and Figure 2), the Rindex of the pyrolysis temperature is expected to show similar results as that of the biochar pH. However, the Rindex of these results showed an opposite tendency (Figure 9a,b). This controversy of the biochar liming effect may be explained by other biochar parameters, such as the TC (Figure 9e), TN (Figure 9f), and C/N ratio (Figure 9g). The Rindex at the TC enhanced N2O emissions below 500 g kg−1 (3.5%) but significantly decreased above 501 g kg−1 (−28.3% to −33.7%; Figure 9e). On the contrary, the Rindex showed an increasing trend with the increasing TN (−30.8% to −6.8%; Figure 9f). Along with these changes, the Rindex showed a clear decreasing trend as the C/N ratio increased (1.5% to −34.2%; Figure 9g). These are probably due to the promoted microbial immobilization and denitrification process in soil. When the soil C/N ratio is high, soil microorganisms uptake soil N, and N mineralization is suppressed in the soil. The resulting suppression of nitrification and denitrification processes may have mitigated N2O emissions to some extent. It was also suggested that the high C/N ratio of biochar may have promoted a complete denitrification reaction for the remaining NO3-N since it acts as a source of organic C needed for denitrification. Based on these reactions, it was suggested that the Rindex of the biochar pyrolysis temperature was more influenced by the results of the SSA (Figure 9d) and C/N ratio (Figure 9g) of biochar, which also correlated positively with the pyrolysis temperature (Figure 1 and Figure 2), rather than the biochar pH (Figure 9b).
PCA results showed a Pearson correlation coefficient of −0.235 (p < 0.05) between the N2O emissions Rindex and PC1. Thus, the PCA results were applied with PC1 and PC2 as the x-axis and y-axis, respectively (Figure 10). This scores plot (Figure 10a) provides Rindex data points for the N2O mitigation by biochar applications. In this case, based on the negative Pearson’s correlation, the data will show more mitigations in N2O emissions due to biochar applications for positive PC1 values. Conversely, the data will show more points of increased N2O emissions due to the biochar application for negative PC1 values. From the results of the scores plot (Figure 10a), it was observed that there was no clear division by the PC2 value, but two major distinctions were made by the PC1 value. The results of the vectors plot (Figure 10b) revealed strong relationships between the TC and SSA for biochar at positive values of PC1. Therefore, the TC and SSA of biochar were shown to be particularly important factors for the mitigation of N2O emissions. Furthermore, the CEC, C/N ratio, and pyrolysis temperature were also suggested to be comparable mitigation factors subsequently. Contrastingly, the biochar ash content, TN, and pH were found to be factors that promoted N2O emissions. These results are consistent with Figure 9.

3.4.2. Effect of Various Experimental Conditions

The variation in the Rindex by experimental types revealed that all experimental types were effective in mitigating N2O emissions, as the Rindex was negative (−3.4% to −59.2%), but the differences were not significant (Figure 11a). The overall Rindex (whole) was −18.2%, indicating that the effectiveness of the biochar was certain.
The co-application of the biochar and chemical fertilizer resulted in an Rindex of −9.5%, while the co-application with the organic fertilizer resulted in −29.5% (Figure 11b), suggesting that the combination of the organic fertilizer and biochar was more effective in mitigating N2O emissions, although this result was not significantly different. This is probably mainly due to the changes in nitrifying and denitrifying bacteria in the soil. A previous study found that the co-application of biochar and organic fertilizers to saline alkaline soils mitigated N2O emissions due to reduced copy numbers of nirS and nirK (NO2-N reductase) and the increased copy number of nosZ (N2O reductase) compared to the control [114]. Another possible mechanism is changes in the soil BD. For example, organic fertilizers, such as compost, have the effect of reducing the soil BD after the application compared to chemical fertilizers [115]. This suggests that the synergistic effect of fertilizers’ co-application with biochar may have changed the soil to a more aerobic condition and mitigated N2O emissions.
Rindex results for different soil textures (Figure 11c) showed that clayey soils enhanced N2O emissions by 18.0%, while loamy and sandy soils mitigated emissions by −18.7% and −7.9%, respectively. The reason for the lack of a N2O emission mitigation in clayey soils may have been due to the increased availability of the soil NH4+-N caused by the interaction of biochar in clayey soils. In general, clayey soils have a high WHC due to their high CEC and specific pore volume, which allows water and nutrients to be retained in the soil for a long period [116]. In addition, biochar can adsorb soil NH4+-N and improve its availability after the soil application [117]. These interactions may have increased the soil NH4+-N concentration and provided an adequate N source directly to the microbial nitrification process, which may have resulted in the production of more N2O during the nitrification process (i.e., nitrification-derived N2O emission) in the biochar application [25,118]. Another possible reason is differences in soil physical structures. In general, the BD in clayey soils is high, and even with the application of biochar, the BD was less likely to decrease, suggesting that anaerobic conditions in clayey soils may have been maintained and masked the effect of the biochar N2O emission mitigation.
N2O reductase has been found to be inhibited when the soil pH is less than 6.1 to 6.8 [47]. The results of the Rindex with changes in the initial soil pH (Figure 11d) did not show remarkable changes (−5.9 to −18.1%) and were not significantly different. This is probably due to the N2O reductase activity enhanced by the increased soil pH caused by the biochar application to acidic soils. Therefore, the results suggested that the initial soil pH does not need to be considered as much when attempting to mitigate N2O emissions using biochar.

4. Conclusions

This review systematically assessed the impact of a pristine biochar co-application with N fertilizers on mitigating NH3 volatilization, NO3-N leaching, and N2O emissions, drawing on quantitative data from studies published in the past decade.
For NH3 volatilization, the biochar pH proved to be a dominant factor, with mitigation effects varying widely (from a −45.0% to −9.0% reduction based on pH); a high ash content (≧16%) significantly exacerbated volatilization (a 25.1% increase compared to the −52.2% mitigation with ≦15% ash). Moderate application rates (≦50 t ha−1) were generally most effective for NH3 mitigation (−13.3% to −27.8%), and the greatest reduction was observed in clayey soils (−52.2%).
Regarding NO3-N leaching, biochar produced at higher pyrolysis temperatures, often exhibiting a higher SSA, demonstrated an enhanced mitigation (up to a −26.6% reduction), primarily attributed to the improved soil water-holding capacity. Increasing the biochar application rate, particularly above 51 t ha−1, significantly reduced NO3-N leaching. The co-application with organic fertilizers was notably more effective (up to −39.0% mitigation) than with chemical fertilizers, likely due to the slower N release allowing for enhanced biochar adsorption and retention. Pot experiments, where soil homogeneity and root system interactions are pronounced, showed particularly strong mitigation effects (−39.4%).
The biochar application was also effective in mitigating N2O emissions. A higher SSA was linked to greater N2O trapping within biochar pores and thus a more pronounced emission mitigation (up to 25.9% with an SSA ≧51 m2 g−1). Furthermore, increasing the biochar TC (e.g., ≧501 g kg−1 leading to a −28.3% to −33.7% mitigation) and C/N ratio (e.g., ≧101 leading to −34.2% mitigation) significantly mitigated N2O emissions, likely due to a promoted microbial N immobilization and a more complete denitrification process. However, the effect varied with soil textures; increased N2O emissions were observed in clayey soils (+18.0%), while mitigation occurred in loamy (−18.7%) and sandy (−7.9%) soils, pointing to complex interactions with the soil NH4+-N availability and physical structure.
Overall, this comprehensive review confirms that the biochar soil application is a promising technology for reducing N losses from agricultural soils and mitigating associated environmental impacts, thereby potentially enhancing NUE for crops and contributing to the development of sustainable agricultural systems. However, the findings critically underscore that the effectiveness of biochar is not universal. It depends significantly on a nuanced understanding and strategic matching of biochar’s physicochemical properties (e.g., SSA, pH, C/N ratio, and ash content) and application rates to specific soil types, fertilizer types, and the targeted N loss pathways.
To optimize biochar’s practical application and fully harness its potential, future research should prioritize several specific avenues: (i) Conducting long-term field studies across diverse agroecosystems to validate laboratory and short-term findings and to assess the persistence of biochar’s N mitigation effects over time. (ii) Undertaking deeper investigations into the microbial mechanisms, including functional gene shifts (e.g., nosZ denitrifiers) and community dynamics, that are driven by specific biochar properties under various N fertilization regimes. (iii) Developing predictive models based on an integrated understanding of biochar characteristics, soil types, climates, and management practices to guide customized biochar applications for targeted N loss mitigation. (iv) Exploring the synergistic effects of biochar when combined with other soil amendments or advanced agricultural management practices (e.g., controlled-release fertilizers and nitrification inhibitors) to further enhance N use efficiency and overall environmental benefits. Such focused research is crucial for translating the potential of biochar into reliable and effective solutions for sustainable N management in agriculture.

Author Contributions

Conceptualization, Y.K. and S.S.; methodology, Y.K.; software, Y.K.; validation, Y.K. and S.S.; formal analysis, Y.K.; investigation, Y.K.; data curation, Y.K.; writing—original draft preparation, Y.K.; writing—review and editing, D.F., M.L., T.W., A.G., M.A., S.A. (Shinichi Akizuki), S.A. (Solomon Addisu) and S.S.; visualization, Y.K.; supervision, S.S.; project administration, S.S.; funding acquisition, S.S. All authors have read and agreed to the published version of the manuscript.

Funding

This study was partially supported by the Japan Science and Technology Agency (JST)/Japan International Cooperation Agency (JICA), Science and Technology Research Partnership for Sustainable Development (SATREPS) through the project for Eco-Engineering for Agricultural Revitalization toward Improvement of Human Nutrition (EARTH): Water Hyacinth to Energy and Agricultural Crops (grant number: JPMJSA2005).

Data Availability Statement

The original contributions presented in this study are included in the article. Further inquiries can be directed to the corresponding author.

Conflicts of Interest

The authors declare no conflicts of interest.

References

  1. Wang, B.; Deng, J.; Wang, T.; Zhang, Y.; Lan, J. Optimizing Nitrogen Application Rates to Maximize Productivity While Reducing Environmental Risk by Regulating Nitrogen and Water Utilization in Mixed Cropping Systems. Agric. Water Manag. 2024, 303, 109053. [Google Scholar] [CrossRef]
  2. UNDESA. Key Messages, World Population Prospects; UNDESA: New York, NY, USA, 2022. [Google Scholar]
  3. Gan, C.; Jiang, Y.; Wang, Y.; Lin, S.; Luo, Y.; Li, H.; Li, Y.; Tang, N.; Fei, Y.; Hu, R. Organic Fertilizer Application Reduce Ammonia Volatilization in an Acidic Soil. Agric. Ecosyst. Environ. 2025, 383, 109510. [Google Scholar] [CrossRef]
  4. Pan, Y.; She, D.; Ding, J.; Abulaiti, A.; Zhao, J.; Wang, Y.; Liu, R.; Wang, F.; Shan, J.; Xia, Y. Coping with Groundwater Pollution in High-Nitrate Leaching Areas: The Efficacy of Denitrification. Environ. Res. 2024, 250, 118484. [Google Scholar] [CrossRef]
  5. Qiu, Y.; Zhang, Y.; Zhang, K.; Xu, X.; Zhao, Y.; Bai, T.; Zhao, Y.; Wang, H.; Sheng, X.; Bloszies, S.; et al. Intermediate Soil Acidification Induces Highest Nitrous Oxide Emissions. Nat. Commun. 2024, 15, 2695. [Google Scholar] [CrossRef]
  6. Kinoshita, S.; Kohira, Y.; Sato, S. Effects of Sugarcane Bagasse Biochar on Ammonium and Nitrate Adsorption and Leaching in a Japanese Tropical Soil Cropped with Japanese Mustard Spinach (Brassica rapa). Asian J. Soil Sci. Plant Nutr. 2024, 10, 453–466. [Google Scholar] [CrossRef]
  7. Shu, X.; Liu, W.; Huang, H.; Ye, Q.; Zhu, S.; Peng, Z.; Li, Y.; Deng, L.; Yang, Z.; Chen, H.; et al. Meta-Analysis of Organic Fertilization Effects on Soil Bacterial Diversity and Community Composition in Agroecosystems. Plants 2023, 12, 3801. [Google Scholar] [CrossRef]
  8. Tang, Q.; Cotton, A.; Wei, Z.; Xia, Y.; Daniell, T.; Yan, X. How Does Partial Substitution of Chemical Fertiliser with Organic Forms Increase Sustainability of Agricultural Production? Sci. Total Environ. 2022, 803, 149933. [Google Scholar] [CrossRef]
  9. Xiang, X.; Liu, J.; Zhang, J.; Li, D.; Xu, C.; Kuzyakov, Y. Divergence in Fungal Abundance and Community Structure between Soils under Long-Term Mineral and Organic Fertilization. Soil Tillage Res. 2020, 196, 104491. [Google Scholar] [CrossRef]
  10. Haupt, R.; Heinemann, C.; Schmid, S.M.; Steinhoff-Wagner, J. Survey on Storage, Application and Incorporation Practices for Organic Fertilizers in Germany. J. Environ. Manag. 2021, 296, 113380. [Google Scholar] [CrossRef]
  11. Herencia, J.F.; García-Galavís, P.A.; Dorado, J.A.R.; Maqueda, C. Comparison of Nutritional Quality of the Crops Grown in an Organic and Conventional Fertilized Soil. Sci. Hortic. 2011, 129, 882–888. [Google Scholar] [CrossRef]
  12. Lehmann, J.; Joseph, S. Biochar for Environmental Management: An Introduction. In Biochar for Environmental Management, Science and Technology; Routledge: Oxfordshire, UK, 2009; pp. 1–12. [Google Scholar]
  13. Kohira, Y.; Fentie, D.; Lewoyehu, M.; Wutisirirattanachai, T.; Gezahegn, A.; Addisu, S.; Sato, S. Mitigation of Ammonia Volatilization from Organic and Inorganic Nitrogen Sources Applied to Soil Using Water Hyacinth Biochars. Chemosphere 2024, 363, 142872. [Google Scholar] [CrossRef] [PubMed]
  14. Duan, T.; Zhao, J.; Zhu, L. Insights into CO2 and N2O Emissions Driven by Applying Biochar and Nitrogen Fertilizers in Upland Soil. Sci. Total Environ. 2024, 929, 172439. [Google Scholar] [CrossRef] [PubMed]
  15. Fentie, D.; Mihretie, F.A.; Kohira, Y.; Legesse, S.A.; Lewoyehu, M.; Sato, S. Enhancing Soil Environments and Wheat Production through Water Hyacinth Biochar under Deficit Irrigation in Ethiopian Acidic Silty Loam Soil. Soil Syst. 2024, 8, 72. [Google Scholar] [CrossRef]
  16. Gezahegn, A.; Selassie, Y.G.; Agegnehu, G.; Addisu, S.; Mihretie, F.A.; Kohira, Y.; Lewoyehu, M.; Sato, S. Synergistic Effects of Aquatic Weed Biochar and Inorganic Fertilizer on Soil Properties, Maize Yield, and Nitrogen Use Efficiency on Nitisols of Northwestern Ethiopian Highlands. J. Agric. Food Res. 2025, 21, 101939. [Google Scholar] [CrossRef]
  17. Amin, A.E.-E.A.Z. Carbon Sequestration, Kinetics of Ammonia Volatilization and Nutrient Availability in Alkaline Sandy Soil as a Function on Applying Calotropis Biochar Produced at Different Pyrolysis Temperatures. Sci. Total Environ. 2020, 726, 138489. [Google Scholar] [CrossRef]
  18. Egyir, M.; Luyima, D.; Park, S.-J.; Lee, K.S.; Oh, T.-K. Volatilisations of Ammonia from the Soils Amended with Modified and Nitrogen-Enriched Biochars. Sci. Total Environ. 2022, 835, 155453. [Google Scholar] [CrossRef]
  19. Liu, Z.; He, T.; Cao, T.; Yang, T.; Meng, J.; Chen, W. Effects of Biochar Application on Nitrogen Leaching, Ammonia Volatilization and Nitrogen Use Efficiency in Two Distinct Soils. J. Soil Sci. Plant Nutr. 2017, 17, 515–528. [Google Scholar] [CrossRef]
  20. Mandal, S.; Thangarajan, R.; Bolan, N.S.; Sarkar, B.; Khan, N.; Ok, Y.S.; Naidu, R. Biochar-Induced Concomitant Decrease in Ammonia Volatilization and Increase in Nitrogen Use Efficiency by Wheat. Chemosphere 2016, 142, 120–127. [Google Scholar] [CrossRef]
  21. Mandal, S.; Donner, E.; Vasileiadis, S.; Skinner, W.; Smith, E.; Lombi, E. The Effect of Biochar Feedstock, Pyrolysis Temperature, and Application Rate on the Reduction of Ammonia Volatilisation from Biochar-Amended Soil. Sci. Total Environ. 2018, 627, 942–950. [Google Scholar] [CrossRef]
  22. Moriyama, Y.; Sato, S. Effect of Biochar Application on Suppression of Ammonia Volatilization from Anaerobic Digestion Effluent Mixed with Soil as a Nitrogen Source. Wood Carbonization Res. Soc. 2020, 17, 8–16. [Google Scholar]
  23. Zhu, H.; Yang, J.; Yao, R.; Wang, X.; Xie, W.; Zhu, W.; Liu, X.; Cao, Y.; Tao, J. Interactive Effects of Soil Amendments (Biochar and Gypsum) and Salinity on Ammonia Volatilization in Coastal Saline Soil. CATENA 2020, 190, 104527. [Google Scholar] [CrossRef]
  24. Feng, Y.; Sun, H.; Xue, L.; Liu, Y.; Gao, Q.; Lu, K.; Yang, L. Biochar Applied at an Appropriate Rate Can Avoid Increasing NH3 Volatilization Dramatically in Rice Paddy Soil. Chemosphere 2017, 168, 1277–1284. [Google Scholar] [CrossRef] [PubMed]
  25. Sun, H.; A, D.; Feng, Y.; Vithanage, M.; Mandal, S.; Shaheen, S.M.; Rinklebe, J.; Shi, W.; Wang, H. Floating Duckweed Mitigated Ammonia Volatilization and Increased Grain Yield and Nitrogen Use Efficiency of Rice in Biochar Amended Paddy Soils. Chemosphere 2019, 237, 124532. [Google Scholar] [CrossRef]
  26. Sun, H.; Lu, H.; Chu, L.; Shao, H.; Shi, W. Biochar Applied with Appropriate Rates Can Reduce N Leaching, Keep N Retention and Not Increase NH3 Volatilization in a Coastal Saline Soil. Sci. Total Environ. 2017, 575, 820–825. [Google Scholar] [CrossRef]
  27. Plaimart, J.; Acharya, K.; Mrozik, W.; Davenport, R.J.; Vinitnantharat, S.; Werner, D. Coconut Husk Biochar Amendment Enhances Nutrient Retention by Suppressing Nitrification in Agricultural Soil Following Anaerobic Digestate Application. Environ. Pollut. 2021, 268, 115684. [Google Scholar] [CrossRef]
  28. Sun, H.; Zhang, H.; Xiao, H.; Shi, W.; Müller, K.; Van Zwieten, L.; Wang, H. Wheat Straw Biochar Application Increases Ammonia Volatilization from an Urban Compacted Soil Giving a Short-Term Reduction in Fertilizer Nitrogen Use Efficiency. J. Soils Sediments 2019, 19, 1624–1631. [Google Scholar] [CrossRef]
  29. Sun, H.; Zhang, Y.; Yang, Y.; Chen, Y.; Jeyakumar, P.; Shao, Q.; Zhou, Y.; Ma, M.; Zhu, R.; Qian, Q.; et al. Effect of Biofertilizer and Wheat Straw Biochar Application on Nitrous Oxide Emission and Ammonia Volatilization from Paddy Soil. Environ. Pollut. 2021, 275, 116640. [Google Scholar] [CrossRef]
  30. Mandal, S.; Donner, E.; Smith, E.; Sarkar, B.; Lombi, E. Biochar with Near-Neutral pH Reduces Ammonia Volatilization and Improves Plant Growth in a Soil-Plant System: A Closed Chamber Experiment. Sci. Total Environ. 2019, 697, 134114. [Google Scholar] [CrossRef]
  31. Subedi, R.; Kammann, C.; Pelissetti, S.; Taupe, N.; Bertora, C.; Monaco, S.; Grignani, C. Does Soil Amended with Biochar and Hydrochar Reduce Ammonia Emissions Following the Application of Pig Slurry? Eur. J. Soil Sci. 2015, 66, 1044–1053. [Google Scholar] [CrossRef]
  32. Abdo, A.I.; Xu, Y.; Shi, D.; Li, J.; Li, H.; El-Sappah, A.H.; Elrys, A.S.; Alharbi, S.A.; Zhou, C.; Wang, L.; et al. Nitrogen Transformation Genes and Ammonia Emission from Soil under Biochar and Urease Inhibitor Application. Soil Tillage Res. 2022, 223, 105491. [Google Scholar] [CrossRef]
  33. He, T.; Liu, D.; Yuan, J.; Ni, K.; Zaman, M.; Luo, J.; Lindsey, S.; Ding, W. A Two Years Study on the Combined Effects of Biochar and Inhibitors on Ammonia Volatilization in an Intensively Managed Rice Field. Agric. Ecosyst. Environ. 2018, 264, 44–53. [Google Scholar] [CrossRef]
  34. Qi, S.; Ding, J.; Yang, S.; Jiang, Z.; Xu, Y. Impact of Biochar Application on Ammonia Volatilization from Paddy Fields under Controlled Irrigation. Sustainability 2022, 14, 1337. [Google Scholar] [CrossRef]
  35. Sun, X.; Zhong, T.; Zhang, L.; Zhang, K.; Wu, W. Reducing Ammonia Volatilization from Paddy Field with Rice Straw Derived Biochar. Sci. Total Environ. 2019, 660, 512–518. [Google Scholar] [CrossRef] [PubMed]
  36. Wang, S.; Xia, G.; Zheng, J.; Wang, Y.; Chen, T.; Chi, D.; Bolan, N.S.; Chang, S.X.; Wang, T.; Ok, Y.S. Mulched Drip Irrigation and Biochar Application Reduce Gaseous Nitrogen Emissions, but Increase Nitrogen Uptake and Peanut Yield. Sci. Total Environ. 2022, 830, 154753. [Google Scholar] [CrossRef]
  37. Yoo, G.; Kim, H.; Chen, J.; Kim, Y. Effects of Biochar Addition on Nitrogen Leaching and Soil Structure Following Fertilizer Application to Rice Paddy Soil. Soil Sci. Soc. Am. J. 2014, 78, 852–860. [Google Scholar] [CrossRef]
  38. Cao, H.; Ning, L.; Xun, M.; Feng, F.; Li, P.; Yue, S.; Song, J.; Zhang, W.; Yang, H. Biochar Can Increase Nitrogen Use Efficiency of Malus Hupehensis by Modulating Nitrate Reduction of Soil and Root. Appl. Soil Ecol. 2019, 135, 25–32. [Google Scholar] [CrossRef]
  39. Chen, P.; Liu, Y.; Mo, C.; Jiang, Z.; Yang, J.; Lin, J. Microbial Mechanism of Biochar Addition on Nitrogen Leaching and Retention in Tea Soils from Different Plantation Ages. Sci. Total Environ. 2021, 757, 143817. [Google Scholar] [CrossRef]
  40. Ibrahim, M.M.; Liu, D.; Wu, F.; Chen, Y.; He, Z.; Zhang, W.; Xing, S.; Mao, Y. Nitrogen Retention Potentials of Magnesium Oxide- and Sepiolite-Modified Biochars and Their Impacts on Bacterial Distribution under Nitrogen Fertilization. Sci. Total Environ. 2023, 866, 161358. [Google Scholar] [CrossRef]
  41. Kanthle, A.K.; Lenka, N.K.; Lenka, S.; Tedia, K. Biochar Impact on Nitrate Leaching as Influenced by Native Soil Organic Carbon in an Inceptisol of Central India. Soil Tillage Res. 2016, 157, 65–72. [Google Scholar] [CrossRef]
  42. Kuo, Y.-L.; Lee, C.-H.; Jien, S.-H. Reduction of Nutrient Leaching Potential in Coarse-Textured Soil by Using Biochar. Water 2020, 12, 2012. [Google Scholar] [CrossRef]
  43. Li, S.; Zhang, Y.; Yan, W.; Shangguan, Z. Effect of Biochar Application Method on Nitrogen Leaching and Hydraulic Conductivity in a Silty Clay Soil. Soil Tillage Res. 2018, 183, 100–108. [Google Scholar] [CrossRef]
  44. Llovet, A.; Mattana, S.; Chin-Pampillo, J.; Otero, N.; Carrey, R.; Mondini, C.; Gascó, G.; Martí, E.; Margalef, R.; Alcañiz, J.M.; et al. Fresh Biochar Application Provokes a Reduction of Nitrate Which Is Unexplained by Conventional Mechanisms. Sci. Total Environ. 2021, 755, 142430. [Google Scholar] [CrossRef] [PubMed]
  45. Lv, R.; Wang, Y.; Yang, X.; Wen, Y.; Tan, X.; Zeng, Y.; Shang, Q. Adsorption and Leaching Characteristics of Ammonium and Nitrate from Paddy Soil as Affected by Biochar Amendment. Plant Soil Environ. 2021, 67, 8–17. [Google Scholar] [CrossRef]
  46. Pratiwi, E.P.A.; Hillary, A.K.; Fukuda, T.; Shinogi, Y. The Effects of Rice Husk Char on Ammonium, Nitrate and Phosphate Retention and Leaching in Loamy Soil. Geoderma 2016, 277, 61–68. [Google Scholar] [CrossRef]
  47. Rubin, R.L.; Anderson, T.R.; Ballantine, K.A. Biochar Simultaneously Reduces Nutrient Leaching and Greenhouse Gas Emissions in Restored Wetland Soils. Wetlands 2020, 40, 1981–1991. [Google Scholar] [CrossRef]
  48. Sika, M.P.; Hardie, A.G. Effect of Pine Wood Biochar on Ammonium Nitrate Leaching and Availability in a South African Sandy Soil. Eur. J. Soil Sci. 2014, 65, 113–119. [Google Scholar] [CrossRef]
  49. Teutscherova, N.; Houška, J.; Navas, M.; Masaguer, A.; Benito, M.; Vazquez, E. Leaching of Ammonium and Nitrate from Acrisol and Calcisol Amended with Holm Oak Biochar: A Column Study. Geoderma 2018, 323, 136–145. [Google Scholar] [CrossRef]
  50. Troy, S.M.; Lawlor, P.G.; O’ Flynn, C.J.; Healy, M.G. The Impact of Biochar Addition on Nutrient Leaching and Soil Properties from Tillage Soil Amended with Pig Manure. Water Air Soil Pollut. 2014, 225, 1900. [Google Scholar] [CrossRef]
  51. Xu, N.; Tan, G.; Wang, H.; Gai, X. Effect of Biochar Additions to Soil on Nitrogen Leaching, Microbial Biomass and Bacterial Community Structure. Eur. J. Soil Biol. 2016, 74, 1–8. [Google Scholar] [CrossRef]
  52. Zhao, X.; Wang, S.; Xing, G. Nitrification, Acidification, and Nitrogen Leaching from Subtropical Cropland Soils as Affected by Rice Straw-Based Biochar: Laboratory Incubation and Column Leaching Studies. J. Soils Sediments 2014, 14, 471–482. [Google Scholar] [CrossRef]
  53. Cheng, H.; Jones, D.L.; Hill, P.; Bastami, M.S.; Tu, C.L. Influence of Biochar Produced from Different Pyrolysis Temperature on Nutrient Retention and Leaching. Arch. Agron. Soil Sci. 2017, 64, 850–859. [Google Scholar] [CrossRef]
  54. Demiraj, E.; Libutti, A.; Malltezi, J.; Rroço, E.; Brahushi, F.; Monteleone, M.; Sulçe, S. Effect of Organic Amendments on Nitrate Leaching Mitigation in a Sandy Loam Soil of Shkodra District, Albania. Ital. J. Agron. 2018, 13, 93–102. [Google Scholar] [CrossRef]
  55. Ghorbani, M.; Asadi, H.; Abrishamkesh, S. Effects of Rice Husk Biochar on Selected Soil Properties and Nitrate Leaching in Loamy Sand and Clay Soil. Int. Soil Water Conserv. Res. 2019, 7, 258–265. [Google Scholar] [CrossRef]
  56. Kammann, C.I.; Schmidt, H.-P.; Messerschmidt, N.; Linsel, S.; Steffens, D.; Müller, C.; Koyro, H.-W.; Conte, P.; Joseph, S. Plant Growth Improvement Mediated by Nitrate Capture in Co-Composted Biochar. Sci. Rep. 2015, 5, 11080. [Google Scholar] [CrossRef]
  57. Farahani, S.S.; Asoodar, M.A.; Moghadam, B.K. Short-Term Impacts of Biochar, Tillage Practices, and Irrigation Systems on Nitrate and Phosphorus Concentrations in Subsurface Drainage Water. Environ. Sci. Pollut. Res. 2020, 27, 761–771. [Google Scholar] [CrossRef]
  58. Hardie, M.A.; Oliver, G.; Clothier, B.E.; Bound, S.A.; Green, S.A.; Close, D.C. Effect of Biochar on Nutrient Leaching in a Young Apple Orchard. J. Environ. Qual. 2015, 44, 1273–1282. [Google Scholar] [CrossRef]
  59. Liu, B.; Li, H.; Li, H.; Zhang, A.; Rengel, Z. Long-term Biochar Application Promotes Rice Productivity by Regulating Root Dynamic Development and Reducing Nitrogen Leaching. GCB Bioenergy 2021, 13, 257–268. [Google Scholar] [CrossRef]
  60. Sorrenti, G.; Toselli, M. Soil Leaching as Affected by the Amendment with Biochar and Compost. Agric. Ecosyst. Environ. 2016, 226, 56–64. [Google Scholar] [CrossRef]
  61. Wang, Y.; Liu, Y.; Liu, R.; Zhang, A.; Yang, S.; Liu, H.; Zhou, Y.; Yang, Z. Biochar Amendment Reduces Paddy Soil Nitrogen Leaching but Increases Net Global Warming Potential in Ningxia Irrigation, China. Sci. Rep. 2017, 7, 1592. [Google Scholar] [CrossRef]
  62. Zhou, Y.; Berruti, F.; Greenhalf, C.; Tian, X.; Henry, H.A.L. Increased Retention of Soil Nitrogen over Winter by Biochar Application: Implications of Biochar Pyrolysis Temperature for Plant Nitrogen Availability. Agric. Ecosyst. Environ. 2017, 236, 61–68. [Google Scholar] [CrossRef]
  63. Aamer, M.; Bilal Chattha, M.; Mahmood, A.; Naqve, M.; Hassan, M.U.; Shaaban, M.; Rasul, F.; Batool, M.; Rasheed, A.; Tang, H.; et al. Rice Residue-Based Biochar Mitigates N2O Emission from Acid Red Soil. Agronomy 2021, 11, 2462. [Google Scholar] [CrossRef]
  64. Brassard, P.; Godbout, S.; Palacios, J.H.; Jeanne, T.; Hogue, R.; Dubé, P.; Limousy, L.; Raghavan, V. Effect of Six Engineered Biochars on GHG Emissions from Two Agricultural Soils: A Short-Term Incubation Study. Geoderma 2018, 327, 73–84. [Google Scholar] [CrossRef]
  65. Dai, Z.; Li, Y.; Zhang, X.; Wu, J.; Luo, Y.; Kuzyakov, Y.; Brookes, P.C.; Xu, J. Easily Mineralizable Carbon in Manure-based Biochar Added to a Soil Influences N2O Emissions and microbial-N Cycling Genes. Land Degrad. Dev. 2019, 30, 406–416. [Google Scholar] [CrossRef]
  66. Felber, R.; Leifeld, J.; Horák, J.; Neftel, A. Nitrous Oxide Emission Reduction with Greenwaste Biochar: Comparison of Laboratory and Field Experiments. Eur. J. Soil Sci. 2014, 65, 128–138. [Google Scholar] [CrossRef]
  67. Li, X.; Neupane, A.; Xu, S.; Abdoulmoumine, N.; DeBruyn, J.M.; Walker, F.; Jagadamma, S. Application Methods Influence Biochar–Fertilizer Interactive Effects on Soil Nitrogen Dynamics. Soil Sci. Soc. Am. J. 2020, 84, 1871–1884. [Google Scholar] [CrossRef]
  68. Li, X.; Xu, S.; Neupane, A.; Abdoulmoumine, N.; DeBruyn, J.M.; Walker, F.R.; Jagadamma, S. Co-Application of Biochar and Nitrogen Fertilizer Reduced Nitrogen Losses from Soil. PLoS ONE 2021, 16, e0248100. [Google Scholar] [CrossRef]
  69. Liu, L.; Shen, G.; Sun, M.; Cao, X.; Shang, G.; Chen, P. Effect of Biochar on Nitrous Oxide Emission and Its Potential Mechanisms. J. Air Waste Manag. Assoc. 2014, 64, 894–902. [Google Scholar] [CrossRef]
  70. Martin, S.L.; Clarke, M.L.; Othman, M.; Ramsden, S.J.; West, H.M. Biochar-Mediated Reductions in Greenhouse Gas Emissions from Soil Amended with Anaerobic Digestates. Biomass Bioenergy 2015, 79, 39–49. [Google Scholar] [CrossRef]
  71. Nelissen, V.; Saha, B.K.; Ruysschaert, G.; Boeckx, P. Effect of Different Biochar and Fertilizer Types on N2O and NO Emissions. Soil Biol. Biochem. 2014, 70, 244–255. [Google Scholar] [CrossRef]
  72. Wang, N.; Chang, Z.-Z.; Xue, X.-M.; Yu, J.-G.; Shi, X.-X.; Ma, L.Q.; Li, H.-B. Biochar Decreases Nitrogen Oxide and Enhances Methane Emissions via Altering Microbial Community Composition of Anaerobic Paddy Soil. Sci. Total Environ. 2017, 581–582, 689–696. [Google Scholar] [CrossRef]
  73. Wu, Z.; Zhang, Q.; Zhang, X.; Duan, P.; Yan, X.; Xiong, Z. Biochar-Enriched Soil Mitigated N2O and NO Emissions Similarly as Fresh Biochar for Wheat Production. Sci. Total Environ. 2020, 701, 134943. [Google Scholar] [CrossRef] [PubMed]
  74. Zhang, H.; Voroney, R.P.; Price, G.W. Effects of Biochar Amendments on Soil Microbial Biomass and Activity. J. Environ. Qual. 2014, 43, 2104–2114. [Google Scholar] [CrossRef] [PubMed]
  75. Sun, X.; Han, X.; Ping, F.; Zhang, L.; Zhang, K.; Chen, M.; Wu, W. Effect of Rice-Straw Biochar on Nitrous Oxide Emissions from Paddy Soils under Elevated CO2 and Temperature. Sci. Total Environ. 2018, 628–629, 1009–1016. [Google Scholar] [CrossRef]
  76. Ameloot, N.; Maenhout, P.; De Neve, S.; Sleutel, S. Biochar-Induced N2O Emission Reductions after Field Incorporation in a Loam Soil. Geoderma 2016, 267, 10–16. [Google Scholar] [CrossRef]
  77. Angst, T.E.; Six, J.; Reay, D.S.; Sohi, S.P. Impact of Pine Chip Biochar on Trace Greenhouse Gas Emissions and Soil Nutrient Dynamics in an Annual Ryegrass System in California. Agric. Ecosyst. Environ. 2014, 191, 17–26. [Google Scholar] [CrossRef]
  78. Chen, J.; Kim, H.; Yoo, G. Effects of Biochar Addition on CO2 and N2O Emissions Following Fertilizer Application to a Cultivated Grassland Soil. PLoS ONE 2015, 10, e0126841. [Google Scholar] [CrossRef]
  79. Liu, Y.; Zhou, X.; Du, C.; Liu, Y.; Xu, X.; Ejaz, I.; Hu, N.; Zhao, X.; Zhang, Y.; Wang, Z.; et al. Trade-off between Soil Carbon Emission and Sequestration for Winter Wheat under Reduced Irrigation: The Role of Soil Amendments. Agric. Ecosyst. Environ. 2023, 352, 108535. [Google Scholar] [CrossRef]
  80. Zhang, Q.; Wu, Z.; Zhang, X.; Duan, P.; Shen, H.; Gunina, A.; Yan, X.; Xiong, Z. Biochar Amendment Mitigated N2O Emissions from Paddy Field during the Wheat Growing Season. Environ. Pollut. 2021, 281, 117026. [Google Scholar] [CrossRef]
  81. Drevon, D.; Fursa, S.R.; Malcolm, A.L. Intercoder Reliability and Validity of WebPlotDigitizer in Extracting Graphed Data. Behav. Modif. 2017, 41, 323–339. [Google Scholar] [CrossRef]
  82. Lee, S.-I.; Park, H.-J.; Jeong, Y.-J.; Seo, B.-S.; Kwak, J.-H.; Yang, H.I.; Xu, X.; Tang, S.; Cheng, W.; Lim, S.-S.; et al. Biochar-Induced Reduction of N2O Emission from East Asian Soils under Aerobic Conditions: Review and Data Analysis. Environ. Pollut. 2021, 291, 118154. [Google Scholar] [CrossRef]
  83. Gai, X.; Wang, H.; Liu, J.; Zhai, L.; Liu, S.; Ren, T.; Liu, H. Effects of Feedstock and Pyrolysis Temperature on Biochar Adsorption of Ammonium and Nitrate. PLoS ONE 2014, 9, e113888. [Google Scholar] [CrossRef] [PubMed]
  84. Yuan, J.-H.; Xu, R.-K.; Zhang, H. The Forms of Alkalis in the Biochar Produced from Crop Residues at Different Temperatures. Bioresour. Technol. 2011, 102, 3488–3497. [Google Scholar] [CrossRef] [PubMed]
  85. Tomczyk, A.; Sokołowska, Z.; Boguta, P. Biochar Physicochemical Properties: Pyrolysis Temperature and Feedstock Kind Effects. Rev. Environ. Sci. Biotechnol. 2020, 19, 191–215. [Google Scholar] [CrossRef]
  86. Xu, S.; Chen, J.; Peng, H.; Leng, S.; Li, H.; Qu, W.; Hu, Y.; Li, H.; Jiang, S.; Zhou, W.; et al. Effect of Biomass Type and Pyrolysis Temperature on Nitrogen in Biochar, and the Comparison with Hydrochar. Fuel 2021, 291, 120128. [Google Scholar] [CrossRef]
  87. Zhang, J.; Liu, J.; Liu, R. Effects of Pyrolysis Temperature and Heating Time on Biochar Obtained from the Pyrolysis of Straw and Lignosulfonate. Bioresour. Technol. 2015, 176, 288–291. [Google Scholar] [CrossRef]
  88. Nzediegwu, C.; Arshad, M.; Ulah, A.; Naeth, M.A.; Chang, S.X. Fuel, Thermal and Surface Properties of Microwave-Pyrolyzed Biochars Depend on Feedstock Type and Pyrolysis Temperature. Bioresour. Technol. 2021, 320, 124282. [Google Scholar] [CrossRef]
  89. Rochette, P.; Angers, D.A.; Chantigny, M.H.; Gasser, M.-O.; MacDonald, J.D.; Pelster, D.E.; Bertrand, N. NH3 Volatilization, Soil Concentration and Soil pH Following Subsurface Banding of Urea at Increasing Rates. Can. J. Soil Sci. 2013, 93, 261–268. [Google Scholar] [CrossRef]
  90. Al-Wabel, M.I.; Al-Omran, A.; El-Naggar, A.H.; Nadeem, M.; Usman, A.R.A. Pyrolysis Temperature Induced Changes in Characteristics and Chemical Composition of Biochar Produced from Conocarpus Wastes. Bioresour. Technol. 2013, 131, 374–379. [Google Scholar] [CrossRef]
  91. Sha, Z.; Li, Q.; Lv, T.; Misselbrook, T.; Liu, X. Response of Ammonia Volatilization to Biochar Addition: A Meta-Analysis. Sci. Total Environ. 2019, 655, 1387–1396. [Google Scholar] [CrossRef]
  92. Abujabhah, I.S.; Doyle, R.; Bound, S.A.; Bowman, J.P. The Effect of Biochar Loading Rates on Soil Fertility, Soil Biomass, Potential Nitrification, and Soil Community Metabolic Profiles in Three Different Soils. J. Soils Sediments 2016, 16, 2211–2222. [Google Scholar] [CrossRef]
  93. Yao, R.-J.; Li, H.-Q.; Yang, J.-S.; Wang, X.-P.; Xie, W.-P.; Zhang, X. Biochar Addition Inhibits Nitrification by Shifting Community Structure of Ammonia-Oxidizing Microorganisms in Salt-Affected Irrigation-Silting Soil. Microorganisms 2022, 10, 436. [Google Scholar] [CrossRef] [PubMed]
  94. Quin, P.R.; Cowie, A.L.; Flavel, R.J.; Keen, B.P.; Macdonald, L.M.; Morris, S.G.; Singh, B.P.; Young, I.M.; Van Zwieten, L. Oil Mallee Biochar Improves Soil Structural Properties—A Study with x-Ray Micro-CT. Agric. Ecosyst. Environ. 2014, 191, 142–149. [Google Scholar] [CrossRef]
  95. Wang, J.; Li, D.; Yu, X.; Zhang, M.; Jing, X. Fabrication of Layered Double Hydroxide Spheres through Urea Hydrolysis and Mechanisms Involved in the Formation. Colloid Polym. Sci. 2010, 288, 1411–1418. [Google Scholar] [CrossRef]
  96. Liu, Z.; E, Y.; Lan, Y.; He, T.; Chen, W.; Meng, J. Effect of Biochar on Urea Hydrolysis Rate and Soil ureC Gene Copy Numbers. J. Soil Sci. Plant Nutr. 2021, 21, 3122–3131. [Google Scholar] [CrossRef]
  97. Beaudoin, N.; Saad, J.K.; Van Laethem, C.; Machet, J.M.; Maucorps, J.; Mary, B. Nitrate Leaching in Intensive Agriculture in Northern France: Effect of Farming Practices, Soils and Crop Rotations. Agric. Ecosyst. Environ. 2005, 111, 292–310. [Google Scholar] [CrossRef]
  98. Edeh, I.G.; Mašek, O.; Buss, W. A Meta-Analysis on Biochar’s Effects on Soil Water Properties—New Insights and Future Research Challenges. Sci. Total Environ. 2020, 714, 136857. [Google Scholar] [CrossRef]
  99. Wang, D.; Li, C.; Parikh, S.J.; Scow, K.M. Impact of Biochar on Water Retention of Two Agricultural Soils—A Multi-Scale Analysis. Geoderma 2019, 340, 185–191. [Google Scholar] [CrossRef]
  100. Hagemann, N.; Joseph, S.; Schmidt, H.-P.; Kammann, C.I.; Harter, J.; Borch, T.; Young, R.B.; Varga, K.; Taherymoosavi, S.; Elliott, K.W.; et al. Organic Coating on Biochar Explains Its Nutrient Retention and Stimulation of Soil Fertility. Nat. Commun. 2017, 8, 1089. [Google Scholar] [CrossRef]
  101. Kohira, Y.; Fentie, D.; Lewoyehu, M.; Wutisirirattanachai, T.; Gezahegn, A.; Addisu, S.; Sato, S. Elucidation of Ammonium and Nitrate Adsorption Mechanisms by Water Hyacinth Biochar: Effects of Pyrolysis Temperature. Environ. Sci. Pollut. Res. 2025, 32, 762–782. [Google Scholar] [CrossRef]
  102. Luo, W.; Qian, L.; Liu, W.; Zhang, X.; Wang, Q.; Jiang, H.; Cheng, B.; Ma, H.; Wu, Z. A Potential Mg-Enriched Biochar Fertilizer: Excellent Slow-Release Performance and Release Mechanism of Nutrients. Sci. Total Environ. 2021, 768, 144454. [Google Scholar] [CrossRef]
  103. Kumari, K.G.I.D.; Moldrup, P.; Paradelo, M.; Elsgaard, L.; De Jonge, L.W. Effects of Biochar on Dispersibility of Colloids in Agricultural Soils. J. Environ. Qual. 2017, 46, 143–152. [Google Scholar] [CrossRef] [PubMed]
  104. Haider, G.; Steffens, D.; Moser, G.; Müller, C.; Kammann, C.I. Biochar Reduced Nitrate Leaching and Improved Soil Moisture Content without Yield Improvements in a Four-Year Field Study. Agric. Ecosyst. Environ. 2017, 237, 80–94. [Google Scholar] [CrossRef]
  105. Jeffery, S.; Verheijen, F.G.A.; Van Der Velde, M.; Bastos, A.C. A Quantitative Review of the Effects of Biochar Application to Soils on Crop Productivity Using Meta-Analysis. Agric. Ecosyst. Environ. 2011, 144, 175–187. [Google Scholar] [CrossRef]
  106. Shaji, H.; Chandran, V.; Mathew, L. Chapter 13—Organic Fertilizers as a Route to Controlled Release of Nutrients. Control. Release Fertil. Sustain. Agric. 2021, 231–245. [Google Scholar] [CrossRef]
  107. Köhler, K.; Duynisveld, W.H.M.; Böttcher, J. Nitrogen Fertilization and Nitrate Leaching into Groundwater on Arable Sandy Soils. J. Plant Nutr. Soil Sci. 2006, 169, 185–195. [Google Scholar] [CrossRef]
  108. Harter, J.; Guzman-Bustamante, I.; Kuehfuss, S.; Ruser, R.; Well, R.; Spott, O.; Kappler, A.; Behrens, S. Gas Entrapment and Microbial N2O Reduction Reduce N2O Emissions from a Biochar-Amended Sandy Clay Loam Soil. Sci. Rep. 2016, 6, 39574. [Google Scholar] [CrossRef]
  109. Obia, A.; Mulder, J.; Hale, S.E.; Nurida, N.L.; Cornelissen, G. The Potential of Biochar in Improving Drainage, Aeration and Maize Yields in Heavy Clay Soils. PLoS ONE 2018, 13, e0196794. [Google Scholar] [CrossRef]
  110. Harter, J.; Krause, H.-M.; Schuettler, S.; Ruser, R.; Fromme, M.; Scholten, T.; Kappler, A.; Behrens, S. Linking N2O Emissions from Biochar-Amended Soil to the Structure and Function of the N-Cycling Microbial Community. ISME J. 2014, 8, 660–674. [Google Scholar] [CrossRef]
  111. Liu, S.; Qin, Y.; Zou, J.; Liu, Q. Effects of Water Regime during Rice-Growing Season on Annual Direct N2O Emission in a Paddy Rice–Winter Wheat Rotation System in Southeast China. Sci. Total Environ. 2010, 408, 906–913. [Google Scholar] [CrossRef]
  112. Zhang, A.; Cui, L.; Pan, G.; Li, L.; Hussain, Q.; Zhang, X.; Zheng, J.; Crowley, D. Effect of Biochar Amendment on Yield and Methane and Nitrous Oxide Emissions from a Rice Paddy from Tai Lake Plain, China. Agric. Ecosyst. Environ. 2010, 139, 469–475. [Google Scholar] [CrossRef]
  113. Xu, H.-J.; Wang, X.-H.; Li, H.; Yao, H.-Y.; Su, J.-Q.; Zhu, Y.-G. Biochar Impacts Soil Microbial Community Composition and Nitrogen Cycling in an Acidic Soil Planted with Rape. Environ. Sci. Technol. 2014, 48, 9391–9399. [Google Scholar] [CrossRef] [PubMed]
  114. Shi, Y.; Liu, X.; Zhang, Q. Effects of Combined Biochar and Organic Fertilizer on Nitrous Oxide Fluxes and the Related Nitrifier and Denitrifier Communities in a Saline-Alkali Soil. Sci. Total Environ. 2019, 686, 199–211. [Google Scholar] [CrossRef] [PubMed]
  115. Herencia, J.F.; García-Galavís, P.A.; Maqueda, C. Long-Term Effect of Organic and Mineral Fertilization on Soil Physical Properties Under Greenhouse and Outdoor Management Practices. Pedosphere 2011, 21, 443–453. [Google Scholar] [CrossRef]
  116. Al Majou, H.; Muller, F.; Penhoud, P.; Bruand, A. Prediction of Water Retention Properties of Syrian Clayey Soils. Arid Land Res. Manag. 2022, 36, 125–144. [Google Scholar] [CrossRef]
  117. Zheng, H.; Wang, Z.; Deng, X.; Herbert, S.; Xing, B. Impacts of Adding Biochar on Nitrogen Retention and Bioavailability in Agricultural Soil. Geoderma 2013, 206, 32–39. [Google Scholar] [CrossRef]
  118. Yan, X.; Du, L.; Shi, S.; Xing, G. Nitrous Oxide Emission from Wetland Rice Soil as Affected by the Application of Controlled-Availability Fertilizers and Mid-Season Aeration. Biol. Fertil. Soils 2000, 32, 60–66. [Google Scholar] [CrossRef]
Figure 1. Pearson correlation heatmap of lignocellulosic feedstock biochar physicochemical properties. Correlation is significant at * p < 0.05, ** p < 0.01, and *** p < 0.001. Temp, pyrolysis temperature; CEC, cation exchange capacity; SSA, specific surface area (BET surface area); TC, total carbon; TN, total nitrogen; and C/N ratio, carbon to nitrogen ratio.
Environments 12 00182 g001
Figure 2. Pearson correlation heatmap of non-lignocellulosic feedstock biochar physicochemical properties. Correlation is significant at * p < 0.05, ** p < 0.01, and *** p < 0.001. Temp, pyrolysis temperature; CEC, cation exchange capacity; SSA, specific surface area (BET surface area); TC, total carbon; TN, total nitrogen; and C/N ratio, carbon to nitrogen ratio.
Environments 12 00182 g002
Figure 3. Box plots of the ammonia volatilization reduction index (Rindex) by the biochar physicochemical properties and application rate. The subfigures (ai) display Rindex values categorized by: (a) Pyrolysis temperature (°C; categories: ≦400, 401−600, 601≦); (b) pH (categories: ≦8.0, 8.1−10.0, 10.1≦); (c) CEC (cmol+ kg−1; categories: ≦20, 21−40, 41≦); (d) SSA (m2 g−1; categories: ≦50, 51−100, 101≦); (e) TC (g kg−1; categories: ≦300, 301−600, 601≦); (f) TN (g kg−1; categories: ≦15, 16−30, 31≦); (g) C/N ratio (categories: ≦25, 26−50, 51≦); (h) Ash content (%; categories: ≦15, 16≦); (i) Biochar application rate (t ha−1; categories: ≦25, 26−50, 51≦). The same letters denote no significant differences by the Tukey HSD analysis at p < 0.05.
Environments 12 00182 g003
Figure 4. The principal component analysis for the ammonia volatilization by a (a) scores and (b) vectors plot. Arrows indicate the contributions of different variables to the main components. The vector length corresponds to the importance of the variables.
Environments 12 00182 g004
Figure 5. Box plots of the ammonia volatilization reduction index (Rindex) by the (a) experimental type, (b) fertilizer type, (c) soil texture, and (d) initial soil pH. The same letters denote no significant differences by the Tukey HSD analysis at p < 0.05.
Environments 12 00182 g005
Figure 6. Box plots of the nitrate leaching reduction index (Rindex) by biochar physicochemical properties and the application rate. The subfigures (ai) display Rindex values categorized by: (a) Pyrolysis temperature (°C; categories: ≦400, 401−600, 601≦); (b) pH (categories: ≦8.0, 8.1−10.0, 10.1≦); (c) CEC (cmol+ kg−1; categories: ≦20, 21−40, 41≦); (d) SSA (m2 g−1; categories: ≦100, 101≦); (e) TC (g kg−1; categories: ≦500, 501−700, 701≦); (f) TN (g kg−1; categories: ≦15, 16−30, 31≦); (g) C/N ratio (categories: ≦25, 26−50, 51−100, 101≦); (h) Ash content (%; categories: ≦15, 16≦); (i) Biochar application rate (t ha−1; categories: ≦20, 21−50, 51≦). The same letters denote no significant differences by the Tukey HSD analysis at p < 0.05.
Environments 12 00182 g006
Figure 7. The principal component analysis for nitrate leaching by a (a) scores and (b) vectors plot. Arrows indicate the contributions of different variables to the main components. The vector length corresponds to the importance of the variables.
Environments 12 00182 g007
Figure 8. Box plots of the nitrate leaching reduction index (Rindex) by the (a) experimental type, (b) fertilizer type, (c) soil texture, and (d) initial soil pH. The same letters denote no significant differences by the Tukey HSD analysis at p < 0.05.
Environments 12 00182 g008
Figure 9. Box plots of the nitrous oxide emission reduction index (Rindex) by biochar physicochemical properties and application rates. The subfigures (ai) display Rindex values categorized by: (a) Pyrolysis temperature (°C; categories: ≦400, 401−600, 601≦); (b) pH (categories: ≦8.0, 8.1−10.0, 10.1≦); (c) CEC (cmol+ kg−1; categories: ≦20, 21−40, 41≦); (d) SSA (m2 g−1; categories: ≦50, 51≦); (e) TC (g kg−1; categories: ≦500, 501−700, 701≦); (f) TN (g kg−1; categories: ≦10, 11−20, 21≦); (g) C/N ratio (categories: ≦25, 26−50, 51−100, 101≦); (h) Ash content (%; categories: ≦15, 16≦); (i) Biochar application rate (t ha−1; categories: ≦20, 21−50, 51≦). The same letters denote no significant differences by the Tukey HSD analysis at p < 0.05.
Environments 12 00182 g009
Figure 10. The principal component analysis for nitrous oxide emissions by (a) scores and (b) vectors plots. Arrows indicate the contributions of different variables to the main components. The vector length corresponds to the importance of the variables.
Environments 12 00182 g010
Figure 11. Box plots of the nitrous oxide emission reduction index (Rindex) by the (a) experimental type, (b) fertilizer type, (c) soil texture, and (d) initial soil pH. The same letters denote no significant differences by the Tukey HSD analysis at p < 0.05.
Environments 12 00182 g011
Table 1. Selected articles in data analysis.
IndexExperimental TypesReferences
NH3 volatilizationIncubation[17,18,19,20,21,22,23]
Column[24,25,26]
Pot[27,28,29]
Chamber[30,31]
Field[32,33,34,35,36]
NO3-N leachingIncubation[19,37]
Column[26,38,39,40,41,42,43,44,45,46,47,48,49,50,51,52]
Pot[27,53,54,55,56]
Field[57,58,59,60,61,62]
N2O emissionIncubation[63,64,65,66,67,68,69,70,71,72,73,74]
Pot[29,75]
Column[25,47]
Field[61,62,66,76,77,78,79,80]
Disclaimer/Publisher’s Note: The statements, opinions and data contained in all publications are solely those of the individual author(s) and contributor(s) and not of MDPI and/or the editor(s). MDPI and/or the editor(s) disclaim responsibility for any injury to people or property resulting from any ideas, methods, instructions or products referred to in the content.

