Article

Isolation Forest for Environmental Monitoring: A Data-Driven Approach to Land Management

by
Maria Silvia Binetti
1,
Vito Felice Uricchio
2 and
Carmine Massarelli
2,*
1
Department of Earth and Geoenvironmental Sciences, University of Bari Aldo Moro, 70125 Bari, Italy
2
Environment and Territory Research Unit, Construction Technologies Institute, Italian National Research Council (ITC-CNR), 70124 Bari, Italy
*
Author to whom correspondence should be addressed.
Environments 2025, 12(4), 116; https://doi.org/10.3390/environments12040116
Submission received: 7 February 2025 / Revised: 27 March 2025 / Accepted: 7 April 2025 / Published: 10 April 2025

Abstract

:
This paper examines land management technologies to enhance environmental monitoring more efficiently. The study highlights the interactions between human activities and environmental systems with a data-driven environmental monitoring approach. There are many human pressures, such as pollution, land degradation, and habitat loss, negatively impacting soil health. The methodology proposed improves soil status assessments in response to evolving environmental pressures by utilizing satellite imagery and predictive modeling. The integration of Sentinel-2 imagery, the calculation of various spectral indices (NDVI, NBR, NDMI, EVI, SAVI) at different time intervals, and the application of the Isolation Forest algorithm are employed in this study to determine the specific area that is affected by the environmental issue. The chosen algorithm was favored due to its superior performance in handling high-dimensionality data, enhanced computational efficiency, provision of interpretable results, and insensitivity to disparities in class distribution. This study analyzes two separate study cases at different scales. The first involves wildfire identification achieving an overall accuracy of 98%. The second focuses on the expansion areas to pre-existing quarries with an overall accuracy of 95%. The NBR proved most effective in delineating burned areas, whereas the EVI generated the most remarkable results in the quarry case study. This approach provides an effective and scalable tool for environmental monitoring, supporting sustainable management policies, and strengthening ecosystem resilience.

1. Introduction

The interaction between the environment and human activities is a global issue. Understanding and monitoring these processes is crucial to developing sustainable natural resource management strategies. In this context, a detailed examination of the impacts of anthropogenic pressures on ecosystem structure and function is necessary. Multiple environmental interventions are helpful for the preservation of biodiversity and the safeguarding of the environment [1,2,3,4,5].
The terrestrial substrate is an essential resource for life on Earth. It performs functions in biogeochemical cycles and key ecosystem services [6]. However, many human activities, such as intensive agriculture, stone mining, landfill and waste disposal, fire and deforestation, urbanization, pollution, and climate change, exert significant pressures on soil quality, leading to degradation and desertification [7,8,9]. Assessing the health of the land and monitoring changes over time is, therefore, a priority for sustainable land management. Traditional monitoring methodologies, based on spot sampling and laboratory analysis, are limited in terms of cost, time, and capacity to provide high spatial and temporal scale information.
In this context, the study aims to integrate advanced remote sensing technologies as a support for traditional monitoring methodologies. Using satellite images, with the calculation of spectral indices, it is possible to obtain detailed information on soil cover, its productivity, and the state of health of the vegetation [10,11]. The use of an index in different time intervals allows the identification of a specific environmental problem. In this study, we want to try applying machine learning algorithms such as the Isolation Forest (IForest) algorithm to automatically identify anomalies associated with soil degradation phenomena. The selected algorithm was chosen due to its performance in handling high-dimensionality data, enhanced computational efficiency, provision of interpretable results, and insensitivity to disparities in class distribution [12,13,14,15].
The aim is to develop an automatic and low-cost monitoring system through the use of open-source software and cloud platforms to process large amounts of data efficiently and automatically [16,17]. Developing a better-detailed monitoring system at the regional level can provide up-to-date information on the state of soil health, support environmental decision-making and spatial planning, and contribute to the definition of sustainable land management policies [16,17].
The article presents two case studies demonstrating environmental monitoring applications: post-fire assessment in forest areas and surveillance expansion of mining sites [18]. The loss of biodiversity is caused by forest fires that damage forest ecosystems. The primary investigations conducted in the past decade have seen the use of optical sensors based on the satellites Landsat, Sentinel, Terra, Aqua, Sentinel, AVHRR, and SPOT in dry subtropical forests [19,20]. The most widely used indices are the Normalized Difference Vegetation Index (NDVI) and the Normalized Burn Ratio (NBR) compared to other indices. The use of multi-sensor images and the combination of time series improves accuracy in estimates [21,22].
Extensive surveillance of mining sites is crucial to prevent the formation of illegal or unauthorized landfills [23]. This measure is essential to safeguard the environment and public health [24,25,26]. Methods for the detection and monitoring of mining activities include Geographic Information Systems (GIS) approaches and Machine Learning (ML) methods [18]. Multiple spectral indices can be combined with multitemporal analysis to improve the accuracy of land-use change detection, particularly in mining contexts [27,28]. Having constantly updated data, even if with a margin of error, allows to keep under control the state of mineral resources on a regional scale. This is essential to implement more accurate and effective management policies aimed at protecting the territory, and ecosystems and preventing illegal practices.

2. Materials and Methods
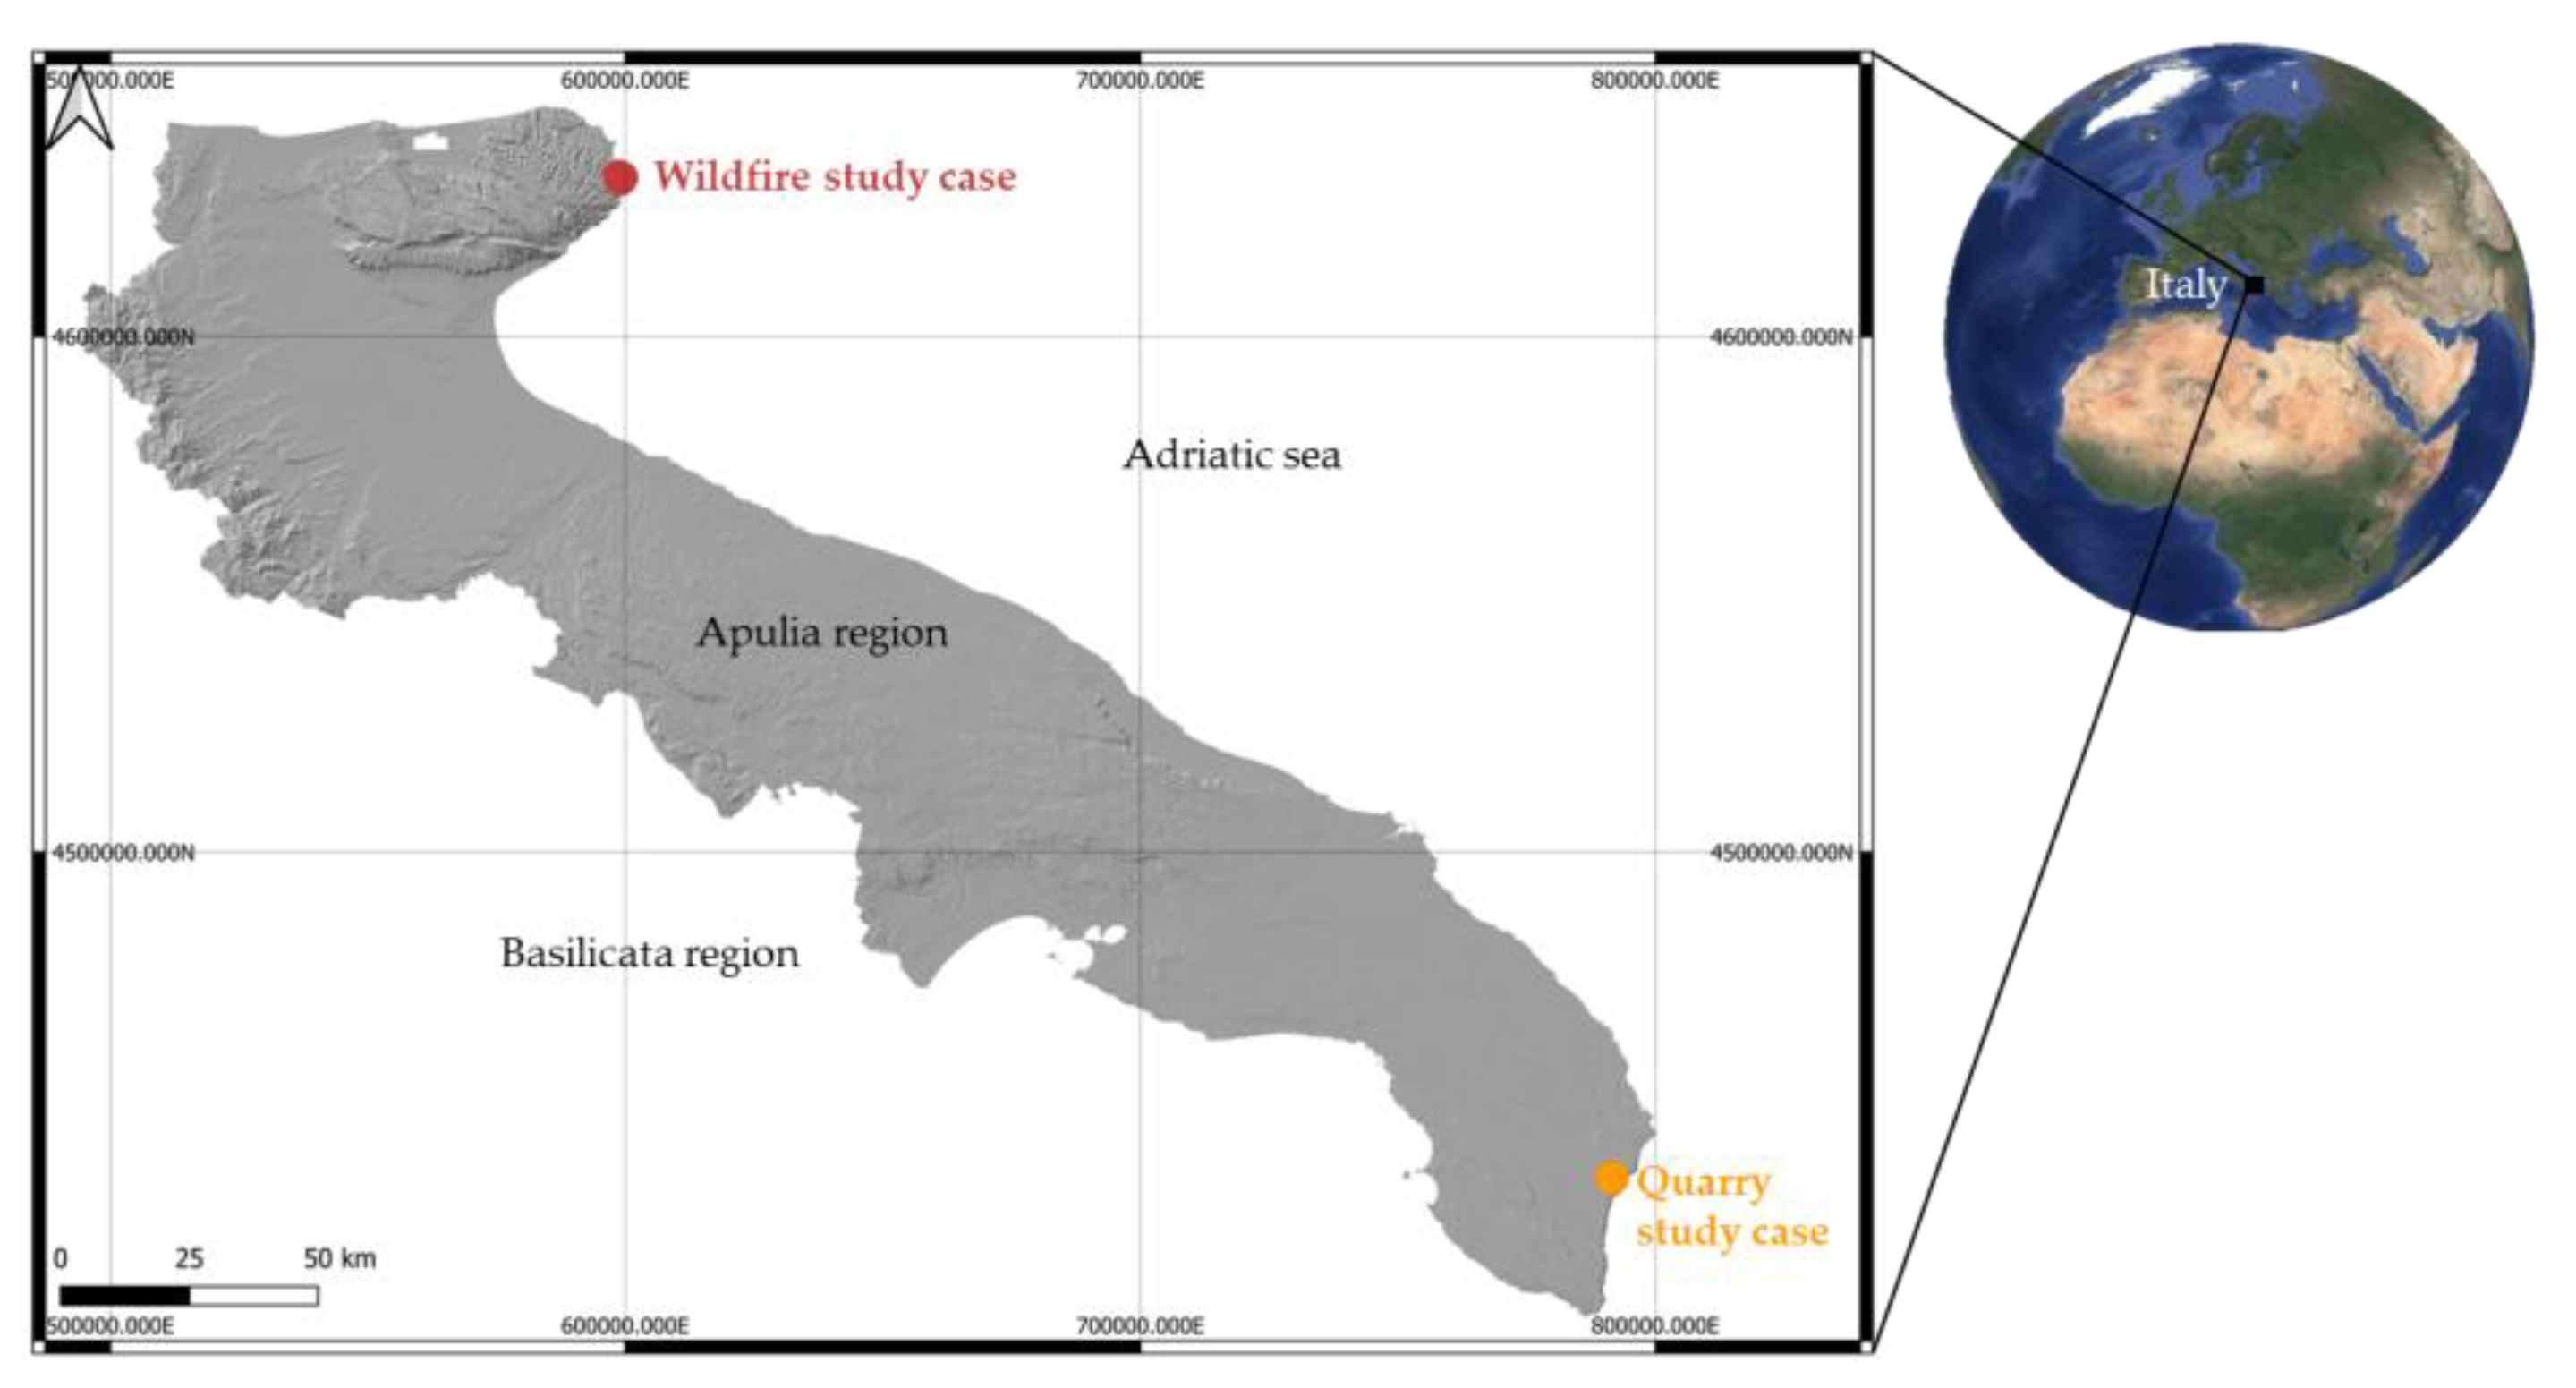
This study adopts a data-driven approach to environmental monitoring, combining satellite remote sensing, spectral index analysis, and machine learning techniques to identify anomalies related to wildfires and quarry expansion. The methodology follows a structured, multi-phase workflow to ensure systematic data processing and analysis. It begins with an overview of the study area, followed by the satellite imagery selection and multispectral index computation, the application of the Isolation Forest algorithm to detect anomalies, and finally, the accuracy assessment phase.

2.1. Study Area

The two study areas selected were located at the north in the Umbra Forest in the Gargano Promontory area and at the south in the Salento Peninsula, both in the Apulia Region in south Italy. Apulia exhibits a typical Mediterranean climate characterized by hot, arid summers and mild, precipitation-rich winters. The regional water balance is significantly influenced by the scarcity of surface water bodies, a consequence of the pronounced karstic nature of the landscape [29]. From a geological perspective, Apulia is predominantly underlain by the Apulian Carbonate Platform. The Gargano promontory and Salento peninsula represent key morphotectonic expressions of the platform but differ in terms of geological evolution and tectonic setting. The climax vegetation of Puglia is mainly represented by the evergreen forests of Quercus ilex and deciduous [30,31]. The areas were selected to test the methods in different environments. The geographical locations of the two study areas are illustrated in Figure 1. The images from the study areas were projected using the World Geodetic System 1984 ensemble (Geodetic CRS—WGS 84). For the Umbra Forest case study, the EPSG code 32633 was used, which extends between 12° E and 18° E longitude and from the equator to 84° N latitude. For the Salento case study, the EPSG code 32634 was applied, covering the area between 18° E and 24° E longitude and from the equator to 84° N latitude.
The Umbra Forest case study aims to develop a method to accurately identify the area affected by a fire and understand the repercussions on the territory. Many fires, caused by humans, occur in forested areas or the suburbs of cities, and rural zones. Often, these fires are set in areas where construction is planned or where waste is found.
The second case study focuses on a mining area. Significant morphological changes occur due to soil and vegetation removal. These changes affect the area’s hydrogeologic properties and increase the potential for illegal activities. Numerous illegal activities have been reported over the years: these include the unauthorized extraction of materials, both in terms of quantity and area, abandonment, and burial waste. There is also the possibility of concealing waste within the site, turning it into an illegal landfill.

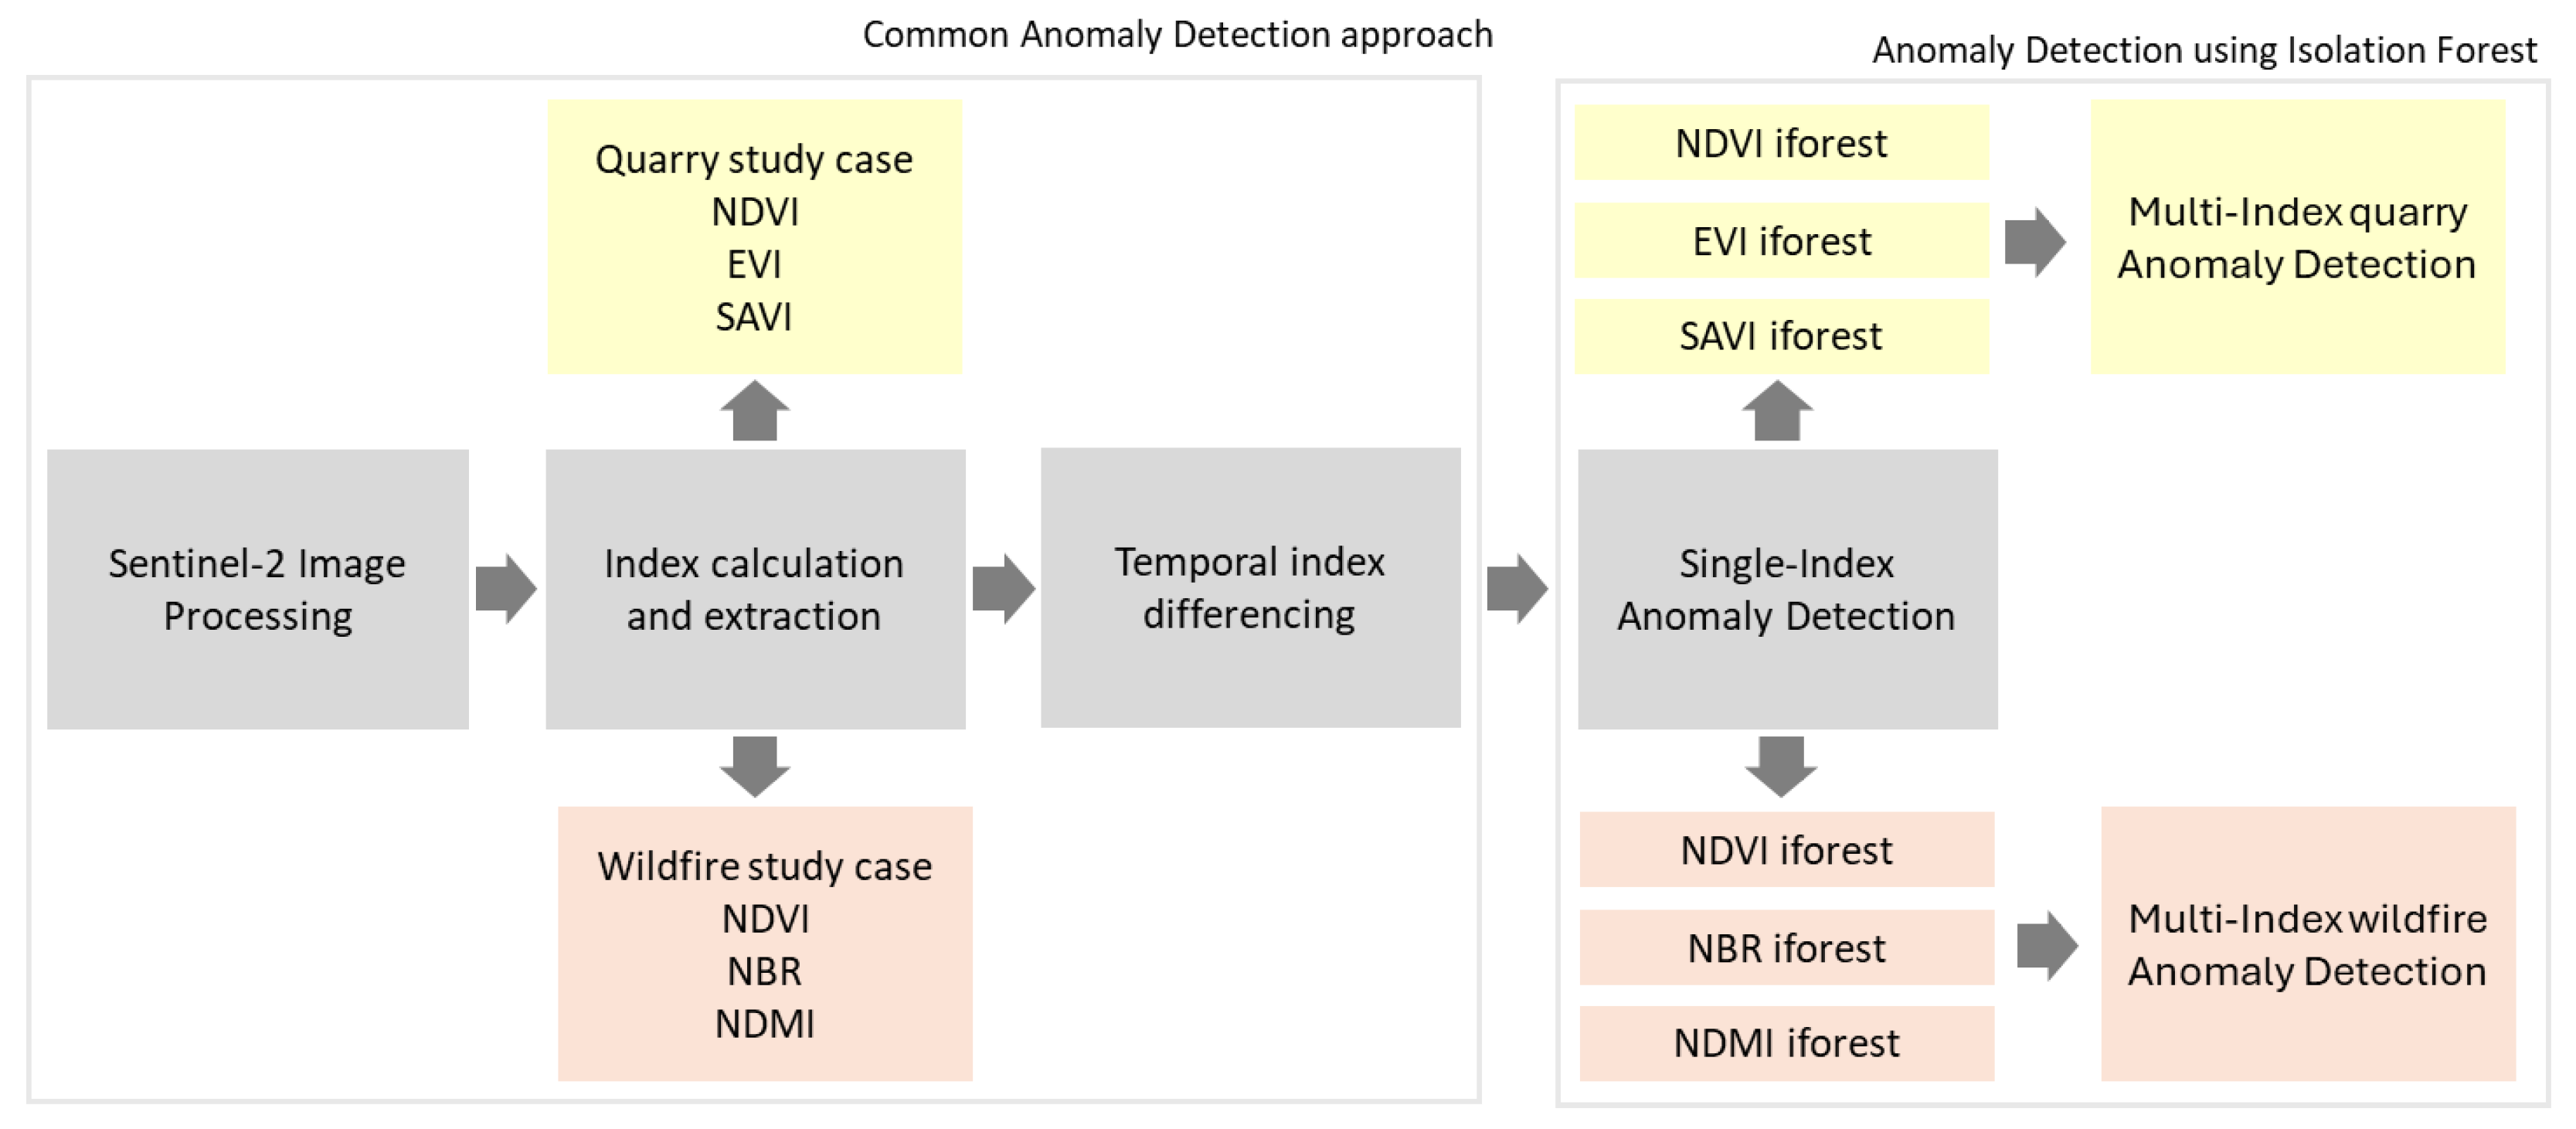
2.2. Satellite Imagery and Multispectral Index Calculation

The Copernicus Sentinel-2 mission, managed by ESA, deploys two polar-orbiting satellites to monitor land surface variability. In this study, we use the Sentinel-2 Level 2A product, which provides atmospherically corrected Surface Reflectance (SR) data, including corrections for molecular scattering. The satellites are equipped with a multispectral instrument (MSI) that captures data across 13 spectral bands, covering visible and infrared wavelengths. The spatial resolution varies by bands: 10 m for bands 2 (blue), 3 (green), 4 (red), and 8 (NIR); 20 m for bands 5, 6, 7, and 8A (Red Edge), and 11 and 12 (SWIR); and 60 m for bands 1 (coastal aerosol), 9 (water vapor), and 10 (SWIR) [32,33]. For the Umbra Forest case study, the two images are taken four months apart: on 21 May 2024 (L2A_T33TWG_20240521T095654) and 24 August 2024 (L2A _T33TWG_20240824T122316). In Salento, there is a seven-year gap between the images taken on 12 September 2017 (S2A_T33TYE_20170912T094031) and 31 August 2024 (L2A_T33TYE_20240831T123202). The four images were obtained from the Copernicus Open Access Hub [34]. The selection focused on the most suitable area of interest and an optimal temporal gap between acquisitions. Images with minimal to no cloud cover were chosen to ensure high data quality. Specifically, images with a cloud cover percentage below 1% were considered for this study.
For the wildfire case study, three spectral indices were applied: NDVI, NBR, and Normalized Difference Moisture Index (NDMI) (Table 1). The NDVI, derived from red (B4) and near-infrared (B8) bands, measures vegetation health and photosynthetic activity [35,36,37]. It is represented with the “RdYlGn” colormap, where green indicates healthy vegetation growth and red indicates vegetation loss. The forest is composed of several tree species: Fagus sylvatica (deciduous), Quercus ilex (evergreen), Quercus cerris (deciduous), and Acer campestris (deciduous). Deciduous species generally exhibit reduced NDVI during summer months, particularly under conditions of water stress or high temperatures, while evergreen species tend to maintain stable NDVI values year-round. The NBR, calculated using the near-infrared (B8A) and shortwave infrared bands, evaluates burn severity using the “RdBu_r” colormap, where red represents burned areas and blue denotes unaffected regions [38]. The NDMI, which assesses vegetation moisture content by comparing near-infrared (B8A) and shortwave infrared bands (B11), is displayed using the “Spectral” colormap, where blue signifies high moisture levels and red indicates low moisture.
In the quarry case study, three indices were applied: NDVI, Enhanced Vegetation Index (EVI), and Soil Adjusted Vegetation Index (SAVI) (Table 1). The EVI enhances sensitivity to dense vegetation using blue (B2), red (B4), and near-infrared (B8) bands, effectively minimizing atmospheric and soil-related influences. It is visualized with the “RdYlGn” colormap, where green highlights areas of dense vegetation and red highlights areas with sparse or no vegetation. The SAVI is a vegetation index designed to reduce the effect of soil brightness in the images. The NDVI index formula manages this and by adding a soil brightness correction factor (L) to the calculation, it is 0.428 [39,40].
The temporal differences in spectral indices were calculated over a 3-month interval for the forest study case and a 7-year interval for the quarry study case. This analysis utilized the libraries Rasterio (1.4.3 version), NumPy (1.26.4 version), Matplotlib (3.9.2 version), and Scikit-learn (1.5.1 version) [41,42,43,44].
Rasterio, a Python library for geospatial raster data, facilitated access and processing of multispectral satellite images, enabling extraction of specific bands for index calculations. Numpy, a numerical computing library efficient with large arrays, was used for pixel-level operations to compute indices and their temporal differences. Matplotlib’s pyplot module was employed to generate color-coded maps of spectral indices and their changes, allowing visual interpretation of vegetation dynamics and environmental variations over time.

2.3. Isolation Forest Algorithm

The Isolation Forest algorithm, a widely used method for anomaly detection, employs an unsupervised approach by leveraging isolation techniques [45,46]. It achieves linear time complexity and requires minimal memory, even when applied to large datasets (satellite images) with numerous irrelevant features. Isolation Forest isolates anomalies by constructing decision trees, called Isolation Trees, that progressively separate data points through random partitions. Anomalies are identified as rare observations that are easily isolated from most data points.
This approach builds a more adaptive tree structure across parallel isolation, with the tree’s depth representing the level of partitioning required to effectively isolate anomalies. The height of the path is used to estimate the deviation from the norm. Once the scores are obtained, results are interpreted accordingly: scores close to 1 indicate that the point was easily isolated and is consequently categorized as an anomaly. In contrast, a score approaching 0 suggests a longer isolation time, indicating a normal observation.
The Isolation Forest algorithm has key parameters that influence its performance: n_estimators (number of trees), max_samples (sample size per tree), and contamination (expected anomaly fraction). In this script, the contamination parameter is set to 0.1, 0.05, and 0.025, guiding the model to identify approximately 10%, 5%, and 2.5% of the data as anomalous. Additionally, random_state is set to 42 to ensure reproducibility. Other parameters, including n_estimators and max_samples, use default values, as they are not specified in the script.
The following pseudocode, a simplified high-level description of an algorithm written in plain language designed to be easily understood by non-programmers, outlines the implementation of the Isolation Forest algorithm, detailing the steps for anomaly detection by isolating individual observations through recursive partitioning of the dataset. Rather than applying Isolation Forest separately to each index, we treat each pixel as a multidimensional feature vector (NDVI, NBR, NDMI for wildfires; NDVI, EVI, SAVI for quarries). This allows the algorithm to detect anomalies based on combined spectral patterns rather than individual extreme values. Two parallel analyses were conducted: one single-index experiment and a multidimensional analysis. First, the IForest was applied separately to spectral index differences to assess each index’s individual detection capability. This primary approach leverages synergistic information across spectral indices for robust anomaly detection. Subsequently, the core methodology combines all three indices as feature vectors.
  • Import libraries:
    -
    numpy, rasterio, IsolationForest, matplotlib.pyplot
  • Create and define a function “spectral_index_difference_image”:
    -
    Open TIFF image with rasterio
    -
    Read and return spectral_index_difference data
    -
    Reproject the raster using “reproject()” with bilinear resampling to match the reference profile
    -
    Return the reprojected raster data
  • Load spectral image data:
    -
    Define a list of file paths for different images
    -
    Open the first raster file to use as the reference profile
    -
    Apply the “reproject_raster()” function to all files to ensure alignment
  • Stack spectral indices into a multidimensional feature space—feature_matrix—Reshape into a 2D array
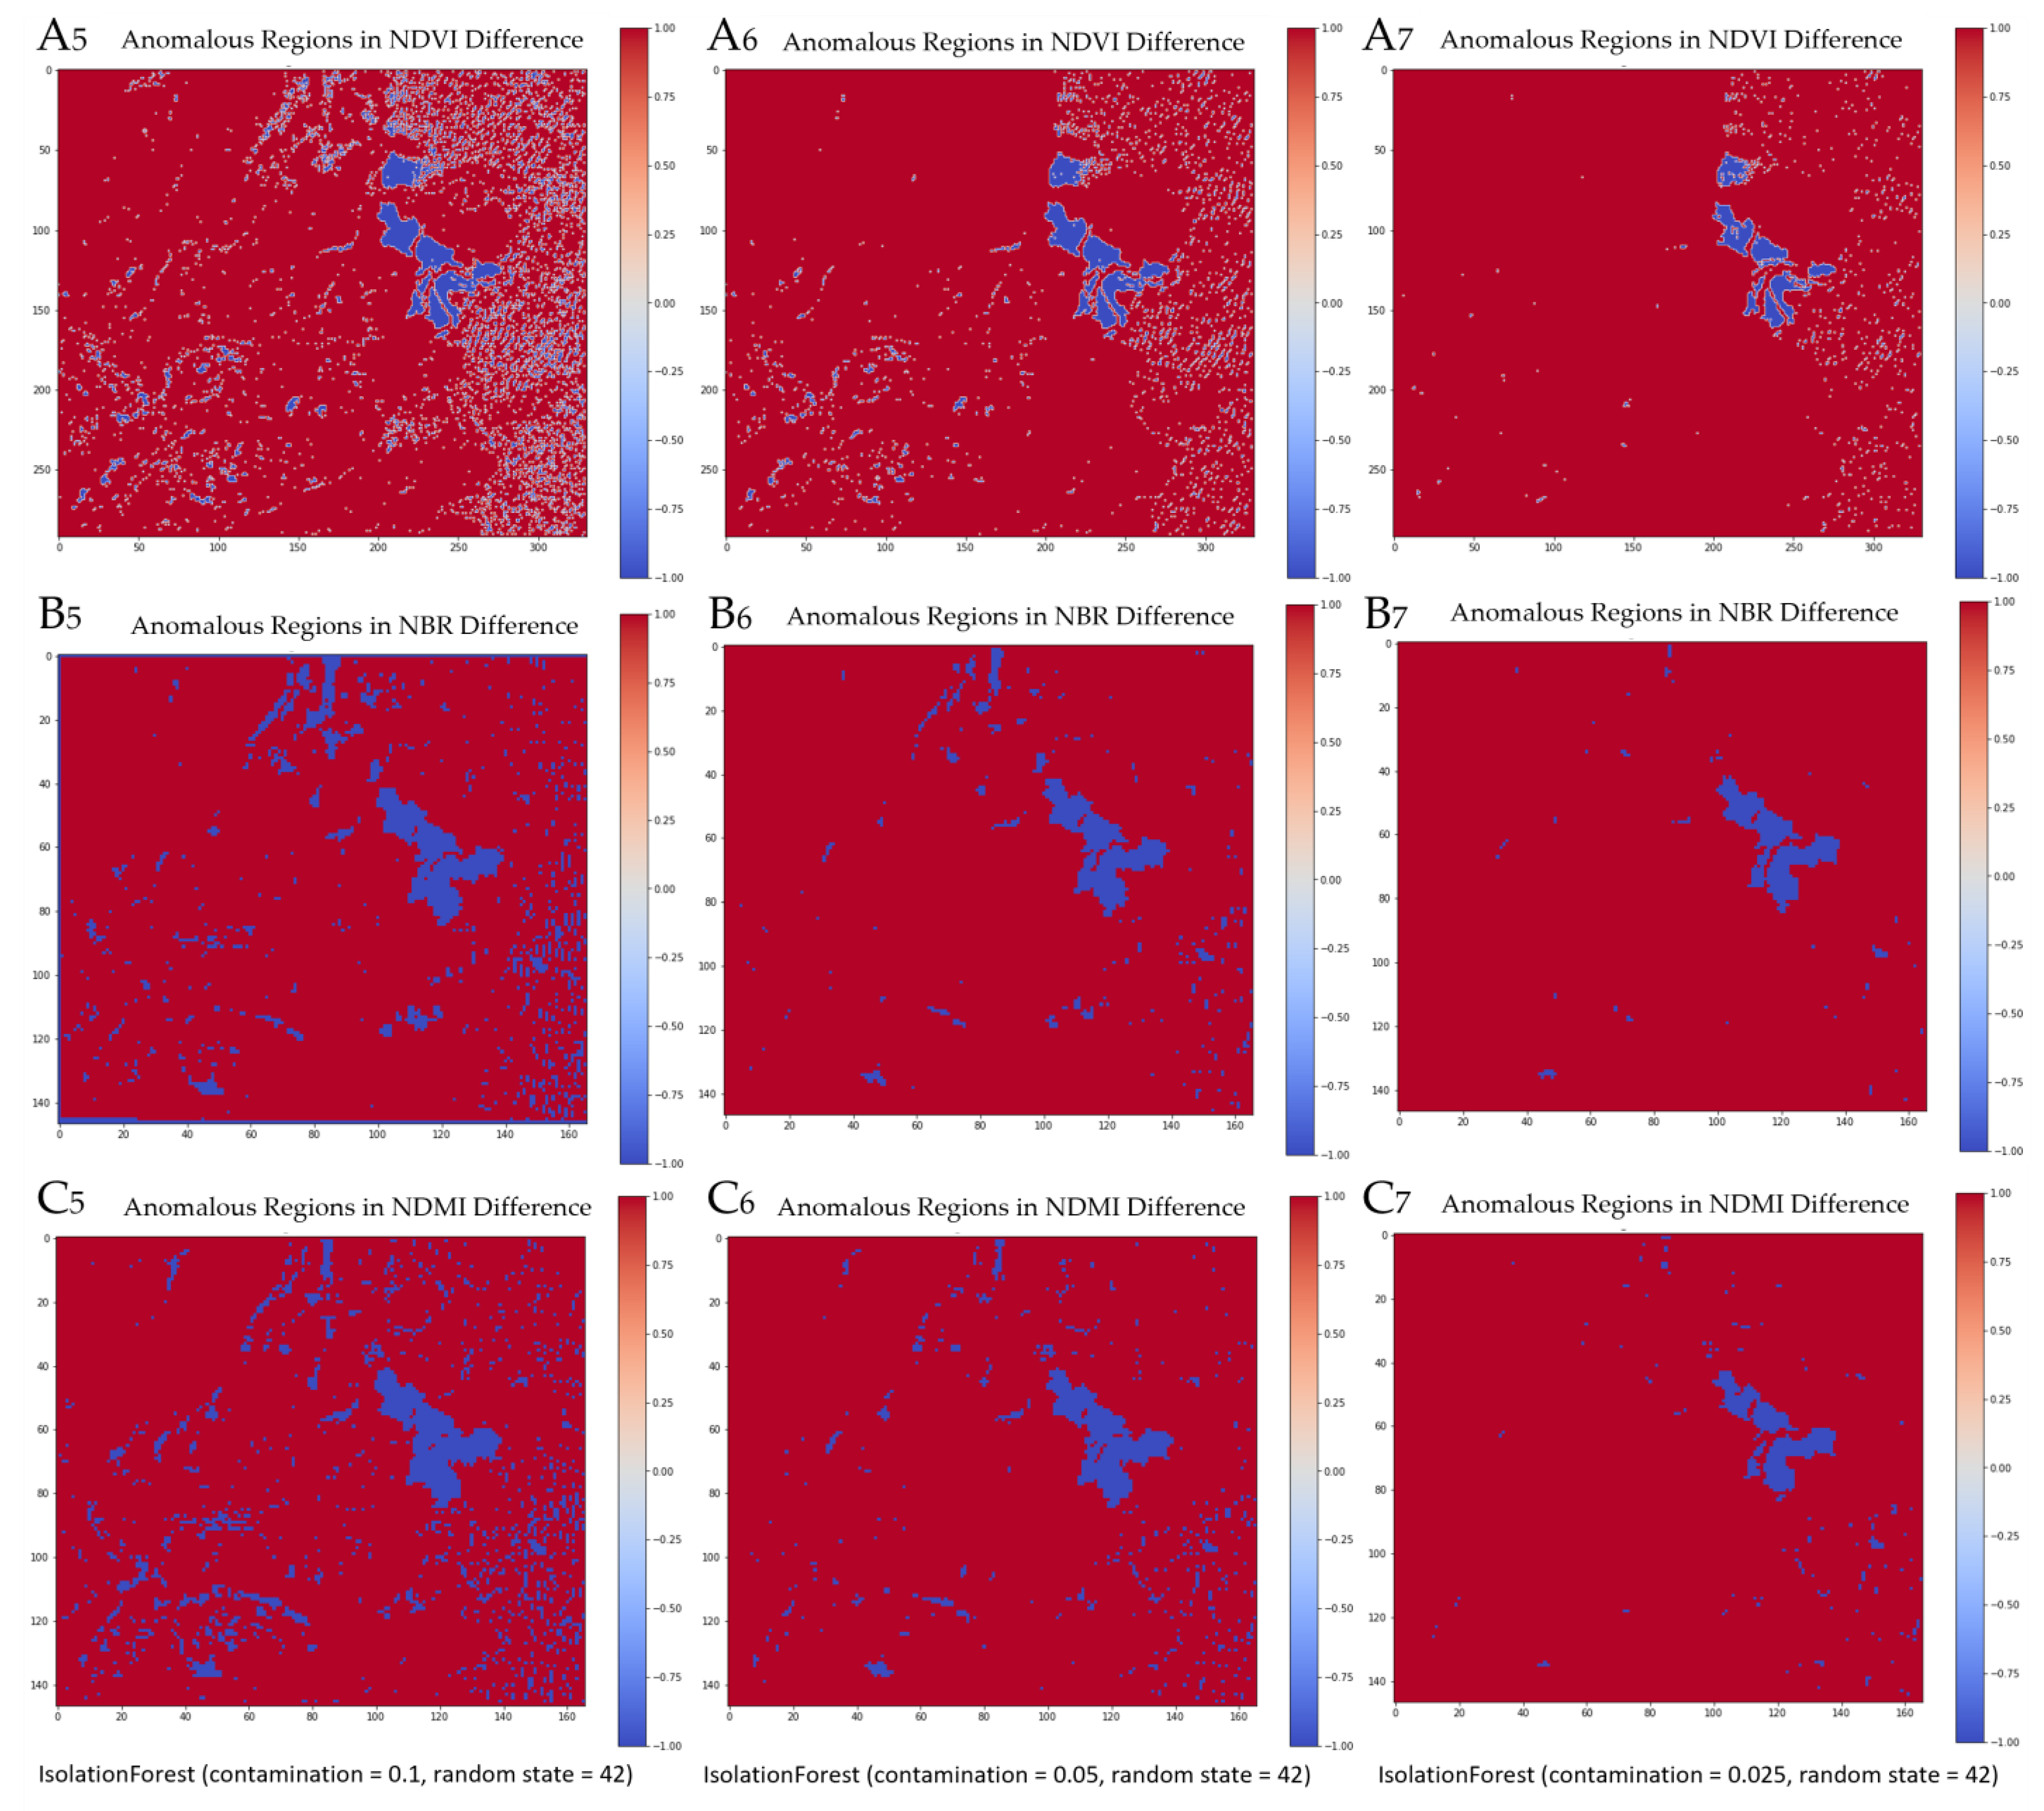
  • Initialize Isolation Forest model with contamination parameter
  • Predict anomalies:
    -
    Predict anomalies (1 = normal, −1 = anomaly)
    -
    Reshape the anomaly predictions to the original image dimensions
  • Visualize anomaly scores:
    -
    Plot the anomaly map using “matplotlib.pyplot.imshow()” with a color map
  • Save anomaly scores to a GeoTIFF:
    -
    Create and write the anomaly score results using “rasterio.open()” with the reference profile
  • Evaluate using the ROC curve
  • Display all plots and print results
The figure below illustrates the methodological framework, encompassing both conventional anomaly detection techniques, such as temporal index differencing, and an innovative algorithm for automated anomaly identification (Figure 2).

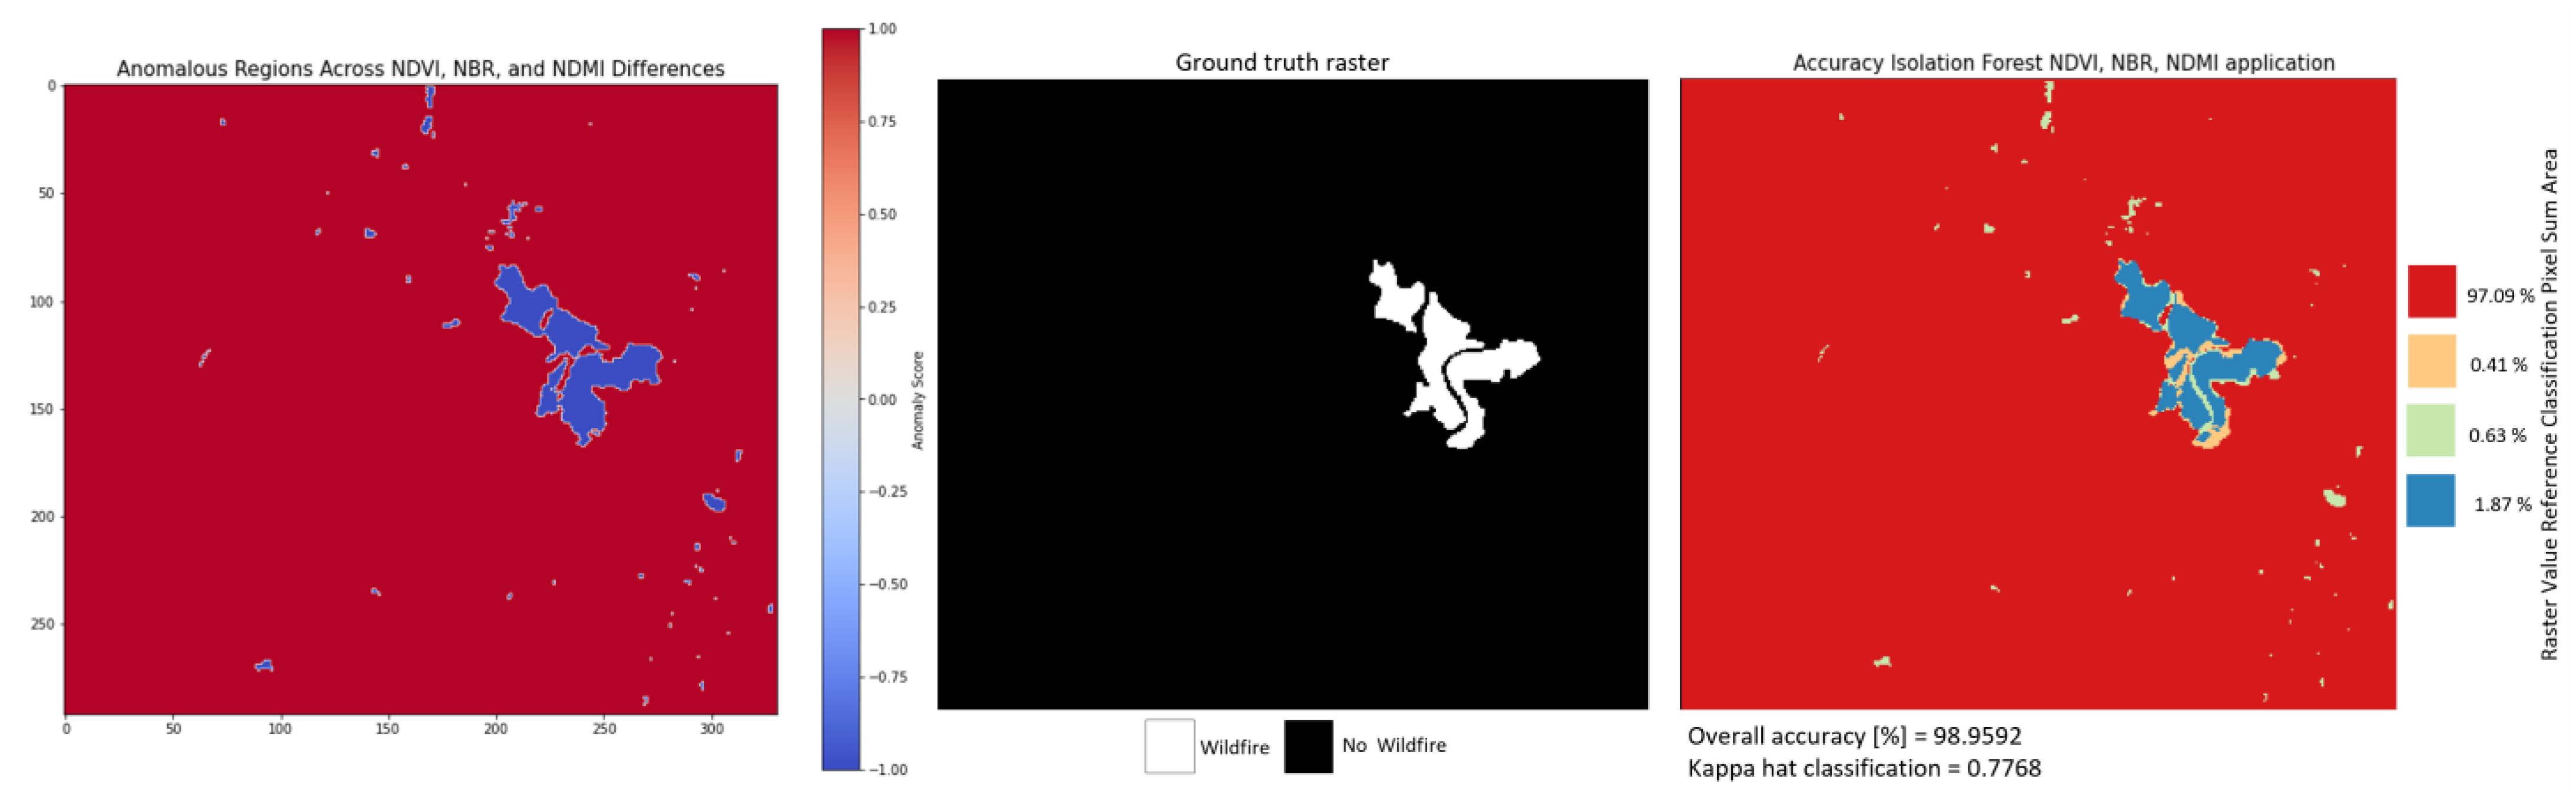
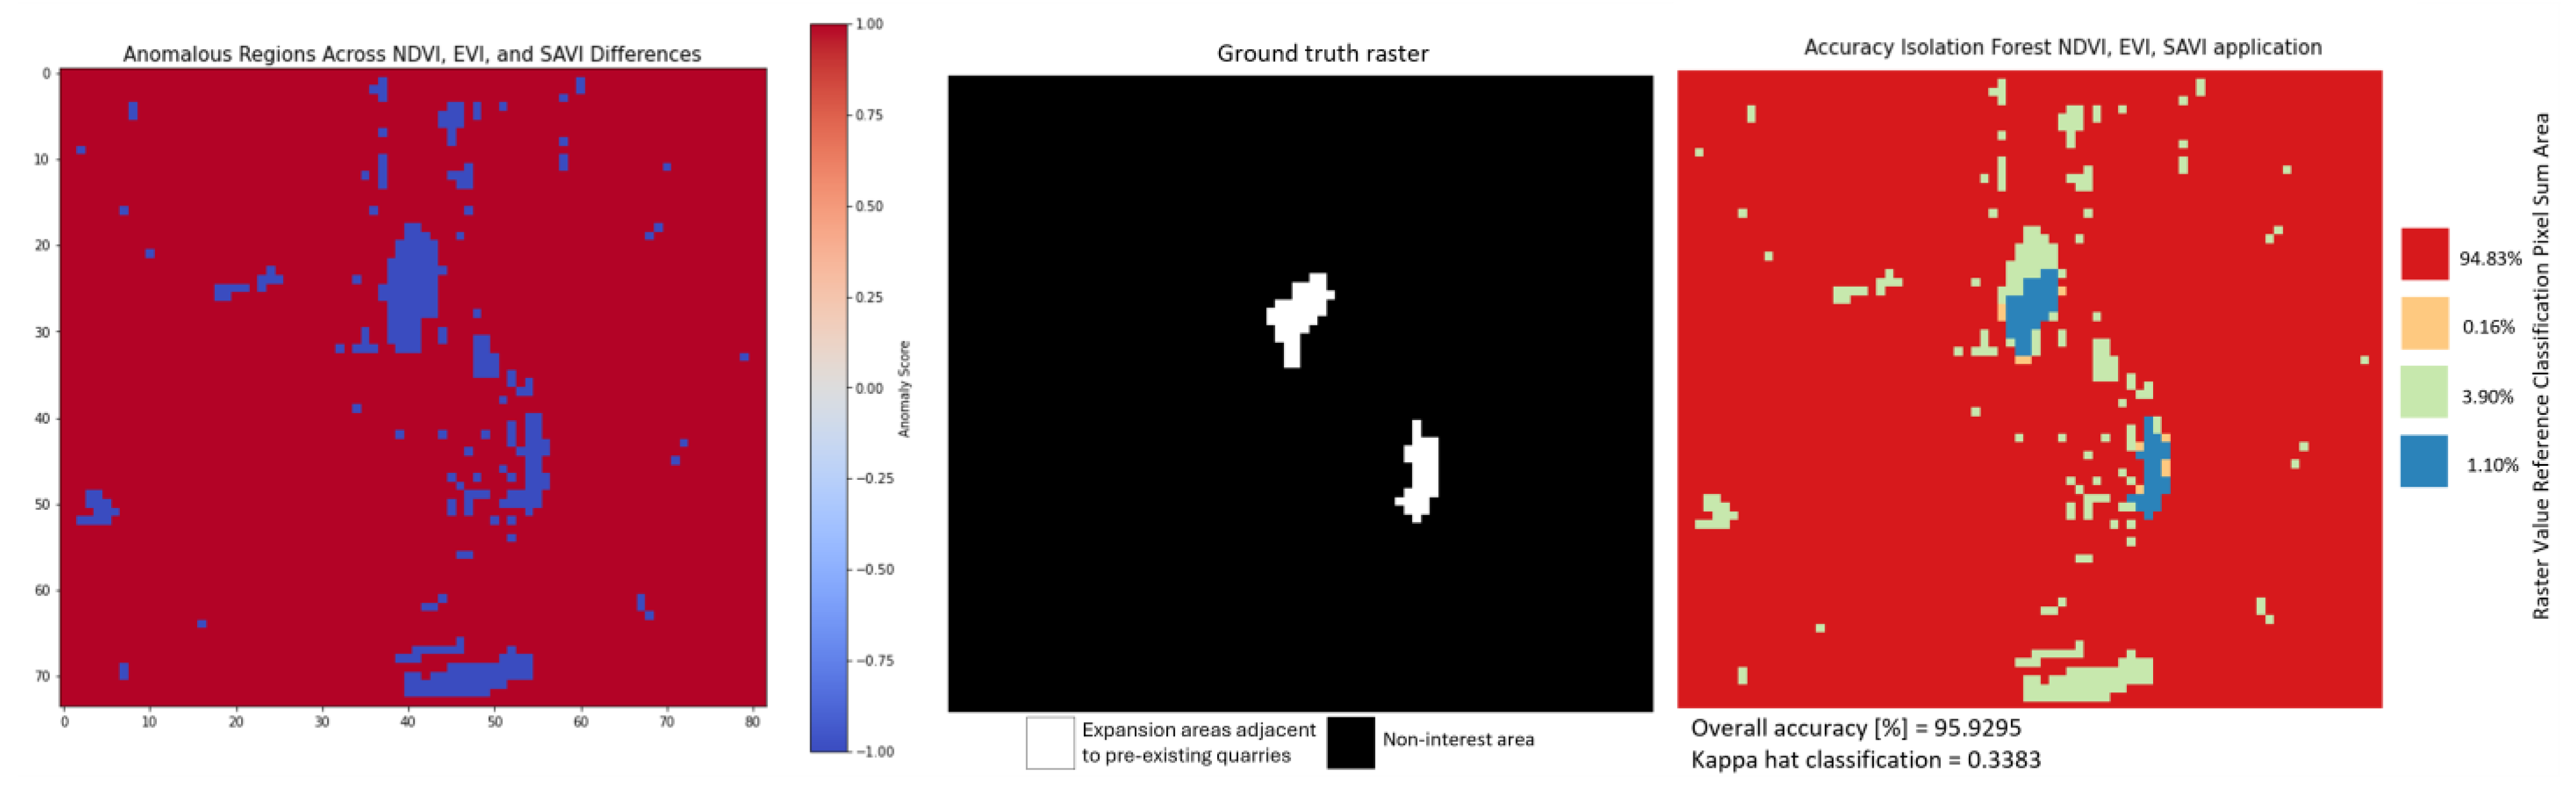
2.4. Accuracy Assessment

To evaluate the quality and accuracy of the classification map, accuracy assessment metrics have been used. The methodology is applied to compare the results with ground truth data acquired with field surveys and high-resolution aerial imagery (when available). The analysis includes the components error matrix, the accuracy metrics, and the area-based metrics. The error matrix compares classified pixels with reference data, and misclassification patterns are revealed through the identification of classification errors. The Accuracy Metrics include the Producer’s Accuracy (PA), the User’s Accuracy (UA), the Overall Accuracy (OA), and the Kappa coefficient [47,48,49]. The probability that a pixel is in a certain class and correctly classified is measured by the PA. The UA, on the other hand, indicates the correctness of a pixel classified in a specific class. The OA measures the total proportion of pixels correctly classified. The consistency of a categorized map’s reference data is gauged by the Kappa Valuta coefficient. Standard error (SE) and confidence interval (CI) are two examples of area-based metrics that can be used to evaluate the accuracy of area-level classification [50]. Furthermore, ROC curve analysis has been performed to evaluate the classification performance, with the resulting Area Under the Curve (AUC) providing a measure of the model’s ability to distinguish between classes [51].

3. Results

The results are presented in the order of data processing steps. First, data from the Umbra Forest case study are discussed, followed by those from the quarry site case study. The final section outlines the calculation of S-2 Data Index differences and applies the IForest algorithm and the statistical calculations.

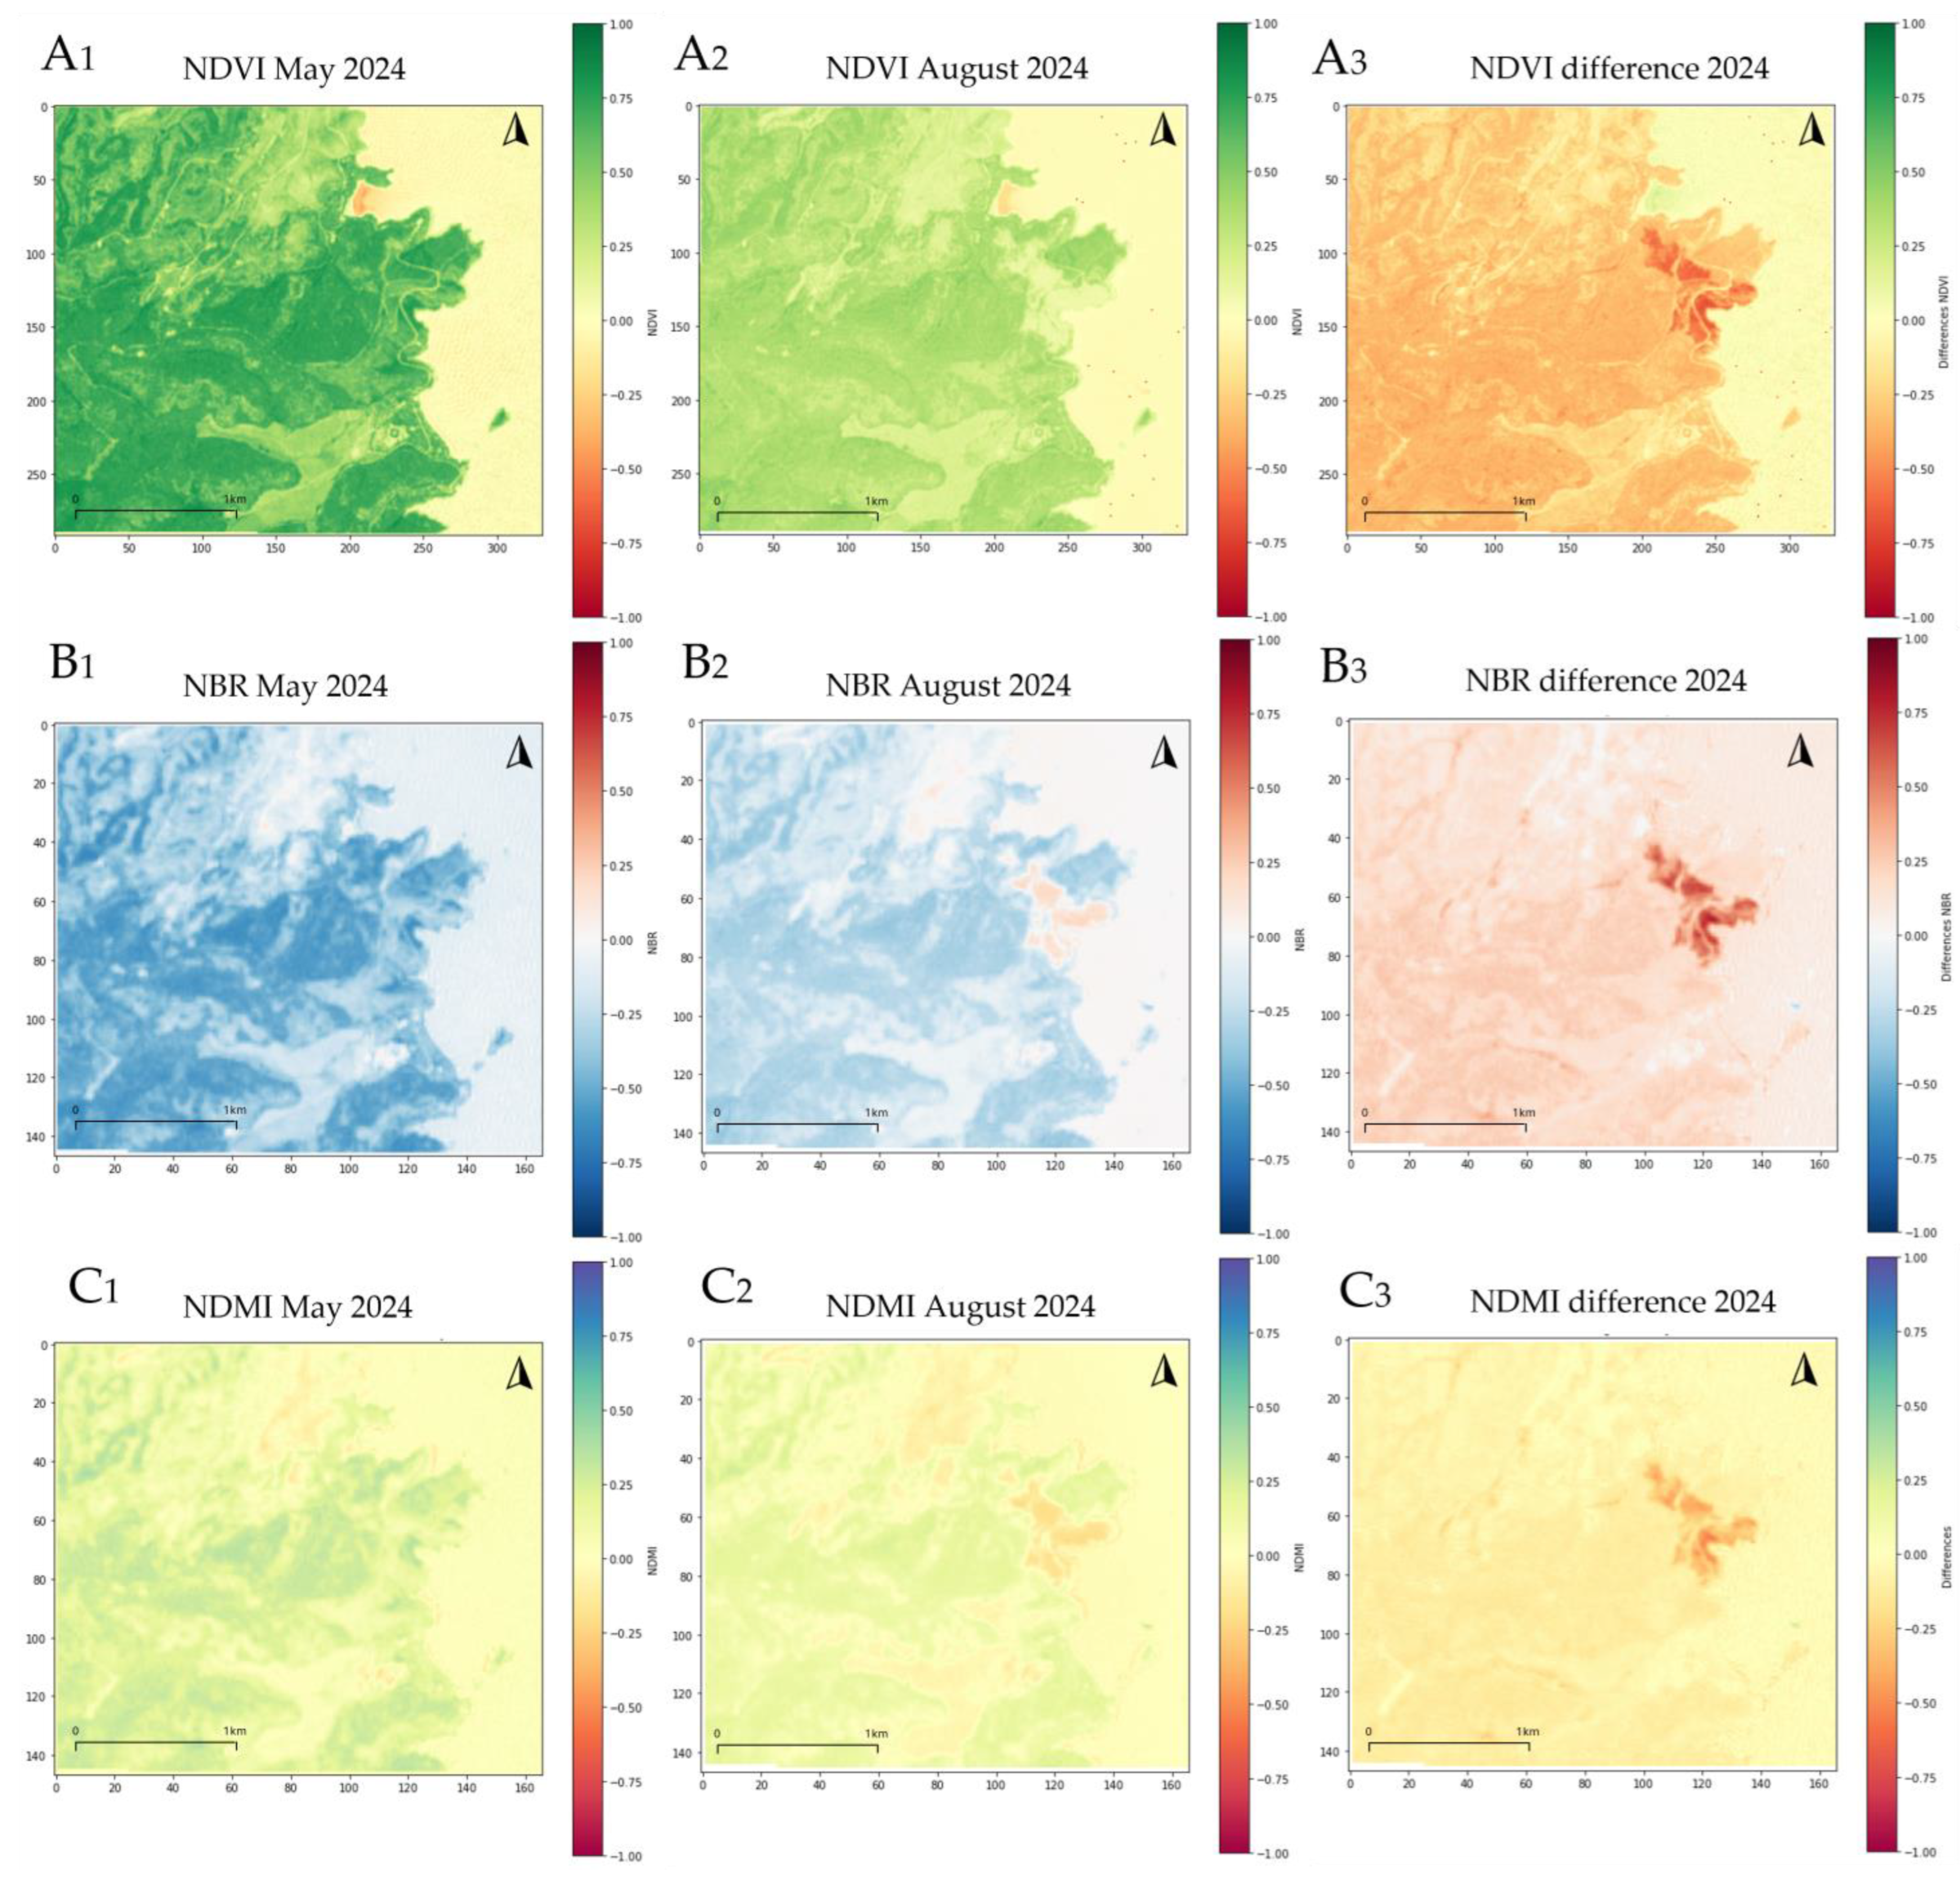
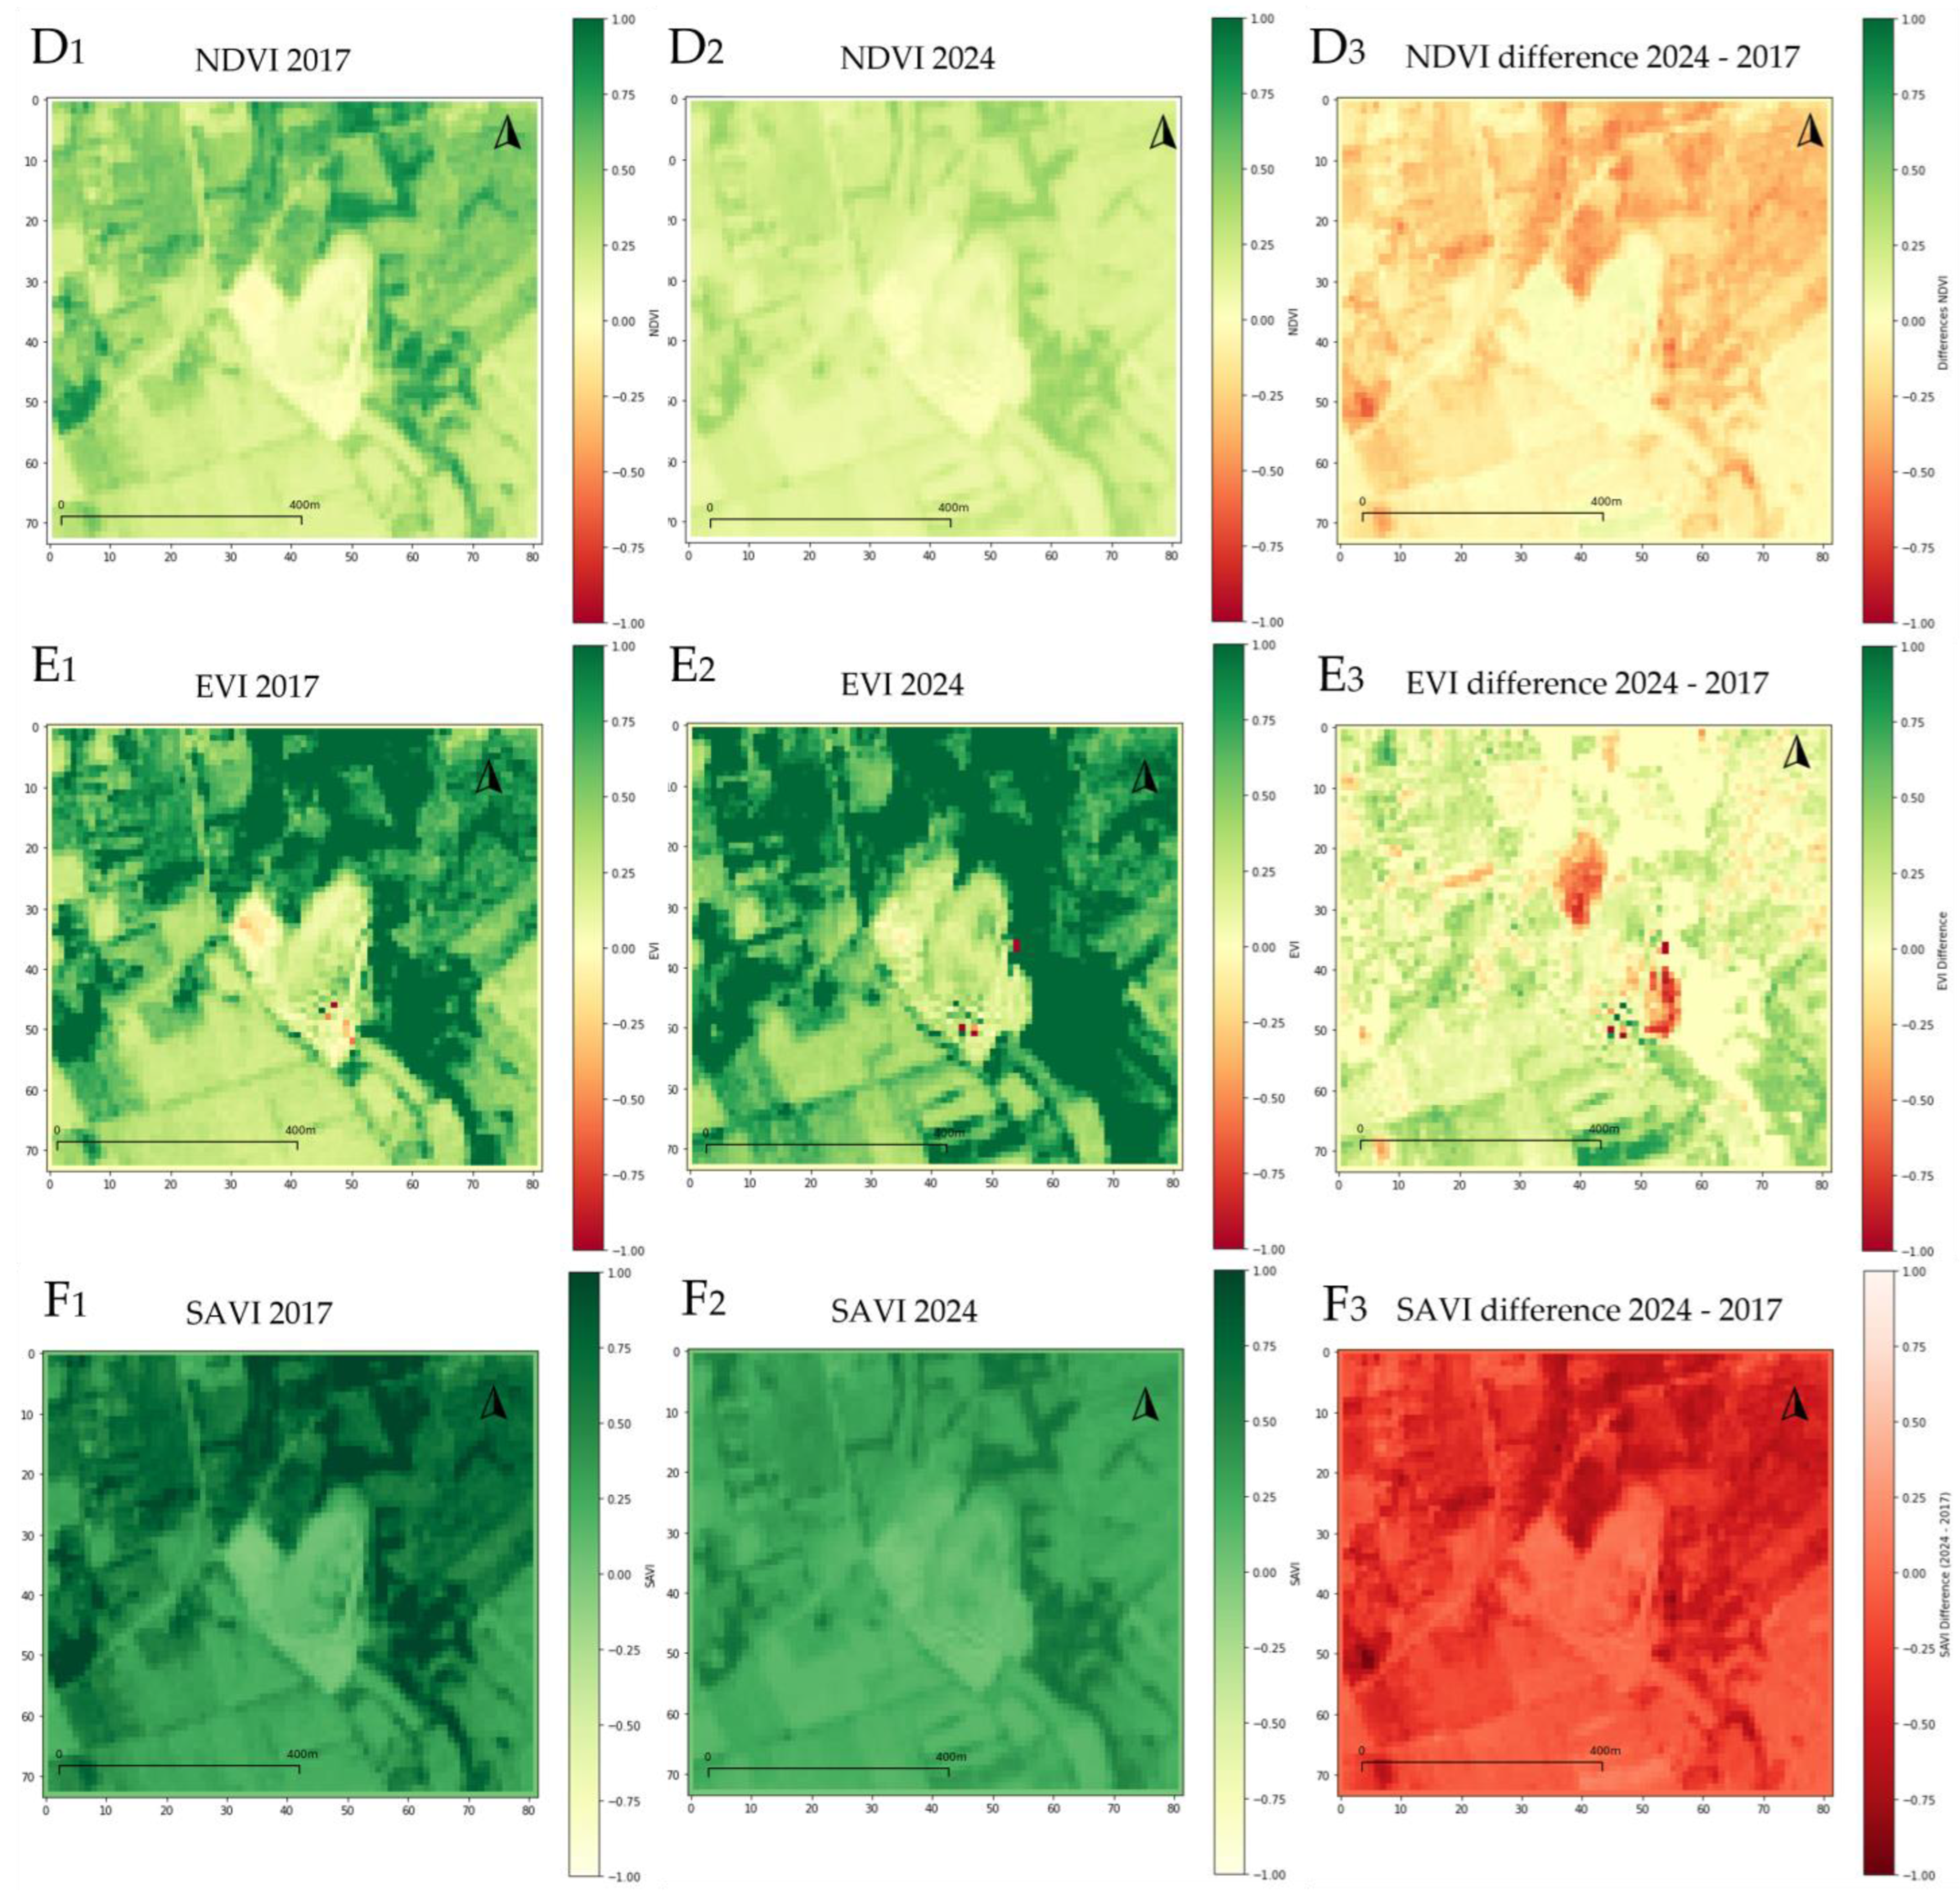
3.1. Sentinel-2 Data Index Differences Calculation

In wildfire study cases, spectral indices were analyzed over key seasonal intervals (May before the fire and August after the event): the NDVI and the NBR (Figure 3). In May, NDVI values indicated high vegetation health and photosynthetic activity across the forest, reflected by pervasive green coloration. By August, NDVI showed a general reduction in vegetation health, with a distinct zone displaying a marked decrease in photosynthetic activity, indicated by light yellow tones. This diminution aligns with the deciduous composition of the forest, exhibiting seasonal summer vegetation reductions. NDVI difference images reveal a red zone signifying vegetation loss. The NBR index, used to assess burn severity, highlights burned areas within the August NBR, with different images further indicating a consistent burned region along the coast. The NDMI index in August reveals a distinct red signature, indicating low moisture levels. The clear contrast in the difference image and the previously analyzed index confirms this anomaly.
In the quarry case study, three spectral indices were analyzed: NDVI, EVI and SAVI (Figure 4). A comparison of the 2024 and 2017 images with all the indices reveals two areas at the top of the center and right at the bottom of the quarry, highlighting a reduction in vegetation health and photosynthetic activity. The EVI index further accentuates these zones, with red tones signifying sparse or absent vegetation. The NDVI and SAVI indices were less sensitive to these changes.

3.2. Isolation Forest Differences Index Application

The unsupervised anomaly detection IForest algorithm, applied to various spectral indices in both study cases, enabled the identification of environmental issues. To ensure reproducibility, a random state of 42 was used. In contrast, different random states yielded minimal variations in anomaly distribution. The contamination parameter was systematically tested at three levels: 10%, 5%, and 2.5%. The analysis was performed on Sentinel-2 bands with a spatial resolution of 10 m per pixel, ensuring a fine-scale detection of anomalies.
In the wildfire study case (Figure 5), the application of the algorithm is affected by seasonal variations, especially for the higher level of contamination, but the wildfire area is always recognizable. The different chosen indices allow us to identify different aspects of the ground, specifically the vegetation health state with NDVI, the burn area with NBR, and the moisture level with NDMI. The best recognition with all the indices is with the 2.5% contamination because the area is composed of trees and there are no elements of disturbance. The NBR index was the most effective for fire identification, but the other two indices also demonstrated strong anomaly detection capabilities. Using multiple indexes allows us to exclude index-specific errors and biases. The use of the IForest with multiple indexes allows the minimization of individual errors, making common anomalies prevail. The anomaly detection process is performed on a combined dataset, where each pixel is represented as a feature vector composed of multiple spectral indices. This ensures that anomalies are detected based on their spectral behavior across multiple indices rather than individual variations.
With the calculation of the isolation forest for all the selected indices (NDVI, NBR, NDMI), the area identified is very clear (Figure 6). The combined analysis with the true fire footprint provides good accuracy. The overall accuracy is 98% with a producer’s accuracy and user’s accuracy of 99% of high precision in detecting unburned areas. For the recognizing burned areas, the PA is 82% and the UA 74%. The kappa hat value is 0.7768, which represents a good but not perfect agreement between classification and reality. The estimated unburned areas are 9445.1 m2, and the burned areas are 220.1 m2. The NDVI, NDMI, and NBR-based Isolation Forest model is accurate in identifying burned areas but overestimates the extent of the burnt area.
The application, as applied, can detect areas of at least one pixel in size, so the minimum detectable area is 100 m2. The analysis considers aggregate areas, that is clusters of pixels. To identify a fire, the effective spatial resolution must consider a minimum threshold of contiguous pixels for the identification of a burned area, at least four contiguous pixels. This brings the minimum resolution of the method to 400 m2.
The model’s performance was additionally validated by the ROC curve analysis, which resulted in an AUC (Area Under the Curve) value of 0.9070. This high AUC value underscores the model’s strong ability to distinguish between burned and unburned areas. The ROC analysis confirms that the model is highly effective in minimizing false positives while maximizing true positives (Table 2).
In the quarry study case (Figure 7), the IForest was applied to NDVI, EVI, and SAVI. The different chosen index allows us to identify various aspects at the ground, specifically the vegetation health state, to recognize the expansion areas adjacent to pre-existing quarries. The best recognition of all the indices is the 5% contamination. The EVI index was the most effective for the application.
The IForest analysis delineated areas with significant changes in NDVI, EVI, and SAVI (Figure 8). The combined analysis with the true fire footprint provides good accuracy equal to 95.93%. The kappa hat value is 0.34 indicates a moderate agreement between the model and the ground truth, but it is not particularly strong and suggests limitations in discrimination between certain classes. First, for the Producer’s Accuracy, the model performed well for class 0 with 96.04%, while its performance for class 1 was slightly lower at 87.01%. Second, the User’s Accuracy, the model exhibited a marked difference between the two classes 0 had a very high UA of 99.83%, while class 1 had a significantly lower UA of 22.04%.
To further evaluate the model’s performance, the ROC curve analysis was conducted, yielding an AUC value of 0.8096. This AUC value indicates that the model has an 80.96% probability of correctly distinguishing between areas with significant changes and areas without changes. The moderate kappa hat value and the AUC suggest a complexity of the terrain or the slight differences in vegetation health captured by the indices (Table 2).

4. Discussion

The methodology to identify the post-fire area in the Umbra Forest, utilizing the Isolation Forest algorithm applied to the differences in NDVI, NBR, and NDMI indices between August and May, produced promising results. High overall accuracy and relatively high kappa indicate good correspondence with the ground truth, with high accuracy in identifying non-fire areas but low accuracy for the underrated fire class. The difference in the index approach allows for the effective identification of fire areas on a hectare scale. A good correlation with the ground truth shows that these indices, particularly NBR and NDMI, are sensitive to post-fire changes. The analysis is facilitated by a high biomass presence in the area, being a forest. The change in soil properties and biomass is easily recognized. However, some burnt areas have been misclassified, probably due to natural seasonal variations or input errors.
Other studies use Sentinel-2 and other satellite images combined with machine learning algorithms, such as Random Forest, to accurately map burnt areas, fire severity, and post-fire recovery [22]. The Random Forest algorithm is widely applied to classify both wildfire and controlled burn severity, enhancing automated classification [52] and model predictions [53]. The unsupervised nature of the IForest algorithm mitigates biases inherent in imbalanced fire and no-fire datasets. This limitation is common in supervised approaches. However, its outlier-based detection mechanism may underperform in delineating fire-affected areas compared to RF, which leverages class probability outputs to better discriminate fire severity gradients. Spectral indices like dNBR and dNDVI are particularly effective when datasets are well-balanced and properly calibrated, as demonstrated in case studies from Patagonia and the Mediterranean [54,55]. Additionally, fire-prone areas in South American forests have been identified using multitemporal images from Landsat-8 and MODIS sensors [56,57].
The analysis of NDVI, EVI, and SAVI is useful for estimating quarry expansion generated mediocre accuracy and a low Kappa coefficient. The results are considerably worse than in the fire case. There are considerable difficulties in identifying the expansion of the quarry. NDVI, EVI, and SAVI are useful for detecting changes in vegetation and are less suitable for discriminating areas with bare soil. There are several soil indices, such as the Bare Soil Index (BSI), with specific spectral characteristics for rock identification. The latter utilizes band n. 11, decreasing the resolution of the image to 20 m, losing details. The small size of the quarry and the vegetation around the extraction site has led to the choice of analysis on vegetation indices, preferring them to soil indices.
The monitoring of mining activities is a field of research in continuous development. The choice of methodologies and algorithms depends strongly on the type of quarry, the environment, and the specific objectives of the study. Landsat 9, with a spatial resolution ranging from 10 to 100 m, is particularly suitable for long-term analysis, as demonstrated by a study on Burkina Faso, which assessed the mining impact from 1990 to 2022 [58]. By contrast, high-resolution commercial satellites such as Ikonos (spatial panchromatic resolution of 1 m), QuickBird (spatial resolution of about 65 cm), and WorldView offer finer details, ideal for spot evaluations and high-frequency monitoring [28]. The combination of spectral indices CBI (C-band Backscattering Index), BRBA (Blue-Red Band Ratio), and BAEI (Blue-Atmospheric Resistance Index) with Sentinel-2 multi-time analysis and ML algorithms for small-scale mining detection has been explored [59]. Convolutional neural networks (CNNs) and Support vector machines (SVMs), have proven their effectiveness in the detection and classification of mining activities, even on a small scale [60,61]. Specific studies have applied the maximum likelihood algorithm (MLC) to determine soil cover classes in marble quarries [27]. Other research has utilized SVM to distinguish between landfills and coal mines.
The use of open-source software, while requiring conscientious evaluation of available data, offers a cost-effective and efficient alternative for analyzing large volumes of satellite data [62]. Choosing datasets should be guided by the desired spatial resolution and the specific objectives of the study. In some articles about large-scale monitoring, the IForest algorithm was consistently and accurately presented [63,64]. These include crop monitoring in China using Landsat 8 and Sentinel-2 data. Image fusion and crop monitoring at different latitudes can be improved by using multispectral data. In the other case, anomalies are detected at the level of the agricultural parcel using a combination of SAR and multispectral data. The versatility of the algorithm has made it an ideal option for our purposes.
A comprehensive assessment of environmental issue detection requires a balanced analysis of both strengths and limitations. The main advantages include the accessibility of Sentinel-2 data and the use of open-source software, which facilitates broad applicability. The model is highly responsive to well-established vegetation monitoring indices, and the Isolation Forest algorithm effectively handles multidimensional datasets. However, certain limitations exist: the method relies only on the 10 m resolution Sentinel-2 bands, which may be insufficient for detecting small-scale anomalies. Additionally, it does not account for gradual transitions between classes, and seasonal or meteorological variations can introduce errors.
An automated pipeline for the detection of environmental anomalies could be established in the proposed methodology to quickly identify changes in land cover. This approach significantly reduces latency compared to traditional monitoring methods. The IForest algorithm ensures computational efficiency due to its low complexity, facilitating scalable anomaly detection across large datasets. Integration with cloud-based platforms further extends the methodology’s applicability to regional or national scales. To enhance robustness, a continuous monitoring system can be implemented, performing periodic automated analyses upon the ingestion of new imagery and enabling near real-time anomaly identification.
From an ecological perspective, identifying post-fire areas is crucial for assessing vegetation recovery and prioritizing reforestation efforts, while in mining areas, it helps evaluate impacts on sensitive habitats and biodiversity. From a management standpoint, this approach supports fire prevention planning and monitoring in the first case, while in the second, it aids in implementing environmental restoration plans and ensuring regulatory compliance.

5. Conclusions and Future Directions

This study shows how high-resolution data can improve environmental monitoring and support sustainable land management, which is essential for healthy ecosystems. The use of Sentinel-2 images, spectral indices, and algorithms such as Isolation Forest has allowed us to obtain high-precision results, with accuracies of 98% in the identification of areas affected by fires and 95% in the expansion of quarries. The automated anomaly detection framework offers a scalable, low-latency solution for monitoring land cover changes, supported by cloud-based integration and continuous analysis. However, some limitations emerge, such as the use of limited-resolution Sentinel-2 bands and the impact of seasonal and meteorological conditions on the collected data. From an ecological point of view, this approach allows us to identify priority areas for post-fire recovery interventions and to evaluate the impacts on sensitive habitats in contexts of extractive activities. From a management point of view, it offers practical tools to plan prevention interventions, monitor compliance with regulations, and develop environmental restoration plans, thus contributing to more informed and sustainable territorial policies.
Future research should prioritize a deeper understanding of land conditions to ensure its protection and long-term health, recognizing its fundamental role in ecosystem stability and resilience. A comprehensive approach should focus on integrating diverse analytical methods and data sources to assess soil land degradation, fertility, and overall ecological function. By leveraging a combination of geospatial analysis, field surveys, and advanced modeling techniques, it is possible to enhance the accuracy and reliability of soil health assessments.
Long-term environmental monitoring is essential for detecting changes in soil quality, identifying risk factors, and implementing targeted conservation strategies. The integration of satellite-based observations, such as those from Landsat missions (NASA/USGS Program) and hyperspectral data from PRISMA (Italian Space Agency) and EnMAP (German Aerospace Center), provides valuable support for substrate health assessments by enabling large-scale and time-series analyses. These sensors offer critical insights into vegetation dynamics, land cover changes, and composition variations, enhancing the detection of degradation patterns and enabling proactive soil conservation measures. Advances in analytical methodologies, including high-resolution spectral analysis and machine learning-based classification, can further improve the ability to detect subtle changes in soil ground properties. The combination of satellite imagery, field measurements, and advanced computational techniques will strengthen environmental assessments, providing crucial insights for land management, agricultural sustainability, and ecosystem conservation.

Author Contributions

Conceptualization, M.S.B. and C.M.; methodology, M.S.B.; validation, M.S.B. and C.M.; formal analysis, M.S.B. and C.M.; investigation, M.S.B.; resources, C.M. and V.F.U.; data curation, M.S.B. and C.M.; writing—original draft preparation, M.S.B.; writing—review and editing, M.S.B., C.M. and V.F.U.; visualization, M.S.B., C.M. and V.F.U.; supervision, C.M.; project administration, V.F.U.; funding acquisition, V.F.U. All authors have read and agreed to the published version of the manuscript.

Funding

This research received no external funding.

Data Availability Statement

Data is contained within the article.

Conflicts of Interest

The authors declare no conflicts of interest. The funders had no role in the design of the study, in the collection, analyses, or interpretation of data, in the writing of the manuscript, or in the decision to publish the results.

References

  1. Massarelli, C.; Galeone, C.; Savino, I.; Campanale, C.; Uricchio, V.F. Towards sustainable management of mussel farming through high-resolution images and open source software—The taranto case study. Remote Sens. 2021, 13, 2985. [Google Scholar] [CrossRef]
  2. Bruno, M.F.; Saponieri, A.; Molfetta, M.G.; Damiani, L. The DPSIR Approach for Coastal Risk Assessment under Climate Change at Regional Scale: The Case of Apulian Coast (Italy). J. Mar. Sci. Eng. 2020, 8, 531. [Google Scholar] [CrossRef]
  3. Ntona, M.M.; Busico, G.; Mastrocicco, M.; Kazakis, N. Coupling SWAT and DPSIR models for groundwater management in Mediterranean catchments. J. Environ. Manag. 2023, 344, 118543. [Google Scholar] [CrossRef] [PubMed]
  4. Labianca, C.; De Gisi, S.; Todaro, F.; Notarnicola, M. DPSIR Model Applied to the Remediation of Contaminated Sites. A Case Study: Mar Piccolo of Taranto. Appl. Sci. 2020, 10, 5080. [Google Scholar] [CrossRef]
  5. Spanò, M.; Gentile, F.; Davies, C.; Lafortezza, R. The DPSIR framework in support of green infrastructure planning: A case study in Southern Italy. Land Use Policy 2017, 61, 242–250. [Google Scholar] [CrossRef]
  6. Osman, K.T. Soil Resources and Soil Degradation. In Soils; Springer: Dordrecht, The Netherlands, 2013; pp. 175–213. [Google Scholar]
  7. Singh, R.L.; Singh, P.K. Global Environmental Problems. In Principles and Applications of Environmental Biotechnology for a Sustainable Future; Springer: Singapore, 2017; pp. 13–41. [Google Scholar]
  8. Rathod, S.V. Eco-Restoration of Polluted Environment; CRC Press: Boca Raton, FL, USA, 2024; ISBN 9781003423393. [Google Scholar]
  9. Massarelli, C.; Losacco, D.; Tumolo, M.; Campanale, C.; Uricchio, V.F. Protection of Water Resources from Agriculture Pollution: An Integrated Methodological Approach for the Nitrates Directive 91/676/EEC Implementation. Int. J. Environ. Res. Public Health 2021, 18, 13323. [Google Scholar] [CrossRef]
  10. Zeng, Y.; Hao, D.; Huete, A.; Dechant, B.; Berry, J.; Chen, J.M.; Joiner, J.; Frankenberg, C.; Bond-Lamberty, B.; Ryu, Y.; et al. Optical vegetation indices for monitoring terrestrial ecosystems globally. Nat. Rev. Earth Environ. 2022, 3, 477–493. [Google Scholar] [CrossRef]
  11. Addabbo, P.; Focareta, M.; Marcuccio, S.; Votto, C.; Ullo, S.L. Contribution of Sentinel-2 data for applications in vegetation monitoring. Acta Imeko 2016, 5, 44. [Google Scholar] [CrossRef]
  12. Hino, M.; Benami, E.; Brooks, N. Machine learning for environmental monitoring. Nat. Sustain. 2018, 1, 583–588. [Google Scholar] [CrossRef]
  13. Khruschev, S.S.; Plyusnina, T.Y.; Antal, T.K.; Pogosyan, S.I.; Riznichenko, G.Y.; Rubin, A.B. Machine learning methods for assessing photosynthetic activity: Environmental monitoring applications. Biophys. Rev. 2022, 14, 821–842. [Google Scholar] [CrossRef]
  14. Nguyen, H.A.T.; Sophea, T.; Gheewala, S.H.; Rattanakom, R.; Areerob, T.; Prueksakorn, K. Integrating remote sensing and machine learning into environmental monitoring and assessment of land use change. Sustain. Prod. Consum. 2021, 27, 1239–1254. [Google Scholar] [CrossRef]
  15. Jesus, G.; Casimiro, A.; Oliveira, A. Using Machine Learning for Dependable Outlier Detection in Environmental Monitoring Systems. ACM Trans. Cyber-Phys. Syst. 2021, 5, 1–30. [Google Scholar] [CrossRef]
  16. Radočaj, D.; Obhođaš, J.; Jurišić, M.; Gašparović, M. Global Open Data Remote Sensing Satellite Missions for Land Monitoring and Conservation: A Review. Land 2020, 9, 402. [Google Scholar] [CrossRef]
  17. Zhong, S.; Zhang, K.; Bagheri, M.; Burken, J.G.; Gu, A.; Li, B.; Ma, X.; Marrone, B.L.; Ren, Z.J.; Schrier, J.; et al. Machine Learning: New Ideas and Tools in Environmental Science and Engineering. Environ. Sci. Technol. 2021, 55, 12741–12754. [Google Scholar] [CrossRef]
  18. Binetti, M.S.; Campanale, C.; Uricchio, V.F.; Massarelli, C. In-Depth Monitoring of Anthropic Activities in the Puglia Region: What Is the Acceptable Compromise between Economic Activities and Environmental Protection? Sustainability 2023, 15, 8875. [Google Scholar] [CrossRef]
  19. Ustin, S.L.; Middleton, E.M. Current and Near-Term Earth-Observing Environmental Satellites, Their Missions, Characteristics, Instruments, and Applications. Sensors 2024, 24, 3488. [Google Scholar] [CrossRef] [PubMed]
  20. Ndehedehe, C. Satellite Remote Sensing of Terrestrial Hydrology; Springer International Publishing: Cham, Switzerland, 2022; ISBN 978-3-030-99576-8. [Google Scholar]
  21. Meng, R.; Zhao, F. Remote Sensing of Fire Effects. In Remote Sensing of Hydrometeorological Hazards; CRC Press: Boca Raton, FL, USA; Taylor & Francis: Abingdon, UK, 2017; pp. 261–283. [Google Scholar]
  22. Kurbanov, E.; Vorobev, O.; Lezhnin, S.; Sha, J.; Wang, J.; Li, X.; Cole, J.; Dergunov, D.; Wang, Y. Remote Sensing of Forest Burnt Area, Burn Severity, and Post-Fire Recovery: A Review. Remote Sens. 2022, 14, 4714. [Google Scholar] [CrossRef]
  23. Massarelli, C. Fast detection of significantly transformed areas due to illegal waste burial with a procedure applicable to Landsat images. Int. J. Remote Sens. 2018, 39, 754–769. [Google Scholar] [CrossRef]
  24. Vaverková, M.D.; Maxianová, A.; Winkler, J.; Adamcová, D.; Podlasek, A. Environmental consequences and the role of illegal waste dumps and their impact on land degradation. Land Use Policy 2019, 89, 104234. [Google Scholar] [CrossRef]
  25. Iravanian, A.; Ravari, S.O. Types of Contamination in Landfills and Effects on The Environment: A Review Study. IOP Conf. Ser. Earth Environ. Sci. 2020, 614, 012083. [Google Scholar] [CrossRef]
  26. Binetti, M.S.; Massarelli, C.; Uricchio, V.F. Machine Learning in Geosciences: A Review of Complex Environmental Monitoring Applications. Mach. Learn. Knowl. Extr. 2024, 6, 1263–1280. [Google Scholar] [CrossRef]
  27. Tercan, E.; Dereli, M. Monitoring of marble quarries expansion and land cover changes using satellite images and GIS on a rural settlement of Burdur province, Turkey. El-Cezeri Fen Ve Mühendislik Derg. 2021, 8, 741–750. [Google Scholar] [CrossRef]
  28. Nikolakopoulos, K.G.; Tsombos, P.I.; Vaiopoulos, A.D. Monitoring a Quarry Using High Resolution Data and GIS Techniques; Michel, U., Civco, D.L., Eds.; SPIE: Bellingham, WA, USA, 2010; p. 78310R. [Google Scholar]
  29. Parise, M.; Pascali, V. Surface and subsurface environmental degradation in the karst of Apulia (southern Italy). Environ. Geol. 2003, 44, 247–256. [Google Scholar] [CrossRef]
  30. Bosellini, A. Outline of the Geology of Italy. In World Geomorphological Landscapes; Springer: Cham, Switzerland, 2017; pp. 21–27. [Google Scholar] [CrossRef]
  31. Biondi, E.; Casavecchia, S.; Guerra, V.; Medagli, P.; Beccarisi, L.; Zuccarello, V. A contribution towards the knowledge of semideciduous and evergreen woods of Apulia (south-eastern Italy). Fitosociologia 2004, 41, 3–28. [Google Scholar]
  32. Sentinel-2|Copernicus Data Space Ecosystem. Available online: https://dataspace.copernicus.eu/explore-data/data-collections/sentinel-data/sentinel-2 (accessed on 19 March 2025).
  33. Spoto, F.; Sy, O.; Laberinti, P.; Martimort, P.; Fernandez, V.; Colin, O.; Hoersch, B.; Meygret, A. Overview of sentinel-2. In Proceedings of the 2012 IEEE International Geoscience and Remote Sensing Symposium, Munich, Germany, 22–27 July 2012; pp. 1707–1710. [Google Scholar] [CrossRef]
  34. Copernicus Data Space Ecosystem|Europe’s Eyes on Earth. Available online: https://dataspace.copernicus.eu/ (accessed on 4 November 2024).
  35. Tichouiti, K. NVDI- and NBR-based Comparison for Burnt Areas Characterization Using Sentinel-2 Imagery. In Proceedings of the 2024 IEEE Mediterranean and Middle-East Geoscience and Remote Sensing Symposium (M2GARSS), Oran, Algeria, 15–17 April 2024; pp. 187–190. [Google Scholar] [CrossRef]
  36. Bitek, D.; Erenoğlu, R.C. Forest Fire Analysis with Sentinel-2 Satellite Imagery: The Case of Mati (Greece) in 2018. Acad. Platf. J. Nat. Hazards Disaster Manag. 2022, 3, 85–98. [Google Scholar] [CrossRef]
  37. D’Odorico, P.; Gonsamo, A.; Damm, A.; Schaepman, M.E. Experimental evaluation of sentinel-2 spectral response functions for NDVI time-series continuity. IEEE Trans. Geosci. Remote Sens. 2013, 51, 1336–1348. [Google Scholar] [CrossRef]
  38. Alcaras, E.; Costantino, D.; Guastaferro, F.; Parente, C.; Pepe, M. Normalized Burn Ratio Plus (NBR+): A New Index for Sentinel-2 Imagery. Remote Sens. 2022, 14, 1727. [Google Scholar] [CrossRef]
  39. Cruz-Sanabria, H.; Sanchez, M.G.; Rivera-Caicedo, J.P.; Avila-George, H. Identification of phenological stages of sugarcane cultivation using Sentinel-2 images. In Proceedings of the 2020 9th International Conference on Software Process Improvement (CIMPS), Sinaloa, Mexico, 21–23 October 2020; IEEE: New York, NY, USA, 2020; pp. 110–116. [Google Scholar]
  40. Lee, S.-J.; Choi, C.; Kim, J.; Choi, M.; Cho, J.; Lee, Y. Estimation of High-Resolution Soil Moisture in Canadian Croplands Using Deep Neural Network with Sentinel-1 and Sentinel-2 Images. Remote Sens. 2023, 15, 4063. [Google Scholar] [CrossRef]
  41. Hunter, J.D. Matplotlib: A 2D Graphics Environment. Comput. Sci. Eng. 2007, 9, 90–95. [Google Scholar] [CrossRef]
  42. Harris, C.R.; Millman, K.J.; van der Walt, S.J.; Gommers, R.; Virtanen, P.; Cournapeau, D.; Wieser, E.; Taylor, J.; Berg, S.; Smith, N.J.; et al. Array programming with NumPy. Nature 2020, 585, 357–362. [Google Scholar] [CrossRef]
  43. Fabian, P. Scikit-learn: Machine Learning in Python. J. Mach. Learn. Res. 2011, 12, 2825–2830. [Google Scholar]
  44. Introducing Rasterio|Sean Gillies. Available online: https://sgillies.net/2013/11/24/introducing-rasterio.html (accessed on 25 March 2025).
  45. Liu, F.T.; Ting, K.M.; Zhou, Z.H. Isolation forest. In Proceedings of the 2008 Eighth IEEE International Conference on Data Mining, Pisa, Italy, 15–19 December 2008; pp. 413–422. [Google Scholar] [CrossRef]
  46. Liu, F.T.; Ting, K.M.; Zhou, Z.H. Isolation-Based Anomaly Detection. ACM Trans. Knowl. Discov. Data 2012, 6, 3. [Google Scholar] [CrossRef]
  47. Foody, G.M. Explaining the unsuitability of the kappa coefficient in the assessment and comparison of the accuracy of thematic maps obtained by image classification. Remote Sens. Environ. 2020, 239, 111630. [Google Scholar] [CrossRef]
  48. Sari, I.L.; Weston, C.J.; Newnham, G.J.; Volkova, L. Estimating land cover map accuracy and area uncertainty using a confusion matrix: A case study in Kalimantan, Indonesia. IOP Conf. Ser. Earth Environ. Sci. 2021, 914, 012025. [Google Scholar] [CrossRef]
  49. Ariza-Lopez, F.J.; Rodriguez-Avi, J.; Alba-Fernandez, M.V. Complete Control of an Observed Confusion Matrix. In Proceedings of the IGARSS 2018—2018 IEEE International Geoscience and Remote Sensing Symposium, Valencia, Spain, 22–27 July 2018; IEEE: New York, NY, USA, 2018; pp. 1222–1225. [Google Scholar]
  50. Massarelli, C.; Matarrese, R.; Uricchio, V.F.; Muolo, M.R.; Laterza, M.; Ernesto, L. Detection of asbestos-containing materials in agro-ecosystem by the use of airborne hyperspectral CASI-1500 sensor including the limited use of two UAVs equipped with RGB cameras. Int. J. Remote Sens. 2016, 38, 2135–2149. [Google Scholar] [CrossRef]
  51. Çorbacıoğlu, Ş.K.; Aksel, G. Receiver operating characteristic curve analysis in diagnostic accuracy studies: A guide to interpreting the area under the curve value. Turkish J. Emerg. Med. 2023, 23, 195–198. [Google Scholar] [CrossRef]
  52. Gibson, R.; Danaher, T.; Hehir, W.; Collins, L. A remote sensing approach to mapping fire severity in south-eastern Australia using sentinel 2 and random forest. Remote Sens. Environ. 2020, 240, 111702. [Google Scholar] [CrossRef]
  53. Collins, L.; McCarthy, G.; Mellor, A.; Newell, G.; Smith, L. Training data requirements for fire severity mapping using Landsat imagery and random forest. Remote Sens. Environ. 2020, 245, 111839. [Google Scholar] [CrossRef]
  54. Saulino, L.; Rita, A.; Migliozzi, A.; Maffei, C.; Allevato, E.; Garonna, A.P.; Saracino, A. Detecting Burn Severity across Mediterranean Forest Types by Coupling Medium-Spatial Resolution Satellite Imagery and Field Data. Remote Sens. 2020, 12, 741. [Google Scholar] [CrossRef]
  55. Franco, M.G.; Mundo, I.A.; Veblen, T.T. Field-Validated Burn-Severity Mapping in North Patagonian Forests. Remote Sens. 2020, 12, 214. [Google Scholar] [CrossRef]
  56. Morante-Carballo, F.; Bravo-Montero, L.; Carrión-Mero, P.; Velastegui-Montoya, A.; Berrezueta, E. Forest Fire Assessment Using Remote Sensing to Support the Development of an Action Plan Proposal in Ecuador. Remote Sens. 2022, 14, 1783. [Google Scholar] [CrossRef]
  57. Luz, A.E.O.; Negri, R.G.; Massi, K.G.; Colnago, M.; Silva, E.A.; Casaca, W. Mapping Fire Susceptibility in the Brazilian Amazon Forests Using Multitemporal Remote Sensing and Time-Varying Unsupervised Anomaly Detection. Remote Sens. 2022, 14, 2429. [Google Scholar] [CrossRef]
  58. Himmy, O.; Nguyen, T.T.; Hemmler, K.S.; Loulad, S.; Rhinane, H.; Buerkert, A. Leveraging machine learning and Landsat time series for high-resolution mapping of mining-induced vegetation changes in Ouagadougou, Burkina Faso. Environ. Chall. 2024, 17, 101026. [Google Scholar] [CrossRef]
  59. Michałowska, K.; Pirowski, T.; Głowienka, E.; Szypuła, B.; Malinverni, E.S. Sustainable Monitoring of Mining Activities: Decision-Making Model Using Spectral Indexes. Remote Sens. 2024, 16, 388. [Google Scholar] [CrossRef]
  60. Gallwey, J.; Robiati, C.; Coggan, J.; Vogt, D.; Eyre, M. A Sentinel-2 based multispectral convolutional neural network for detecting artisanal small-scale mining in Ghana: Applying deep learning to shallow mining. Remote Sens. Environ. 2020, 248, 111970. [Google Scholar] [CrossRef]
  61. Mukherjee, J.; Mukherjee, J.; Chakravarty, D. Detection of Coal Quarry and Coal Dump Regions Using the Presence of Mine Water Bodies from Landsat 8 OLI/TIRS Images. In Communications in Computer and Information Science; Springer: Cham, Switzerland, 2023; Volume 1777 CCIS, pp. 190–204. [Google Scholar]
  62. Massarelli, C.; Uricchio, V.F. The Contribution of Open Source Software in Identifying Environmental Crimes Caused by Illicit Waste Management in Urban Areas. Urban Sci. 2024, 8, 21. [Google Scholar] [CrossRef]
  63. Mouret, F.; Albughdadi, M.; Duthoit, S.; Kouamé, D.; Rieu, G.; Tourneret, J.Y. Outlier Detection at the Parcel-Level in Wheat and Rapeseed Crops Using Multispectral and SAR Time Series. Remote Sens. 2021, 13, 956. [Google Scholar] [CrossRef]
  64. Zhang, H.; Zhang, Y.; Gao, T.; Lan, S.; Tong, F.; Li, M. Landsat 8 and Sentinel-2 Fused Dataset for High Spatial-Temporal Resolution Monitoring of Farmland in China’s Diverse Latitudes. Remote Sens. 2023, 15, 2951. [Google Scholar] [CrossRef]
Figure 1. The study area is in the Apulia region (south Italy), with two case studies: the northern Umbra Forest (in red; extents: 596690.0,600000.0,4629190.0,4632110.0 (EPSG:32633)) and the southern mining site (in yellow; extents: 791140.0,791960.0,4436460.0,4437200.0 (EPSG:32633)).
Environments 12 00116 g001
Figure 2. Methodological framework for anomalous crop development detection.
Environments 12 00116 g002
Figure 3. NDVI, NBR, and NDMI analysis for forest wildfire assessment using Sentinel-2 imagery at key seasonal intervals. (A1C1) show index values for May, respectively; (A2C2) display for August. (A3C3) show the difference calculations between August and May for each index, highlighting seasonal changes and wildfire impacts. NDVI uses the “RdYlGn” colormap (green: healthy vegetation, red: vegetation loss); NBR applies “RdBu_r” (red: burned areas, blue: unaffected); NDMI uses “Spectral” (blue: high moisture, red: low moisture).
Environments 12 00116 g003
Figure 4. NDVI, EVI, and SAVI analysis for quarry morphologic identification using Sentinel-2 imagery in seven-year intervals. (D1F1) show NDVI, EVI, and SAVI values for May, respectively; (D2F2) display NDVI, EVI, and SAVI for August. (D3F3) show the difference calculations between 2024 and 2017 for each index, highlighting year-change impacts. NDVI and EVI use the “RdYlGn” colormap (green: healthy/dense vegetation, red: vegetation loss/sparse); SAVI uses green tones for 2017–2018 and red tones for differences.
Environments 12 00116 g004
Figure 5. Evaluating the Isolation Forest anomaly detection for identifying anomalous changes in time-series spectral indices (NDVI, NBR, and NDMI, respectively A-, B-, and C-) under varying levels of noise contamination (10%, 5%, and 2.5%, respectively -5, -6, and -7), using a “RdBu” colormap (blue: anomalies). The analysis will be conducted with a fixed random state to ensure reproducibility. These single-index results provide comparative baseline but were superseded by multidimensional analysis in Figure 6.
Environments 12 00116 g005
Figure 6. Evaluating the performance of IForest in detecting wildfire-affected areas using a confusion matrix and Kappa coefficient, comparing the detected anomalies to ground truth wildfire data.
Environments 12 00116 g006
Figure 7. Evaluating the Isolation Forest (IForest) anomaly detection for identifying anomalous changes in time-series spectral indices (NDVI, EVI, SAVI, respectively, E-, F-, and G-) under varying levels of noise contamination (10%, 5%, and 2.5%, respectively, -5, -6, and -7). The analysis will be conducted with a fixed random state to ensure reproducibility. These single-index results provide comparative baseline but were superseded by multidimensional analysis in Figure 8.
Environments 12 00116 g007
Figure 8. Evaluating the performance of IForest in detecting expansion quarry areas using a confusion matrix and Kappa coefficient, comparing the detected anomalies to ground truth expansion quarry area.
Environments 12 00116 g008
Table 1. The multispectral indices used.
Study CaseSpectral IndicesSentinel-2 Band Formula
Wildfire study caseNormalized Difference Vegetation Index
Normalized Burn Ratio
Normalized Difference Moisture Index
N D V I = B 08 B 04 B 08 + B 04
N B R = B 12 B 8 A B 12 + B 8 A
N D M I = B 8 A B 11 B 8 A + B 11
Quarry study caseNormalized Difference Vegetation Index
Enhanced Vegetation Index
Soil Adjusted Vegetation Index
N D V I = B 08 B 04 B 08 + B 04
E V I = 2.5 B 08 B 04 B 08 + 6 B 04 7.5 B 02 + 1
S A V I = B 08 B 04 B 08 + B 04 + 0.428 1 + 0.428
Table 2. Summary table of evaluation metrics.
MetricsWildfire Study CaseQuarry Study Case
Overall Accuracy98%95%
Kappa Hat Value0.780.34
Producer’s Accuracy (PA)
Classe 099%96%
Classe 182%87%
User’s Accuracy (UA)
Classe 099%99%
Classe 174%22%
ROC AUC0.90700.8096
Disclaimer/Publisher’s Note: The statements, opinions and data contained in all publications are solely those of the individual author(s) and contributor(s) and not of MDPI and/or the editor(s). MDPI and/or the editor(s) disclaim responsibility for any injury to people or property resulting from any ideas, methods, instructions or products referred to in the content.

