


Subjective and Objective Measurement of Indoor Environmental Quality and Occupant Comfort in a Multinational Graduate Student Office

Abstract
1. Introduction
1.1. Literature Review and Research Question Formulation
1.2. Research Gaps
1.3. Policy Implication
2. Materials and Methods
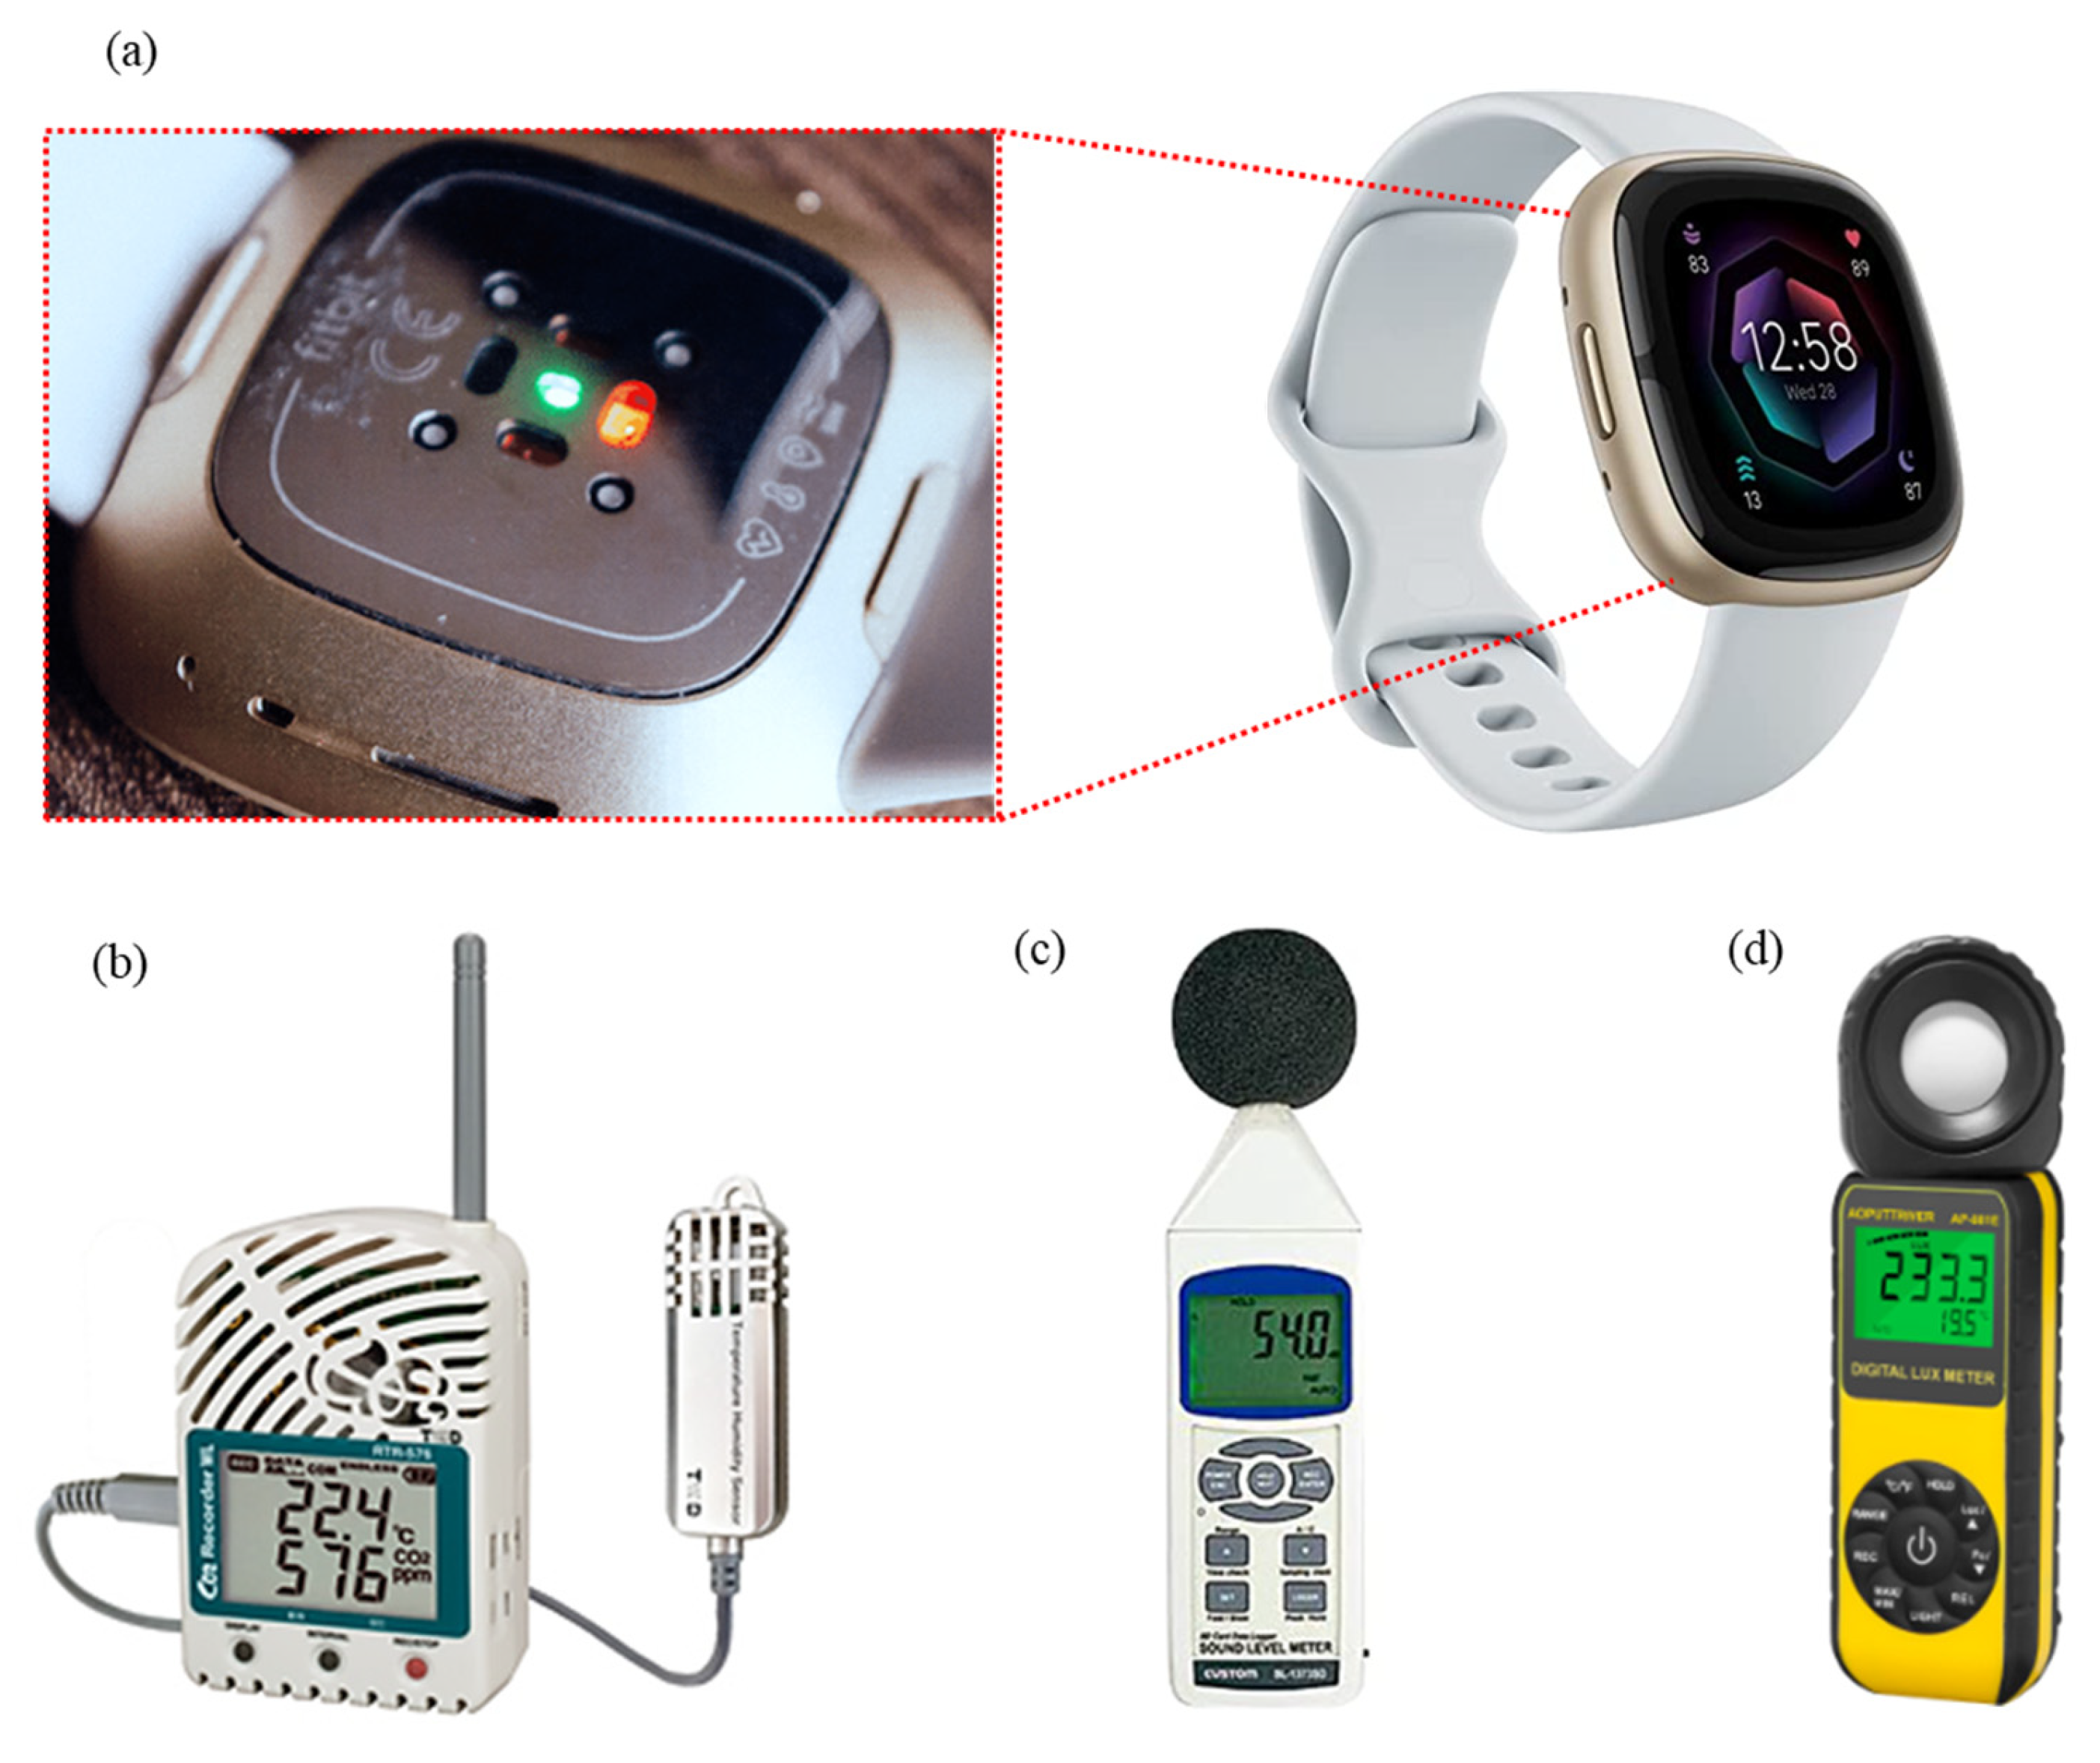
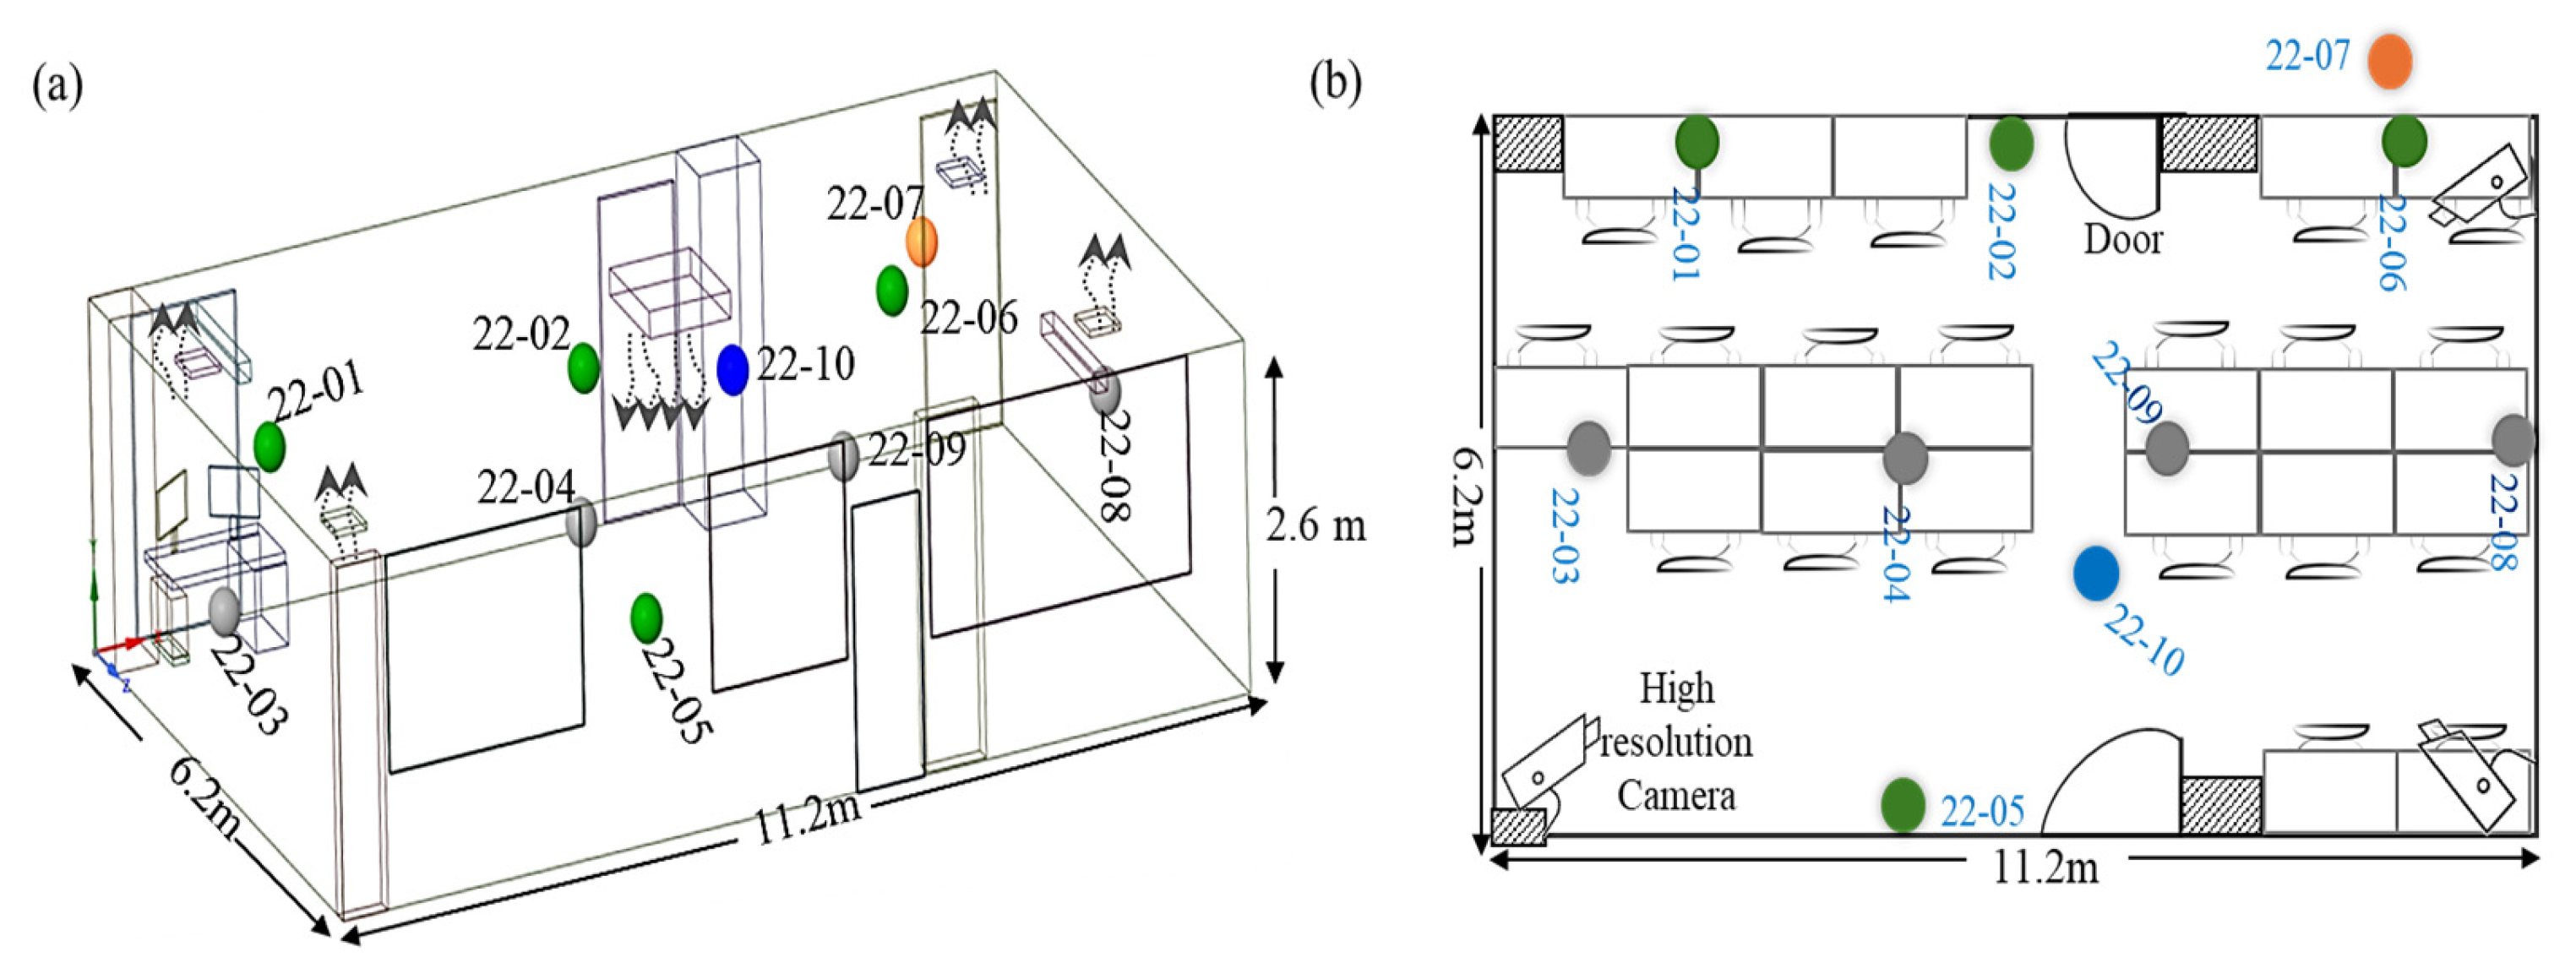
2.1. Objective Measurement: Study Set-Up Measures of CO2, Temperature and Relative Humidity
2.2. Subjective Measurement Assessment of Occupant Comfort
2.3. Geometric Mean
2.4. Variable Relationship with Overall Acceptance of IEQ
2.5. Heart Rate Variability
3. Results and Discussion
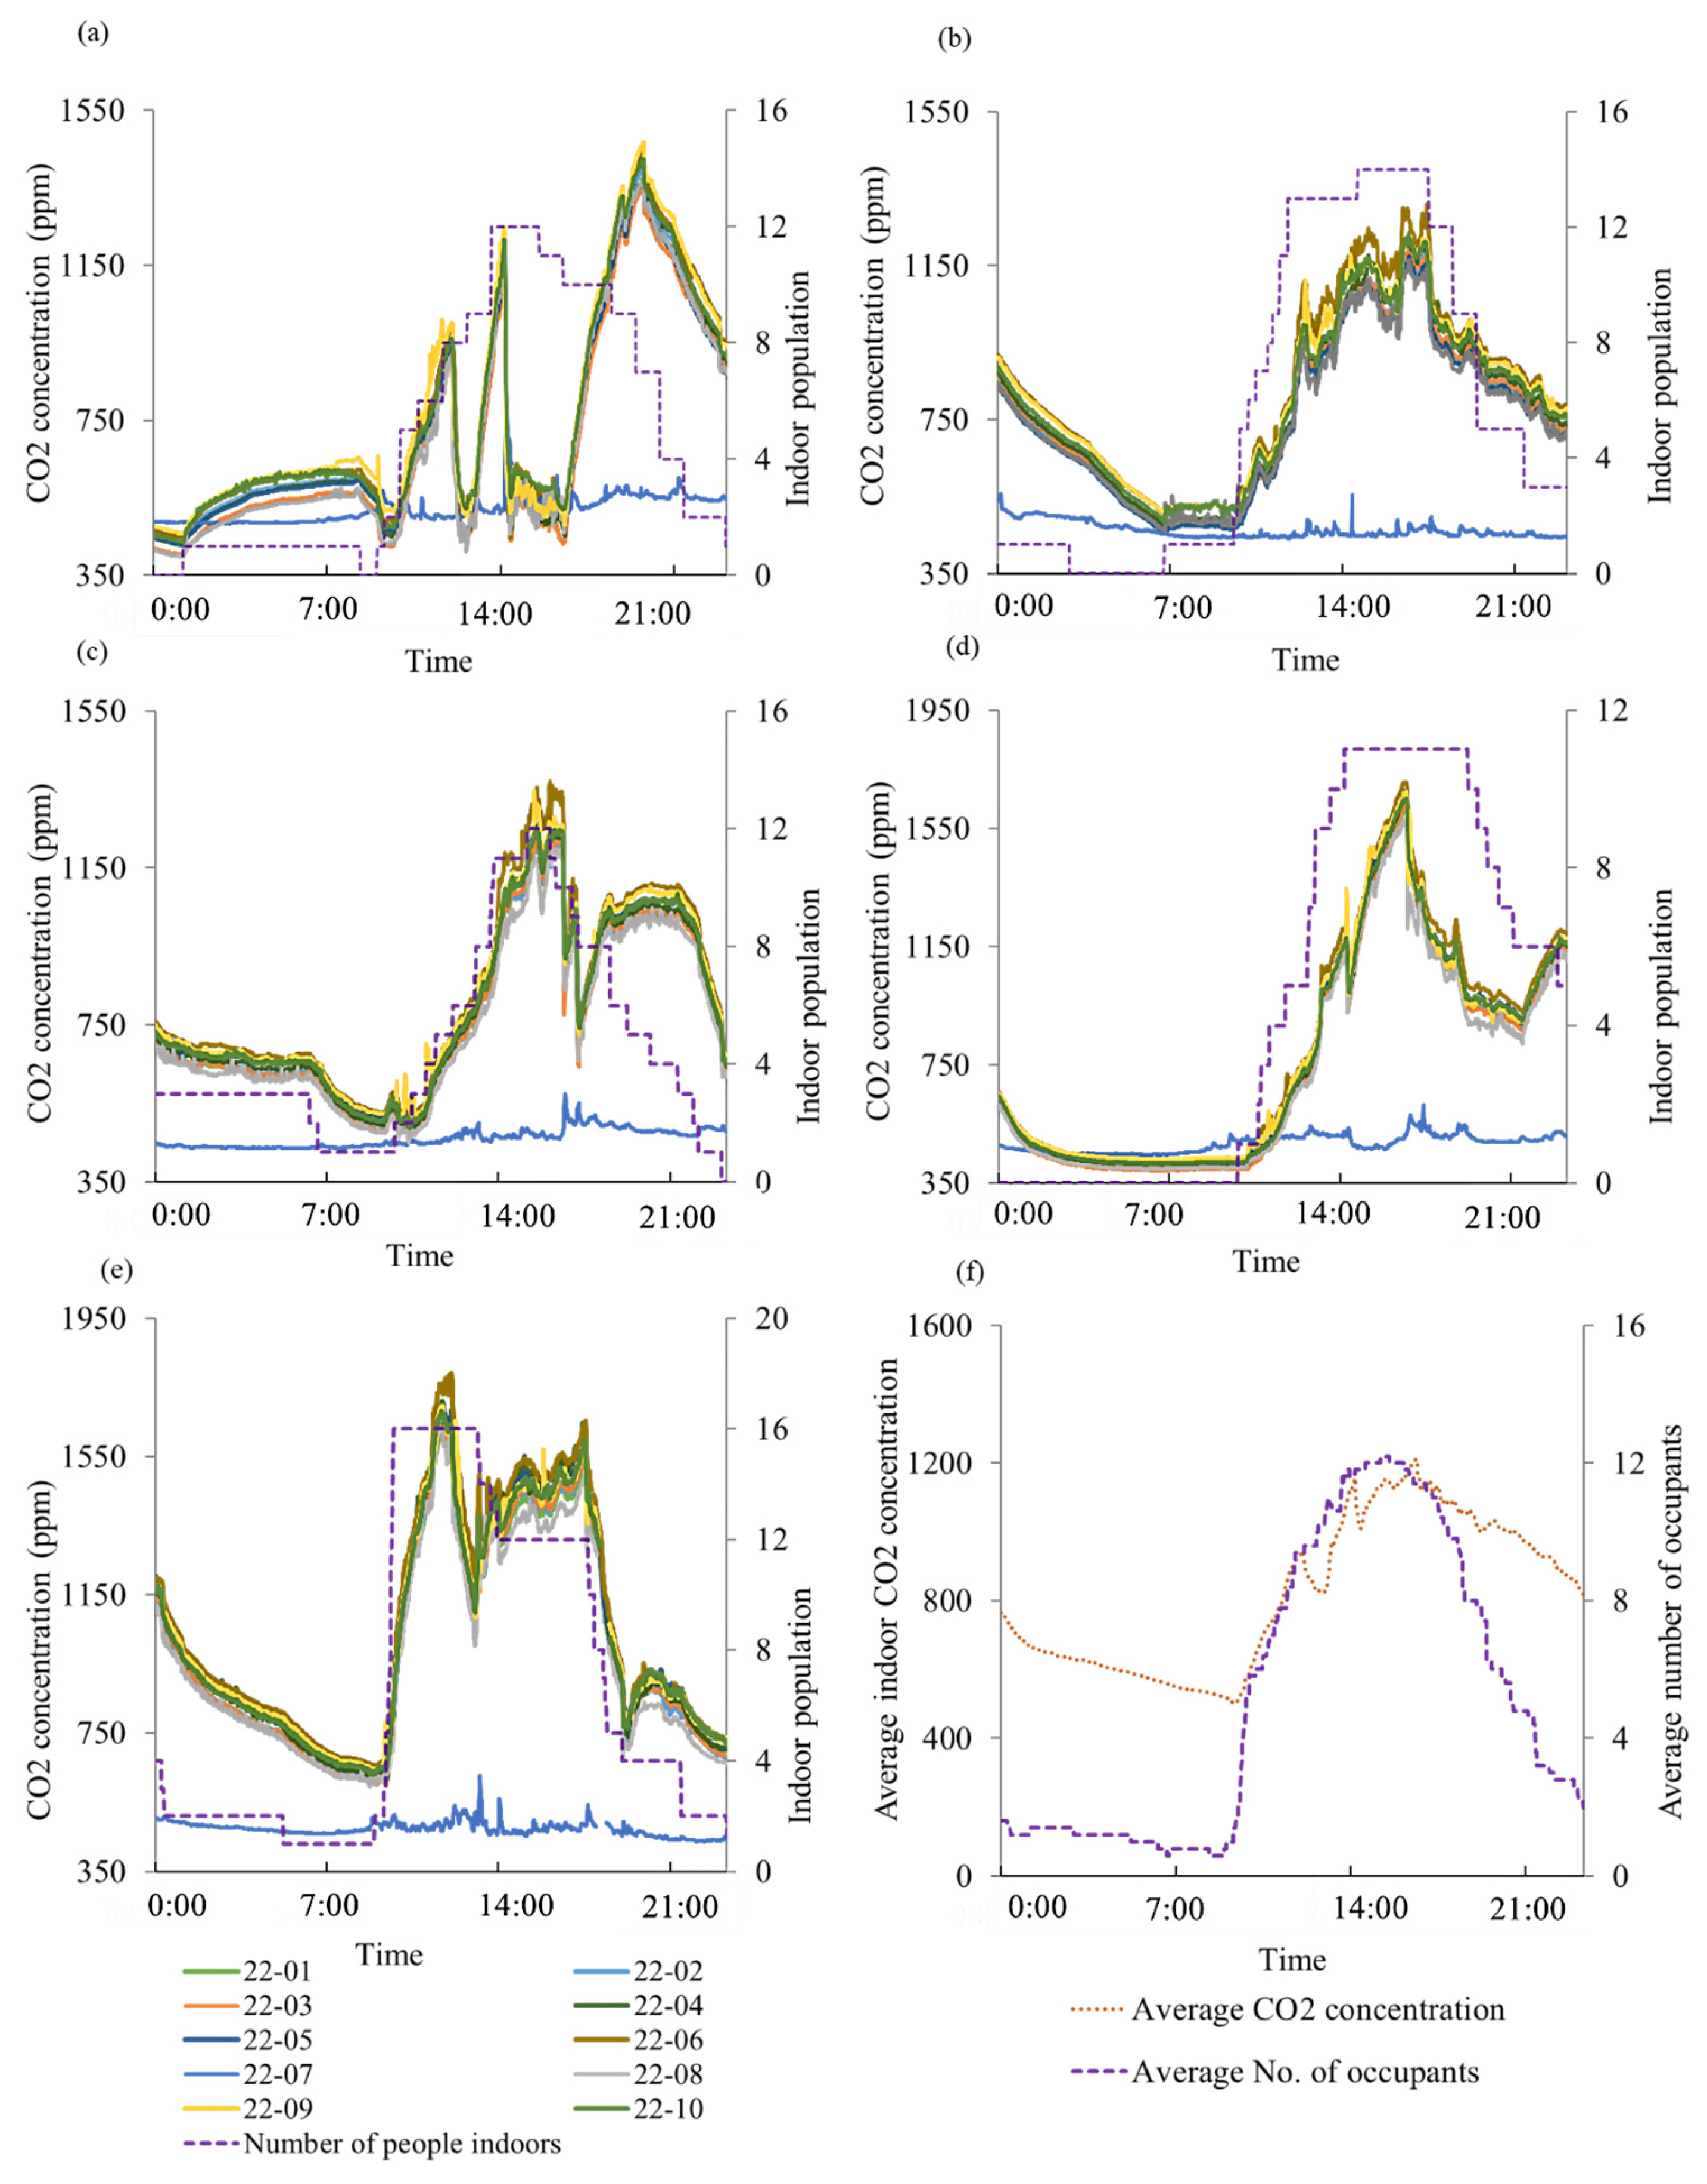
3.1. CO2 Concentration
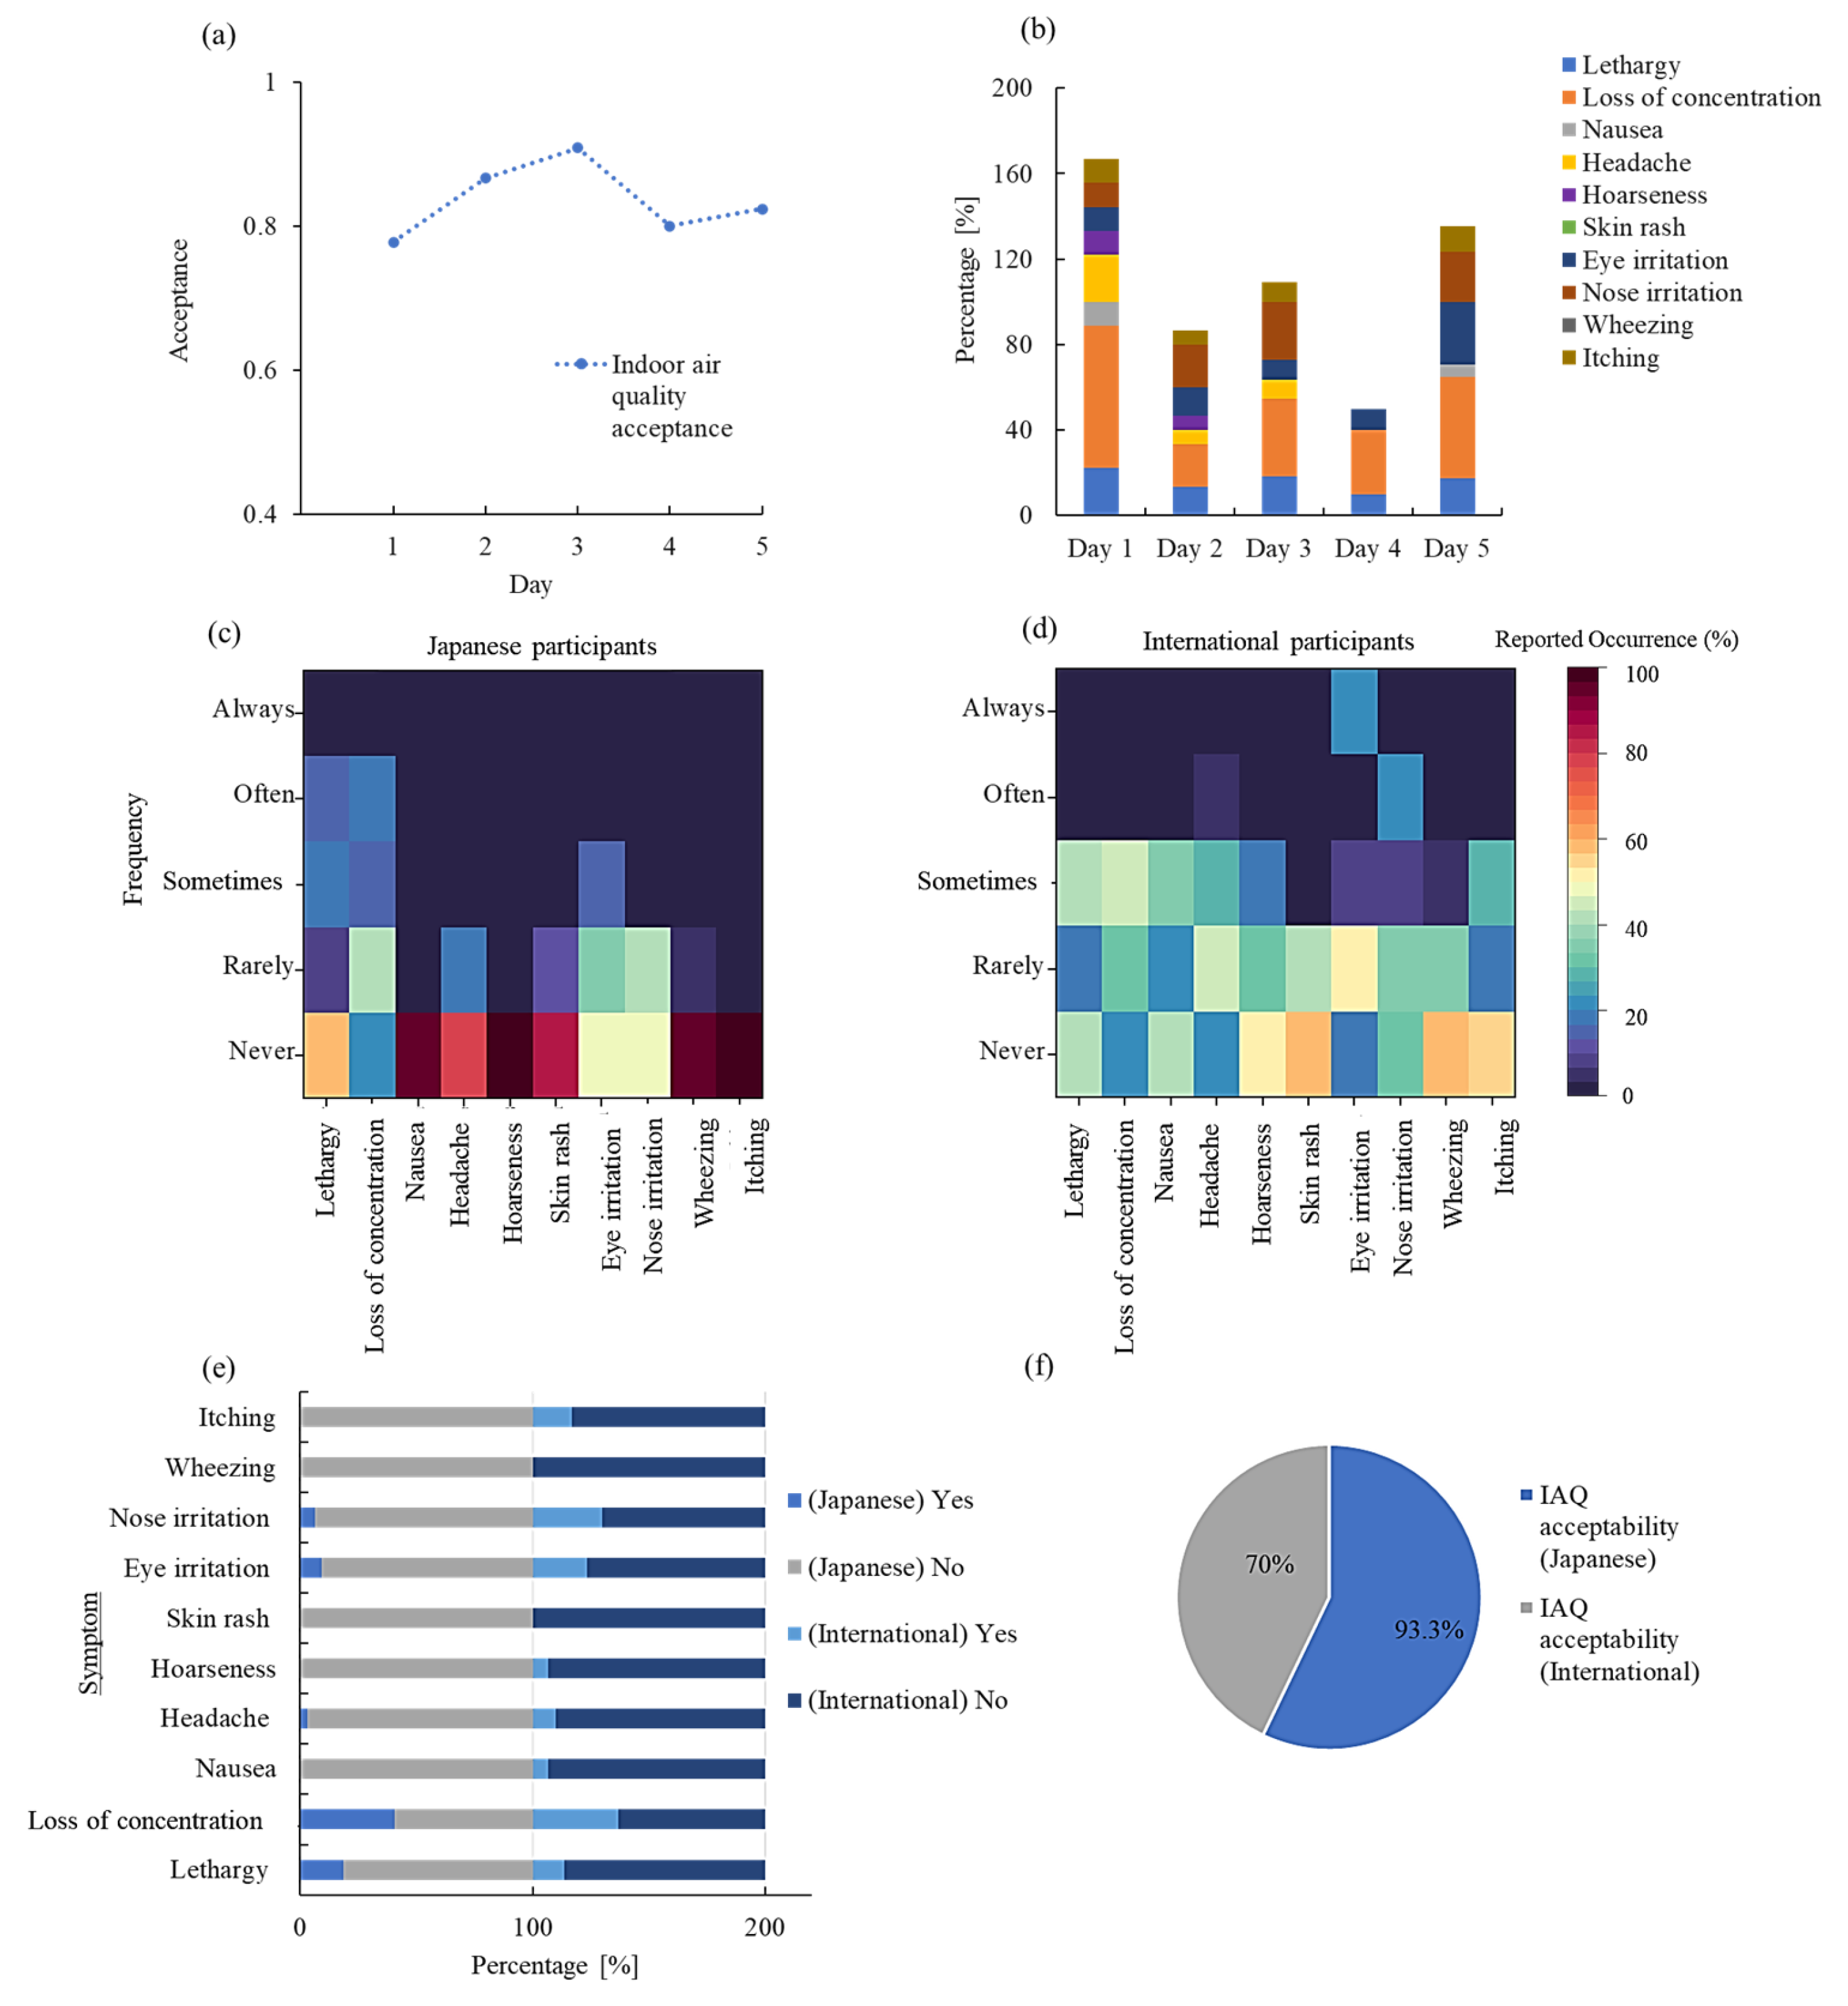
3.2. Indoor Air Quality (IAQ) Acceptance
3.3. Indoor Environment Conditions: Relative Humidity
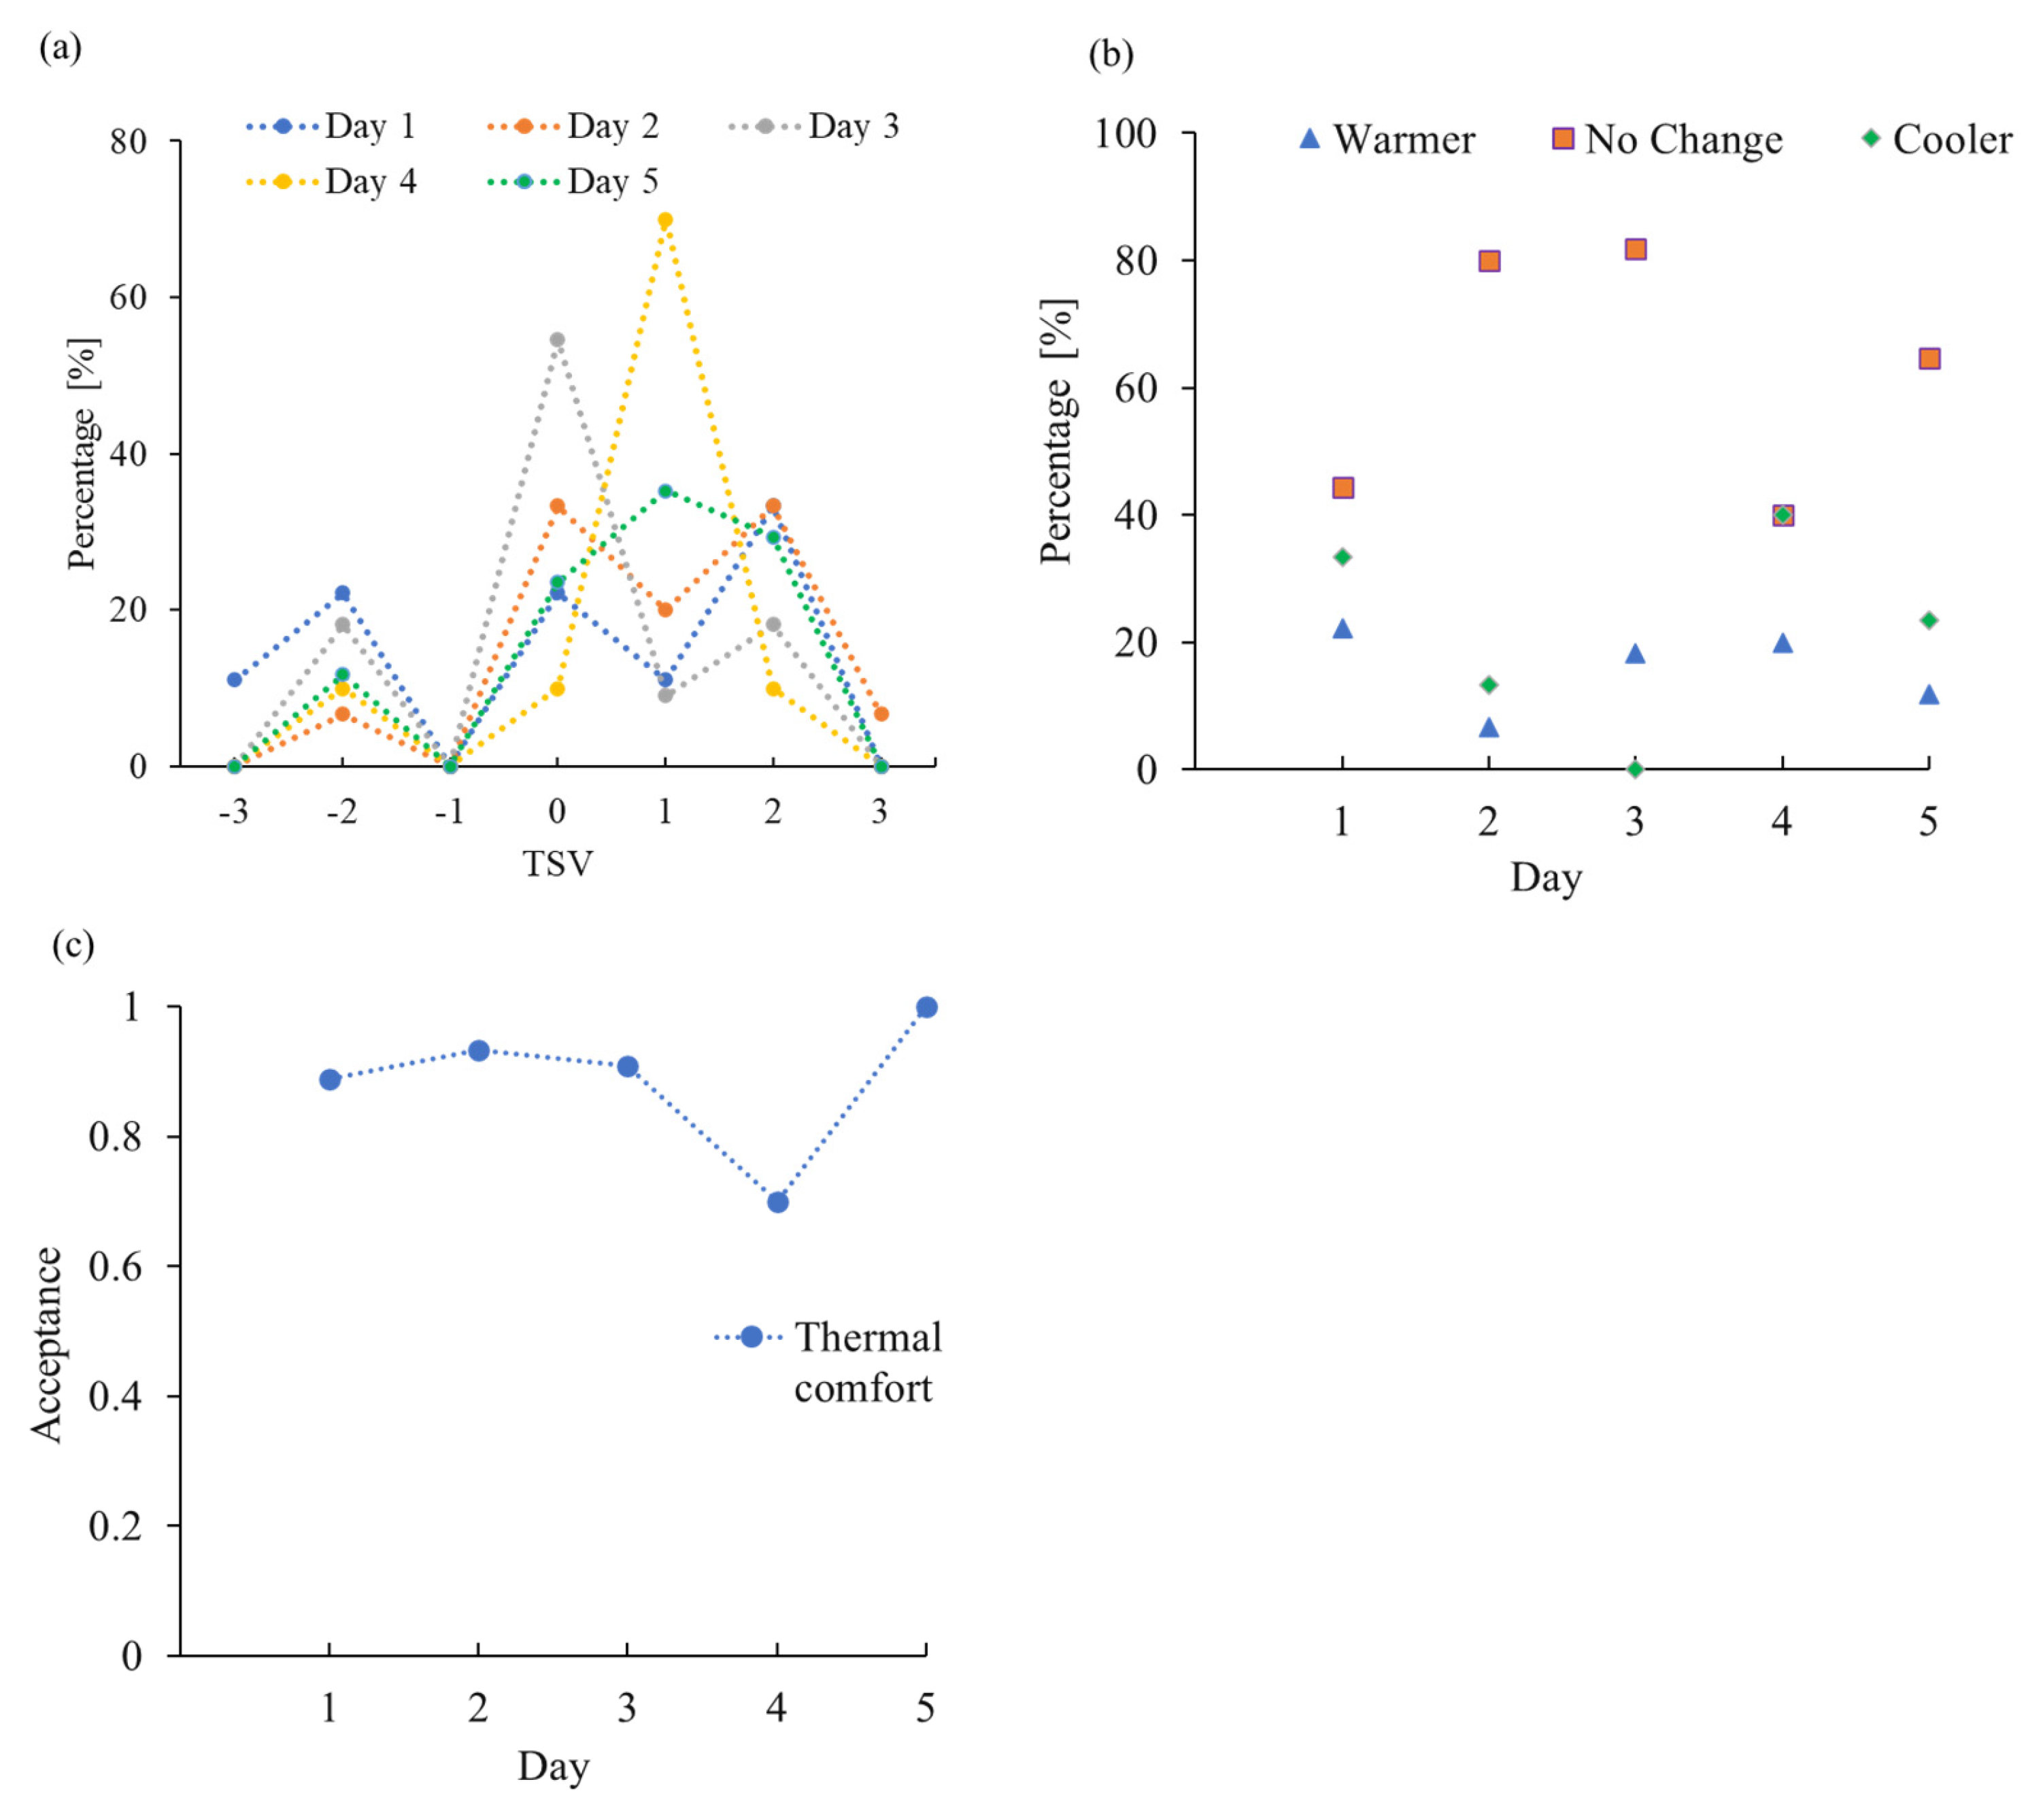
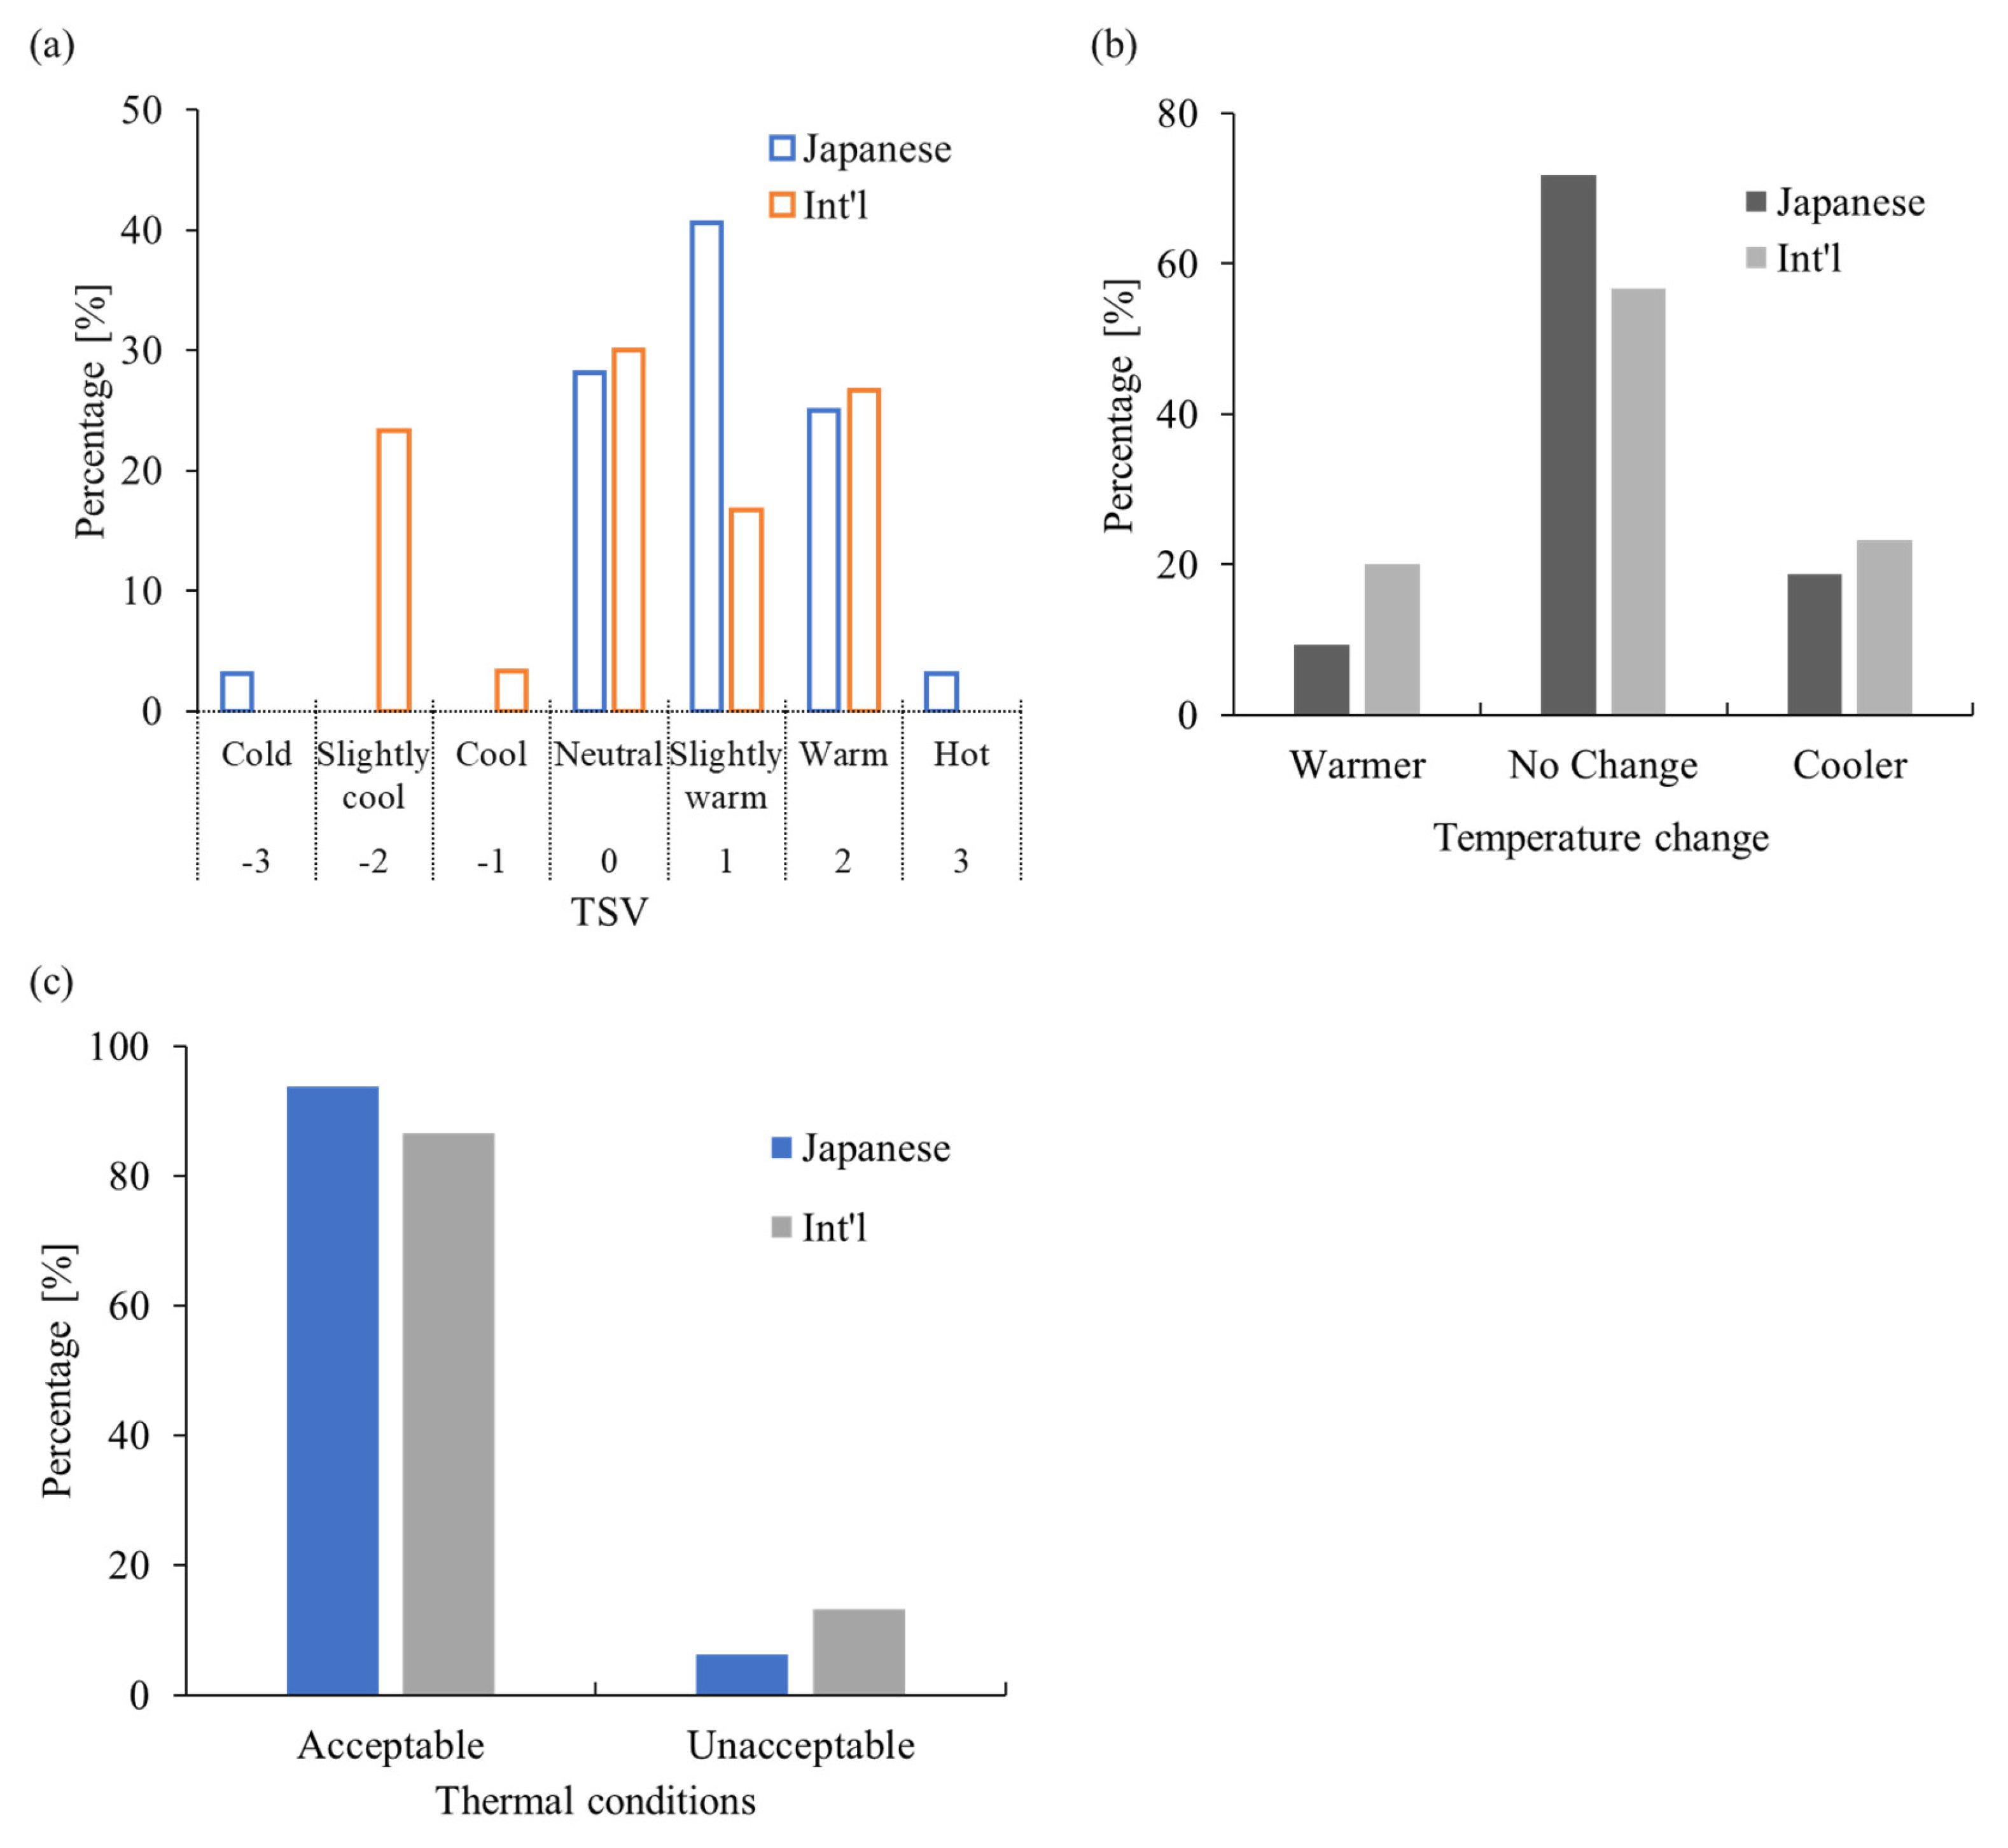
3.4. Thermal Comfort
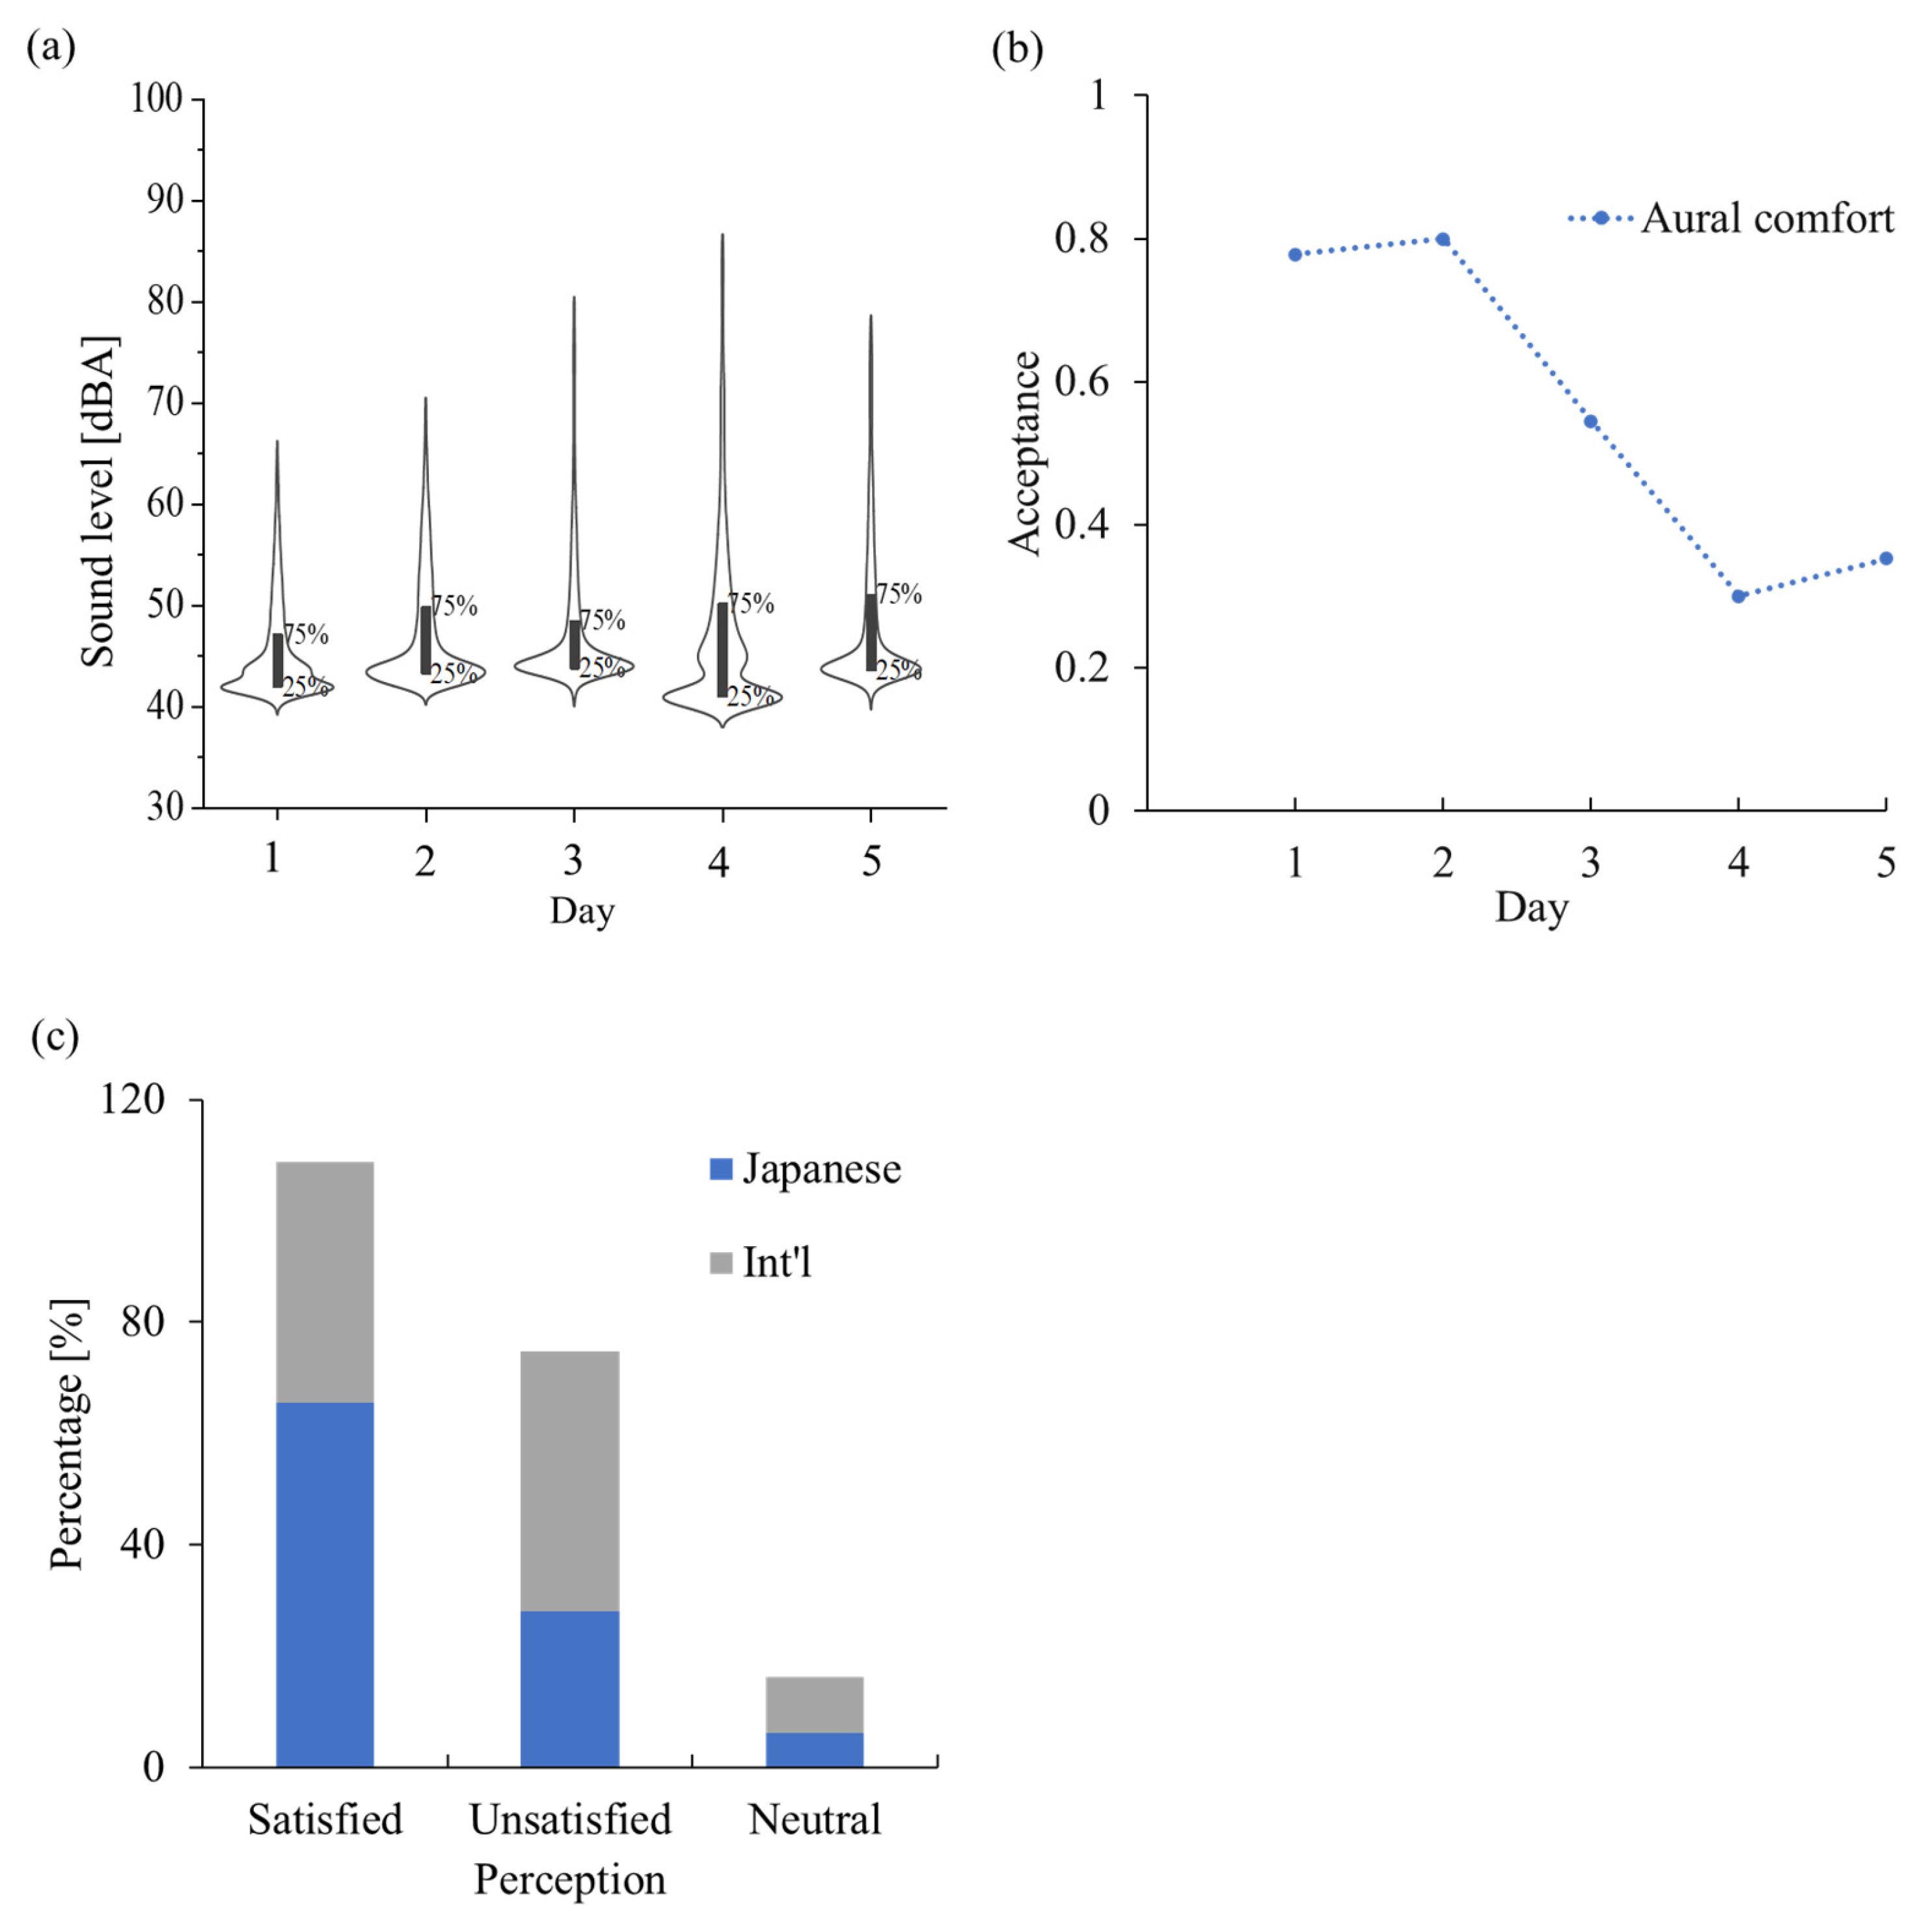
3.5. Aural Comfort
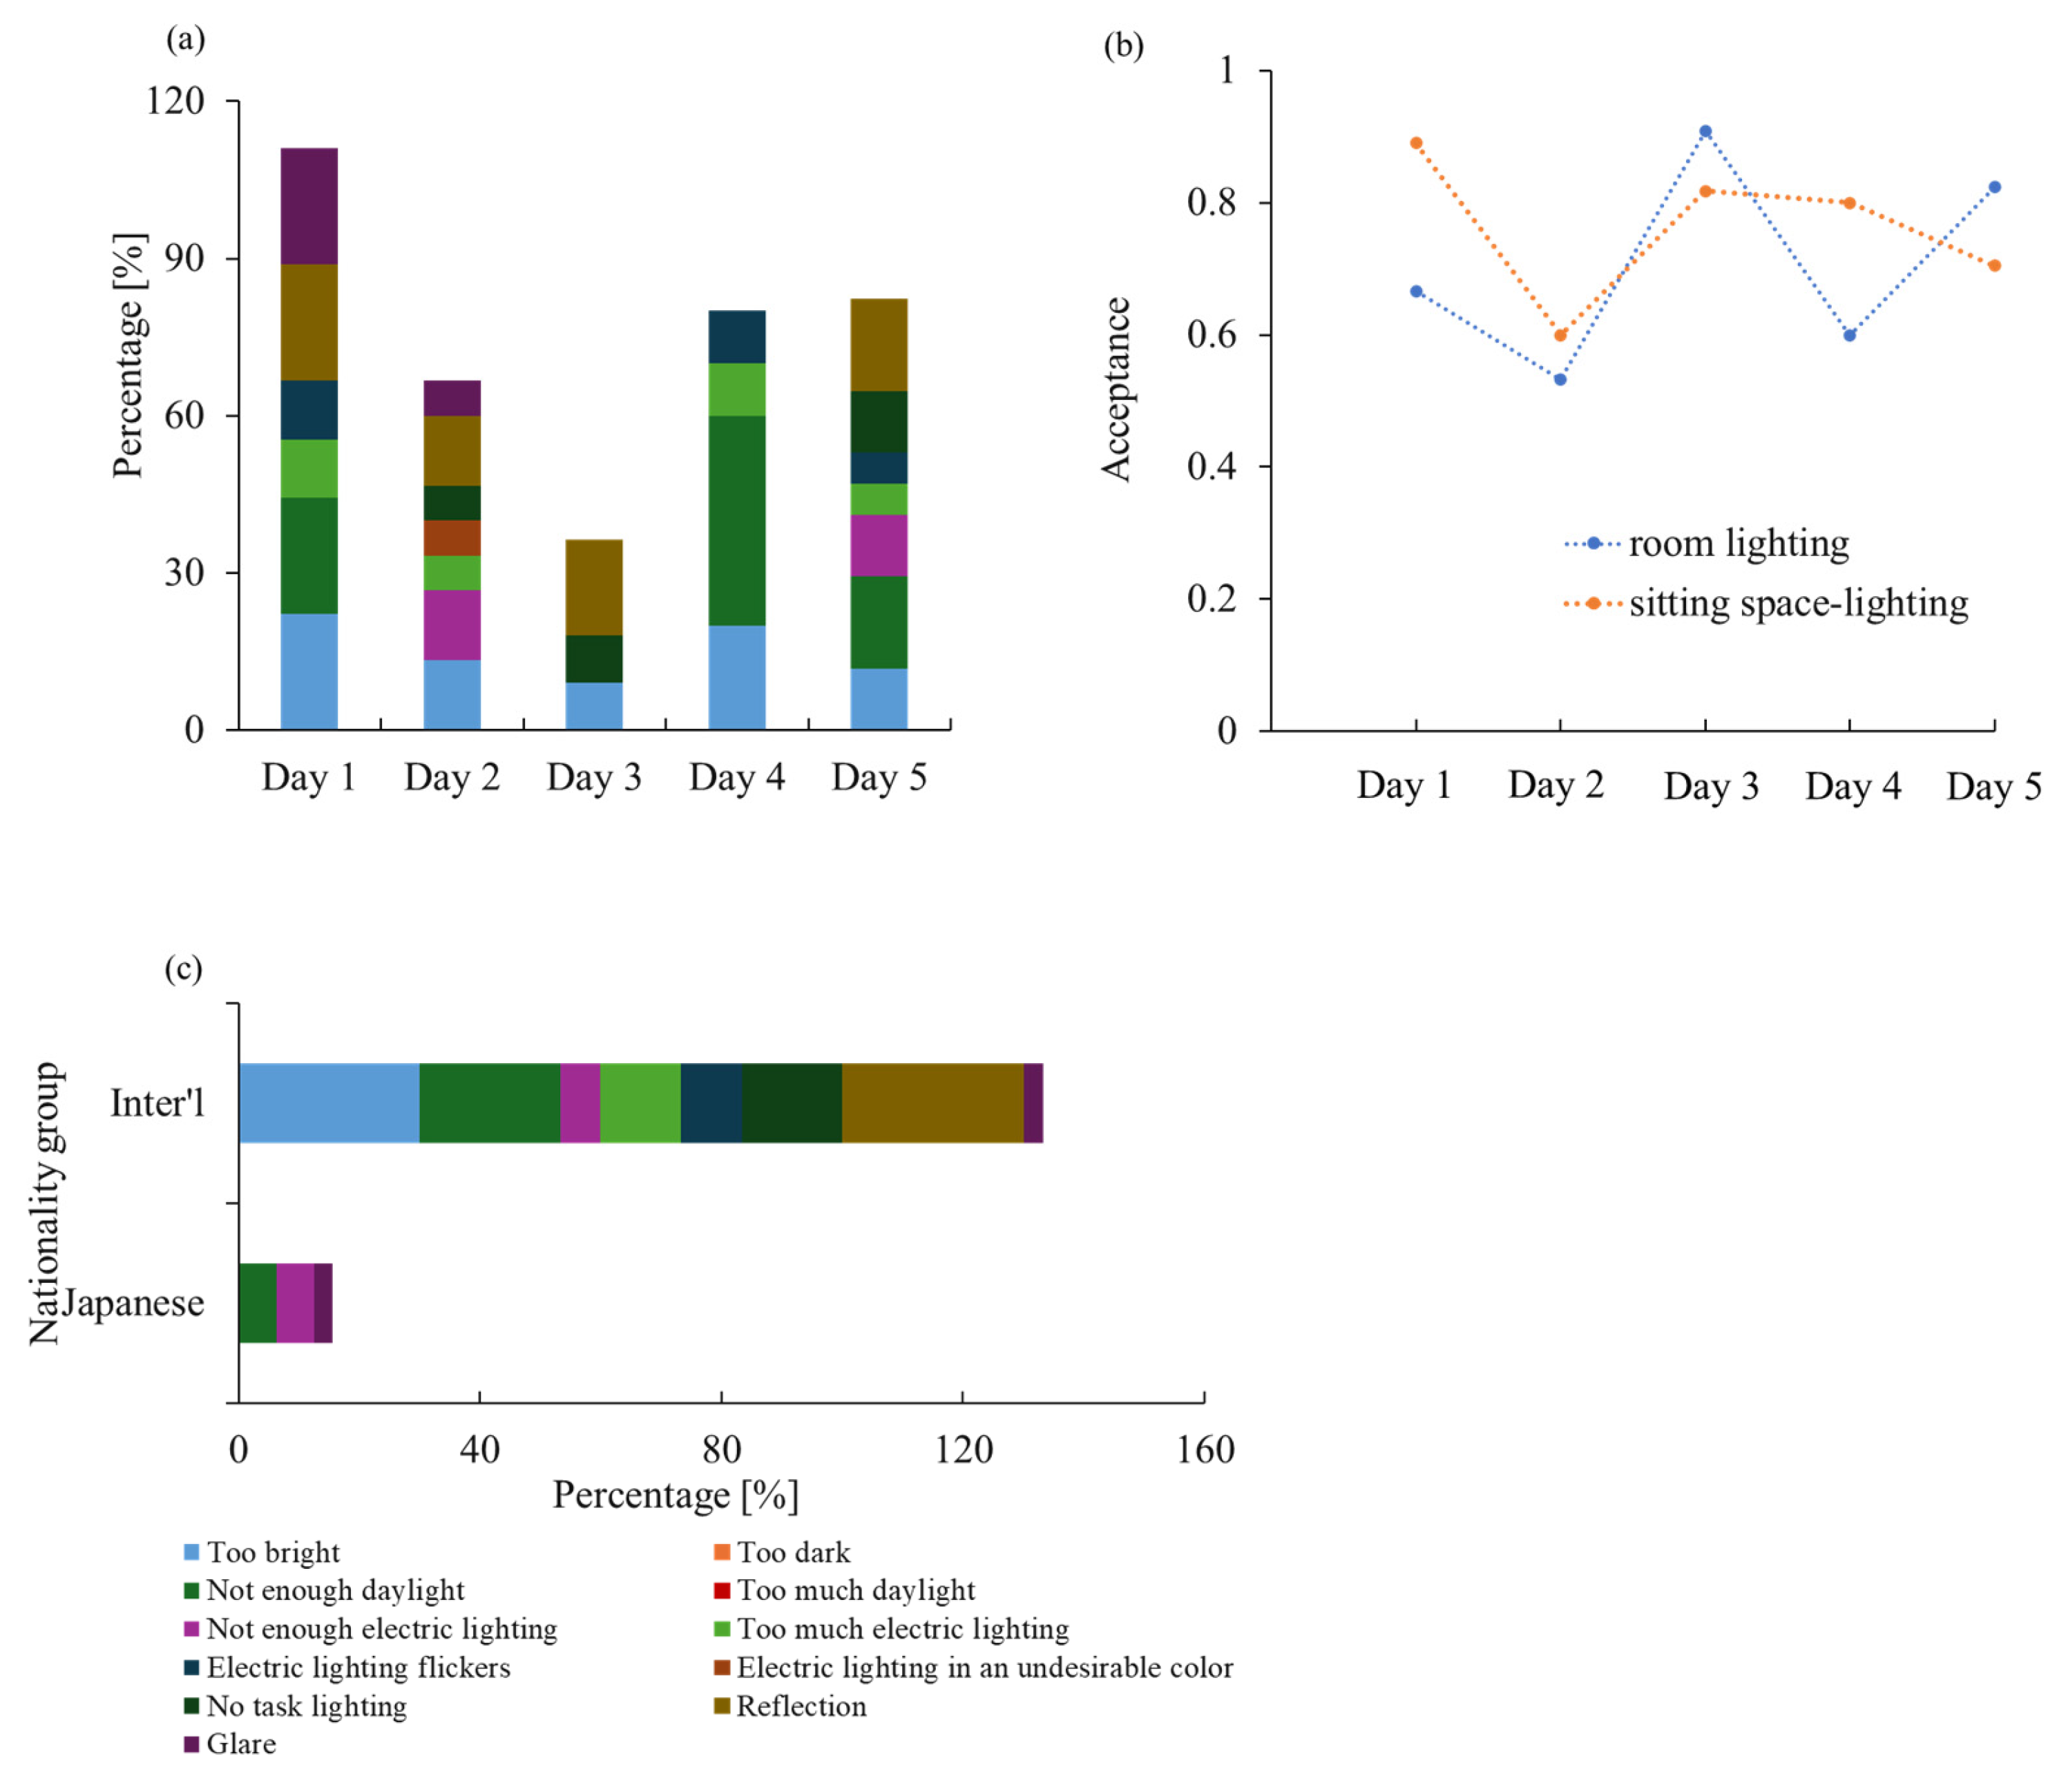
3.6. Visual Comfort
3.7. Heart Rate Variability (HRV)
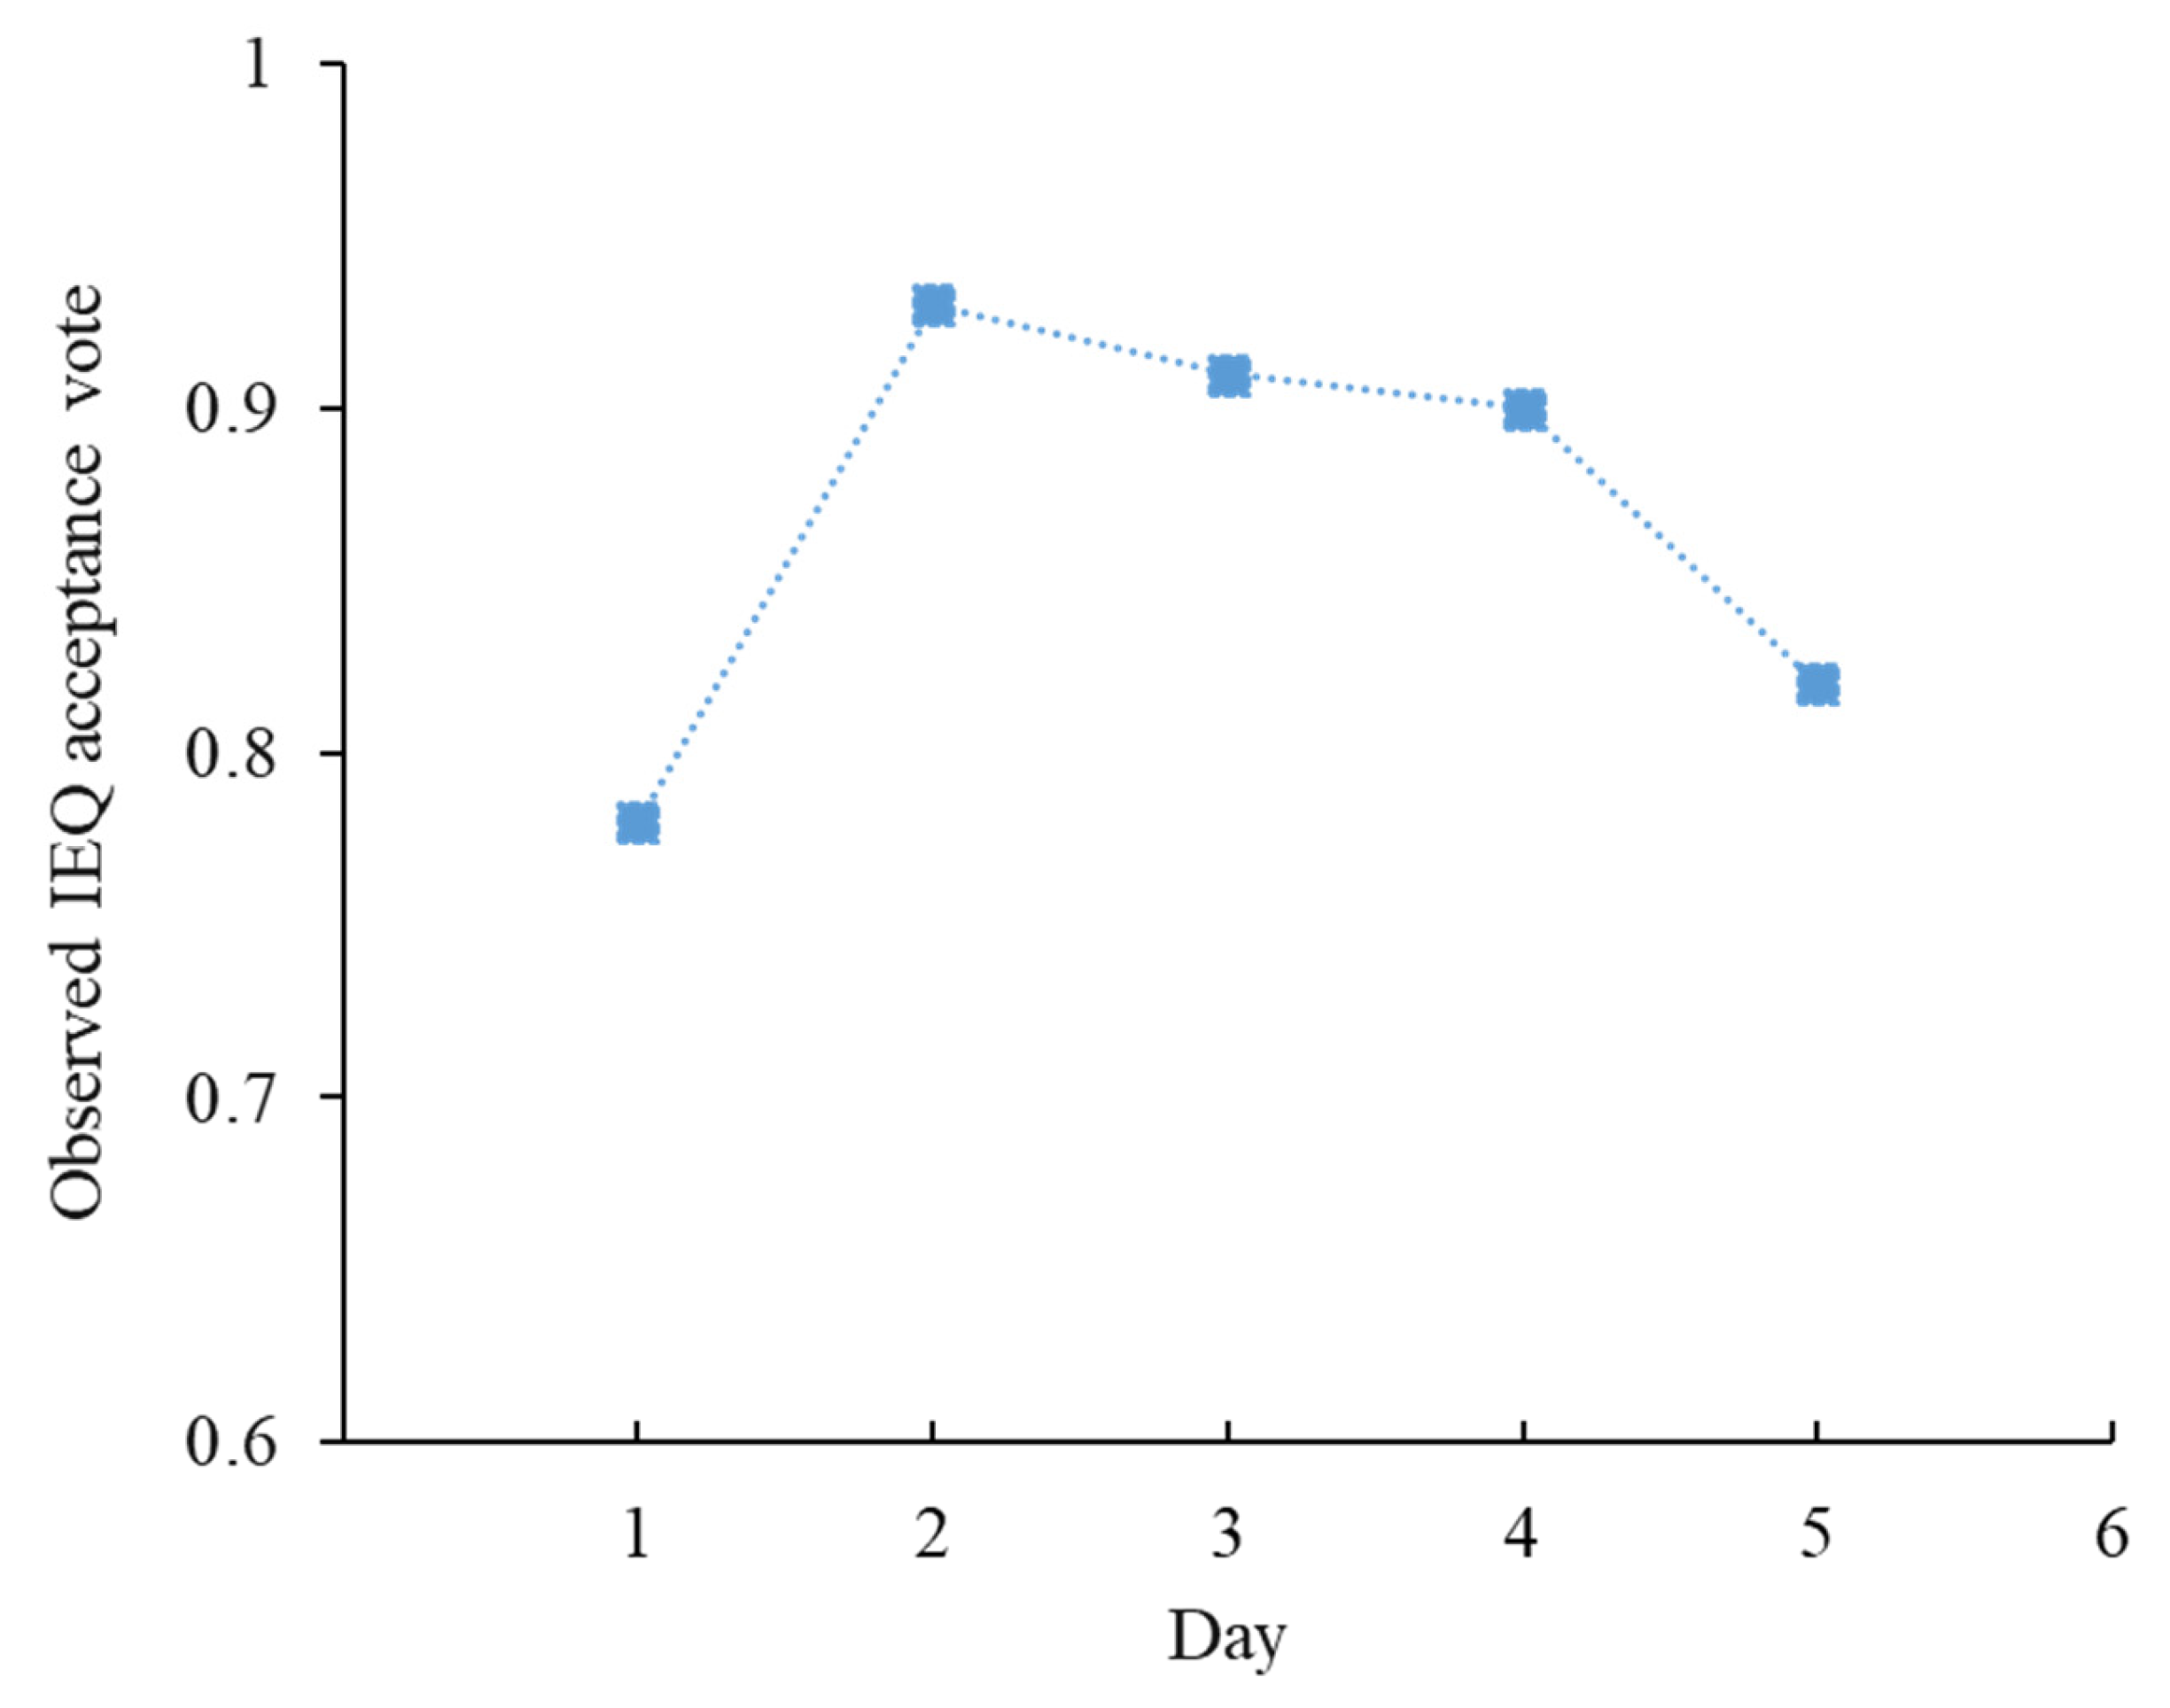
3.8. Overall IEQ Acceptance
4. Conclusions
Author Contributions
Funding
Data Availability Statement
Conflicts of Interest
Appendix A. IEQ Measurement Instruments Used in the Study

| Parameter | Instrument | Measuring Range | Accuracy |
|---|---|---|---|
| CO2 concentration [ppm] | RTR-576-S CO2, Temperature, and humidity sensor | 0~9999 ppm | ±50 ppm |
| Air Temperature | 25~70 °C | ±0.3 °C | |
| Relative humidity | 0~99%RH (at −20~70 °C) | ±2.5%RH (at 15 °C~35 °C, 30~80%RH) | |
| Heart rate | Fitbit wristwatch Sense 2 | 30–220 bpm | - |
| Lux meter | AP-881E | 0.1 Lux–300,000 Lux | 20,000 LUX/2000 FC: ±4% rdg ± 0.5% f. s >20,000 LUX/2000 FC: ±5% rdg ± 10 dgt |
| Sound level | SL1373SD | 30–130 dB | ±1.4 dB (at 1 kHz and 23 ± 5 °C) |
Appendix B. Subjective Evaluation Questions Using the Field Study Tool
| Sub-Section | Questions | |||||||
|---|---|---|---|---|---|---|---|---|
| General Information | Age | Are you a smoker? Yes NO | ||||||
| During a regular week, how many hours do you spend in this students’ office/lab? | ||||||||
| <16 h | 16–40 h | 40–60 h | >60 h | I don’t know | ||||
| Thermal Comfort |
| |||||||
| Very Acceptable | Slightly Acceptable | Just Acceptable | Just Unacceptable | Slightly Unacceptable | Totally Unacceptable | |||
| ||||||||
| Hot | Warm | Slightly warm | Neutral | Slightly cool | Cool | Cold | ||
| ||||||||
| Warmer | No Change | Cooler | ||||||
| ||||||||
| ||||||||
| Hot | Warm | Slightly warm | Slightly Cool | Cool | Cold | |||
| Occupant Comfort |
| |||||||
| Very Comfortable | Just Comfortable | Slightly Comfortable | Slightly Uncomfortable | Not very Comfortable | Not at all Comfortable | |||
| ||||||||
| Lethargy | Loss of concentration | Nausea and dizziness | Headache | Hoarseness | ||||
| Skin rash | Wheezing | Itching | Eye irritation | Nose irritation | ||||
| Air Quality |
| |||||||
| Very acceptable | Acceptable | Slightly acceptable | Slightly unacceptable | Not acceptable | Not at all acceptable | |||
| Visual Comfort |
| |||||||
| Very Satisfied | Satisfied | Slightly Satisfied | Neutral | Slightly Dissatisfied | Dissatisfied | Very Dissatisfied | ||
| ||||||||
| Very Satisfied | Satisfied | Slightly Satisfied | Neutral | Slightly Dissatisfied | Dissatisfied | Very Dissatisfied | ||
| ||||||||
| Too bright | Too dark | Not enough daylight | Too much daylight | Not enough electric lighting | Too much electric lighting | |||
| Electric lighting flickers | Electric lighting in an undesirable colour | No task lighting | Reflection | Glare | Other (please specify) | |||
| Aural Comfort |
| |||||||
| ||||||||
| Loud laughter | People talking in the lab | People talking outside the lab | Equipment noise | Lighting noise | ||||
| Mechanical noises (e.g., heating, cooling, ventilation systems) | Outdoor traffic noise | Other outdoor noises | Other (please specify) | |||||
References
- Lovrić, M.; Račić, N.; Pehnec, G.; Horvat, T.; Lovrić Štefiček, M.J.; Jakovljević, I. Indoor Polycyclic Aromatic Hydrocarbons—Relationship to Ambient Air, Risk Estimation, and Source Apportionment Based on Household Measurements. Atmosphere 2024, 15, 1525. [Google Scholar] [CrossRef]
- Spalt, E.W.; Curl, C.L.; Allen, R.W.; Cohen, M.; Adar, S.D.; Stukovsky, K.H.; Kaufman, J.D. Time–location patterns of a diverse population of older adults: The Multi-Ethnic Study of Atherosclerosis and Air Pollution (MESA Air). J. Expo. Sci. Environ. Epidemiol. 2016, 26, 349–355. [Google Scholar] [CrossRef] [PubMed]
- Zhou, Y.; Yang, G. Real-time monitoring of pollutants in occupied indoor environments: A pilot study of a hospital in China. J. Build. Eng. 2022, 59, 105105. [Google Scholar] [CrossRef]
- Baselga, M.; Alba, J.J.; Schuhmacher, A.J. Development and validation of a methodology to measure exhaled carbon dioxide (CO2) and control indoor air renewal. medRxiv 2022. [Google Scholar] [CrossRef]
- Lastovets, N.; Sormunen, P.; Ruuska, K. CO2 levels as an indicator of ventilation performance in mechanical ventilated buildings. In Proceedings of the CLIMA 2022 Conference, Rotterdam, The Netherlands, 22–25 May 2022. [Google Scholar]
- Ishigaki, Y.; Yokogawa, S. Monitoring the ventilation of living spaces to assess the risk of airborne transmission of infection using a novel Pocket CO2 Logger to track carbon dioxide concentrations in Tokyo. PLoS ONE 2024, 19, e0303790. [Google Scholar] [CrossRef]
- Iwamura, N.; Tsutsumi, K. SARS-CoV-2 airborne infection probability estimated by using indoor carbon dioxide. Environ. Sci. Pollut. Res. 2023, 30, 79227–79240. [Google Scholar] [CrossRef]
- Iwamura, N.; Tsutsumi, K.; Hamashoji, T.; Arita, Y.; Deguchi, T. Carbon Dioxide Levels as a Key Indicator for Managing SARS-CoV-2 Airborne Transmission Risks Across 10 Indoor Scenarios. Cureus 2024, 16, e74429. [Google Scholar] [CrossRef]
- Peng, Z.; Jimenez, J.L. Exhaled CO2 as a COVID-19 infection risk proxy for different indoor environments and activities. Environ. Sci. Technol. Lett. 2021, 8, 392–397. [Google Scholar] [CrossRef]
- Park, S.; Song, D. CO2 concentration as an indicator of indoor ventilation performance to control airborne transmission of SARS-CoV-2. J. Infect. Public Health 2023, 16, 1037–1044. [Google Scholar] [CrossRef]
- Li, B.; Cai, W. A novel CO2-based demand-controlled ventilation strategy to limit the spread of COVID-19 in the indoor environment. Build. Environ. 2022, 219, 109232. [Google Scholar] [CrossRef]
- Ha, W.; Zabarsky, T.F.; Eckstein, E.C.; Alhmidi, H.; Jencson, A.L.; Cadnum, J.L.; Donskey, C.J. Use of carbon dioxide measurements to assess ventilation in an acute care hospital. Am. J. Infect. Control 2022, 50, 229–232. [Google Scholar] [CrossRef] [PubMed]
- Bhagat, R.K.; Wykes, M.D.; Dalziel, S.B.; Linden, P.F. Effects of ventilation on the indoor spread of COVID-19. J. Fluid Mech. 2020, 903, F1. [Google Scholar] [CrossRef] [PubMed]
- Iwamura, N.; Tsutsumi, K. Predicting the Airborne Transmission of Measles: Impact of Indoor Carbon Dioxide (CO2) Levels and Mitigation Strategies. Cureus 2024, 16, e64882. [Google Scholar] [CrossRef] [PubMed]
- Rudnick, S.N.; Milton, D.K. Risk of indoor airborne infection transmission estimated from carbon dioxide concentration. Indoor Air 2003, 13, 237. [Google Scholar] [CrossRef]
- Su, W.; Yang, B.; Melikov, A.; Liang, C.; Lu, Y.; Wang, F.; Kosonen, R. Infection probability under different air distribution patterns. Build. Environ. 2022, 207, 108555. [Google Scholar] [CrossRef]
- Persily, A.; Mandin, C.; Bahnfleth, W.; Sekhar, C.; Kipen, H.; Wargocki, P.; Leung, L. ASHRAE Position Document on Indoor Carbon Dioxide; ASHRAE: Atlanta, GA, USA, 2022; Available online: https://www.ashrae.org/file%20library/about/position%20documents/pd_indoorcarbondioxide_2022.pdf (accessed on 3 February 2025).
- Yang, S.; Bekö, G.; Wargocki, P.; Zhang, M.; Merizak, M.; Nenes, A.; Licina, D. Physiology or Psychology: What Drives Human Emissions of Carbon Dioxide and Ammonia? Environ. Sci. Technol. 2024, 58, 1986–1997. [Google Scholar] [CrossRef]
- Patel, S.; Miao, J.H.; Yetiskul, E.; Anokhin, A.; Majmundar, S.H. Physiology, carbon dioxide retention. In Physiology, Carbon Dioxide Retention; NCBI Bookshelf retrieved 27 January 2025; StatPearls: Treasure Island, FL, USA, 2018. [Google Scholar]
- Kuga, K.; Ito, K.; Wargocki, P. The effects of warmth and CO2 concentration, with and without bioeffluents, on the emission of CO2 by occupants and physiological responses. Indoor Air 2021, 31, 2176–2187. [Google Scholar] [CrossRef]
- Baselga, M.; Alba, J.J.; Schuhmacher, A.J. The control of metabolic CO2 in public transport as a strategy to reduce the transmission of respiratory infectious diseases. Int. J. Environ. Res. Public Health 2022, 19, 6605. [Google Scholar] [CrossRef]
- Zhang, D.; Ding, E.; Bluyssen, P.M. Guidance to assess ventilation performance of a classroom based on CO2 monitoring. Indoor Built Environ. 2022, 31, 1107–1126. [Google Scholar] [CrossRef]
- Wargocki, P.; Porras-Salazar, J.A.; Contreras-Espinoza, S.; Bahnfleth, W. The relationships between classroom air quality and children’s performance in school. Build. Environ. 2020, 173, 106749. [Google Scholar] [CrossRef]
- Zhang, X.; Wargocki, P.; Lian, Z. Physiological responses during exposure to carbon dioxide and bioeffluents at levels typically occurring indoors. Indoor Air 2017, 27, 65–77. [Google Scholar] [CrossRef] [PubMed]
- Wargocki, P.; Porras-Salazar, J.A.; Bahnfleth, W.P. Quantitative Relationships Between Classroom CO2 Concentration and Learning in Elementary Schools. 2017. Available online: https://www.aivc.org/sites/default/files/155_0.pdf (accessed on 3 February 2025).
- Zhang, X.; Wargocki, P.; Lian, Z. Human responses to carbon dioxide, a follow-up study at recommended exposure limits in non-industrial environments. Build. Environ. 2016, 100, 162–171. [Google Scholar] [CrossRef]
- Wargocki, P.; Wyon, D.P. Research-Based Recommendations for Achieving High Indoor Environmental Quality in Classrooms to Promote Learning. DTU Byg Dep. Civ. Eng. 2021. Available online: https://www.realdania.org/-/media/realdaniaorg/publications/research-based-recommendations-for-environmental-quality-in-classrooms---full/rapport_engelsk_lang_april.pdf (accessed on 5 February 2025).
- Mahyuddin, N.; Awbi, H. The spatial distribution of carbon dioxide in an environmental test chamber. Build. Environ. 2010, 45, 1993–2001. [Google Scholar] [CrossRef]
- Di Gilio, A.; Palmisani, J.; Pulimeno, M.; Cerino, F.; Cacace, M.; Miani, A.; de Gennaro, G. CO2 concentration monitoring inside educational buildings as a strategic tool to reduce the risk of SARS-CoV-2 airborne transmission. Environ. Res. 2021, 202, 111560. [Google Scholar] [CrossRef]
- Rackes, A.; Ben-David, T.; Waring, M.S. Sensor networks for routine indoor air quality monitoring in buildings: Impacts of placement, accuracy, and number of sensors. Sci. Technol. Built Environ. 2018, 24, 188–197. [Google Scholar] [CrossRef]
- Dai, H.; Zhao, B. Association between the infection probability of COVID-19 and ventilation rates: An update for SARS-CoV-2 variants. In Building Simulation; Tsinghua University Press: Beijing, China, 2023; Volume 16, pp. 3–12. [Google Scholar]
- Frontczak, M.; Wargocki, P. Literature survey on how different factors influence human comfort in indoor environments. Build. Environ. 2011, 46, 922–937. [Google Scholar] [CrossRef]
- Astolfi, A.; Pellerey, F. Subjective and objective assessment of acoustical and overall environmental quality in secondary school classrooms. J. Acoust. Soc. Am. 2008, 123, 163–173. [Google Scholar] [CrossRef]
- Dorizas, P.V.; Assimakopoulos, M.N.; Santamouris, M. A holistic approach for the assessment of the indoor environmental quality, student productivity, and energy consumption in primary schools. Environ. Monit. Assess. 2015, 187, 259. [Google Scholar] [CrossRef]
- Nagano, K.; Horikoshi, T. New comfort index during combined conditions of moderate low ambient temperature and traffic noise. Energy Build. 2005, 37, 287–294. [Google Scholar] [CrossRef]
- Korsavi, S.S.; Montazami, A.; Mumovic, D. The impact of indoor environment quality (IEQ) on school children’s overall comfort in the UK; a regression approach. Build. Environ. 2020, 185, 107309. [Google Scholar] [CrossRef]
- Korsavi, S.S.; Montazami, A.; Mumovic, D. Perceived indoor air quality in naturally ventilated primary schools in the UK: Impact of environmental variables and thermal sensation. Indoor Air 2021, 31, 480–501. [Google Scholar] [CrossRef] [PubMed]
- Onkangi, R.; Kuga, K.; Wargocki, P.; Ito, K. Observational study of close contact behaviors in a multinational graduate student office. Build. Environ. 2024, 265, 112015. [Google Scholar] [CrossRef]
- Avantaggiato, M.; Pasut, W. ExcEED D4.6 IEQ Survey. European Commission, 2020. Available online: https://ec.europa.eu/research/participants/documents/downloadPublic?documentIds=080166e5bba4fbde&appId=PPGMS (accessed on 14 November 2022).
- Li, P.; Froese, T.M.; Brager, G. Post-occupancy evaluation: State-of-the-art analysis and state-of-the-practice review. Build. Environ. 2018, 133, 187–202. [Google Scholar] [CrossRef]
- Ferreira Silva, M.; Maas, S.; Artur de Souza, H.; Pinto Gomes, A. Post-occupancy evaluation of residential buildings in Luxembourg with centralized and decentralized ventilation systems, focusing on indoor air quality (IAQ). Assessment by questionnaires and physical measurements. Energy Build. 2017, 148, 119–127. [Google Scholar] [CrossRef]
- Jones, E.R.; Cedeño Laurent, J.G.; Young, A.S.; Coull, B.A.; Spengler, J.D.; Allen, J.G. Indoor humidity levels and associations with reported symptoms in office buildings. Indoor Air 2022, 32, e12961. [Google Scholar] [CrossRef]
- Wolkoff, P. Indoor air humidity, air quality, and health—An overview. Int. J. Hyg. Environ. Health 2018, 221, 376–390. [Google Scholar] [CrossRef]
- Wang, L.M.; Brill, L.C. Speech and noise levels measured in occupied K–12 classrooms. J. Acoust. Soc. Am. 2021, 150, 864–877. [Google Scholar] [CrossRef]
- Dias, F.A.M.; Santos, B.A.D.; Mariano, H.C. Sound pressure levels in classrooms of a University and its effects on students and professors. CoDAS 2019, 31, e20180093. [Google Scholar] [CrossRef]
- Mui, K.W.; Wong, L.T.; Wong, Y.W. Acceptable noise levels for construction site offices. Build. Serv. Eng. Res. Technol. 2009, 30, 87–94. [Google Scholar] [CrossRef]
- Andargie, M.S.; Touchie, M.; O’Brien, W.; Müller-Trapet, M. Assessment of indoor exposure to outdoor environmental noise and effects on occupant comfort in multi-unit residential buildings. Build. Acoust. 2023, 30, 293–313. [Google Scholar] [CrossRef]
- Mui, K.W.; Wong, L.T. A method of assessing the acceptability of noise levels in air-conditioned offices. Build. Serv. Eng. Res. Technol. 2006, 27, 249–254. [Google Scholar] [CrossRef]
- Paevere, P.; Brown, S. The impact of indoor environment quality on occupant health, wellbeing and productivity in a sustainable office building. In Healthy Buildings: Proceedings of the 9th International Healthy Buildings Conference and Exhibition; Santanam, S., Bogucz, E., Peters, C., Benson, T., Eds.; Curran Associates, Inc.: Red Hook, NY, USA, 2013; Volume 100, p. 110592. [Google Scholar]
- Haghighat, F.; Donnini, G. Impact of psycho-social factors on perception of the indoor air environment studies in 12 office buildings. Build. Environ. 1999, 34, 479–503. [Google Scholar] [CrossRef]
- Krüger, E.L.; Zannin, P.H. Acoustic, thermal and luminous comfort in classrooms. Build. Environ. 2004, 39, 1055–1063. [Google Scholar] [CrossRef]
- Humphreys, M.A. Quantifying occupant comfort: Are combined indices of the indoor environment practicable? Build. Res. Inf. 2005, 33, 317–325. [Google Scholar] [CrossRef]
- Tahsildoost, M.; Zomorodian, Z.S. Indoor environment quality assessment in classrooms: An integrated approach. J. Build. Phys. 2018, 42, 336–362. [Google Scholar] [CrossRef]
- Kim, J.; Hong, T.; Jeong, J.; Lee, M.; Lee, M.; Jeong, K.; Jeong, J. Establishment of an optimal occupant behavior considering the energy consumption and indoor environmental quality by region. Appl. Energy 2017, 204, 1431–1443. [Google Scholar] [CrossRef]
- Ghita, S.A.; Catalina, T. Energy efficiency versus indoor environmental quality in different Romanian countryside schools. Energy Build. 2015, 92, 140–154. [Google Scholar] [CrossRef]
- Mahbob, N.S.; Kamaruzzaman, S.N.; Salleh, N.; Sulaiman, R. A correlation studies of indoor environmental quality (IEQ) towards productive workplace. In IPCBEE: Proceedings of the 2nd International Conference on Environmental Science and Technology; IACSIT Press: Singapore, 2011; Volume 6, pp. 434–438. [Google Scholar]
- Mui, K.W.; Chan, W.T. A new indoor environmental quality equation for air-conditioned buildings. Archit. Sci. Rev. 2005, 48, 41–46. [Google Scholar] [CrossRef]
- Cheung, T.; Schiavon, S.; Graham, L.T.; Tham, K.W. Occupant satisfaction with the indoor environment in seven commercial buildings in Singapore. Build. Environ. 2021, 188, 107443. [Google Scholar] [CrossRef]
- Rupp, R.F.; Vásquez, N.G.; Lamberts, R. A review of human thermal comfort in the built environment. Energy Build. 2015, 105, 178–205. [Google Scholar] [CrossRef]
- Lee, M.C.; Mui, K.W.; Wong, L.T.; Chan, W.Y.; Lee, E.W.M.; Cheung, C.T. Student learning performance and indoor environmental quality (IEQ) in air-conditioned university teaching rooms. Build. Environ. 2012, 49, 238–244. [Google Scholar] [CrossRef]
- Zhang, S.; Zheng, J.; Wu, Y. Field study of air environment perceptions and influencing factors in waiting spaces of general hospitals in winter cities. Build. Environ. 2020, 183, 107203. [Google Scholar] [CrossRef]
- Hamida, A.; Eijkelenboom, A.; Bluyssen, P.M. Profiling students based on the overlap between IEQ and psychosocial preferences of study places. Buildings 2023, 13, 231. [Google Scholar] [CrossRef]
- Kong, Z.; Utzinger, D.M.; Freihoefer, K.; Steege, T. The impact of interior design on visual discomfort reduction: A field study integrating lighting environments with POE survey. Build. Environ. 2018, 138, 135–148. [Google Scholar] [CrossRef]
- Kong, Z.; Jakubiec, J.A. Evaluations of long-term lighting qualities for computer labs in Singapore. Build. Environ. 2021, 194, 107689. [Google Scholar] [CrossRef]
- Zhang, H.; Liu, Z. Influence of winter natural ventilation on thermal environment of university dormitories under central heating mode in severe cold regions of China. Archit. Sci. Rev. 2023, 66, 226–241. [Google Scholar] [CrossRef]
- Frontczak, M.; Andersen, R.V.; Wargocki, P. Questionnaire survey on factors influencing comfort with indoor environmental quality in Danish housing. Build. Environ. 2012, 50, 56–64. [Google Scholar] [CrossRef]
- Roskams, M.J.; Haynes, B.P. Testing the relationship between objective indoor environment quality and subjective experiences of comfort. Build. Res. Inf. 2021, 49, 387–398. [Google Scholar] [CrossRef]
- Shukla, P.; Mishra, S.; Goswami, S. A field study of investigation of indoor environmental quality status in Indian offices: Concerns and influencing building factors. J. Build. Eng. 2024, 86, 108648. [Google Scholar] [CrossRef]
- Danza, L.; Barozzi, B.; Bellazzi, A.; Belussi, L.; Devitofrancesco, A.; Ghellere, M.; Scrosati, C. A weighting procedure to analyse the Indoor Environmental Quality of a Zero-Energy Building. Build. Environ. 2020, 183, 107155. [Google Scholar] [CrossRef]
- Wu, Y.; Liu, Z.; Kong, Z. Indoor Environmental Quality and Occupant Comfort. Buildings 2023, 13, 1400. [Google Scholar] [CrossRef]
- Hugo, G. Migrants in Society: Diversity and Cohesion. 2005. Available online: https://www.iom.int/sites/g/files/tmzbdl2616/files/2018-07/TP6.pdf (accessed on 21 February 2025).
- Ramirez, M.D.; Liebig, T.; Thoreau, C.; Veneri, P. The Integration of Migrants in OECD Regions: A First Assessment; OECD Regional Development Working Papers, No. 2018/01; OECD Publishing: Paris, France, 2018. [Google Scholar] [CrossRef]
- Ucci, M.; Mavrogianni, A. Health inequalities and indoor environments: Research challenges and priorities. Build. Cities 2024, 5, 662–674. [Google Scholar] [CrossRef]
- Bluyssen, P.M. Towards an integrated analysis of the indoor environmental factors and its effects on occupants. Intell. Build. Int. 2020, 12, 199–207. [Google Scholar] [CrossRef]
- Bluyssen, P.M. The need for understanding the indoor environmental factors and its effects on occupants through an integrated analysis. IOP Conf. Ser. Mater. Sci. Eng. 2019, 609, 022001. [Google Scholar] [CrossRef]
- Becker, C.C. Migrants’ social integration and its relevance for national identification: An empirical comparison across three social spheres. Front. Sociol. 2022, 6, 700580. [Google Scholar] [CrossRef]
- Matsuyama, H.; Okamoto, C.; Satō, Y. Social Integration of Immigrants in Cities: Theory and Evidence from the European Social Survey; No. CIRJE-F-1236; CIRJE, Faculty of Economics, University of Tokyo: Tokyo, Japan, 2024. [Google Scholar]
- Lourenco, F.; Casey, B.J. Adjusting behavior to changing environmental demands with development. Neurosci. Biobehav. Rev. 2013, 37, 2233–2242. [Google Scholar] [CrossRef]
- Pluess, M.; Lionetti, F.; Aron, E.N.; Aron, A. People differ in their sensitivity to the environment: An integrated theory, measurement and empirical evidence. J. Res. Personal. 2023, 104, 104377. [Google Scholar] [CrossRef]
- Wei, G.; Yu, X.; Fang, L.; Wang, Q.; Tanaka, T.; Amano, K.; Yang, X. A review and comparison of the indoor air quality requirements in selected building standards and certifications. Build. Environ. 2022, 226, 109709. [Google Scholar] [CrossRef]
- Pham, A.D.; Nguyen, T.T.H.; Vu, T.M.H. Assessment of indoor air quality of the furniture manufacturers in Binh Duong industrial parks, Vietnam. IOP Conf. Ser. Earth Environ. Sci. 2024, 1368, 012008. [Google Scholar] [CrossRef]
- Wagdi, D.; Tarabieh, K.; Grant, P. Optimizing Indoor Environmental Quality in hot arid climates. IOP Conf. Ser. Mater. Sci. Eng. 2019, 609, 042023. [Google Scholar] [CrossRef]
- Provisions, G.; Rule, I. PHILIPPINE CLEAN AIR ACT OF 1999. Available online: https://faolex.fao.org/docs/pdf/phi45271.pdf (accessed on 2 February 2023).
- Weng, J.; Zhang, Y.; Chen, Z.; Ying, X.; Zhu, W.; Sun, Y. Field measurements and analysis of indoor environment, occupant satisfaction, and sick building syndrome in university buildings in hot summer and cold winter regions in China. Int. J. Environ. Res. Public Health 2022, 20, 554. [Google Scholar] [CrossRef] [PubMed]
- Kenya Occupational Safety and Health Act (OSHA). 2007. Available online: https://kenyalaw.org/kl/fileadmin/pdfdownloads/Acts/OccupationalSafetyandHealth(No.15of2007).pdf (accessed on 2 February 2023).
- Rotich, I.K.; Musyimi, P.K. Indoor air pollution in Kenya. Aerosol Sci. Eng. 2024, 8, 54–65. [Google Scholar] [CrossRef]
- Wei, W.; Wargocki, P.; Zirngibl, J.; Bendžalová, J.; Mandin, C. Review of parameters used to assess the quality of the indoor environment in Green Building certification schemes for offices and hotels. Energy Build. 2020, 209, 109683. [Google Scholar] [CrossRef]
- Tingle, H.S. The Assessment of Dormitories and University Health Service in UPLB Campus as a Sustainable Building Using the Excellence in Design for Greater Efficiencies (EDGE) Tool. Bachelor’s Thesis, College of Engineering and Agro-Industrial Technology (CEAT), Laguna, Philippines, 2015. [Google Scholar]
- Hoffman, D.; Huang, L.Y.; van Rensburg, J.; Yorke-Hart, A. Trends in application of Green Star SA credits in South African green building. Acta Structilia 2020, 27, 1–29. [Google Scholar] [CrossRef]
- Nyairo, R.; Onwonga, R.; Cherogony, K.; Luedeling, E. Applicability of climate analogues for climate change adaptation planning in Bugabira Commune of Burundi. Sustain. Agric. Res. 2014, 3, 46–62. [Google Scholar] [CrossRef]
- Roenfeldt, K. Better Than Average: Calculating Geometric Means Using SAS. Henry. M. Foundation for the Advancement of Military Medicine. 2018. Available online: https://www.lexjansen.com/wuss/2018/56_Final_Paper_PDF.pdf (accessed on 14 November 2022).
- Tsang, T.W.; Mui, K.W.; Wong, L.T. Adaption and Tolerance in Built Environment—An Evaluation of Environmental Sensation, Acceptance and Overall Indoor Environmental Quality (IEQ) in a Subtropical Region. Sustainability 2023, 15, 11094. [Google Scholar] [CrossRef]
- Roy, B.; Ghatak, S. Nonlinear methods to assess changes in heart rate variability in type 2 diabetic patients. Arq. Bras. Cardiol. 2013, 101, 317–327. [Google Scholar] [CrossRef]
- Gospodinov, M.; Gospodinova, E.; Domuschiev, I.; Dey, N.; Ashour, A. Nonlinear analysis of heart rate variability in Type 2 diabetic patients. Fractal Geom. Nonlinear Anal. Med. Biol. 2016, 2, 134–139. [Google Scholar]
- Shaffer, F.; Ginsberg, J.P. An overview of heart rate variability metrics and norms. Front. Public Health 2017, 5, 258. [Google Scholar] [CrossRef]
- Yılmaz, M.; Kayançiçek, H.; Çekici, Y. Heart rate variability: Highlights from hidden signals. J. Integr. Cardiol. 2018, 4, 1–8. [Google Scholar] [CrossRef]
- Wada, S.; Mahbub, M.H.; Nakagami, Y.; Hase, R.; Yamaguchi, N.; Takahashi, H.; Tanabe, T. Variation in Heart Rate Variability between Sitting and Standing Postures under Different Ambient Temperatures. Bull. Yamaguchi Med. Sch. 2022, 69, 45–56. [Google Scholar]
- Rahman, S.; Habel, M.; Contrada, R.J. Poincaré plot indices as measures of sympathetic cardiac regulation: Responses to psychological stress and associations with pre-ejection period. Int. J. Psychophysiol. 2018, 133, 79–90. [Google Scholar] [CrossRef] [PubMed]
- Yugar, L.B.T.; Yugar-Toledo, J.C.; Dinamarco, N.; Sedenho-Prado, L.G.; Moreno, B.V.D.; Rubio, T.D.A.; Moreno, H. The role of heart rate variability (HRV) in different hypertensive syndromes. Diagnostics 2023, 13, 785. [Google Scholar] [CrossRef] [PubMed]
- Abreu, L.C.D.; Roque, A.L.; Castro, B.C.D.; Souza, A.C.A.D.; Vanderlei, L.C.M.; Ferreira, L.L.; Cisternas, J.R. Responses of the geometric indices of heart rate variability to the active orthostatic test in women. MedicalExpress 2014, 1, 351–355. [Google Scholar] [CrossRef]
- EPA. Indoor Air Quality and Student Performance; United States Environmental Protection Agency, 2000. Available online: https://nepis.epa.gov/Exe/ZyPURL.cgi?Dockey=100045VK.TXT (accessed on 18 February 2025).
- Mansor, A.A.; Abdullah, S.; Ahmad, A.N.; Ahmed, A.N.; Zulkifli, M.F.R.; Jusoh, S.M.; Ismail, M. Indoor air quality and sick building syndrome symptoms in administrative office at public university. Dialogues Health 2024, 4, 100178. [Google Scholar] [CrossRef]
- Tran, V.V.; Park, D.; Lee, Y.C. Indoor air pollution, related human diseases, and recent trends in the control and improvement of indoor air quality. Int. J. Environ. Res. Public Health 2020, 17, 2927. [Google Scholar] [CrossRef]
- Korsavi, S.S.; Montazami, A. Children’s thermal comfort and adaptive behaviours; UK primary schools during non-heating and heating seasons. Energy Build. 2020, 214, 109857. [Google Scholar] [CrossRef]
- EN 15251-2007; Indoor Environmental Input Parameters for Design and Assessment of Energy Performance of Buildings Addressing Indoor Air Quality, Thermal Environment, Lighting and Acoustics. Comité Européen de Normalisation (CEN): Brussels, Belgium, 2007.
- ISO 7730:2005; Ergonomics of the Thermal Environment: Analytical Determination and Interpretation of Thermal Comfort Using Calculation of the PMV and PPD Indices and Local Thermal Comfort Criteria. International Organization for Standardization: Geneva, Switzerland, 2005.
- Schoen, L.J.; Alspach, P.F.; Arens, E.A.; Aynsley, R.M.; Bean, R.; Eddy, J.; Ferguson, J.M. Thermal Environmental Conditions for Human Occupancy; ASHRAE: New York, NY, USA, 2013. [Google Scholar]
- Berglund, B.; Lindvall, T.; Schwela, D.H. New WHO guidelines for community noise. Noise Vib. Worldw. 2000, 31, 24–29. [Google Scholar] [CrossRef]
- JIS Z 9110:2010; General Rules of Recommended Lighting Levels. Japanese Industrial Standards: Tokyo, Japan, 2010. Available online: https://webdesk.jsa.or.jp/preview/pre_jis_z_09110_000_000_2010_e_ed10_i4.pdf (accessed on 2 February 2023).
- Linh, N.T.; Trung, P.D.; Hoang, C.D.; Thuan, N.D. Heart rate variability analysis using poincaré plot of rr intervals. Tạp Chí Khoa Học Và Công Nghệ-Đại Học Đà Nẵng 2014, 11, 67–71. [Google Scholar]
- Nakai, F. The role of cultural influences in Japanese communication: A literature review on social and situational factors and Japanese indirectness. J. Intercult. Commun. 2002, 14, 99–122. [Google Scholar]
- Takai, J. Situational and Relational Contexts of Direct and Indirect Communication Strategies: A Japan-United States Cross-Cultural Comparison; University of California: Santa Barbara, CA, USA, 2002. [Google Scholar]


| Country | Indoor Air Quality Acceptable Levels | Thermal Comfort Acceptable Levels | Visual Comfort Acceptable Levels | Aural Comfort Acceptable Levels |
|---|---|---|---|---|
| China | CO2 levels < 1000 ppm relative humidity (RH) 30–60% in winter | 20 °C to 26 °C | ≥300–500 lux. | <85 dBA |
| Egypt | 700~1000 ppm above outdoor levels | 22 °C to 27 °C | >500 lux | 45–65 decibels (dBA) |
| Japan | <1000 ppm (RH) 40–70% | 18–28 °C | 750 to 1000 lux | 55 decibels (dB) |
| Kenya | <1000 ppm * | - | ≥100 lux | 45 decibels (dB) |
| Philippines | <1000 ppm * 40–60% RH | 23–26 °C * | 300–500 lux | 90 dBA |
| South Korea | <1000 ppm (RH) 40–60% | <20 °C | ≥500 lux | <90 dBA |
| Vietnam | <1000 ppm * RH-40–60% * | 20 °C and 26 °C * | 300–500 lux | 70 dBA |
| CO2 Concentration [ppm] | ||||||||||
|---|---|---|---|---|---|---|---|---|---|---|
| Outdoor | Indoor | Occupancy | ||||||||
| Day | Max | Min | Median | Geometric Mean | Max | Min | Median | Geometric Mean | Occupants | Co-Presence Duration [h] |
| Day 1 | 814 | 483 | 514 | 519.23 | 1400.7 | 428.4 | 595 | 689.66 | 12 | 14 |
| Day 2 | 556 | 440 | 453 | 461.65 | 1206 | 473.7 | 768 | 748.17 | 14 | 16 |
| Day 3 | 574 | 435 | 454 | 459.85 | 1247.2 | 487 | 694 | 757.33 | 14 | 20 |
| Day 4 | 614 | 444 | 488 | 482.92 | 1645.4 | 410.1 | 616 | 684.01 | 11 | 14 |
| Day 5 | 626 | 452 | 476 | 472.91 | 1671.7 | 624.6 | 892 | 973.95 | 16 | 21 |
| Relative Humidity [%] | ||||||||
|---|---|---|---|---|---|---|---|---|
| Outdoor Conditions | Indoor Conditions | |||||||
| Day | Max | Min | Median | Geometric Mean | Max | Min | Median | Geometric Mean |
| Day 1 | 57.7 | 46.6 | 55.2 | 54.72 | 35.2 | 12.4 | 29.9 | 29.1 |
| Day 2 | 56.5 | 23.6 | 30.2 | 35.33 | 33.2 | 10.6 | 22.4 | 22.9 |
| Day 3 | 35.2 | 23.8 | 28.9 | 28.8 | 21.5 | 7.5 | 16 | 16.1 |
| Day 4 | 47.8 | 34.8 | 39.6 | 40.08 | 26.9 | 5.3 | 20.7 | 20.6 |
| Day 5 | 52.2 | 24.5 | 42.25 | 38.44 | 31.7 | 12.6 | 22.9 | 22.4 |
| Temperature [°C] | ||||||||||
|---|---|---|---|---|---|---|---|---|---|---|
| Outdoor Conditions | Indoor Conditions | |||||||||
| Day | Max | Min | Median | Geometric Mean | Max | Min | Median | Geometric Mean | TocfEN | Tdiff |
| Day 1 | 15.4 | 11.4 | 12.4 | 12.32 | 39 | 19 | 24.2 | 23.5 | 23.5 | 0 |
| Day 2 | 12.8 | 9.1 | 10.4 | 10.86 | 33.5 | 20.2 | 24.3 | 24.2 | 23.5 | 0.7 |
| Day 3 | 10.5 | 9 | 9.8 | 9.82 | 33.7 | 21 | 24.3 | 25.1 | 23.5 | 1.6 |
| Day 4 | 10.1 | 7.6 | 9.4 | 9.08 | 39 | 14.9 | 21.7 | 21.6 | 23.5 | −1.9 |
| Day 5 | 10.7 | 9.1 | 9.8 | 9.8 | 35.1 | 19.3 | 25.2 | 25.3 | 23.5 | 1.8 |
| Sound Pressure Level | Day 1 | Day 2 | Day 3 | Day 4 | Day 5 |
|---|---|---|---|---|---|
| Max [dBA] | 79.5 | 90.1 | 88 | 91.7 | 91.7 |
| Min [dBA] | 39.6 | 41 | 41 | 39.7 | 40.4 |
| Median [dBA] | 43.5 | 44.1 | 44.8 | 43.6 | 44.5 |
| Mode [dBA] | 41.9 | 43.5 | 43.8 | 40.9 | 43.5 |
| Average | 45.73 | 47.1 | 48.3 | 46.8 | 48.6 |
| Thermal | Visual | Aural | IAQ | |
|---|---|---|---|---|
| Multiple R | 0.254639 | 0.538805 | 0.087989 | 0.70409 |
| R Square | 0.064841 | 0.290311 | 0.007742 | 0.495743 |
| ADJUSTED | −0.16895 | 0.112889 | −0.24032 | 0.327657 |
| Intercept | −0.15427 | −0.32609 | −0.02579 | 0.909747 |
| p-value | 0.018519 | 0.004649 | 0.000501 | 0.826733 |
Disclaimer/Publisher’s Note: The statements, opinions and data contained in all publications are solely those of the individual author(s) and contributor(s) and not of MDPI and/or the editor(s). MDPI and/or the editor(s) disclaim responsibility for any injury to people or property resulting from any ideas, methods, instructions or products referred to in the content. |
© 2025 by the authors. Licensee MDPI, Basel, Switzerland. This article is an open access article distributed under the terms and conditions of the Creative Commons Attribution (CC BY) license (https://creativecommons.org/licenses/by/4.0/).
Share and Cite
Ruth, O.; Kuga, K.; Ito, K. Subjective and Objective Measurement of Indoor Environmental Quality and Occupant Comfort in a Multinational Graduate Student Office. Environments 2025, 12, 117. https://doi.org/10.3390/environments12040117
Ruth O, Kuga K, Ito K. Subjective and Objective Measurement of Indoor Environmental Quality and Occupant Comfort in a Multinational Graduate Student Office. Environments. 2025; 12(4):117. https://doi.org/10.3390/environments12040117
Chicago/Turabian StyleRuth, Onkangi, Kazuki Kuga, and Kazuhide Ito. 2025. "Subjective and Objective Measurement of Indoor Environmental Quality and Occupant Comfort in a Multinational Graduate Student Office" Environments 12, no. 4: 117. https://doi.org/10.3390/environments12040117
APA StyleRuth, O., Kuga, K., & Ito, K. (2025). Subjective and Objective Measurement of Indoor Environmental Quality and Occupant Comfort in a Multinational Graduate Student Office. Environments, 12(4), 117. https://doi.org/10.3390/environments12040117