Article

Determinants of the Use of Circular Economy Strategies by Stakeholders in the Wood–Forestry Sector in Benin

by
Yann Emmanuel Miassi
1,2,3,*,
Nancy Gélinas
1 and
Kossivi Fabrice Dossa
1,3,4,*
1
Faculty of Forestry, Geography and Geomatics, Laval University, Quebec, QC G1V 0A6, Canada
2
Faculty of Agriculture, Department of Agricultural Economics, Çukurova University, Adana 01330, Turkey
3
Action-Research for Sustainable Development NGO, Department of Research Project, Cotonou 03296, Benin
4
Faculty of Agriculture, Department of Agricultural Economics, University of Nigeria, Nsukka 041006, Nigeria
*
Authors to whom correspondence should be addressed.
Environments 2025, 12(4), 101; https://doi.org/10.3390/environments12040101
Submission received: 15 February 2025 / Revised: 21 March 2025 / Accepted: 24 March 2025 / Published: 27 March 2025

Abstract

:
Although the circular economy (CE) has emerged as an innovative approach to address the challenges of protecting natural resources, the use of its strategies remains in its infancy, particularly in West Africa. This study examines the factors influencing the use of CE strategies in the wood and forestry sector in Benin. This study relied on a methodological approach based on surveys, using interview guides to collect information in both the southern and northern zones of the country. This information was collected at the level of the different actors directly involved in this sector, to identify the factors that influence the use of CE strategies using Probit models. The results show that access to information, the number of years of professional experience, the age of the actors and the type of training received are the determining factors in the use of these strategies (the models statistically significant at the 1% level). Other factors, such as knowledge of the costs and benefits of different strategies, are also identified as fundamental. Furthermore, a high financial capacity and an excess or overload of information are identified as the limiting factors for the use of these strategies.

1. Introduction

The accelerated depletion of natural resources, combined with the use of non-resilient production strategies, is leading to their gradual disappearance, with significant environmental impacts on a global scale [1,2]. This pressure on resources is associated with a gradual increase in the level of consumption of goods and services, proportional to the expansion of the global economy [3]. Added to this is the use of linear production models based on the “Take–Make, Use–Dispose” principle [4]. These are the types of models where resources are taken, converted or transformed into products that are subsequently disposed of when they are no longer exploitable [2].
This observation is even more alarming in certain sectors such as wood, construction and forestry, marked by a development that raises real environmental concerns and the need to adopt more resilient and circular strategies [5]. Among the practices adopted, we find traditional conservation strategies, based on the preservation of habitats and particular species [6]. However, these practices are unfortunately increasingly perceived as insufficient in the face of the increasing pressure on forests [6]. However, this situation is even more worrying in Africa, especially in the sub-Saharan zone, marked by an average annual deforestation rate of 2.36%, which is approximately double the global average estimated at 1% [7,8]. Among the most affected countries in the sub-Saharan zone, we find Benin with a forest resource degradation rate estimated at 2.5% and a deforestation of approximately 100,000 ha annually [9]. A situation that accentuates the imbalance between the level of availability of natural resources and the increasing needs of the population, despite policies for the certification of timber and products developed [10,11,12]. This highlights the urgent need to review forest management strategies in order to limit the challenges surrounding these resources [10,11].
It is in this context that the circular economy (CE) model has been highlighted as a promising alternative method that can be used as a counterbalance to traditional or linear economic models [13]. Its main objective is to minimize the need for new materials by instead promoting the reuse of existing ones and constantly monitoring their consumption [2]. Concretely, the main strategies for implementing this model are the repair, reuse and recycling of products, upgrading and remanufacturing [2].
Despite the advantages of these practices or strategies, their adoption in Africa, especially in the western zone, remains limited, mainly because of a certain number of challenges that need to be overcome to better rethink not only industries but also their supply chains [14,15,16,17].
In this context, it becomes essential to identify and understand the factors related to the adoption of CE strategies, particularly in the forestry sector, for a better orientation of policy measures and sectoral interventions. Some studies partially going in this direction have been conducted but focusing, however, mainly on highly industrialized countries, thus neglecting the specific dynamics of less developed countries with specific socio-economic and industrial contexts [18]. A gap that this article aims to fill by focusing on the case of Benin in the analysis of the factors determining the adoption of CE strategies, particularly in the forestry sector.
Moreover, in its analysis, the present study stands out by adopting a more global or inclusive approach by considering various CE strategies used by actors in this sector, unlike previous studies focused on specific CE strategies [2,19]. This study investigates the variables affecting the application of CE strategies in Benin’s wood and forestry industry. Based on empirical data collected from local actors, this more integrative approach makes it possible to make a crucial scientific contribution to the implementation of more resilient measures.

2. Previous Studies and Scientific Issues of This Study

The circular economy (CE) has been the subject of several scientific works at the global, African and national levels. Among the most recent studies are those of Bassi and Dias [20] (European Union countries), Calzolari et al. [21] (Europe), Dey et al. [22] (Europe), Dossa et al. [23] (England), Silva et al. [24] (Brazil), Desmond and Asamba [25] (Kenya and South Africa), Khan and Mihaisi [26] (African countries), and Otasowie et al. [27] (South Africa). At the national level, the issue of CE remains little explored in the literature. One of the few works addressing CE in Benin is the study of Allam and Jones [28], which examined the treatment and circularity of household waste in the city of Cotonou.
However, these studies have mainly focused on analyzing the use or adoption of CE practices [20], dissemination strategies [23] promotion models [26] or indicators to assess the sustainability of EC forestry practices [29]. Otasowie and colleagues [27] have focused their research on new perspectives, particularly on the perceptions of local populations on the usefulness of CE practices, but without highlighting the major challenges surrounding their adoption. This has also been the focus of some studies. For example, we find the work of Debrah et al. [14]; Farooque et al. [30]; Kumar et al. [31] and Osei et al. [32] focused on an examination of the obstacles associated with the adoption of CE. Despite the scientific importance of their studies, they have been limited to general contexts, leaving aside the microeconomic and behavioral factors that could impact their use.
This gap has been partially filled by some works such as those of Czermański et al. [33] (Poland), Kahupi et al. [34] (Kenya), Otasowie et al. [35] (South Africa), Zuofa et al. [36] (Nigeria) and Rweyendela and Kombe [37] (Tanzania), which have highlighted some factors, mainly of an institutional nature, stimulating the adoption of CE.
While institutional factors are undeniably important, such a narrow approach leaves out other critical factors, such as economic, socio-demographic and environmental determinants. Although other studies have adopted broader perspectives, their analyses often focus on sectors unrelated to the forest and wood industries. Only the work of Zuofa et al. [36] (Nigeria) and Otasowie et al. [35] (South Africa) has explored CE practices among small and medium-sized construction enterprises (SMEs) in developing countries. However, these studies have not considered all stakeholder groups, particularly consumers, which limits their ability to comprehensively assess the determinants of CE use.
The scientific interest of this study lies in its objective to comprehensively integrate factors not considered in previous research into a holistic assessment of the determinants of CE adoption. By examining these factors, this research aims to address the limitations of the current literature by providing valuable insights into all relevant dimensions—economic, social and environmental—while integrating all major stakeholders, including producers, processors and consumers.
Furthermore, the strong spatial heterogeneity observed between the north and the south in terms of access to wood resources and in terms of socio-economic conditions highlights the importance of carrying out this study in the context of Benin. Indeed, while the north is marked by a high poverty rate (more than 60% of the population) and greater land resources, the south has a better standard of living and is also distinguished by a high production of wood resources (teak and gmelina) [38]. These spatial variations in terms of resources between the north and the south could impact the choice of CE strategies, as well as the factors that could motivate the decision of local communities to use or not these strategies.

3. Materials and Methods
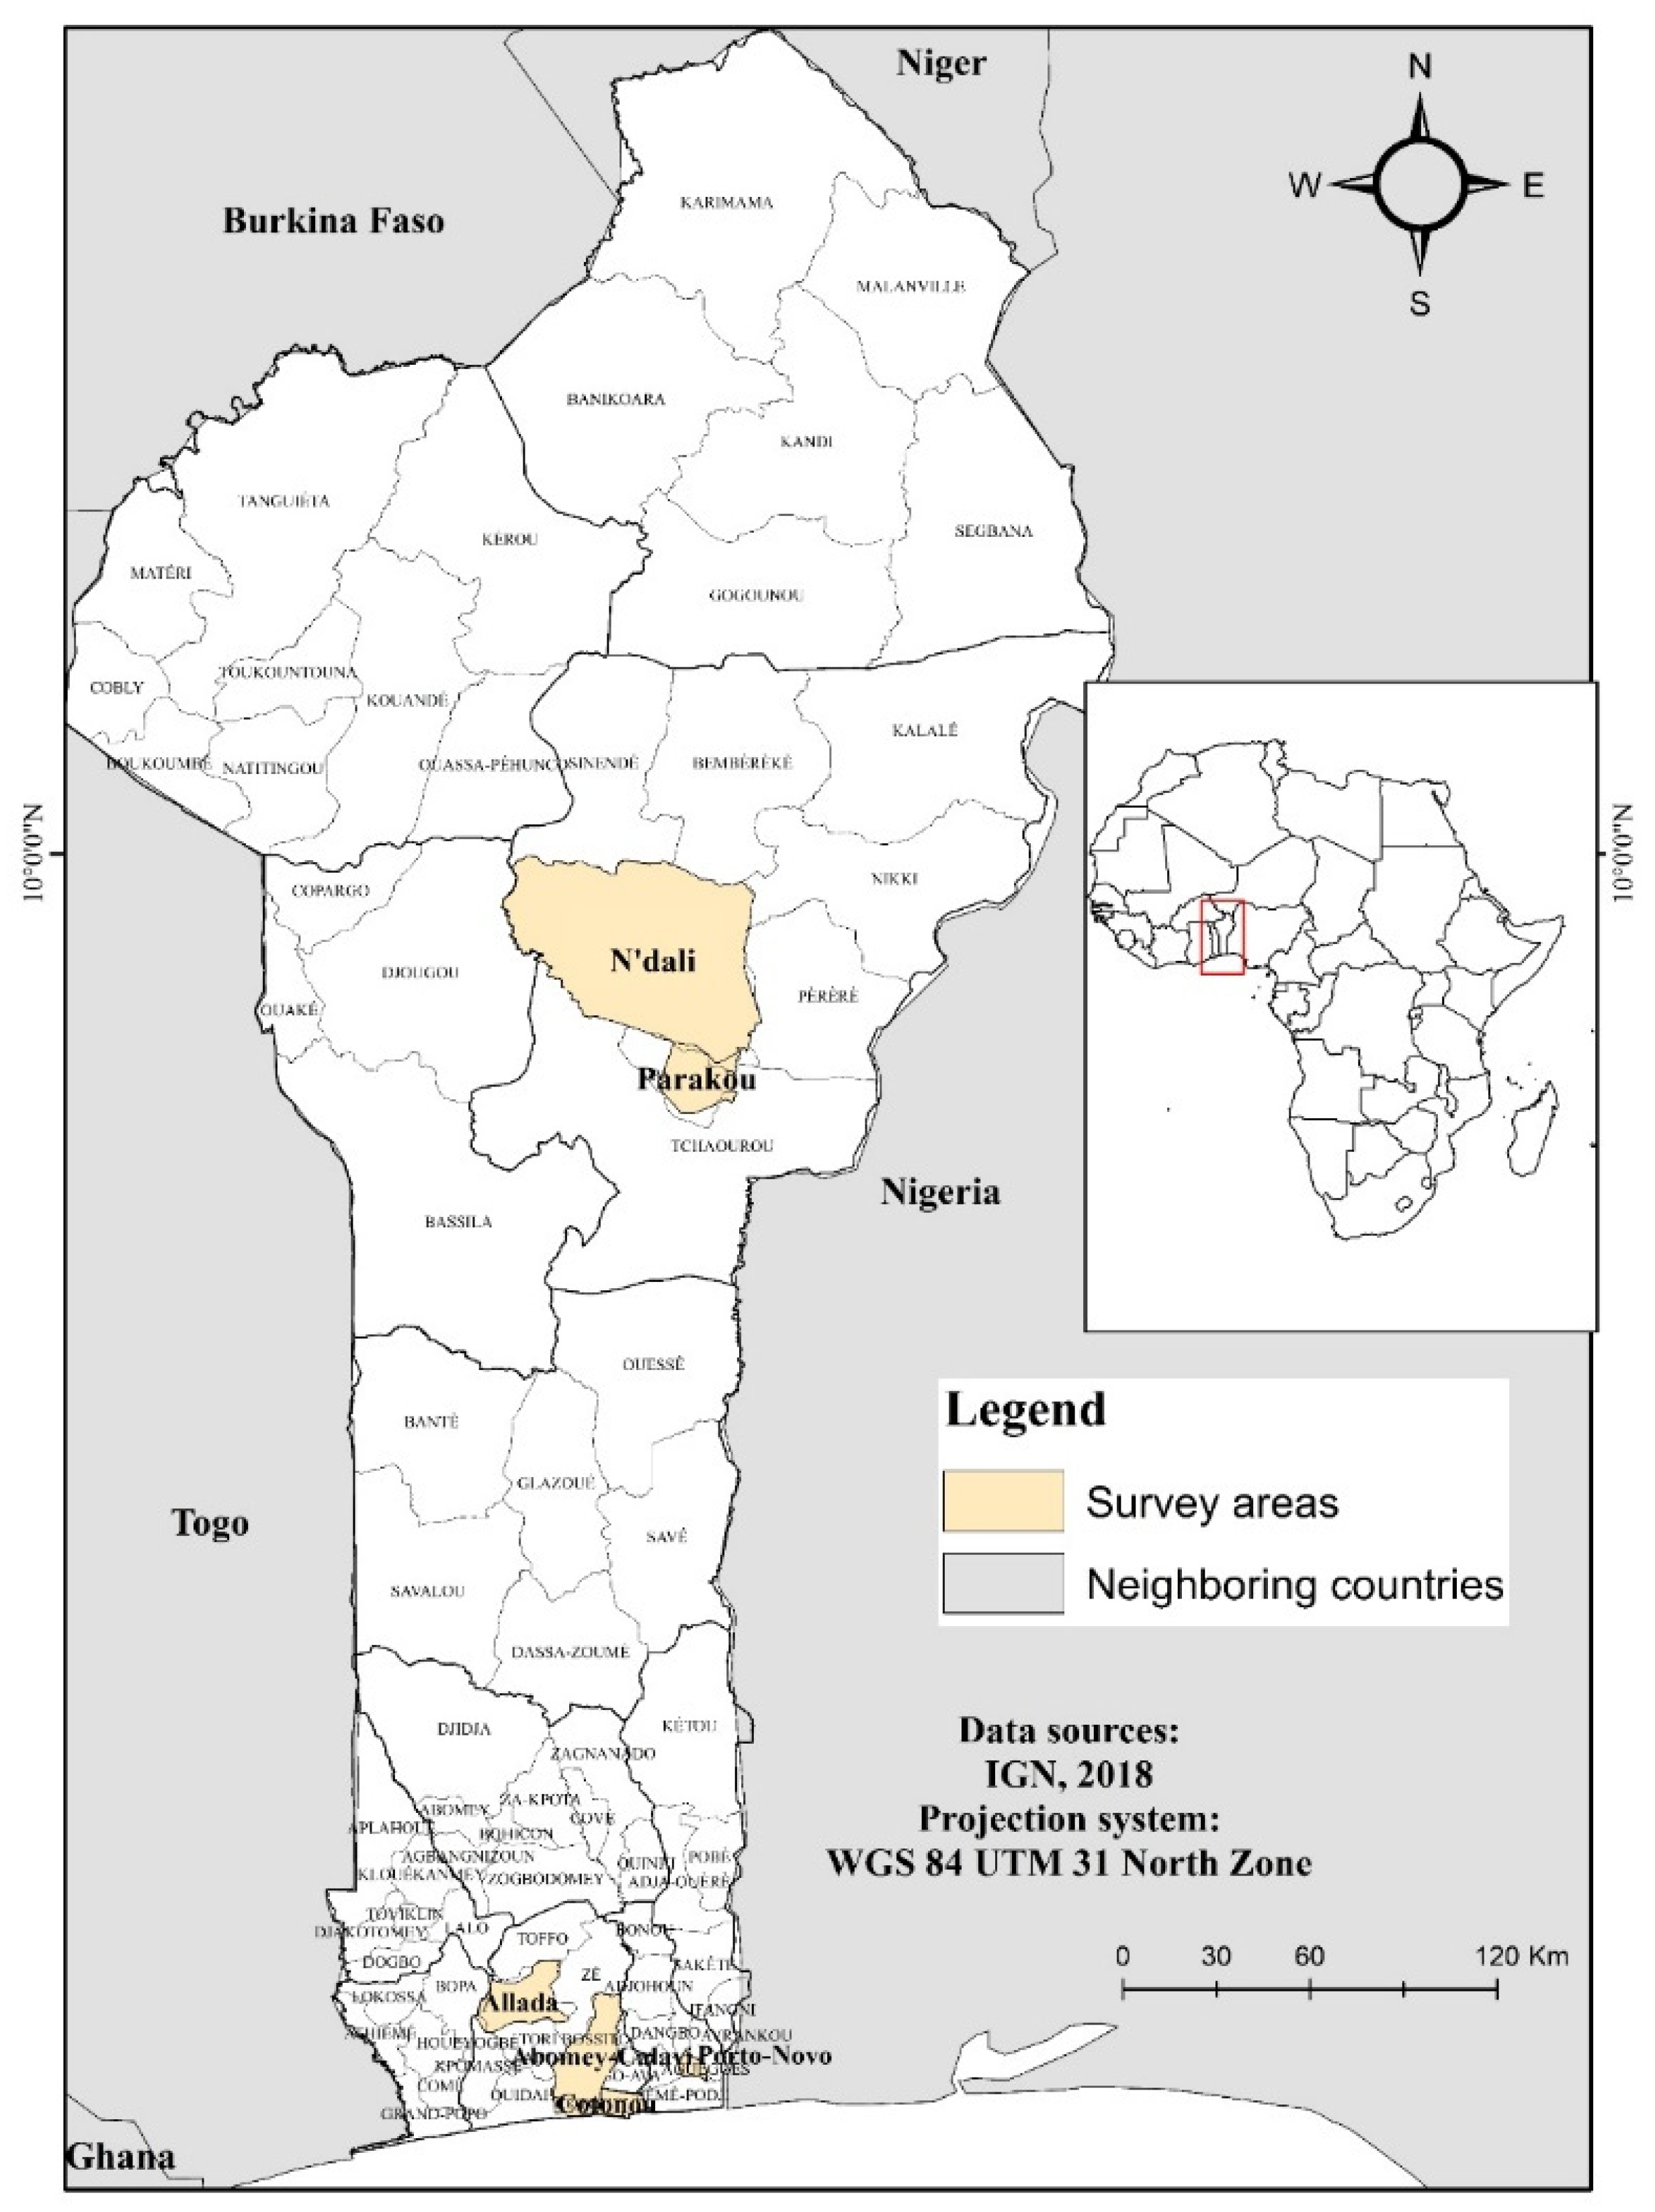
3.1. Study Area

As part of this study, the examination of the factors determining the adoption of CE strategies in the wood–forestry sector was undertaken in the Beninese context. This work follows the work of Miassi et al. [39], which provided an overview of CE practices in the said sector. In the northern zone, the study was carried out in two municipalities, including Parakou and N’Dali. And in the south, the study includes the municipalities of Allada, Abomey-Calavi, Porto-Novo and the city of Cotonou (Figure 1). These choices were made taking into account the wealth and access to forest resources in the north and the high concentration of wood processing and trading companies in the south [40,41,42].

3.2. Collected Data

The Institute for the Environment, Sustainable Development and the Circular Economy [43] established a list of 12 CE strategies, on which this study was based (Figure 2). This list, previously established by this institute, was used in the inventory process of practices adopted by stakeholders (producers, processors, consumers and policy makers) involved in the wood–forestry sector in Benin. This methodical approach was useful for identifying the CE strategies particularly implemented by these stakeholders.
Second, to identify the determinants influencing the use of each CE strategy, data were collected based on the characteristics of the production and processing units, as well as the attributes of direct consumers. The data included socio-demographic characteristics (age, years of experience in the sector, gender, level of access to information through contacts with state extension agents and household size), economic characteristics (access to finance, average annual income) and types of actors (wood producers, processors and consumers of wood processing by-products). In addition, information was collected on their sources of knowledge about CE strategies, as well as their perceptions, including their motivations for adopting or not adopting the strategies, perceived limitations and potential benefits.
Direct interviews were conducted with participants from each stakeholder category, guided by a structured questionnaire comprising open and closed multiple-choice questions.
A sample of 284 direct stakeholders, divided between consumers, producers and processors (Figure 3), was developed using the non-probabilistic method known as “snowballing”. This approach began with the identification of a key participant from each category of stakeholders and each municipality. In a first step, the study relied on suggestions from the leaders of professional associations at the local level to identify the first producers and processors. In a second step, consumers were contacted directly at their points of sale and invited to participate in the study. By following this methodological approach, the sample was gradually enlarged.

3.3. Method of Analysis

The Probit model first proposed by Ashford and Sowden [44], and mainly recognized as the most suitable for the analysis of the use and adoption of innovations [45,46,47], was also adopted in this study to highlight the factors determining the use of CE strategies. Relevant for binary response variables, this model is useful for dissociating two distinct groups in a sample, as in this study, aimed at separating the factors influencing the choice to use from those attributed to non-users. Mathematically, the principle of this approach is as follows:
Let Y be a binary dependent variable (0 = No and 1 = Yes), as in this study, considering the use (Yes) or not of CE strategies. Each strategy represents a dependent variable and is regressed via Equation (1) from this model to reveal the factors determining its use (Table 1).
Y = X β + μ i
with Y = 1 ;   s i   X β > μ i And Y = 0 ;   s i   X β = μ i .
X is the vector of explanatory variables corresponding to the internal factors associated with each actor and its external environment; β is the vector of maximum likelihood estimates, while μ corresponds to the random error.
Furthermore, the modeling was first carried out on strategies such as the Maintenance and Repair Equation (2) and then on the Donation and Resale Equation (3) because of their effective adoption within the different communities, making them the most representative strategies. However, CE is known for its strong contribution in achieving various Sustainable Development Goals (SDGs) such as SDG 12, aiming to promote responsible consumption and production [48,49]. This is in line with the CE strategy on responsible consumption and sourcing, allowing not only an optimization of the exploitation of resources and a reduction in waste but also a reduction in environmental impacts [48,49]. This dynamic is based on the fundamental principles of the reduction, reuse, recycling and recovery of materials in the process of production, distribution and consumption [50].
In this context, the work of Bassi and Dias [20] proposes an empirical framework using Probit models to also assess practices aligned with this SDG, such as reducing water and energy consumption, as well as recycling industrial waste. Such strategies perfectly illustrate the case of responsible consumption and sourcing in the transition to a more sustainable CE, supported by the European Union action plan [50].
Based on these findings, a third model, Equation (3), was designed in the context of this study, focusing mainly on the strategy of responsible consumption and procurement. Its addition is linked to its adequacy with the overall sustainability objectives and by its strategic role in the analysis of the determining factors of this transition. This choice not only completes the analysis of existing strategies but also offers a holistic perspective by integrating the key dimensions of sustainability and CE. The general equations of the three models are as follows:
  • Maintenance and Repair Strategy Template
    Y M a i n t e n a n c e = β 1 A g e + β 2 E x p + β 3 S e x + β 4 I n f o s + β 5 S i z e + β 6 A c t o r s + β 7 C r e d + β 8 I n c o + β 9 M o t i v + β 10 L i m i t + β 11 A v t g + β 12 S o u r c e + μ i
  • Model of Using the Give-and-Take Strategy
    Y G i v e = β 1 A g e + β 2 E x p + β 3 S e x + β 4 I n f o s + β 5 S i z e + β 6 A c t o r s + β 7 C r e d + β 8 I n c o + β 9 M o t i v + β 10 L i m i t + β 11 A v t g + β 12 S o u r c e + μ i
  • Responsible Consumption and Sourcing Strategy Usage Model
    Y C o n A p p r o = β 1 A g e + β 2 E x p + β 3 S e x + β 4 I n f o s + β 5 S i z e + β 6 A c t o r s + β 7 C r e d + β 8 I n c o + β 9 M o t i v + β 10 L i m i t + β 11 A v t g + β 12 S o u r c e + μ i

4. Results

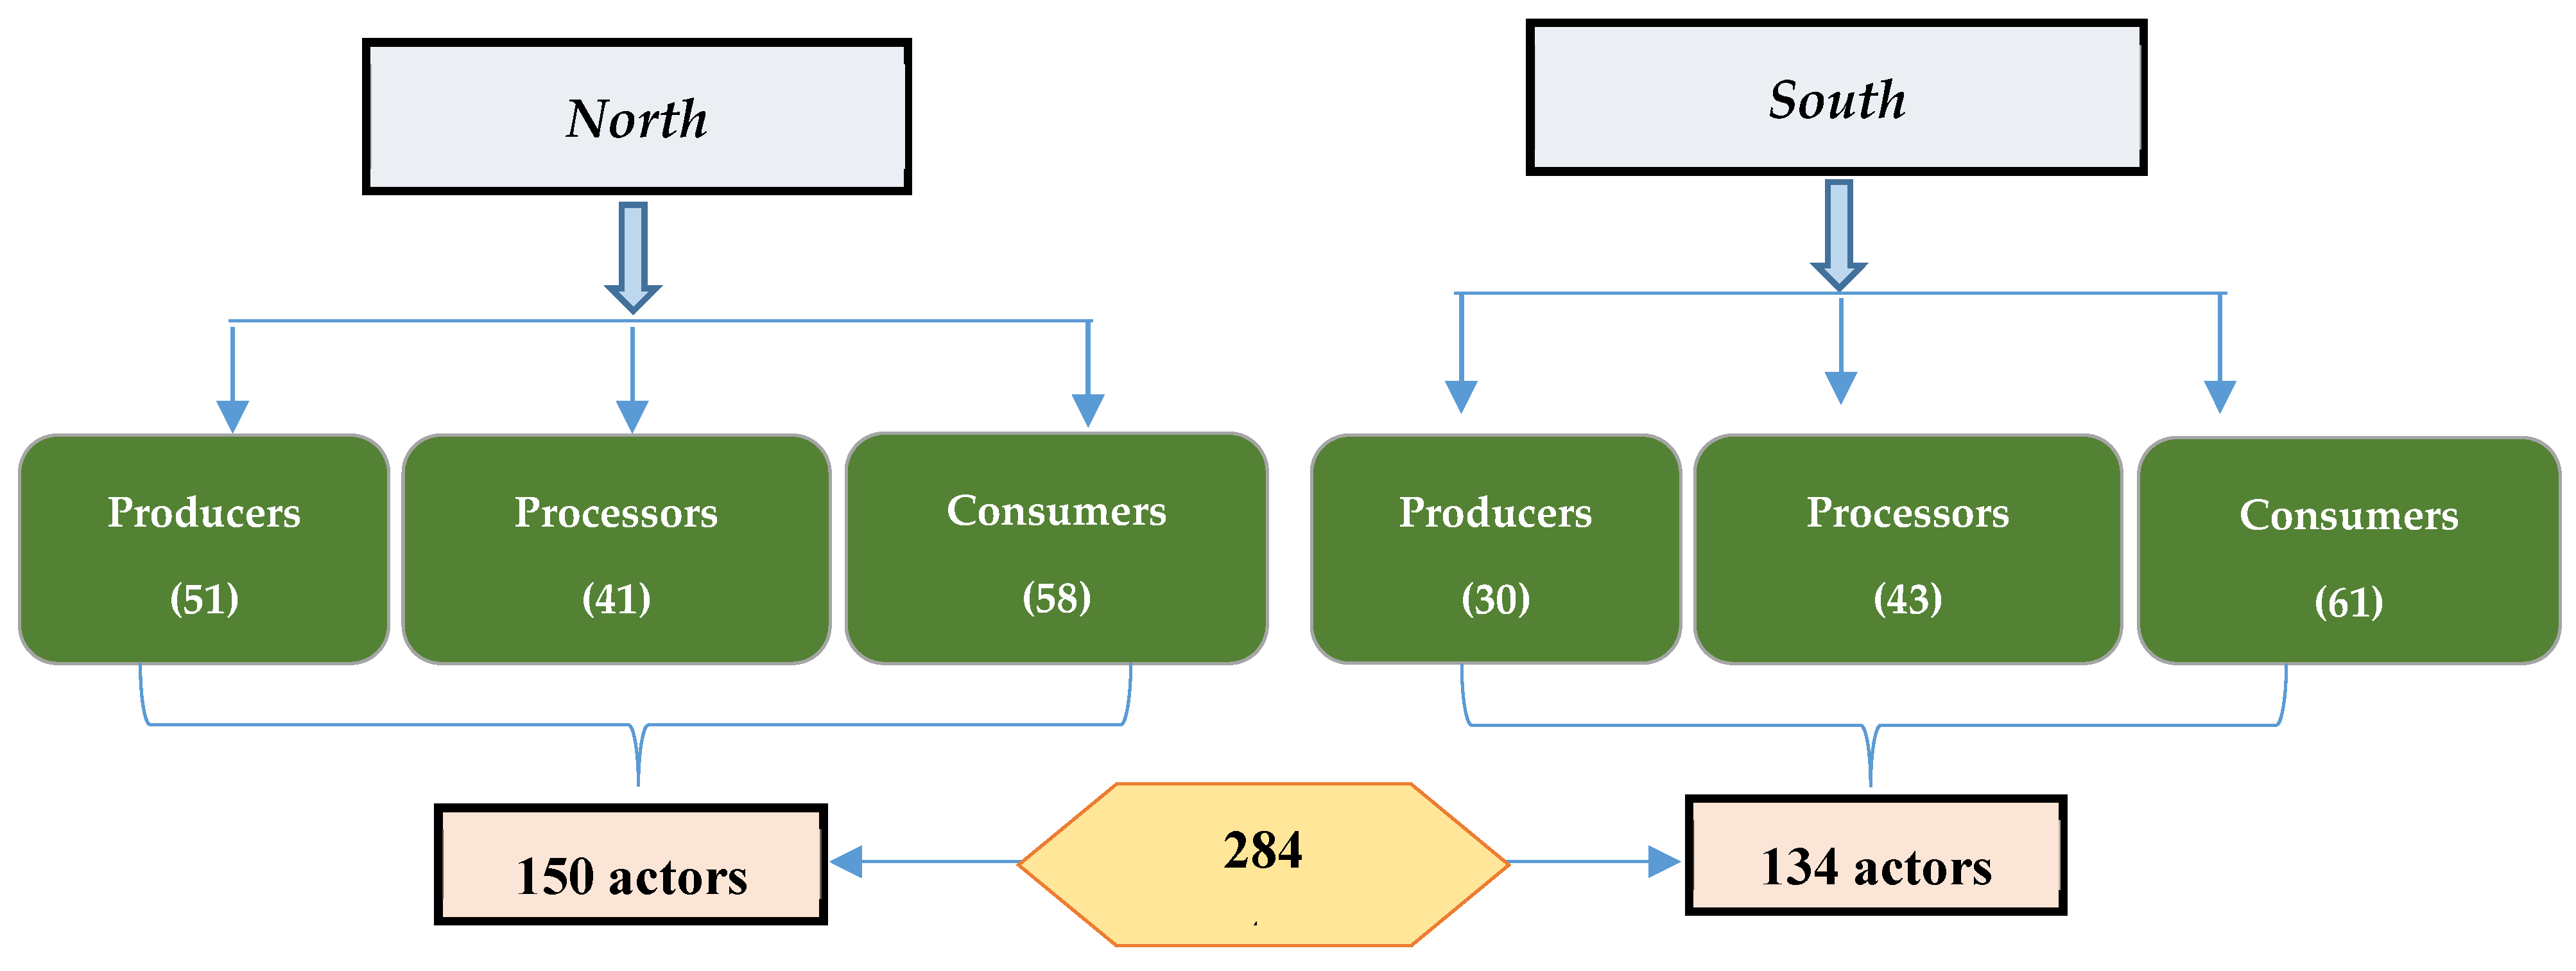
4.1. Characterization of Direct Actors

For the purposes of this study, direct stakeholders include consumers, producers and processors, each playing a distinct role within the timber–forest value chain. Results detailing the characteristics of respondents reveal a notable diversity among participant profiles (Table 2). Most respondents were male (92.86%), with this trend being more pronounced in the north (97.3%) compared to the south (87.29%). Most respondents belonged to medium-sized households with three to five members (54.88%), with a higher proportion in the south (66.1%) than in the north (45.95%), where households with more than six members were also predominant (41.22%). In terms of age, the most represented groups were 35–44 years (21.80%) and 46–54 years (45.9%). In the north, the 46–54 age group was predominant (58.78%), while in the south, the 35–44 (30.51%) and 46–54 (29.66%) age groups were well represented. Income levels also varied significantly. Most participants (56.76%) earned between 50,001 and 100,000 CFA (approximately USD 647.468), with this income range being predominant in the north (72.97%) compared to the south (36.44%). In the south, income levels were more diverse, with a notable proportion of respondents earning between 100,001 and 200,000 CFA (35.59%). These results highlight significant differences between the northern and southern zones, particularly regarding gender, household size, age and income. These disparities are consistent with observed socio-economic patterns, including the predominance of loggers in the north and processors in the south. These differences may be critical determinants in the adoption of CE strategies, as the variability in socio-economic profiles influences the needs and behaviors of stakeholders, as well as the effectiveness of the strategies implemented. A comprehensive understanding of these regional disparities is essential to develop appropriate and targeted recommendations that address the specific characteristics and challenges of each zone.

4.2. Characterization of Enterprises

The characterization of enterprises reveals that respondents are divided into three types of actors, with consumers constituting the largest group (38.72%), followed by processors (31.2%) and producers (30.07%) (Table 3). Regarding the status of enterprises, the results indicate a predominance of informal enterprises overall (58.28%). However, a zonal analysis shows that formal enterprises dominate in the south (55.56%). An analysis of the status of enterprises by type of actor indicates that most producers (50.53%) and processors (49.47%) operate informally. In the south, processors (65.62%) outnumber producers (34.38%) in the informal sector, while the reverse is true in the north, where producers (58.73%) surpass processors (41.27%) in informal operations. In terms of financial capacity, the distribution of share capital among the surveyed companies varies, with the majority (42.94%) having capital between 100,001 and 300,000 CFA. This category is particularly prevalent in Parakou (45.56%) and Calavi (39.47%). Companies with capital ranging from 300,001 to 800,000 CFA also represent a significant share (40.49%), particularly in Cotonou (50%).
Regarding workforce size, companies employing five to ten people are the most common (49.69%), with a higher prevalence in the north (59.34%) compared to the south (37.50%). Small companies employing 0 to 4 people are more common in the south (54.17%), particularly in Cotonou (72.22%). In terms of business longevity, most (46.62%) have been in business for more than 13 years, with similar distributions in the south (48.61%) and the north (45.05%).
Access to information from state-run skills and development units shows significant disparities between regions. In the north, a large proportion of companies (76.92%) report having no access to this information, while in the south, the majority (58.33%) report having some level of access. The data also reveal that most companies (88.96%) do not have foreign partnerships, although some exist in Parakou (9%) and especially in Allada (100%). Regarding access to credit, approximately half of companies (50.92%) have access, with a higher proportion in the south (61.11%) compared to the north (42.86%).

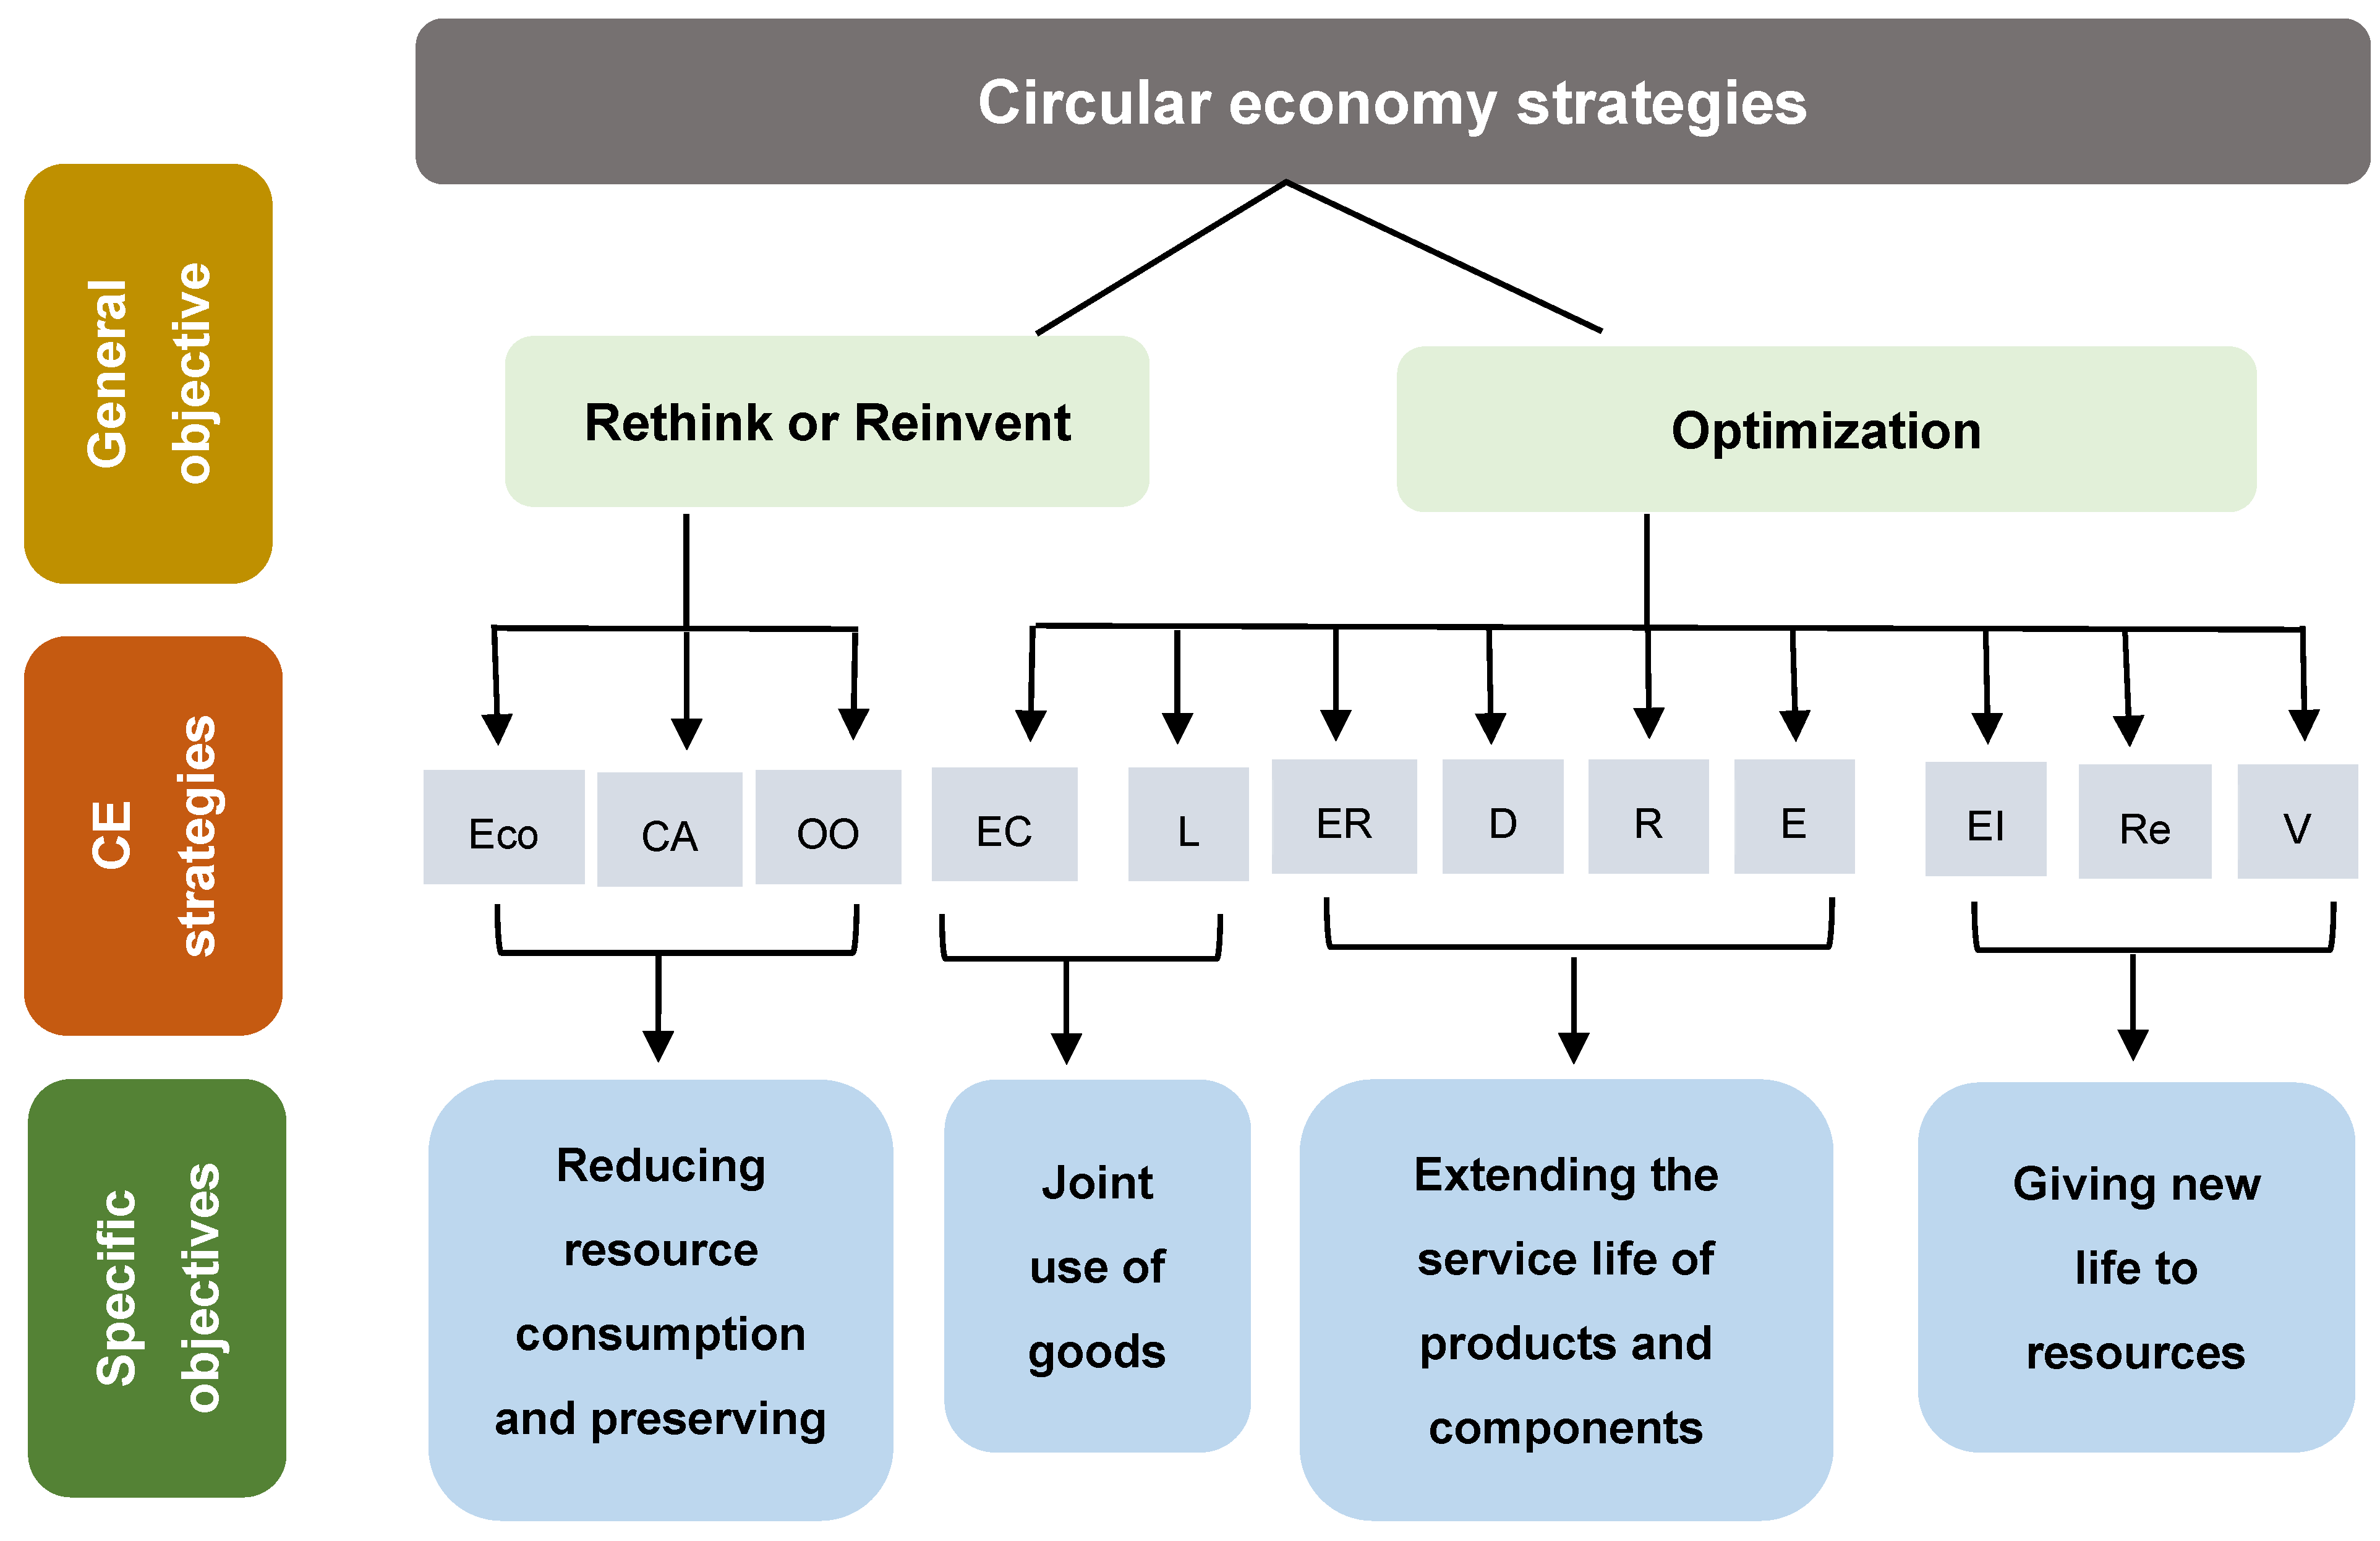
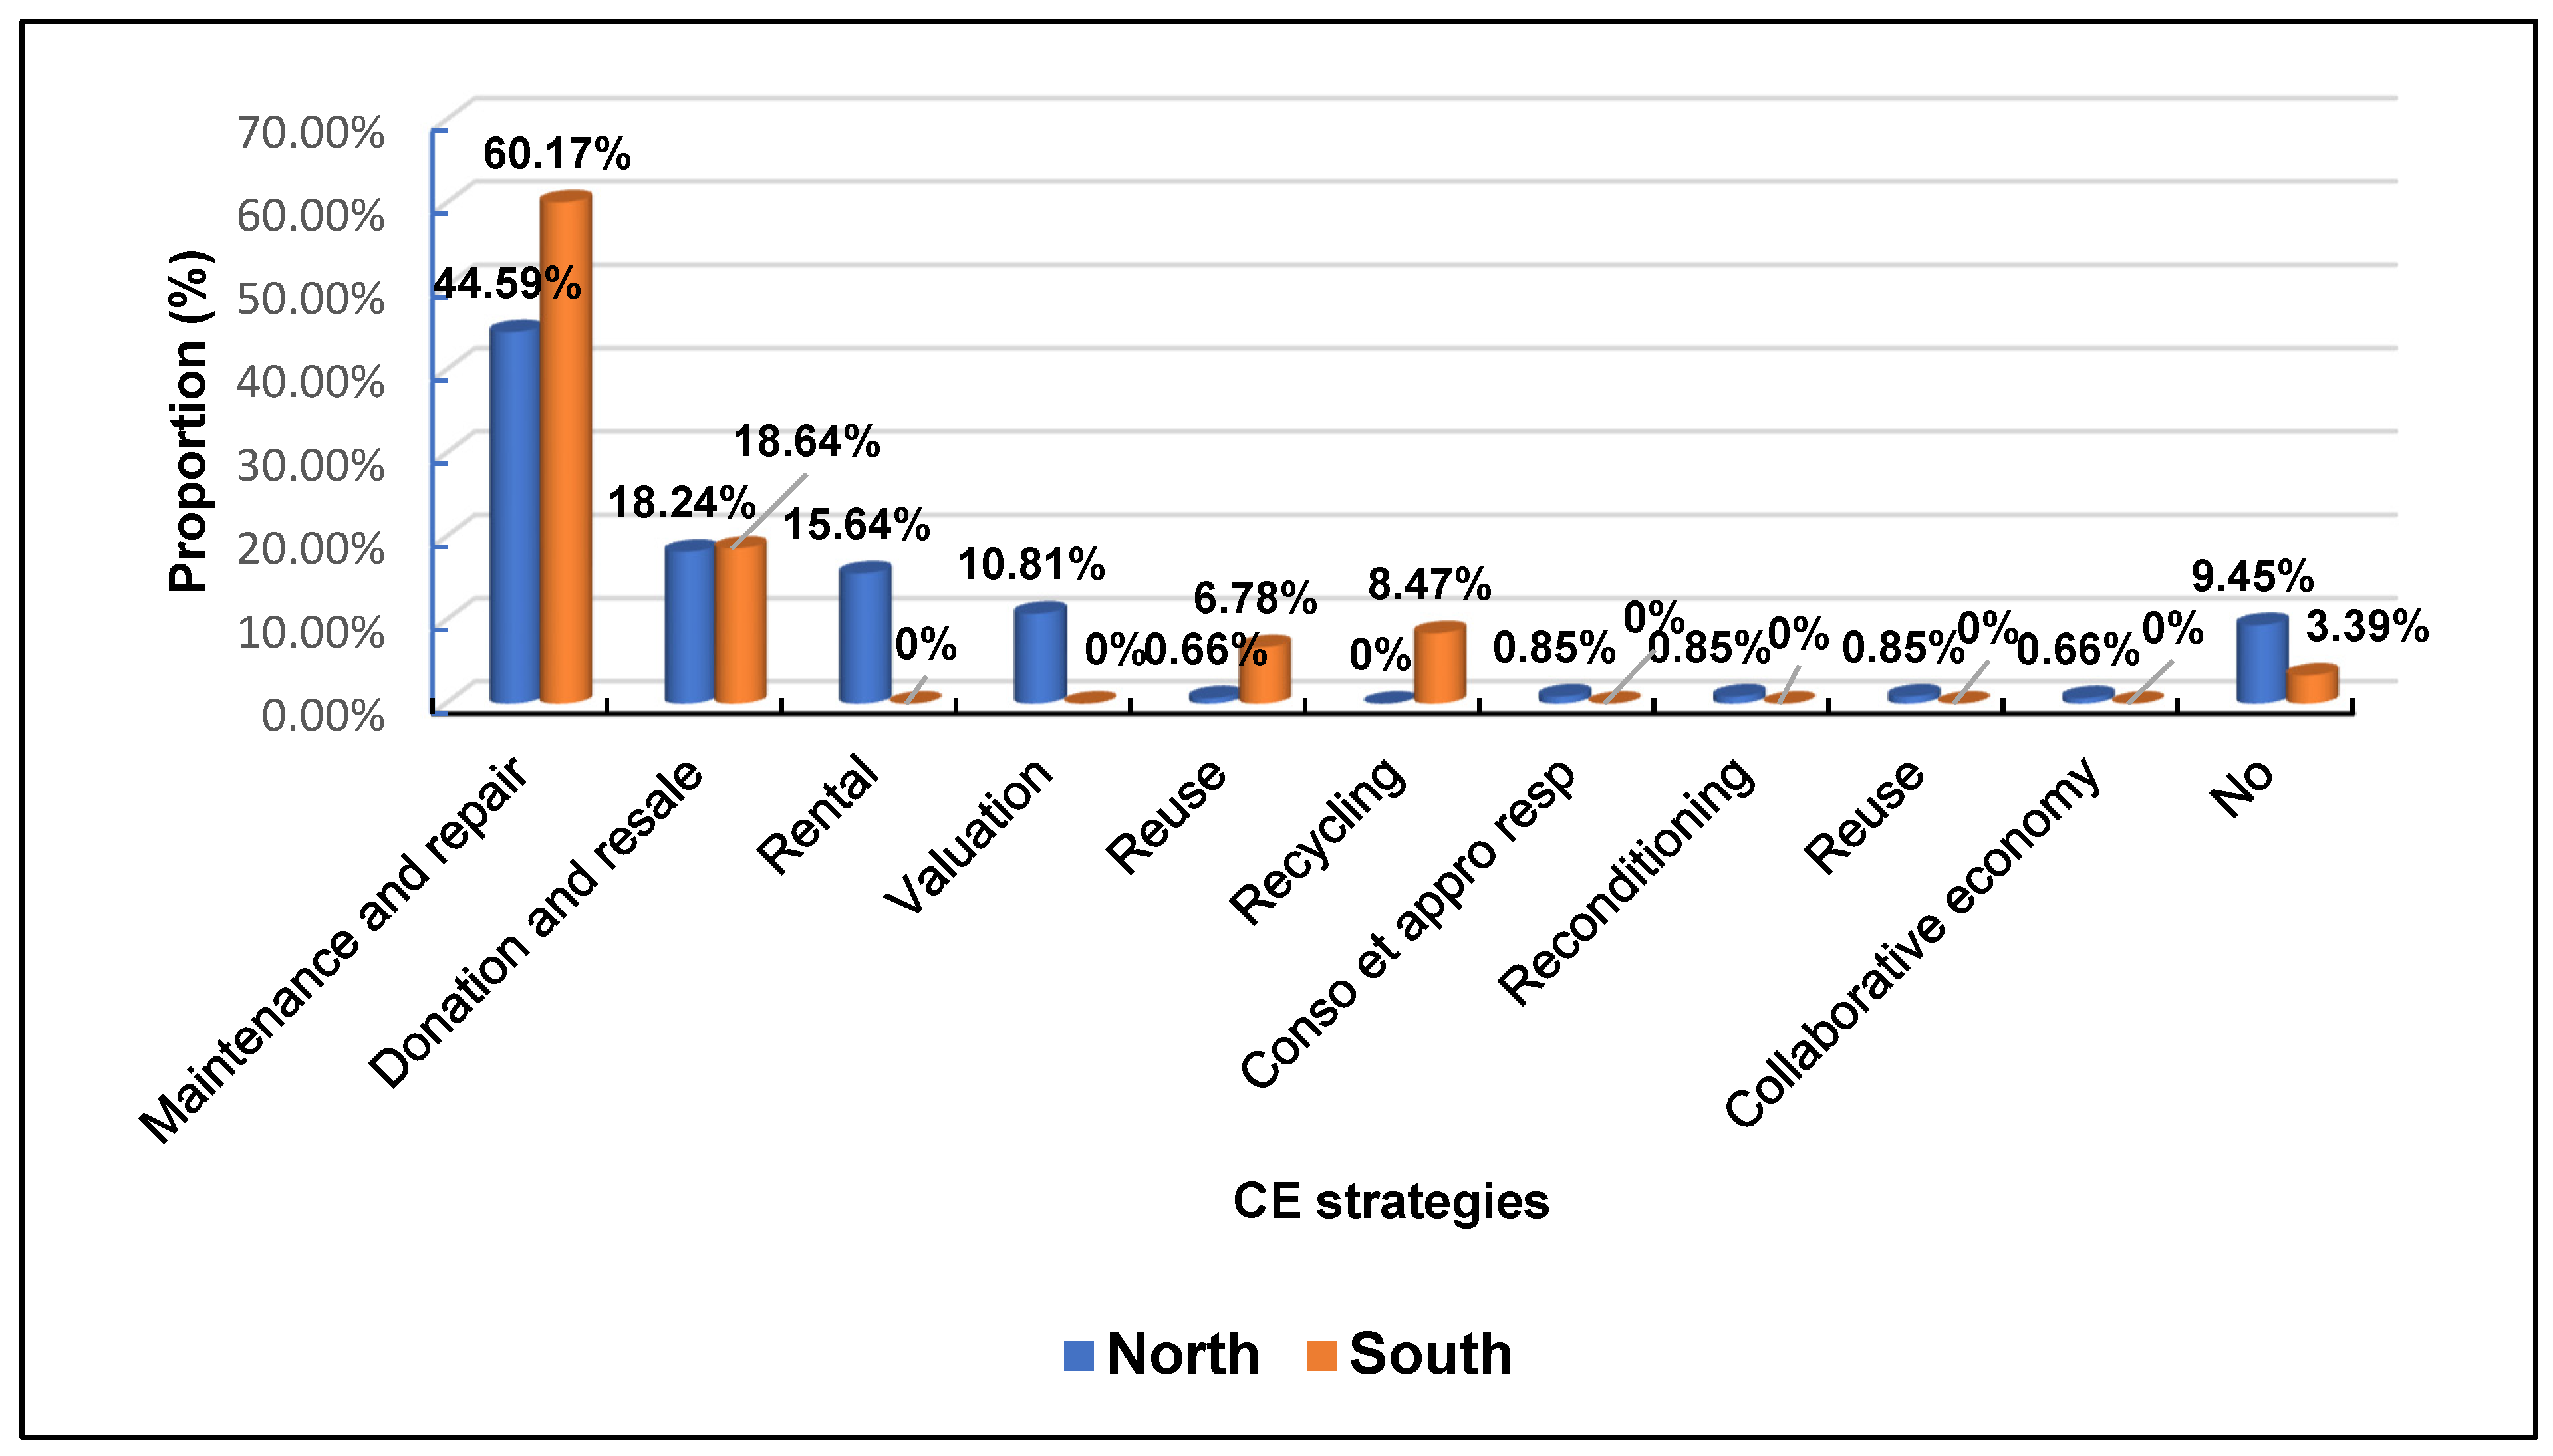
4.3. Circular Economy Strategies Used by Direct Actors

The inventory of practices adopted by direct actors reveals notable differences between the north and south zones. In the south, the most widespread strategies are maintenance and repair (60.17%), donation and resale (18.64%) and recycling (8.47%), all aimed at extending the life of products and minimizing waste (Figure 4). These practices ensure that products are kept in good condition, redistributed or refurbished for reuse. In the north, the most frequently used strategies are maintenance and repair (44.59%), donation and resale (18.24%) and rental (15.54%), which allows goods to be kept in good condition by renting them rather than leaving them unused. The shared emphasis on maintenance, repair, donation and resale in both zones reflects a growing awareness of the importance of extending the life of products and reducing waste. However, the higher prevalence of renting in the north suggests a distinct approach to access to property.
Some strategies show clear regional disparities. In the south, approaches such as the collaborative economy, rental and optimization are absent, while in the north, practices such as reuse and remanufacturing are not used. These differences can be attributed to variations in resource availability, infrastructure and awareness levels among local actors. The absence of innovative strategies such as the collaborative economy and the optimization of operations in both areas provides an opportunity for targeted interventions to promote these practices. Such efforts could foster the use of circular economy strategies and contribute to a broader transition towards sustainable resource management.

4.4. Determinants of the Use of Circular Economy Strategies

4.4.1. Maintenance and Repair

An analysis of the results shows that the model is globally significant at the 1% level (p < 0.01), with a coefficient of determination indicating that 53.56% of the variation in the use of the maintenance and repair strategy is explained by the factors included in the model. Among the key determinants, age is significant, with individuals over 55 years of age showing a greater propensity to use this strategy compared to those aged 18–24 (β = 0.184; p < 0.05) (Table 4). This suggests that older individuals, influenced by experience and social values such as asset conservation, favor extending the life of assets rather than acquiring new ones. Furthermore, experience in using this strategy has a positive effect (β = 0.015; p < 0.01), indicating that familiarity encourages adoption.
Perceived benefits also play a critical role. Respondents who recognize waste minimization (β = 0.167; p < 0.05), an extended lifespan (β = 0.034; p < 0.05), the renewal of goods’ quality (β = 0.202; p < 0.05) and an improved income (β = 0.012; p < 0.05) as benefits of CE are more likely to use the maintenance and repair strategy than those who do not perceive any benefits. Social motivations such as aesthetics (β = 0.246; p < 0.05) and satisfaction with the finished products (β = 0.244; p < 0.05) further encourage use, while a lack of motivation reduces the likelihood of using the strategy. Interestingly, low (β = 0.272; p < 0.05) or moderate (β = 0.386; p < 0.01) access to information paradoxically increases use compared to high access, perhaps due to information overload or distrust of various information sources. Gender also significantly influences use, with men (β = 0.083; p < 0.05) being more likely than women to use this strategy. This highlights the cultural or social norms that shape gender roles in CE practices and underscores the importance of promoting inclusive participation.
Conversely, some factors negatively influence the use of the maintenance and repair strategy. Access to finance has a significant negative impact (β = −0.125; p < 0.05), suggesting that improved financial conditions may encourage actors to purchase new goods rather than repair existing ones. Similarly, producers (β = −0.018; p < 0.05) and processors (β = −0.183; p < 0.05) are less likely to use this strategy than consumers, probably because their attention is focused on production and processing activities. Perceptions of the limitations of CE practices also play a key role. Actors who consider the time requirements for recycling (β = −0.098; p < 0.05) and the loss of quality of recycled goods (β = −0.054; p < 0.05) as obstacles are less likely to use this strategy. This likely reflects concerns about the associated costs or risks.
Finally, income levels influence the use of these strategies. Respondents earning between 200,000 and 300,000 CFA (β = −0.01; p < 0.05) or more than 300,000 CFA (β = −0.123; p < 0.05) are less likely to adopt the strategy compared to those earning less than 50,000 CFA. This suggests that higher income levels increase the preference for replacement over repair, which is consistent with a higher purchasing power.
In summary, the use of maintenance and repair strategies is determined by a complex interaction of economic, social and perceptual factors. Access to resources, personal motivations and perceived benefits are determinants, while financial capacity, professional roles and perceived limitations may hinder the use of these strategies.

4.4.2. Donation and Resale

For the donation and resale strategy, the analysis indicates that the model is globally significant at the 1% level (p < 0.01), with a coefficient of determination showing that approximately 50% of the variables included in the model explain the use of this strategy (Table 4). Like the maintenance and repair strategy, those aged 55 and over are more likely to use the donation and resale strategy compared to those aged 18–24 (β = 0.023; p < 0.05). This reflects the tendency of older actors to renew their assets while contributing to those of others. Furthermore, experience with circular economy (CE) strategies positively influences adoption (β = 0.01; p < 0.05), likely due to a better understanding of the long-term benefits. Perceived benefits play an important role in use. Actors who associate the donation and resale strategy with the extended life of goods (β = 0.185; p < 0.05), improved quality of goods (β = 0.469; p < 0.01) and increased income (β = 0.371; p < 0.05) are more likely to use this strategy compared to those who do not perceive any benefit. These results highlight the importance of tangible benefits in promoting the use of CE strategies.
Income also influences this strategy, with higher income levels favoring use. Positive marginal effects range from β = 0.097 (for incomes >300,000 CFA) to β = 0.218 (for incomes between 200,000 and 300,000 CFA). Interestingly, actors who recognize the limitations of CE, such as the time requirements for recycling (β = 0.485; p < 0.01) and the loss of strength of recycled products (β = 0.413; p < 0.01), are also more likely to use this strategy. High-income actors may prefer to donate or resell goods rather than keep them. As with the maintenance and repair strategy, a paradoxical result emerges regarding access to information. Actors with low (β = 0.196; p < 0.05) or medium (β = 0.22; p < 0.05) access to information are more likely to adopt the gift–resale strategy compared to those with high access. This may reflect a distrust of complex information sources, leading to reliance on more traditional practices such as gifting or resale. However, some factors negatively influence the use of this strategy. For example, processors are less likely to use it compared to consumers (β = −0.098; p < 0.05), probably because they focus on wood processing rather than on the distribution or sale of second-hand goods. Similarly, actors aged 46–54 are less likely to use the strategy (β = −0.045; p < 0.05) compared to those aged 18–24, perhaps due to different priorities or a reluctance to part with assets that retain sentimental or utilitarian value. In contrast, those aged over 55 show a greater propensity to use this strategy, suggesting that age-related motivations and priorities are not linear but vary across life stages.
Comparing the donation–resale strategy with the maintenance and repair strategy, notable differences in motivations emerge. Maintenance and repair are primarily used by individuals seeking to extend the life of assets for their own use, while donation and resale are favored by those who wish to dispose of assets while obtaining economic or social benefits. These differences illustrate the complexity of stakeholder behavior regarding various CE strategies, each influenced by distinct factors.

4.4.3. Responsible Consumption and Sourcing

The Probit model used to identify the determinants of the use of the responsible consumption and procurement strategy is statistically significant at the 1% level (p < 0.01) and indicates that several variables significantly influence the dependent variable (Table 4). The McFadden R² value of 55.37% suggests that approximately 55% of the variation in the use of this strategy is explained by the included factors, highlighting their relevance in understanding stakeholders’ motivations.
The results reveal several significant positive effects. Age is a determining factor, with higher use rates observed among older age groups, particularly those aged 46–54 (β = 0.085; p < 0.01) and 55 and over (β = 0.093; p < 0.05), compared to the 18–24 age group. This may reflect greater experience, greater environmental awareness and a higher propensity to integrate responsible practices among older stakeholders.
Actors with higher monthly incomes, including those earning between 200,000 and 300,000 CFA (β = 0.012; p < 0.1) or more than 300,000 CFA (β = 0.093; p < 0.1), are more likely to use this strategy compared to those earning less than 50,000 CFA. This indicates that financial capacity facilitates openness to sustainable practices.
Vocational training has a significant positive effect (β = 0.365; p < 0.01), suggesting that formal and structured training provides both the knowledge and confidence needed to implement this strategy. In contrast, actors relying on informal community knowledge are less likely to use it.
Household size also influences the use. Households with 3–5 members (β = 0.01; p < 0.05) and those with more than 6 members (β = 0.039; p < 0.05) are more likely to use this strategy than smaller households (<3 members). This result suggests that larger households are more aware of the need to manage resources efficiently to meet their greater demands.
Some factors have a negative impact on the use of this strategy. Access to finance is a notable barrier (β = −0.007; p < 0.05), with actors with access to finance being less likely to use this strategy. This counterintuitive result may indicate that financial stability enables the purchase of new goods, thereby reducing the use of responsible consumption practices.
Producers are less likely to use this strategy than consumers (β = −0.143; p < 0.01), which could reflect producers’ emphasis on production rather than consumption and supply.
Perceptions of limitations in circular economy strategies also hinder the use of this strategy. Actors who perceive the short lifespan of revalued products (β = −0.139; p < 0.01) and the time needed to recondition used goods (β = −0.008; p < 0.05) are less likely to use this strategy than those who do not identify these limitations. This highlights the importance of addressing the perceived costs and barriers to promote the use of this strategy.
Gender also influences use, with men (β = −0.156; p < 0.05) being less likely than women to use this strategy. This may reflect different priorities or perspectives on sustainability based on gender.
The results indicate that the use of a responsible consumption and sourcing strategy is influenced by a combination of demographic (age, household size, gender), economic (income, access to finance) and social (perception of limitations, access to training) factors. Potential barriers, such as negative perceptions of the costs and limitations of the strategy, highlight areas where targeted interventions are needed. This information can inform policies and initiatives to encourage the wider use of circular economy practices among diverse stakeholder groups.

5. Discussion

This study found that circular economy (CE) strategies such as maintenance and repair and donation and resale are the most widely used in Benin, both in the southern and northern regions, corroborating the observations of Geissdoerfer et al. [51], who also highlighted the usefulness of these strategies. Despite the spatial heterogeneity observed in the categories of strategies used from north to south, the results obtained highlight a consistency in local strategies with CE principles. This spatial variation suggests the need to implement approaches that align with the realities of each area to promote a more widespread and effective use of CE strategies, as highlighted by Kirchherr et al. [52].
Furthermore, this spatial variation in the use of strategies is influenced by several socio-economic and environmental factors. Among the social factors, the models have highlighted experience, professional training and age as the most determining elements in the use of CE strategies. Specifically, actors with great experience and older, as well as those who have benefited from professional training, are more open to the use of CE strategies. This observation clearly demonstrates the relevance of the assertions of Kammas [53] and Bonnefoy and Leconte [54], according to which age and experience reinforce an awareness of ecological issues, while promoting the development of behaviors that extend the lifespan of goods and minimize waste. However, several other works, such as that of Hoogendoorn et al. [55] or Bassi and Dias [20], have noted, on the other hand, an absence of a significant influence of age on the use of CE, probably due to the contextual or cultural disparities of the study areas. The positive influence of training has also been noted by several other authors [56,57], who have also highlighted the power of structured education to equip actors with the skills and a level of confidence required to promote the use of sustainable practices.
At the same time, this study also reveals the importance of perceived economic benefits such as waste minimization, lifespan extension and increased income in the use of maintenance, repair, donation and resale strategies. This observation highlights the significant influence of positive perceptions of the cost–benefit ratio of these strategies in the decision-making of actors towards the use of CE principles [58]. In addition to cognitive factors, financial factors are added, reconciling the economic aspect and knowledge as driving elements for the use of circular practices [59].
Furthermore, the positive influence of household size corroborates the observations of Tritto et al. [60], who highlighted that strengthening human resources promotes the capacity of households to invest in sustainability-oriented strategies. In addition to these factors, the results showed that actors with a high income, benefiting from better access to consumer goods, are the least open to the use of CE strategies such as maintenance, repair or responsible consumption. This corroborates the observations of Lima et al. [61] and Guillen-Royo [62] regarding the unsustainable consumption habits of wealthy groups.
This study also shows a positive influence of low access to information on the use of CE strategies such as maintenance, repair, donation and resale. Indeed, although deep communication facilitates the use of strategies such as rental and reconditioning, an overload of information or poorly targeted messages is also perceived as a source of confusion and mistrust [63]. In this context, simple awareness campaigns adapted to the various socio-economic contexts are necessary [64].
Regarding the low openness of producers and processors to adopting CE strategies compared to consumers, this finding could be attributed to the high initial investments required in establishing circular production systems and the financial risks. This is further explained by Konalieva and De Ronge [65] when they state that the move towards a full CE can negatively affect sales, as consumers are generally reluctant to pay high prices for products that they perceive as having a lower value.
Finally, this study highlights the obstacles associated with the use of CE strategies in the Beninese context. Although the use of strategies such as maintenance, repair, donation and resale are the most requested, their use is particularly associated with several socio-economic factors, perceived costs and benefits and many others. Therefore, to encourage the more widespread use of CE strategies, it becomes crucial to take into consideration the main challenges encountered by the different actors and to adjust communication methods.

6. Conclusions

This study highlights the main factors that significantly influence the use of the predominant strategies (maintenance, repair, donation, resale and responsible consumption and procurement) of CE. Among these factors, we find mainly age, experience, perception of the actors regarding the costs and benefits related to each strategy, training and access to information. While some factors (perception) act as catalysts for the adoption of these strategies, others (financial capacity, limited access to financing) hinder their use. To promote the wider use of circular practices, it is essential to take these local specificities into account. Targeted interventions should be implemented, including a targeted and tailored communication strategy that considers the diverse perceptions and motivations of different socio-economic groups. Furthermore, support from public institutions and civil society organizations, both financial and technical (e.g., vocational training), could help stakeholders overcome the existing barriers, thus enabling a smoother transition to circular practices. Future studies could focus on the acceptability of circular economy strategies to ensure their sustainable use and impact.

Author Contributions

Conceptualization, Y.E.M. and N.G.; methodology, Y.E.M. and N.G.; software, Y.E.M. and K.F.D.; investigation, Y.E.M.; resources, N.G.; data curation, Y.E.M. and K.F.D.; writing, Y.E.M., N.G. and K.F.D.; visualization, Y.E.M.; project administration, Y.E.M. and N.G. All authors have read and agreed to the published version of the manuscript.

Funding

This work was supported by the African Model Forest Network (RIFM CLIMAT FY2023/24).

Data Availability Statement

The data supporting the reported results are available and can be obtained upon reasonable request from the corresponding author.

Acknowledgments

The authors are very grateful to the editors and anonymous reviewers for their valuable time and advice on this manuscript.

Conflicts of Interest

The authors declare no conflicts of interest.

References

  1. Govindan, K.; Hasanagic, M. Revue systématique des moteurs, des obstacles et des pratiques en faveur de l’économie circulaire: Une perspective de la chaîne d’approvisionnement. Int. J. Prod. Res. 2018, 56, 278–311. [Google Scholar] [CrossRef]
  2. Khan, S.; Ali, S.S.; Singh, R. Déterminants de l’adoption du reconditionnement pour l’économie circulaire: Un cadre d’évaluation des relations de cause à effet. Appl. Syst. Innov. 2022, 54, 62. [Google Scholar] [CrossRef]
  3. Ali, S.S.; Kaur, R. Efficacité de la responsabilité sociale des entreprises (RSE) dans la mise en œuvre de la durabilité sociale dans l’entreposage des pays en développement: Une approche hybride. J. Clean. Prod. 2021, 324, 129154. [Google Scholar] [CrossRef]
  4. Ghisellini, P.; Cialani, C.; Ulgiati, S. Une revue de l’économie circulaire: La transition attendue vers une interaction équilibrée entre les systèmes environnementaux et économiques. J. Clean. Prod. 2016, 114, 11–32. [Google Scholar] [CrossRef]
  5. Akognongbe, A.; Abdoulaye, D.; Vissin, E.W.; Boko, M. Dynamique de l’occupation du sol dans le bassin versant de l’Oueme à l’exutoire de Bétérou (Bénin). Afrique Science: Rev. Int. Des Sci. Et Technol. 2014, 10, 2. [Google Scholar]
  6. Campos, P.; Mesa, B.; Álvarez, A. Uncovering the hidden numbers of nature in the standard accounts of society: Application to a case study of oak woodland dehesa and conifer forest farms in andalusia-spain. Forests 2021, 12, 638. [Google Scholar] [CrossRef]
  7. FAO. La Situation des Forêts du Monde 2020: Forêts, Biodiversité et Activité Humaine; FAO: Rome, Italy, 2020; 78p. [Google Scholar]
  8. Wobeng, N.B.M.; Banfield, C.C.; Megueni, C.; Mapongmetsem, P.M.; Dippold, M.A. Impact of legumes on soil microbial activity and C cycle functions in two contrasting Cameroonian agro-ecological zones. Pedobiologia 2020, 81, 150662. [Google Scholar] [CrossRef]
  9. Ali, R.K.F. Impacts Socio-économiques et Environnementaux de l’Exploitation des Ressources Ligneuses dans la Commune de Kétou au Sud–est du Benin. Eur. Sci. J. 2023, 19, 170. [Google Scholar]
  10. Alassane, I.; Agassounon, M.B.; Wedjangnon, A.A.; Akin, Y.Y.; Ouinsavi, C.A.I.N. Dynamiques de l’occupation du sol des forêts classées et forêts sacrées de la Commune de Djougou au nord-ouest du Bénin de 2002 à 2022. Mars 2023, 33, 2. [Google Scholar]
  11. Biaou, S.; Gouwakinnou, G.N.; Biaou HS, S.; Tovihessi, M.S.; Awessou, B.K.; Ahononga, F.C.; Houéto, F.O. Identifying the land use and land cover change drivers: Methods and case studies of two forest reserves in Northern Benin. Environ. Dev. Sustain. 2021, 24, 1–21. [Google Scholar] [CrossRef]
  12. Miassi, Y.E.; Dossa, F.K.; Akdemir, Ş.; Gültekin, U. Economics of Teak. In The Teak Genome; Ramasamy, Y., Galeano, E., Win, T.T., Eds.; Compendium of Plant Genomes; Springer: Cham, Switzerland, 2021. [Google Scholar] [CrossRef]
  13. Kalioujny, B. Le modèle de l’économie circulaire dans les systèmes socio-économiques de la filièrebois: Le cas de l’oblast de Tomsk. Economies et finances. Ph.D. Thesis, Université Bourgogne Franche-Comté, Besançon, France, Université polytechnique de Tomsk, Tomsk, Russia, 2021. [Google Scholar]
  14. Debrah, J.K.; Teye, G.K.; Dinis, M.A.P. Barriers and challenges to waste management hindering the circular economy in Sub-Saharan Africa. Urban Sci. 2022, 6, 57. [Google Scholar] [CrossRef]
  15. Bressanelli, G.; Saccani, N.; Perona, M.; Baccanelli, I. Vers une économie circulaire dans l’industrie de l’électroménager: Aperçu des cas. Ressources 2020, 9, 128. [Google Scholar] [CrossRef]
  16. Gusmerotti, N.M.; Testa, F.; Corsini, F.; Pretner, G.; Iraldo, F. Moteurs et approches de l’économie circulaire dans les entreprises manufacturières. J. Clean. Prod. 2019, 230, 314–327. [Google Scholar] [CrossRef]
  17. Kumar, V.; Sezersan, I.; Garza-Reyes, J.A.; Gonzalez, E.D.R.S.; AL-Shboul, M.A. Économie circulaire dans le secteur manufacturier: Avantages, opportunités et obstacles. Décision De Gest. 2019, 57, 1067–1086. [Google Scholar] [CrossRef]
  18. Murray, A.; Skene, K.; Haynes, K. L’économie circulaire: Une exploration interdisciplinaire du concept et de son application dans un contexte mondial. J. Bus. Ethics 2017, 140, 369–380. [Google Scholar] [CrossRef]
  19. Singhal, D.; Tripathy, S.; Jena, S.K. Remanufacturing pour l’économie circulaire: Étude et évaluation des facteurs critiques. Ressour. Conserv. Recycl. 2020, 156, 104681. [Google Scholar] [CrossRef]
  20. Bassi, F.; Dias, J.G. L’utilisation des pratiques d’économie circulaire dans les PME de l’UE. Conserv. Ressour. Recycl. 2019, 146, 523–533. [Google Scholar] [CrossRef]
  21. Calzolari, T.; Genovese, A.; Brint, A. L’adoption de pratiques d’économie circulaire dans les chaînes d’approvisionnement—Une évaluation des entreprises multinationales européennes. J. Clean. Prod. 2021, 312, 127616. [Google Scholar] [CrossRef]
  22. Dey, P.K.; Malesios, C.; Chowdhury, S.; Saha, K.; Budhwar, P.; De, D. Adoption de pratiques d’économie circulaire dans les petites et moyennes entreprises: Données européennes. Int. J. Prod. Econ. 2022, 248, 108496. [Google Scholar] [CrossRef]
  23. Dossa, A.A.; Gough, A.; Batista, L.; Mortimer, K. Diffusion des pratiques d’économie circulaire dans la chaîne d’approvisionnement alimentaire en blé au Royaume-Uni. Int. J. Logist. Res. Appl. 2022, 25, 328–347. [Google Scholar] [CrossRef]
  24. da Silva, F.A.; Simioni, F.J.; Hoff, D.N. Diagnosis of circular economy in the forest sector in southern Brazil. Sci. Total Environ. 2020, 706, 135973. [Google Scholar] [CrossRef]
  25. Desmond, P.; Asamba, M. Accélérer la transition vers une économie circulaire en Afrique: Études de cas du Kenya et de l’Afrique du Sud. In The Circular Economy and the Global South; Routledge: London, UK, 2019; pp. 152–172. [Google Scholar]
  26. Khan, R.; Mihaisi, S.M.K.A. Promouvoir le modèle d’économie circulaire par la croissance des PME: Un focus sur les pays africains. J. Prod. Oper. Manag. Econ. 2023, 3, 40–52. [Google Scholar] [CrossRef]
  27. Otasowie, K.; Aigbavboa, C.; Oke, A.; Adekunle, P. Avantages perçus de l’adoption de l’économie circulaire dans le secteur de la construction en Afrique du Sud. In Proceedings of the 13th International Conference on Engineering, Project, and Production Management, Auckland, New Zealand, 29 November–1 December 2023; Springer: Cham, Switzerland, 2023; Volume 2023a, pp. 709–721. [Google Scholar] [CrossRef]
  28. Allam, Z.; Jones, D.S. Vers une économie circulaire: Une étude de cas sur la conversion des déchets en logements à Cotonou, au Bénin. Urban Sci. 2018, 2, 118. [Google Scholar] [CrossRef]
  29. Gayda, S.V. Determination of the circularity indicator in the forest sector according to the principles of the circular economy. For. For. Pap. Woodwork. Ind. 2023, 49, 99–114. [Google Scholar] [CrossRef]
  30. Farooque, M.; Zhang, A.; Liu, Y. Obstacles aux chaînes d’approvisionnement alimentaire circulaires en Chine. Supply Chain. Manag. Int. J. 2019, 24, 677–696. [Google Scholar] [CrossRef]
  31. Kumar, S.; Raut, R.; Nayal, K.; Kraus, S.; Yadav, V.S.; Narkhede, B.E. Identifier les obstacles à l’adoption de l’industrie 4.0 et de l’économie circulaire dans la chaîne d’approvisionnement agricole en utilisant l’ISM ANP. J. Clean. Prod. 2021, 293, 126023. [Google Scholar] [CrossRef]
  32. Osei, V.; Bai, C.; Asante-Darko, D.; Quayson, M. Évaluation des obstacles et des facteurs favorisant l’adoption de l’économie circulaire pour améliorer la durabilité dans l’industrie minière. Resour. Policy 2023, 86, 104168. [Google Scholar] [CrossRef]
  33. Czermański, E.; Kotowska, I.; Oniszczuk-Jastrząbek, A.; Pluciński, M.; Szaruga, E. Facteurs influençant l’adoption de pratiques d’économie circulaire dans les ports maritimes polonais: Analyse des déterminants et des défis. Front. Mar. Sci. 2024, 11, 1465204. [Google Scholar] [CrossRef]
  34. Kahupi, I.; Yakovleva, N.; Hull, C.E.; Okorie, O. Facteurs influençant l’adoption de l’économie circulaire dans les sociétés minières des économies en développement—Perspective des parties prenantes namibiennes. J. Environ. Manag. 2024, 361, 121214. [Google Scholar] [CrossRef]
  35. Otasowie, K.; Aigbavboa, C.; Oke, A.; Adekunle, P. Facteurs influençant l’adoption de l’économie circulaire dans le secteur de la construction en Afrique du Sud. In Proceedings of the 13th International Conference on Engineering, Project, and Production Management, Auckland, New Zealand, 29 November–1 December 2023; Springer: Cham, Switzerland, 2023; Volume 2023b, pp. 695–707. [Google Scholar] [CrossRef]
  36. Zuofa, T.; Ochieng, E.G.; Ode-Ichakpa, I. Une évaluation des déterminants influençant l’adoption des principes de l’économie circulaire dans les PME de construction nigérianes. Build. Res. Inf. 2023, 51, 69–84. [Google Scholar] [CrossRef]
  37. Rweyendela, A.G.; Kombe, G.G. Influences institutionnelles sur l’économie circulaire: Une perspective tanzanienne. Sustain. Prod. Consum. 2021, 26, 1062–1073. [Google Scholar] [CrossRef]
  38. Banque mondiale. Note sur les Forêts du Bénin; Banque internationale pour la reconstruction et le développement/World Bank: Washington, DC, USA, 2020; pp. 1–84. [Google Scholar]
  39. Miassi, Y.E.; Gélinas, N.; Dossa, K.F. The Circular Economy: A Lever for the Sustainable Development of the Wood and Forestry Sector in West Africa. Forests 2025, 16, 508. [Google Scholar] [CrossRef]
  40. Padonou, E.A.; Agbahoungba, S.; Sewadé, C.; Houngbo, S.B.; Saliou, I.O.; Zannou, A. Valeur des bois-énergie, bois d’œuvre et de service dans les zones de mangroves des sites Ramsar 1017 et 1018 au Bénin. VertigO-La Rev. Électronique Sci. L’environnement. 2023. Available online: https://journals.openedition.org/vertigo/41383 (accessed on 23 January 2025).
  41. Adanguidi, J.; Padonou, E.A.; Zannou, A.; Houngbo, S.B.; Saliou, I.O.; Agbahoungba, S. Fuelwood consumption and supply strategies in mangrove forests-Insights from RAMSAR sites in Benin. For. Policy Econ. 2020, 116, 102192. [Google Scholar] [CrossRef]
  42. Afoudah, O.A.C. Circuit de commercialisation et rentabilité des plantations de teck de l’Office National du Bois (ONAB): Cas de la Lama, Sud Bénin. Master’s Thesis, Laval University, Quebec City, QC, Canada, 2018. [Google Scholar]
  43. Institut de l’Environnement, du Développement Durable et de l’Économie Circulaire (EDDEC). Économie circulaire au Québec. Rapport de l’étape 4: Conclusions et recommandations. In Projet Réalisé par l’Institut EDDEC et Ses Partenaires Institutionnels et Financé par le Ministère de l’Énergie et des Ressources Naturelles; EDDEC: Montreal, QC, Canada, 2018; 96p. [Google Scholar]
  44. Ashford, J.R.; Sowden, R.R. Multi-variate probit analysis. Biometrics 1970, 26, 535–546. [Google Scholar]
  45. Miassi, Y.E.; Dossa, F.K.; Zannou, O.; Akdemir, Ş.; Koca, I.; Galanakis, C.M.; Alamri, A.S. Socio-cultural and economic factors affecting the choice of food diet in West Africa: A two-stage Heckman approach. Discov. Food 2022, 2, 16. [Google Scholar] [CrossRef]
  46. Adegbola, P.Y.; Arouna, A.; Ahoyo, N.R.A. Analyse des facteurs affectant l’adoption des greniers améliorés pour le stockage du maïs au Sud-Bénin. Bull. Rech. Agron. Benin Numero Spécial 2011, 2, 43–50. [Google Scholar]
  47. Tansel, A.; Bircan, F. Demande d’éducation en Turquie: Analyse Tobit des dépenses de soutien scolaire privé. Econ. Educ. Rev. 2006, 25, 303–313. [Google Scholar] [CrossRef]
  48. Kristoffersen, E.; Blomsma, F.; Mikalef, P.; Li, J. L’économie circulaire intelligente: Un cadre de stratégies circulaires numériques pour les entreprises manufacturières. J. Bus. Res. 2020, 120, 241–261. [Google Scholar] [CrossRef]
  49. Schroeder, P.; Anggraeni, K.; Weber, U. La pertinence des pratiques d’économie circulaire pour les objectifs de développement durable. J. Ind. Ecol. 2019, 23, 77–95. [Google Scholar] [CrossRef]
  50. Segarra-Blasco, A.; Teruel, M.; Tomàs-Porres, J. Économie circulaire et politiques publiques: Une analyse dynamique pour les PME européennes. Bus. Strategy Environ. 2024, 33, 3532–3549. [Google Scholar] [CrossRef]
  51. Geissdoerfer, M.; Pieroni, M.P.; Pigosso, D.C.; Soufani, K. Circular business models: A review. J. Clean. Prod. 2020, 277, 123741. [Google Scholar] [CrossRef]
  52. Kirchherr, J.; Reike, D.; Hekkert, M. Conceptualizing the circular economy: An analysis of 114 definitions. Resour. Conserv. Recycl. 2017, 127, 221–232. [Google Scholar] [CrossRef]
  53. Kammas, S. Pratiques de développement durable chez les prestataires logistiques marocains: Quel levier de performance globale? Ph.D. Thesis, Université Paul Valéry-Montpellier III, Montpellier, France, 2015. [Google Scholar]
  54. Bonnefoy, B.; Leconte, J. Acte du Colloque Instituer le Développement Durable: Appropriation, Professionnalisation; Université Paris Ouest Nanterre la Défense: Lille, France, 2007; pp. 1–16. [Google Scholar]
  55. Hoogendoorn, B.; Guerra, D.; van der Zwan, P. What drives environmental practices of SMEs? Small Bus. Econ. 2015, 44, 759–781. [Google Scholar] [CrossRef]
  56. Hobson, K.; Lynch, N.; Lilley, D.; Smalley, G. Systems of practice and the Circular Economy: Transforming mobile phone product service systems. Environ. Innov. Soc. Transit. 2018, 26, 147–157. [Google Scholar] [CrossRef]
  57. Sukiennik, M.; Zybała, K.; Fuksa, D.; Kęsek, M. Le rôle des universités dans les stratégies de développement durable et d’économie circulaire. Énergies 2021, 14, 5365. [Google Scholar] [CrossRef]
  58. Ghisellini, P.; Ulgiati, S. Transition vers l’économie circulaire en Italie. Réalisations, perspectives et contraintes. J. Clean. Prod. 2020, 243, 118360. [Google Scholar] [CrossRef]
  59. Russell, M.; Gianoli, A.; Grafakos, S. Faire avancer les choses: Une étude des facteurs et des obstacles à la mise en œuvre d’initiatives d’économie circulaire ascendantes à Amsterdam et Rotterdam. J. Environ. Plan. Manag. 2020, 63, 1903–1926. [Google Scholar] [CrossRef]
  60. Tritto, N.; Dias, J.G.; Bassi, F. Pratiques d’économie circulaire des PME dans l’Union européenne: Implications multi-niveaux pour la durabilité. Soc. Indic. Res. 2024, 175, 965–988. [Google Scholar] [CrossRef]
  61. Lima, P.A.; Jesus, G.M.; Ortiz, C.R.; Frascareli, F.C.; Souza, F.B.; Mariano, E.B. Le développement durable comme liberté: Tendances et opportunités pour l’économie circulaire dans la littérature sur le développement humain. Sustainability 2021, 13, 13407. [Google Scholar] [CrossRef]
  62. Guillen-Royo, M. Réaliser le ‘dividende du bien-être’: Une étude exploratoire utilisant l’approche du développement à l’échelle humaine. Ecol. Econ. 2020, 70, 384–393. [Google Scholar] [CrossRef]
  63. Metzger, M.J.; Flanagin, A.J. Credibility and trust of information in online environments: The use of cognitive heuristics. J. Pragmat. 2013, 59, 210–220. [Google Scholar] [CrossRef]
  64. Demestichas, K.; Daskalakis, E. Information and communication technology solutions for the circular economy. Sustainability 2020, 12, 7272. [Google Scholar] [CrossRef]
  65. Konalieva, S.; De Ronge, Y. Quels sont les obstacles réels auxquels les entreprises font face dans le but d’intégrer l’économie circulaire dans leurs modes de fonctionnement? Master’s Thesis, Université catholique de Louvain, Ottignies-Louvain-la-Neuve, Belgium, 2021. Available online: http://hdl.handle.net/2078.1/thesis:31252 (accessed on 11 January 2025).
Figure 1. Map of the study area (Benin).
Environments 12 00101 g001
Figure 2. Circular economy strategies. Source: Inspired by EDDEC [43]. Eco = Eco-Design; CA = Responsible Consumption and Purchasing; OO = Operations Optimization; EC = Collaborative Economy; L = Leasing; ER = Maintenance and Repair; D = Donation and Resale; R = Reconditioning; E = Functionality Economy; EI = Industrial Ecology; Re = Recycling; V = Valorization.
Environments 12 00101 g002
Figure 3. Distribution of actors interviewed by zone.
Environments 12 00101 g003
Figure 4. CE strategies developed by direct actors, by zone. Source: Field data [39].
Environments 12 00101 g004
Table 1. Description of variables to use in models.
VariablesDescriptionAbbreviationUnitExpected Effect
Dependent variables
Y 1 Strategy 1 (Maintenance and Repair)ER--
Y 2 Strategy 2 (Donation and Resale)DR--
Y 3 Strategy 3 (Responsible Consumption and Purchasing)ConsoAR--
Independent variables
1. Socio-demographic and economic characteristics
AgeAge of actorsAgeYear+/−
ExperienceYears of experienceExpYear+/−
GenderActor’s genderSex0 = F; 1 = M +
InformationAccess level toNews0 = None; 1 = Low; 2 = Average; 3 =+
Household sizeNumber of people living in the householdSize0 = 0 to 2; 1 = 3 to 5, 2 = 6 and+/−
PlayersType of actor (consumer, producer, processor)ActorsNominal variable (1 = Consumer; 2 = Producer; 3 = Transformer)
CreditAccess to financingCred0 = No; 1 = Yes +
IncomeAverage annual income (in thousands)Inco0 = 0 − 50; 1 = 50 − 100; 1 = 100 − 200, 2 = 200 − 300, 3= ≥300 +
2. Perception (Motivation, Limits, Benefits, Sources of Ideas)
MotivationMotivations behind the use of strategiesMotiv0 = None; 1 = Other +
BoundariesLimits identified in relation toLimit0 = None; 1 = Others (considered factors) + /
BenefitsBenefits attributed to strategiesAvtg0 = None; 1 = Others (considered factors) +
SourcesSources of ideasSource1 = Communities, 2 = Parenting, 3 = Training; 4 = Personal Inspiration + /
Table 2. Characterization of direct actors.
CharacteristicsSouth ZoneNorth ZoneTotal
AlladaCalaviCotonouPorto NoTotal SouthParakouN’DaliTotal North
Respondent-specific characteristics: % (number)
Age
(years)
<184.17 (1)0.0 (0)0.0 (0)0.0 (0)0.85 (1)7.48 (11)0.0 (0)7.43 (11)4.51 (12)
18–248.33 (2)5.88 (3)0.0 (0)0.0 (0)4.24 (5)7.48 (11)0.0 (0)7.43 (11)6.01(16)
25–3425.0 (6)31.37 (16)10.71 (3)40.0 (6)26.27 (31)6.12 (9)0.0 (0)6.08 (9)15.04 (40)
35–4433.33 (8)31.37 (16)32.14 (9)20.0 (3)30.51 (36)14.97 (22)0.0 (0)14.86 (22)21.80 (58)
46–5425.0 (6)25.49 (13)46.4 (13)20.0 (3)29.66 (35)58.5 (86)100 (1)58.78 (87)45.9 (122)
≥554.17 (1)5.88 (3)10.71 (3)13.33 (2)7.63 (9)1.36 (2)0.0 (0)1.35 (2)4.13 (11)
No answer0.0 (0)0.0 (0)0.0 (0)6.67 (1)0.85 (1)4.08 (6)0.0 (0)4.05 (6)2.63 (7)
GenderMen83.33 (20)94.12 (48)82.14 (23)80.0 (12)87.29 (103)97.28 (143)100 (0)97.3 (144)92.86 (247)
Women16.67 (4)5.88 (3)17.86 (5)20.0 (3)12.71 (15)2.72 (4)0.0 (0)2.7 (4)7.14 (19)
Household size0–28.33 (2)7.84 (4)0.0 (0)13.33 (2)6.78 (8)12.93 (19)0.0 (0)12.84 (19)10.15 (27)
3–533.33 (8)78.43 (40)75.0 (21)60.0 (9)66.1 (78)46.26 (68)0.0 (0)45.95 (68)54.88 (146)
≥658.33 (14)13.73 (7)25.0 (0)26.67 (4)27.12 (32)40.82 (60)100 (1)41.22 (61)34.96 (93)
Average monthly income
(thousands CFA)
0–5050.0 (12)3.92 (2)3.57 (1)26.67 (4)16.10 (19)7.48 (11)0.0 (0)7.43 (11)11.28 (30)
50–10016.67 (4)39.22 (20)46.43 (13)40.0 (6)36.44 (43)73.47 (108)0.0 (0)72.97 (108)56.76 (151)
100–20016.67 (4)45.1 (23)39.29 (11)26.67 (4)35.59 (42)15.65 (23)100 (1)16.22 (24)24.81 (66)
200–3004.17 (1)9.80 (5)7.14 (2)6.67 (1)7.63 (9)2.72 (4)0.0 (0)2.7 (4)4.88 (13)
≥30012.5 (3)1.96 (1)3.57 (1)0.0 (0)4.24 (1)0.68 (1)0.0 (0)0.68 (1)2.25 (6)
Source: Field data (July 2024).
Table 3. Characterization of companies.
FeaturesSouth Zone: % (Number)North Zone: % (Number)Total: % (Number)
AlladaCalaviCotonouPorto NoTotal SouthParakouN’DaliTotal North
Actor typeC62.50 (15)25.49 (13)35.71 (10)53.33 (8)38.98 (46)38.78 (57)0.0 (0)38.51 (57)38.72 (103)
P0.0 (0)39.22 (20)28.57 (8)13.33 (2)25.42 (30)33.33 (49)100 (1)33.78 (50)30.07 (80)
T37.5 (9)35.29 (18)35.71 (10)33.33 (5)35.59 (42)27.89 (41)0.0 (0)27.70 (41)31.2 (83)
Company statusSF100.0 (2)59.09 (26)63.16 (12)0.0 (0)55.56 (40)31.11 (28)0.0 (0)30.77 (28)41.72 (68)
IF0.0 (0)40.91 (18)36.84 (7)100 (7)44.44 (32)68.89 (62)100 (1)69.23 (63)58.28 (95)
Company status by player typeSFP0.0 (0)50.0 (13)50.0 (6)0.0 (0)47.5 (19)46.43 (13)0.0 (0)46.43 (13)47.06 (32)
T100.0 (2)50.0 (13)50.0 (6)0.0 (0)52.5 (21)53.57 (15)0.0 (0)53.57 (15)52.94 (36)
IFP0.0 (0)38.89 (7)28.57 (2)28.57 (2)34.38 (11)58.06 (36)100 (1)58.73 (37)50.53 (48)
T0.0 (0)61.11 (11)71.43 (5)71.43 (5)65.62 (21)41.94 (26)0.0 (0)41.27 (26)49.47 (47)
Share capital (thousands of CFA)0–10011.11 (1)15.79 (6)0.0 (0)28.57 (2)12.5 (9)13.33 (12)0.0 (0) 13.19 (12)12.88 (21)
100–30033.33 (3)39.47 (15)44.44 (8)42.86 (3)40.28 (29)45.56 (41)0.0 (0) 45.05 (41)42.94 (70)
300–80044.44 (4)42.11 (16)50.0 (9)28.57 (2)43.06 (31)37.78 (34)100 (1)38.46 (35)40.49 (66)
>80011.11 (1)2.63 (1)5.56 (1)0.0 (0)4.17 (3)3.33 (3)0.0 (0) 3.30 (3)3.68 (6)
Company size0–40.0 (0)57.89 (22)72.22 (13)57.14 (4)54.17 (39)33.33 (30)100 (0)34.07 (31)42.94 (70)
5–1066.67 (6)36.84 (14)22.22 (4)42.86 (3)37.50 (27)60.0 (54)0.0 (0)59.34 (54)49.69 (81)
11–200.0 (0)5.26 (2)5.56 (1)0.0 (0)4.17 (3)6.67 (6)0.0 (0)6.59 (6)5.52 (9)
≥2133.33 (3)0.0 (0)0.0 (0)0.0 (0)4.17 (3)0.0 (0)0.0 (0)0.0 (0)1.84 (3)
Number of years in business0–311.11 (1)5.26 (2)16.67 (3)0.0 (0)8.33 (6)17.78 (16)0.0 (0)17.58 (16)13.49 (22)
4–866.67 (6)28.95 (11)0.0 (0)42.86 (3)27.78 (20)7.78 (7)0.0 (0)7.69 (7)16.56 (27)
9–120.0 (0)21.05 (8)11.11 (2)14.29 (1)15.28 (11)30.0 (27)0.0 (0)29.67 (27)23.31 (38)
≥1322.22 (2)44.74 (17)72.22 (13)42.86 (3)48.61 (35)44.44 (40)100 (0)45.05 (35)46.62 (76)
Access to informationNull0.0 (0)0.0 (0)22.22 (4)14.29 (1)6.94 (5)76.67 (69)100 (0)76.92 (70)46.01 (75)
Weak0.0 (0)21.05 (8)11.11 (2)28.57 (2)16.67 (12)20.0 (18)0.0 (0)19.78 (18)18.40 (30)
Average0.0 (0)78.95 (30)44.44 (8)57.14 (4)58.33 (42)3.33 (3)0.0 (0)3.3 (3)27.61 (45)
High100 (9)0.0 (0)22.22 (4)0.0 (0)18.06 (13)0.0 (0)0.0 (0)0.0 (0)7.97 (13)
Foreign partnersYes100 (9)0.0 (0)0.0 (0)0.0 (0)12.5 (9)10.0 (9)0.0 (0)9.89 (9)11.04 (18)
No0.0 (0)100 (38)100 (18)100 (7)87.50 (63)90.0 (81)100 (1)90.11 (82)88.96 (145)
CreditYes88.89 (8)36.84 (14)94.44 (17)71.43 (5)61.11 (44)43.33 (39)0.0 (0)42.86 (39)50.92 (83)
No11.11 (1)63.16 (24)5.56 (1)28.57 (2)38.89 (28)56.67 (51)100 (1)57.14 (52)49.07 (80)
C = Consumer; P = Producer; T = Processor; SF = Formal enterprise; SI = Informal enterprise; Total = Total. Source: Field data (July 2024).
Table 4. Estimation of the bivariate Probit model on the use of CE strategies.
FactorsMaintenance/RepairDonation/ResaleResponsible Consumption and Sourcing
Coeff (Standard Deviation)pCoeff (Standard Deviation)pCoeff (Standard Deviation)p
Age: reference “18–24”
[0–18]−0.042 (0.16)0.795−0.146 (0.15)0.3270.0 (0.001)0.99
[25–34]−0.005 (0.11)0.9620.039 (0.11)0.7160.283 (0.08)0.212
[35–44]0.01 (0.11)0.929−0.052 (0.11)0.630.164 (0.04)0.332
[46–54]−0.04 (0.11)0.04 **−0.045 (0.11)0.012 **0.085 (0.03)0.003 ***
≥550.184 (0.18)0.045 **0.023 (0.14)0.041 **0.093 (0.09)0.028 **
Experience in using CE strategies
Experience0.015 (0.124)0.000 ***0.01 (0.004)0.023 **0.001 (0.003)0.839
Advantage: “None” reference
Limit deforestation−0.055 (0.24)0.8180.726 (5.98)0.903----
Minimize waste0.167 (0.13)0.021 **0.211 (0.16)0.201----
Extended lifespan0.034 (0.12)0.024 **0.185 (0.17)0.026 **----
Quality renewal0.202 (0.12)0.03 **0.469 (0.17)0.005 ***----
Income0.012 (0.12)0.038 **0.371 (0.17)0.027 **----
Motivations: reference “None
Aesthetic0.246 (0.14)0.028 **--------
Finished products0.244 (0.13)0.021 **--------
Access to information: “high” reference
Weak0.272 (0.13)0.036 **0.196 (0.12)0.011 **----
AVERAGE0.386 (0.12)0.001 ***0.22 (0.11)0.045 **----
Null0.196 (0.13)0.1380.11 (0.12)0.383----
Gender: “Female” reference
Men0.083 (0.08)0.031 **0.039 (0.09)0.682−0.156 (0.09)0.012 **
Access to financing: reference “No”
Yes−0.125 (0.056)0.029 **−0.084 (0.05)0.126−0.007 (0.04)0.046 **
Actor: Reference to “Consumers”
Producer−0.018 (0.07)0.03 **0.089 (0.07)0.174−0.143 (0.05)0.004 ***
Processor−0.183 (0.08)0.031 **−0.098 (0.08)0.029 **−0.06 (0.06)0.298
Limits: reference “None”
Short lifespan0.304 (3.13)0.923−0.369 (0.91)0.685−0.139 (0.03)0.000 ***
Lack of processing equipment0.048 (0.158)0.757−0.37 (1.19)0.757−0.139 (0.08)0.491
Requires time−0.098 (0.079)0.025 **0.485 (0.1)0.000 ***−0.006 (0.05)0.024 **
Loss of strength−0.054 (0.07)0.046 **0.413 (0.1)0.000 ***0.024 (0.07)0.597
Order discount0.308 (1.03)0.7650.03 (0.15)0.836−0.045 (0.07)0.587
Average monthly income (in thousands of FCFA): reference “[0–50]”.
[50–100]0.096 (0.07)0.2070.123 (0.09)0.2170.028 (0.06)0.624
[100–200]0.028 (0.08)0.7140.192 (0.09)0.032 **0.025 (0.06)0.688
[200–300]−0.01 (0.11)0.02 **0.218 (0.13)0.029 **0.012 (0.11)0.041 **
>300−0.123 (0.16)0.044 **0.097 (0.18)0.048 **0.148 (0.17)0.039 **
Source of ideas: “Community” reference
Parents’ education0.079 (0.08)0.417−0.164 (0.11)0.130.064 (0.05)0.207
Training0.405 (0.08)0.000−0.151 (0.11)0.1840.365(0.09)0.0001 ***
Personal inspector0.04 (0.11)0.7080.022 (0.11)0.845−0.026 (0.05)0.576
Household size: reference “0–3”
[3–5]−0.118 (0.08)0.1560.128 (0.09)0.1770.01 (0.07)0.036 **
≥60.038 (0.08)0.6450.017 (0.1)0.8670.039 (0.08)0.028 **
Validity tests
McFadden R² (%)53.5649.4755.37
Durbin–Watson1.87 (tending towards 2)1.671.72
Number of observations266266266
Forest chi2(20)180.09179.4674.61
Probably > chi21.028e–20 ***1.93e–22 ***4.29e−07 ***
Save−78.08−91.63−68.14
** and *** represent 10%, 5% and 1% significance level, respectively; standard error in parentheses. Source: Field data (July 2024).
Disclaimer/Publisher’s Note: The statements, opinions and data contained in all publications are solely those of the individual author(s) and contributor(s) and not of MDPI and/or the editor(s). MDPI and/or the editor(s) disclaim responsibility for any injury to people or property resulting from any ideas, methods, instructions or products referred to in the content.

