Article

Comparison of Uranium Leachability Between Three Groundwater Aquifers in Relation to the Degree of Bedrock Weathering: A Petro-Mineralogical and Experimental Investigation

1
Department of Geoenvironmental Sciences, Kongju National University, Gongju 32588, Republic of Korea
2
Department of Geology and Research Institute of Natural Science (RINS), Gyeongsang National University, Jinju 52828, Republic of Korea
3
Soil and Groundwater Research Division, National Institute of Environmental Research, Incheon 22689, Republic of Korea
*
Authors to whom correspondence should be addressed.
Environments 2025, 12(11), 415; https://doi.org/10.3390/environments12110415
Submission received: 18 September 2025 / Revised: 27 October 2025 / Accepted: 30 October 2025 / Published: 3 November 2025

Abstract

The concentrations of natural radioactive elements in the groundwater environment are regulated by several factors, including aquifer geology, groundwater hydrochemical properties, and changes in environmental conditions. Many studies have explored these factors, but few have systematically elucidated the mechanisms underlying the dissolution of radioactive elements from their host minerals into groundwater. This study investigated the petrological, mineralogical, and weathering properties of aquifer materials and their effects on the leaching of uranium (U) and thorium (Th) into groundwater. The time required for the U concentration to reach the drinking water standard (30 μg/L) was estimated through artificial weathering experiments performed under diverse environmental conditions. Rock core samples were obtained from three sites differing in their geology and groundwater U concentrations. Mineralogical analyses revealed that thorite, a representative radioactive mineral that contains large amounts of U and Th, was present in samples from all collection sites. Thorite minerals differed in terms of their sizes, shapes, cracks, and chemical compositions between samples from different sites, indicating that geological features, mineral alteration characteristics, and environmental conditions controlled the behavior of U and Th. These factors appear to play crucial roles in regulating the mobility and potential long-term leachability of U and Th. Artificial weathering experiments confirmed that a neutral pH with surplus bicarbonate ions favored U leaching. Under these environmental conditions, aquifer U concentrations were estimated to require 8.7–226 years to reach the drinking water standard, depending on the groundwater dissolved oxygen content. Our results provide scientific evidence that may be used for managing radioactive elements in the groundwater environment, and are likely to inform new environmental policies and regulatory standards.

Graphical Abstract

1. Introduction

Uranium (U) originates primarily from diverse accessory minerals such as monazite, coffinite, and uraninite, and the dissolution of these U-bearing minerals can lead to groundwater contamination [1,2]. High U levels in potable groundwater can cause health problems related to the chemical and radiological risks of U exposure [3]. In 2011, the World Health Organization established a guideline maximum U concentration of 30 μg/L for drinking water, which the Korean Ministry of Environment also adopted in 2019.
From 2007 to 2018, Korea conducted nationwide surveys of naturally occurring radioactive materials, including U and radon (Rn), in 4980 public groundwater wells; the U concentrations of 176 wells (3.5%) were found to exceed the drinking water standard (30 μg/L) [4]. Abnormally high concentrations of U (sample numbers 29,906, range n.d—2646 μg/L, average 3.5 μg/L, mean 0.4 μg/L, standard deviation 34.1 μg/L) and Rn (sample numbers 29,906, range n.d.—2096 Bq/L, average 93.2 Bq/L, mean 53.7 Bq/L, standard deviation 124.7 Bq/L) were identified in granite geology [4], and their distribution appeared irregular even within the same host rocks [1,5]. Korean governmental authorities have surveyed private wells for potable groundwater since 2021; the first-year results revealed that 148 of 7036 wells exceeded the drinking water standard by 2.1% [2]. Surveys have also consistently revealed that the areas in which U concentrations exceeded the drinking water standard were associated with Jurassic granite and Precambrian metamorphic geology [1,2,6,7].
Groundwater quality and geochemistry are generally affected by the geological and physicochemical features of the source aquifer. For example, high U levels in private groundwater wells in Northern Ireland appear to originate from a granite terrace, the upper part of which contained carbonate glacial sediments [8]. In the Goesan region of Korea, excess U in drinking water appears to originate from the dissolution of U-bearing minerals, such as monazite along rock fractures in biotite granites [9]. Groundwater U concentrations are primarily controlled by the solubility of the host minerals, as shown in a recent study of U leaching from monazite and uraninite [1,2]. Groundwater properties, such as pH, oxidation-reduction potential (Eh), and carbonate species concentrations also affect groundwater U concentrations [10], as well as aquifer properties, such as connectivity to the ground surface and fractural features. Therefore, dissolved U concentrations in groundwater are controlled by several factors, including aquifer properties, groundwater chemistry, and the physicochemical properties of U-bearing minerals and their host rocks [9,11,12]. Still, the groundwater U enrichment processes remain poorly understood. Recent studies have emphasized that uranium and thorium contamination in groundwater systems is influenced not only by mineral dissolution but also by complex interactions among redox conditions, organic matter, and groundwater residence time [13]. Such findings further highlight the importance of evaluating geochemical and environmental factors controlling U/Th mobility, as addressed in this study.
Therefore, this study explored the origin and dissolution mechanisms of U in groundwater by investigating the effects of U host rock weathering features and groundwater properties, including pH, dissolved oxygen (DO), and carbonate species on groundwater U concentrations. The dissolution kinetics of U were then inferred from experimental results.

2. Materials and Methods

2.1. Geology of the Study Area and Sampling Methods

The study area features the Gyeonggi Massif, which comprises the basement rock of the Korean Peninsula, and the Yeongnam Massif, which is primarily composed of Precambrian (Neoarchean and Paleoproterozoic) rock. Mesozoic (Jurassic) granite intrudes the basement rock in various locations [14,15]. Many groundwater wells within regions characterized by Precambrian metamorphic rock and Jurassic granite have U concentrations exceeding the drinking water standard (30 μg/L) with some reaching up to 390 ± 48 μg/L [4].
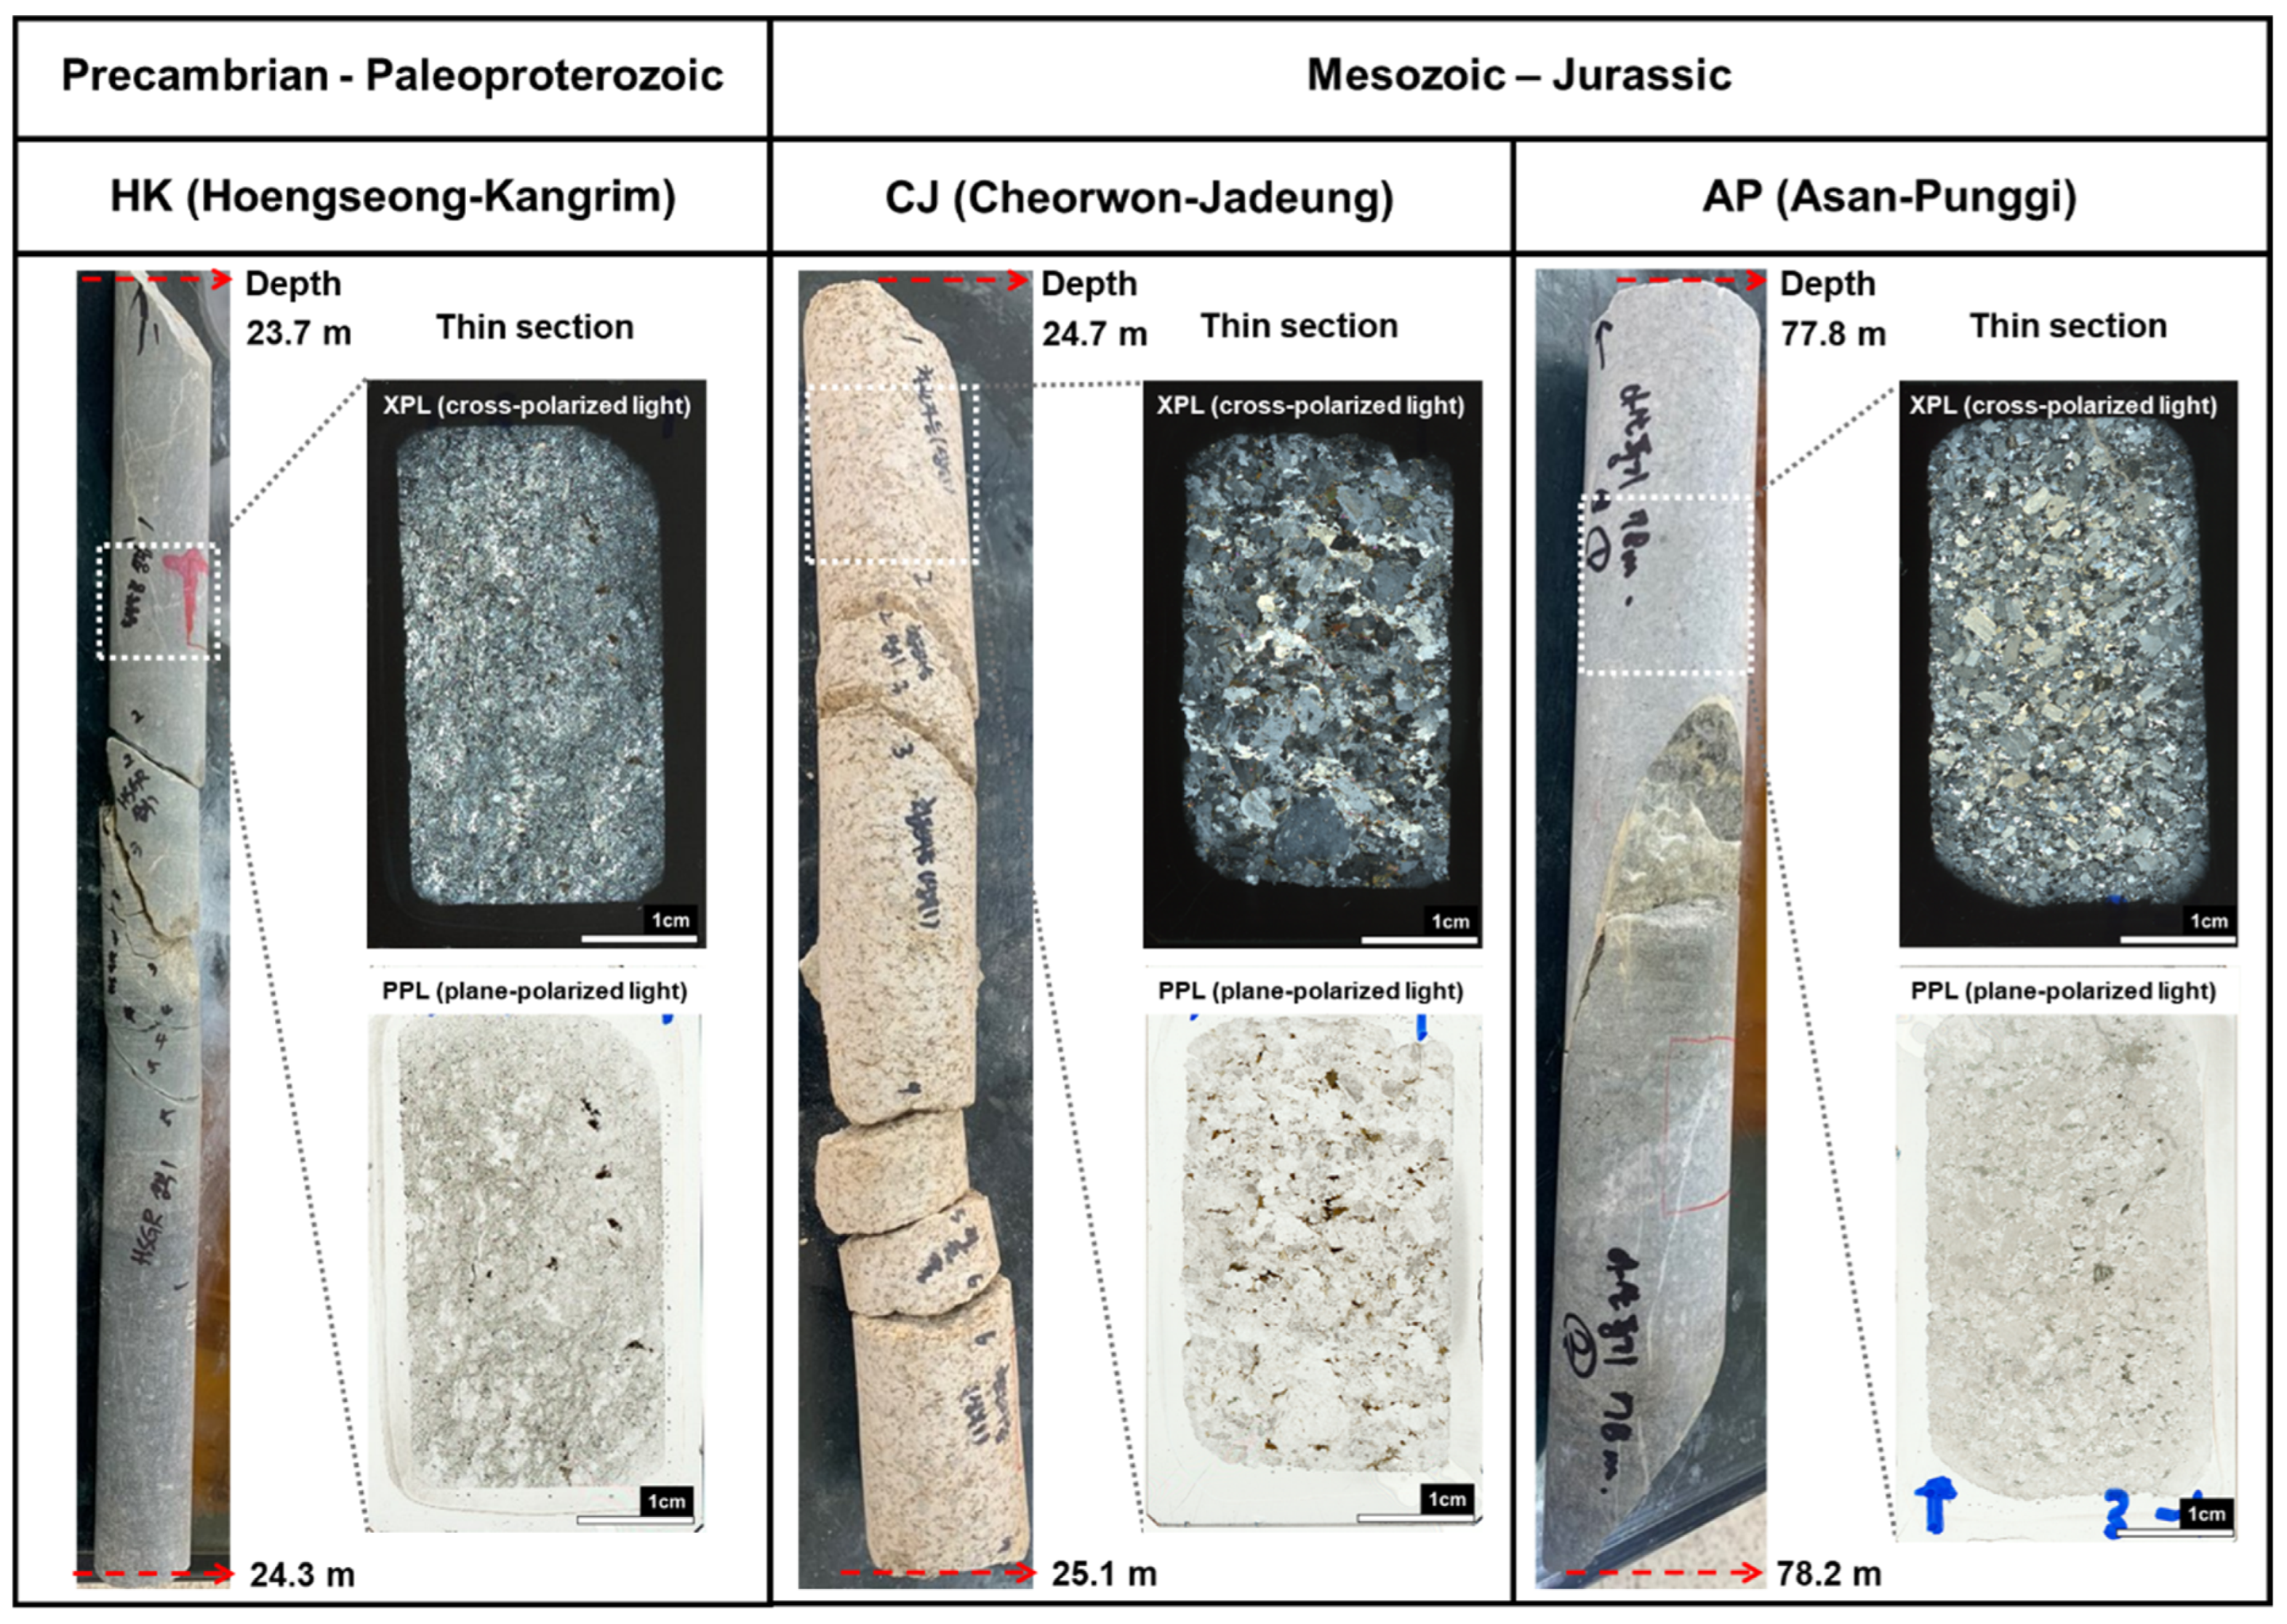
Target rock samples were obtained from drilling cores collected from three separate aquifers. One aquifer was located within Precambrian rock, and the others were within Mesozoic (Jurassic) granite (Figure 1). These three areas were selected because the distributions of uranium and radon concentrations differ among them. Drilling core depths were determined based on naked-eye examination of the core; joints and fractures were examined closely because such sections are more likely to include U-bearing minerals. The U concentrations in groundwater from two sampled aquifers exceeded the drinking water standard. The first rock sample was collected from the Hoengseong-Kangrim (HK; 37°21′49″ N 128°07′36″ E) area, where the groundwater U concentration was measured at 414.4 μg/L (Table 1) in a 30-m-deep groundwater well located in the Precambrian Chiaksan gneiss complex (CGC). This granitic gneiss rock sample was obtained from a drilling core section with a depth of 23.7–24.3 m (Figure 2). The sample was leucocratic, with small calcite veins and well-developed joints. Thin sections and pulverized samples were prepared for mineralogical analyses and artificial weathering experiments. The second sample was obtained from a core collected from the Cheorwon-Jadeung (CJ; 38°09′52″ N 127°24′55″ E) area, where the groundwater U concentration was measured at 12.03 μg/L (Table 1) in a 30-m-deep groundwater well in the Jurassic Cheorwon biotite granite (CBGr). This biotite granite sample was obtained from a core section with a depth of 24.7–25.1 m (Figure 2). Intensive weathering of the sample was observed with the naked eye, while biotite chloritization was not observed. The third sample was obtained from a core collected from Jurassic Asan porphyritic granite (APGr) in the Asan-Punggi (AP; 36°46′11” N 127°01′15” E) region, where the groundwater U concentration was measured at 174.7 μg/L (Table 1) in an 80-m-deep groundwater well. This porphyritic granite sample was obtained from a core section with a depth of 77.8–78.2 m (Figure 2). Although it was collected from the greatest depth among the three samples, most of the plagioclase phenocrysts and biotite minerals in this sample appeared to be chloritized, indicating intensive weathering of the host rock body.

2.2. Analytical Methods

2.2.1. Sample Preparation

Thin sections were prepared to identify U-bearing minerals and characterize the U distribution. For the mineralogical analyses, drilling core samples from each site were pulverized using a ball mill (no. 8000D; SamplePrep BM-450 Mixer/Mill, Cole-Parmer, Vernon Hills, IL, USA).

2.2.2. Mineralogical Analyses

A polarizing microscope (Leica DM 2700P, Leica Microsystems, Wetzlar, Germany) was used for naked-eye observations of the texture, structure, and weathering degree of minerals in thin sections of the core samples. The weathering degree of each sample was evaluated according to alteration of feldspar and mica, which are particularly vulnerable to weathering, using plane- and cross-polarized light under a polarizing microscope. The mineralogical composition of each sample was measured using X-ray diffraction (XRD) (D8 Advance A25, Bruker, Billerica, MA, USA). A nickel filter was used for XRD analyses at an acceleration voltage of 40 kV, current of 40 mA, 2θ range of 4–90°, and a step size of 0.02°/57.3. Qualitative and quantitative mineral composition analyses were conducted using the EVA v3.1 and TOPAS programs, respectively. The chemical composition of each core sample was analyzed using an X-ray fluorescence (XRF) spectrometer (S8 TIGER, Bruker, Madison, WI, USA).
Among granite and granitic gneiss that contain abundant radioactive elements, accessory minerals include monazite, allanite, sphene, thorite, and zircon. It is difficult to distinguish between these minerals, so we ensured precise identification of these minerals and their micro-structures using secondary electron images from a field-emission scanning electron microscope (SEM) with a heating stage (Apreo S, Thermo Fisher Scientific, Waltham, MA, USA). The chemical compositions of minerals within the samples were analyzed by energy-dispersive X-ray detection at a beam energy of 15 kV, beam resolution of 0.5 nm, accelerative current of 1 nA, and focal distance of 65 mm.
To analyze mineralogical phases and their micro-structures, we obtained backscatter electron (BSE) images using a field-emission electron probe micro analyzer (EPMA) (JXA-8530F, JEOL, Tokyo, Japan). Wavelength dispersive X-ray spectroscopy (WDS) was used for quantitative analyses of minerals containing radioactive elements, including U and thorium (Th), at a beam energy of 15 kV, beam resolution of 3 μm, and accelerative current of 5 nA. Both U and Th belong to the actinium group, exhibit similar behavior, and coexist in diverse minerals, including zircon, monazite, and ilmenite.

2.2.3. Geochemical Analyses

Total U and Th contents were measured following the methods of Balaram and Subramanyam [17], with modifications. Briefly, 0.5-g powder samples were placed in a polytetrafluorethylene; a 10-mL sample of strong acid blended with HF-HNO3-HCl (7:3:2 ratio) was then added and the tube was heated at 110 °C for 48 h to completely evaporate the acid. A 10-mL solution was prepared by mixing distilled water and 36% HNO3 (1:1 ratio) and then introduced into the residual solid; the mixture was heated to 70 °C until it was completely dissolved. The total volume was adjusted to 10 mL by adding distilled water, and the prepared solution samples were analyzed using inductively coupled plasma-mass spectrometry (ICP-MS) (NexION 2000, PerkinElmer, Waltham, MA, USA) for radioactive elements (U and Th). Rare earth elements (REEs) scandium (Sc), yttrium (Y), lanthanum (La), cerium (Ce), praseodymium (Pr), neodymium (Nd), samarium (Sm), europium (Eu), gadolinium (Gd), terbium (Tb), dysprosium (Dy), holmium (Ho), erbium (Er), thulium (Tm), ytterbium (Yb), and lutetium (Lu) were also analyzed because they are geochemically coherent with U and Th.

2.2.4. Groundwater Analysis

Groundwater samples were obtained from wells in each area using a submerged pump after purging for more than 10 min. A portable multi-parameter meter (ProQuatro, YSI, Yellow Springs, OH, USA) was used for in-field measurements of groundwater properties, including temperature, pH, EC, Eh, and DO. Carbonate species concentrations were measured in the field using an acid titration method to prevent the release of carbon dioxide into the atmosphere [18].
Groundwater samples used for cationic analyses were pretreated with concentrated nitric acid after filtration through a 0.45-μm membrane. Samples used for anionic measurements were filtered without the addition of nitric acid. Concentrations of magnesium (Mg), potassium (K), sodium (Na), calcium (Ca), and silicon (Si) cations were analyzed using ICP-optical emission spectrometry (BRO Avio 500, PerkinElmer, Waltham, MA, USA). Anionic concentrations of fluorine (F), chlorine (Cl), sulfate (SO4), and nitrate (NO3) were measured using ion chromatography (IC) (ICS-1100 Aquion, Thermo Fisher Scientific, Waltham, MA, USA). The cationic analysis results were used to determine the hydrochemical facies of each groundwater sample with Aquachem v.4.0 software (Waterloo Hydrogeologic, ON, Canada) (Table 1).

2.3. Weathering Experiments

Core samples from each aquifer were powdered for artificial weathering experiments. Conventional rock weathering experiments based on native rock forms typically require longer than 1 year to complete and primarily focus on abrasion and fracture characteristics. Because this study focused on the leaching of the natural radioactive elements, U and Th, from host rocks, we used pulverized rock samples under extreme conditions in our weathering experiments, which allowed us to accelerate the weathering of U-bearing minerals. For these artificial weathering experiments, we mixed 3 g of powdered rock sample with 40-mL reactive (weathering) solution. In considering the volume of vials used in the experiments and total sampling times of 6, the ratio of solid (powdered rock sample) to liquid (reactive solution) was designed to be 3:40 to keep the ratio larger than 1:5. The total experimental period was 60 days and solution samples were collected at six timepoints for U and Th concentration analysis: at 1, 3, 5, 10, 30, and 60 days. It is likely that natural systems weather over decades with solid rock, so the leaching rates observed might differ in situ. In particular, the weathering conditions were assumed to be constant using finely powdered material, but real aquifers might respond differently, perhaps slower due to diffusion in intact rock, etc., and these are thought to be the limitations of this study. Determining the optimal chemical properties of the weathering solutions first requires identification of the main factors affecting weathering U-host minerals. Based on a literature review, we selected three factors as major environmental factors for weathering experiments: pH, DO, and Ca and carbonate species concentrations [10,19]. First, the pH was altered to simulate acidic and neutral environments using two pH conditions (3 and 7). The pH of the weathering solutions was adjusted using 0.1 M HCl and 1.0 M NaOH. Second, the effects of redox conditions were investigated by simulating oxidizing and reducing conditions with DO values of 8.0 and 0.0 mg/L, obtained by continuous purging with air and nitrogen gas, respectively, shown in the Supplementary Material (SM) (Figure S1a). Serum bottles were used to prevent oxygen from entering the system under simulated reducing conditions (Figure S1b). Third, Ca and carbonate species concentrations were adjusted to a natural level (ionic strength 0.01 M) and a 10-fold higher level (0.1 M) using analytical-grade NaH(CO3)2 and Ca(NO3)2 in background solution of deionized water. For ICP-MS analyses of U and Th concentrations, 4-mL aliquots of solution were collected six times and filtered with 0.45-μm cellulose acetate filters. We also analyzed pH and the concentrations of Si, Sr and selected REEs (Sc, Y, La, Ce, Sm and Eu) because these elements are present in higher concentrations in U-bearing minerals than the other rare earth elements [20]. Correlations between the concentrations of radioactive elements (U and Th) and REEs throughout the experimental period were evaluated using the Pearson product moment correlation method in Sigmaplot program (version 14.0).
Based on the experimental results, weathering kinetics were evaluated using pseudo-zero-order, pseudo-first-order, pseudo-second-order, Elovich, parabolic diffusion, and power function kinetic models [21], as listed in Table S1. These models are typically used to interpret adsorption reactions, but can also be used for dissolution reactions [22]. The pseudo-zero-order, pseudo-first-order, and pseudo-second-order models were used to obtain kinetic constants, and the remaining three models (Elovich, parabolic diffusion, and power function) were used to explore the reaction mechanism [22,23,24,25]. Regression analysis for all six models was conducted in a consistent manner. Coefficients of determination (R2) were estimated to identify the most appropriate models, and these were used to calculate kinetic constants, which were then applied to determine the time required for the groundwater U concentration to reach the drinking water standard (30 μg/L). To clarify all the steps of the study, the whole procedure is given in Figure 3.

2.4. Quality Assurance and Quality Control

Quality assurance/control (QA/QC) was conducted to acquire the reliability of the analyses of major, minor, and trace elements for the groundwater samples and simulated weathering solutions. The certificated standard materials used for checking accuracy and precision were IV-26 s source (INORGANIC VENTURES, Christiansburg, VA, USA) for ICP-optical emission spectrometry, Combined Seven Anion Standard II (Thermo Fisher Scientific, Waltham, MA, USA) for IC, and PerkinElmer Multi-element Calibration Standard 2 & 3 (PerkinElmer, Waltham, MA, USA) for ICP-MS. The data used in the results showed 100 ± 10% accuracy and 0 ± 10% precision. Notably, the limit of detection (LOD) and limit of quantification (LOQ) of each instrumental analysis were determined at the levels of ppb and ppt according to the method type, and they were evaluated to ensure the relevance of each analytical purpose. Finally, based on the results of QA/QC, all the data were confirmed to be reliable for hydrogeochemical interpretations.

3. Results and Discussion

3.1. Petro-Mineralogical Features

Naked eye observations revealed that CJ samples had significantly more fractures than those in HK samples, while those in AP samples had fewest fractures (Figure 2). Our results revealed that linear structures, such as faults and fractures, are distributed in the order HK ≥ CJ >> AP, which is generally consistent with data obtained from a geological map of the study area and the previous studies [26,27].
Mineral alterations were examined using a polarizing microscope to compare the degrees of weathering between core samples from each area. HK samples exhibited the chloritization of most mafic minerals, including biotite and amphibole, as well as significant plagioclase sericitization (Figure S2). HK samples had the greatest degree of weathering among the three sites. AP samples had some sericitization and chloritization of plagioclase and biotite (Figure S2), indicating an intermediate degree of weathering. Despite numerous fractures in the CJ sample, mineral alteration was not clearly detected, and polarizing microscope observations revealed slight alterations of plagioclase and biotite (Figure S2), suggesting a relatively low degree of weathering. Among sampling sites, the degree of weathering appeared to increase in the order CJ < AP < HK.
Fractures and faults in parental rocks act as critical pathways facilitating weathering reactions in radioactive minerals. A higher frequency of linear structures in host rocks increases the potential for water-rock interactions. Although weathering rates are not directly related to the alteration of compositional minerals and the frequency of linear structures, faults and fractures allow fluids to penetrate more deeply into the host rock.
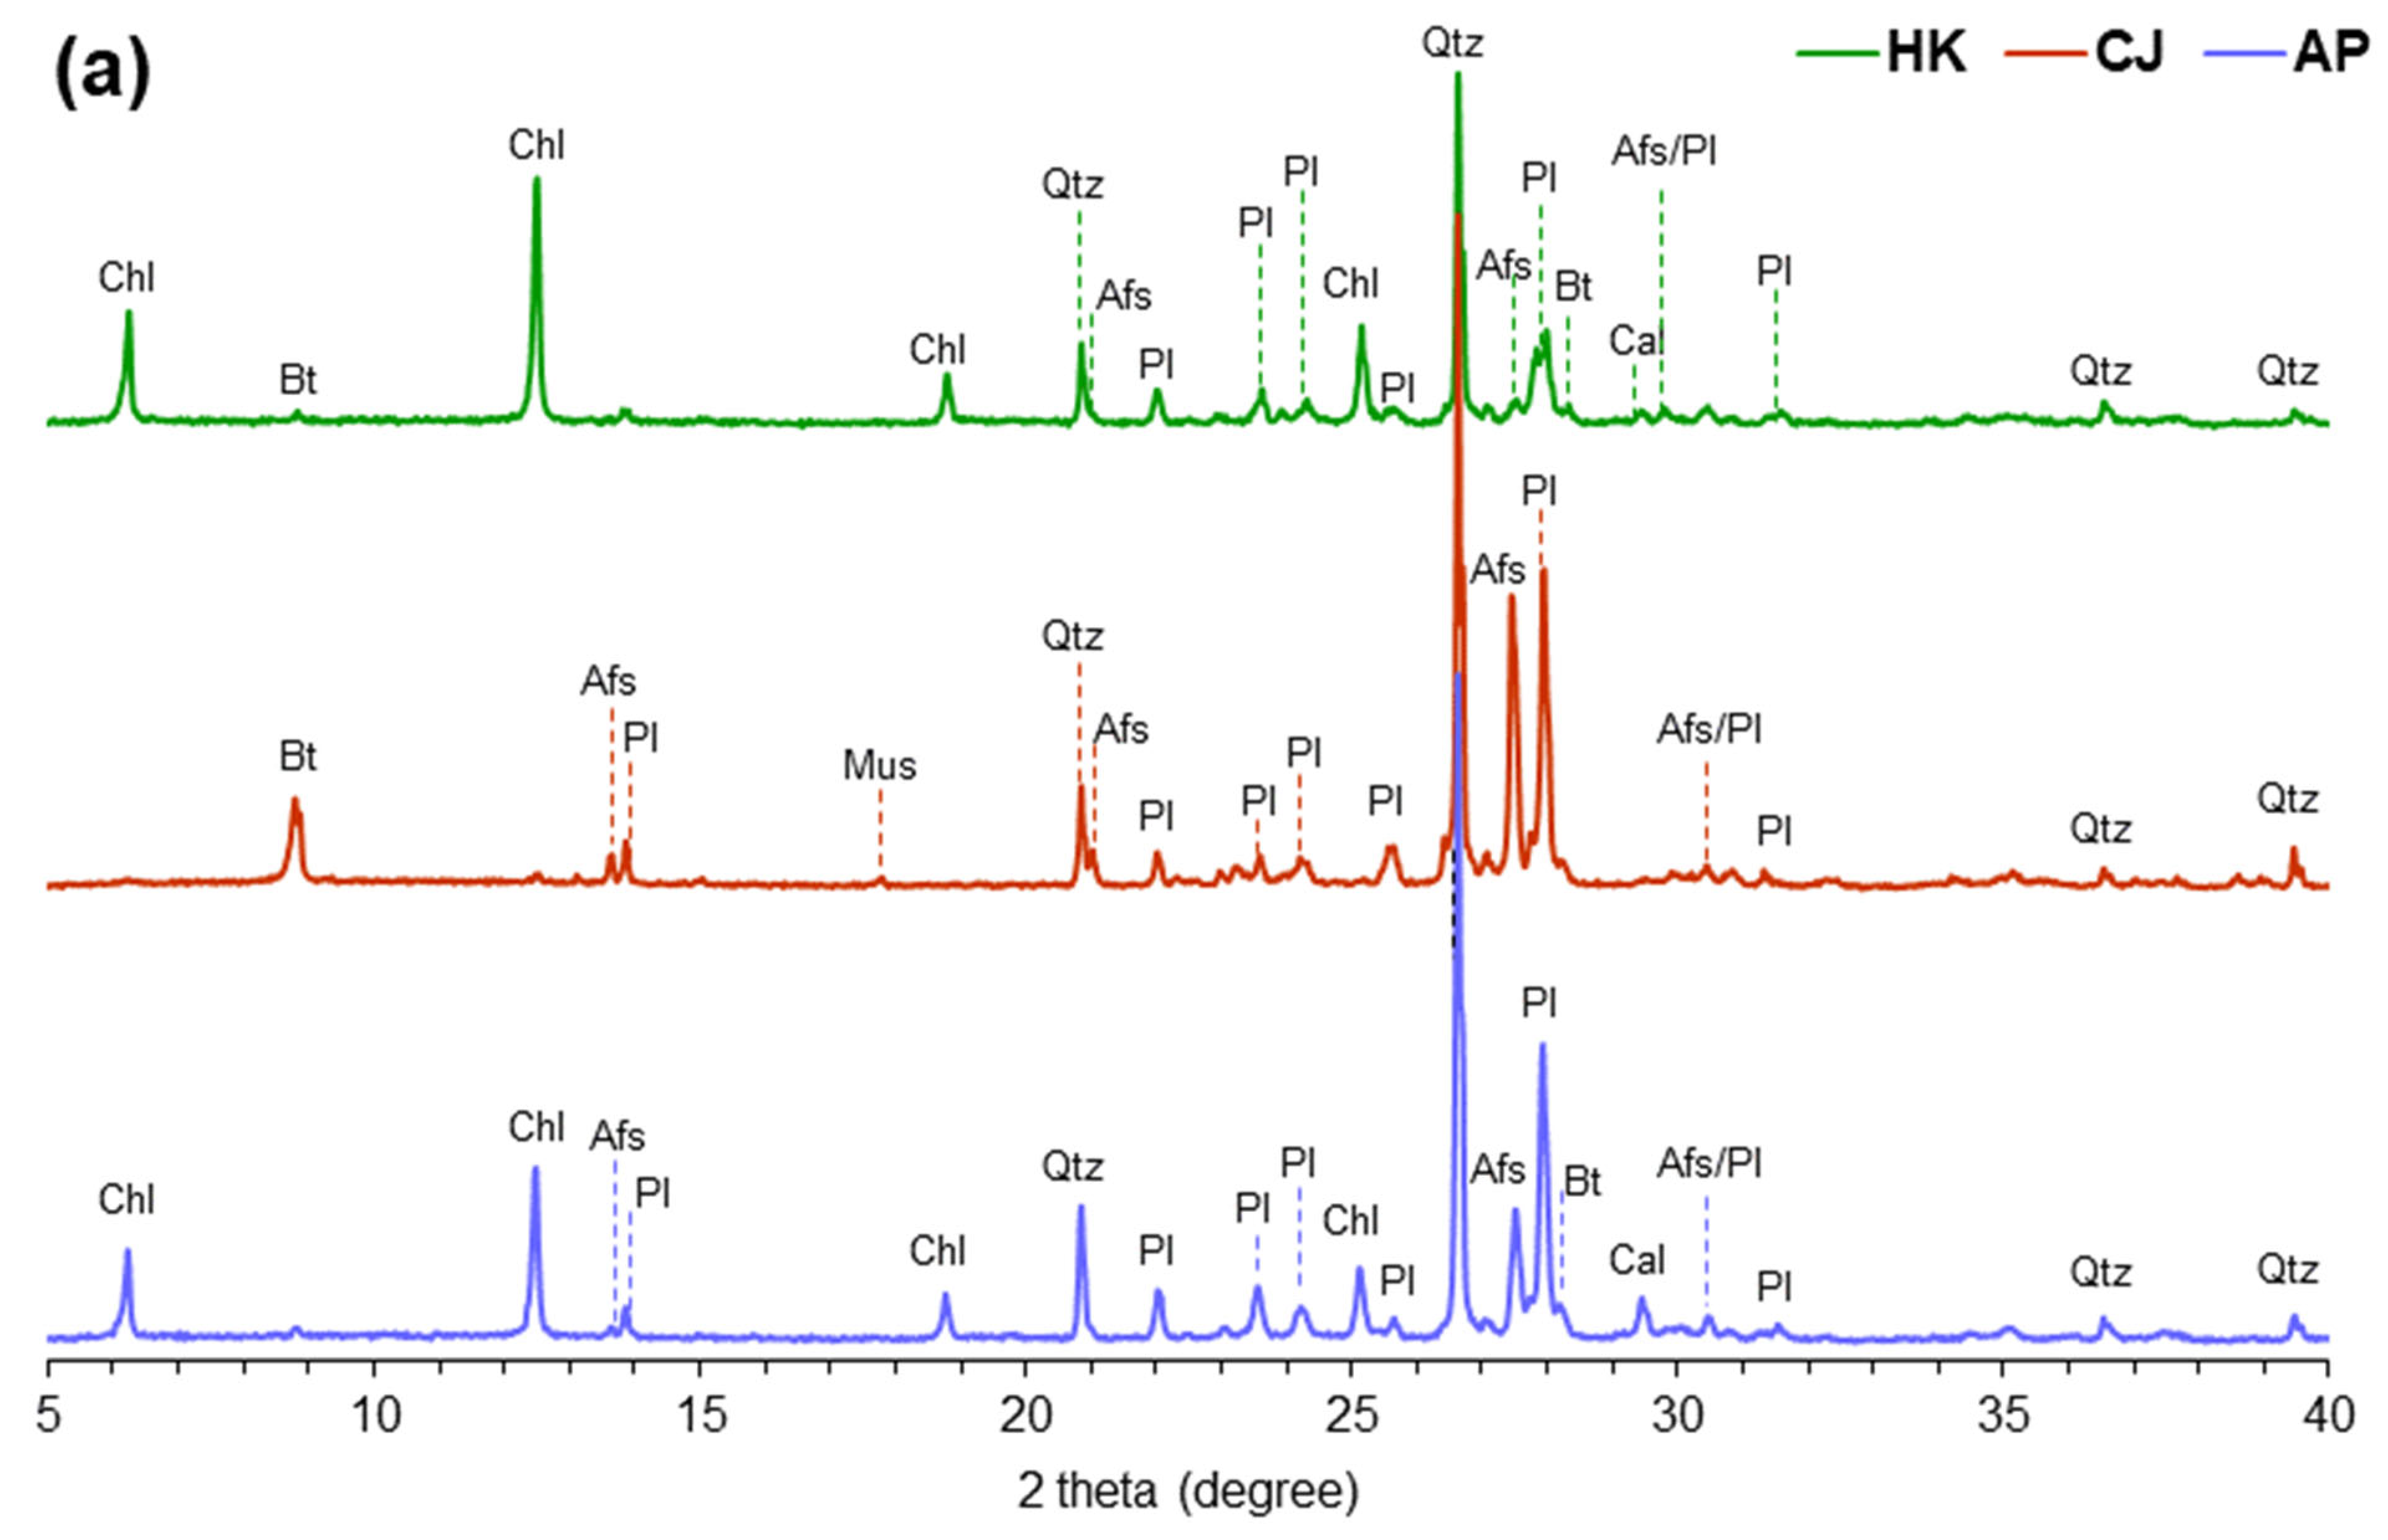
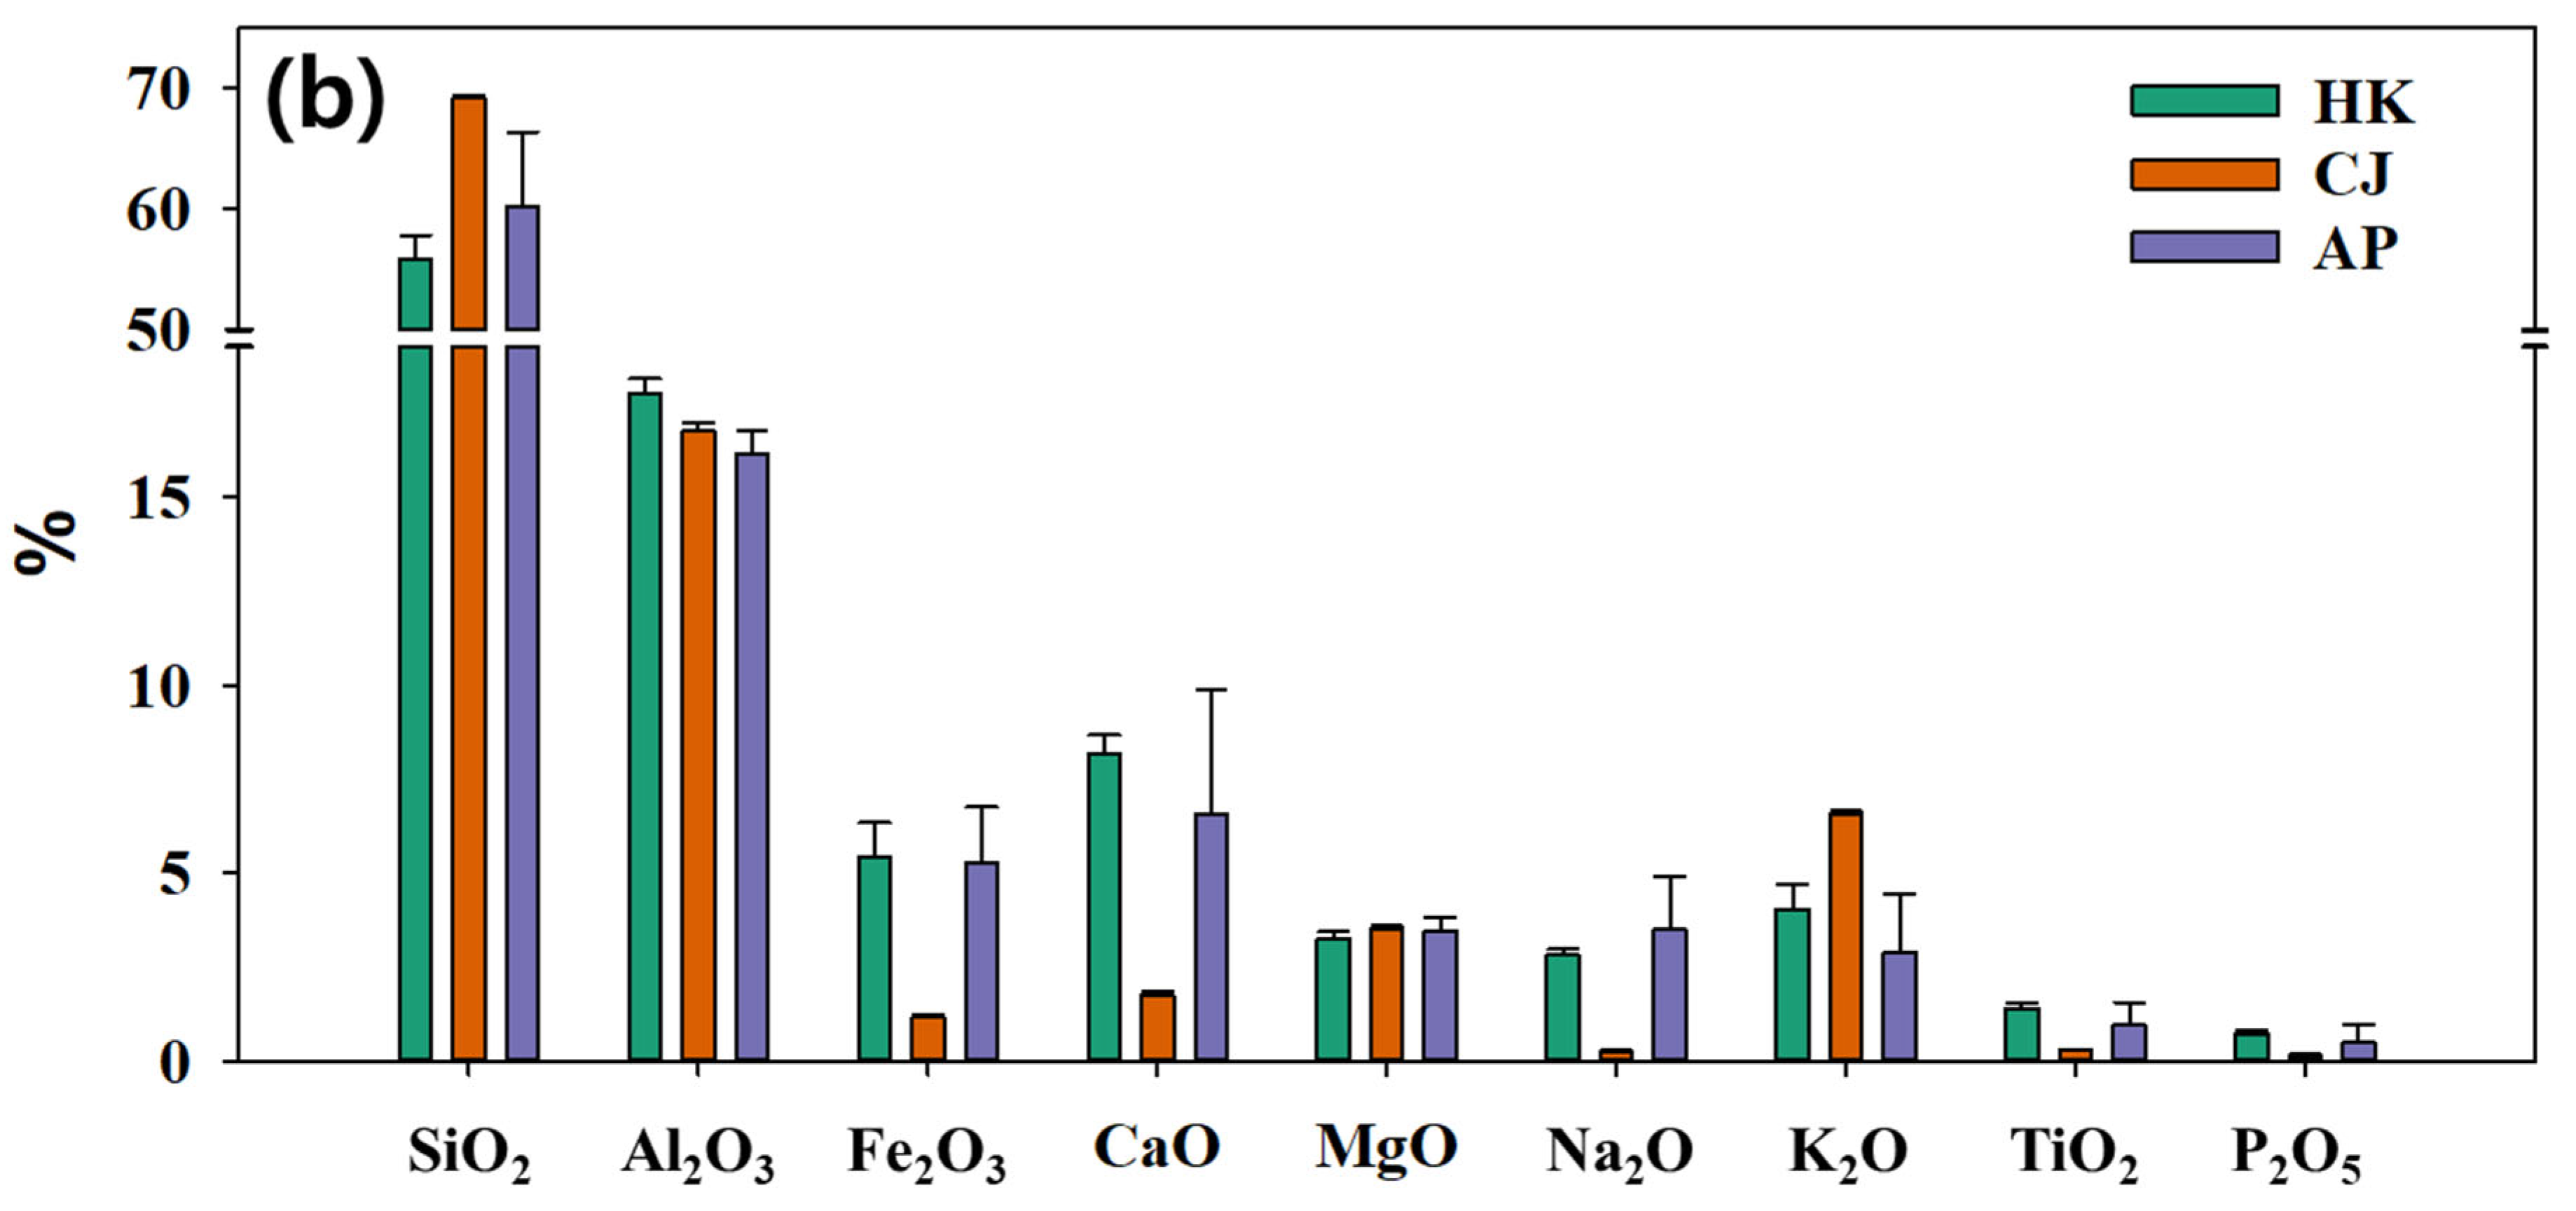
Polarized microscopy and XRD observations revealed that the major common minerals among our samples were quartz, plagioclase, alkali feldspar, mica, amphibole, and calcite were identified in HK and AP samples, but not in CJ samples (Table 2 and Figure 4a). Our bulk chemical composition results, obtained using XRF, revealed that CaO content was lowest in CJ samples (Figure 4b and Table S2), in which calcite was not detected (Table 2 and Figure 4a). SEM observations identified accessory minerals as ilmenite, apatite, zircon, allanite, thorite, and U-enriched thorite. Zircon, apatite, ilmenite, and thorite were identified in samples from all sites (Table 2), and thorite was particularly enriched in samples containing U and Th.

3.2. Characteristics of Radioactive Minerals

Because the alteration of primary minerals is insufficient to wholly represent the properties of radioactive minerals, we conducted comprehensive characterization of thorite [(Th, U)SiO4] (Figure 5 and Table S3), which was commonly identified in host rocks from all sites.
In HK samples, thorite had a size range of 1–5 μm, with irregular shapes and no inner cracks (HK in Figure 5). Analytical mineralogical composition results revealed that the maximum contents of UO2, ThO2, and Y2O3 were 17.2, 47.4, and 4.9 wt.%, respectively (Table S3). Thorite from the CJ site had a maximum size of 60 μm and numerous inner cracks; backscatter electron images revealed that a brighter interior than exterior color, indicating higher U and Th contents (CJ in Figure 5), compared with samples from the other two sites. The maximum contents of UO2, ThO2, and CaO in CJ thorite samples were 17.9, 51.7, and 2.9 wt.%, respectively (Table S3). Monazite was also identified in CJ rock samples and was found to be enriched in samples containing Th, with maximum contents of ThO2, La2O3, and Ce2O3 of 19.3, 16.9, and 28.2 wt.%, respectively (CJ in Figure 5 and Table S3). Thorite from the AP site had a size range of 10–30 μm, relatively weak inner cracks (AP in Figure 5), and maximum contents of UO2, ThO2, and CaO of 45.1, 48.8, and 1.8 wt.%, respectively (Table S3). Note that in Figure 5 (AP), AP thorite is designated as uranothorite due to its high U content.
Thorite is a silicate mineral that crystallized during the early stage of magmatic differentiation; it typically contains high U and Th concentrations. Following crystallization, it is frequently transformed into secondary minerals through hydrothermal alteration and/or weathering processes. Notably, U leaches easily from these secondary minerals under oxidizing conditions, allowing it recrystallize as secondary minerals, such as coffinite (USiO4), uranophane (Ca(UO2)2(SiO3OH)2·5H2O), and uraninite (UO2) [28]. In contrast, U is stable under reducing conditions [29]. Thorite is also known to transform into hydrated or altered thorite during long-term weathering or hydrothermal processes, which may result in the development of internal fractures and chemical heterogeneity [28,30]. In the study area, thorite commonly exhibits abundant fractures and chemical heterogeneity, which can be interpreted as reflecting different degrees of secondary alteration depending on locality.
Our whole-rock analytical results revealed that the U and Th contents in samples from each site were 1.3 and 7.5 mg/kg for HK, 1.4 and 19.5 mg/kg for CJ, and 4.6 and 12.6 mg/kg for AP (Figure 6). The results shown in Figure 6 were obtained by the ICP-MS analyses of bulk composition (Table S4). U content was highest in samples from the AP site, and Th concentrations were higher than U in among samples from all sites. On the contrary, the results presented in Table S3 were taken from the point analyses using EPMA for the radioactive minerals, such as thorite, monazite, and uranothorite given in Figure 5. Accordingly, the U and Th contents given in Table S3 were relatively higher because only radioactive minerals were analyzed, whereas their results in Table S4 were lowered due to the bulk composition of whole rock analyses.
Most of REEs exist in trivalent oxidation states and are not sensitive to changes in oxidizing or reducing conditions. However, Ce can occur in a tetravalent state under oxidizing conditions, in which case its chemical properties are similar to those of U and Th. Therefore, analyzing the oxidation state of Ce can reveal information about the oxidizing conditions that are favorable to U dissolution. We evaluated the relationship between mineral Ce and U contents in an artificial weathering experiment. The analytical results of REEs revealed that their contents increased in the order Ce > La ≈ Nd > Pr > Gd ≈ Sm (Table S4). Notably, as the frequency of fractures and the contents of mafic mineral increased, whereas those of other light REEs (Sm and Eu) decreased and those of heavy REEs remained constant.
Together, these results indicate that among the sample collection sites, thorite minerals differed in terms of sizes, shapes, inner crack development, and chemical compositions, confirming that geology, oxidizing/reducing conditions, and alteration processes influenced the behavior of U and Th in mineral formation and weathering. These environmental factors play critical roles in controlling the mobility and long-term leachability of U and Th.

3.3. Leachability of Radioactive Minerals

Artificial weathering experiments were conducted to elucidate the effects of pH, DO, and Ca/carbonate concentrations on the leachability of U and Th from minerals into groundwater. Leached concentrations of U and Th were measured according to their reaction times. Changes in pH values revealed a shift from acidic (pH 3) to neutral (pH 6–8) conditions among HK and AP samples after 1 day (Figure 7a,e), whereas 10 days were required to reach neutral conditions among CJ samples (Figure 7c). This difference may be attributable to differences in the contents of acid-consuming minerals, such as calcite, between these sample sites [31]. HK and AP samples contained calcite (Table 2) and had higher CaO contents compared with CJ samples (Figure 4b). Under reducing conditions (DO = 0), the pH values exposed to CJ samples gradually increased due to the consumption of H+ ions and simultaneous production of alkali metals (Ca2+ and Mg2+) through the weathering of iron-bearing minerals, such as biotite, chlorite, and ilmenite [32]. However, in experiments involving neutral initial pH conditions (pH 7), pH values increased only in the presence of bicarbonate ions (HCO3). Experiments with only Ca2+ ions revealed no change in pH (Figure 7b,d,f), indicating the critical role of bicarbonate ions in affecting pH values. U dissolution can be enhanced at higher pH levels because uranyl ions (UO22+) easily form complexes with carbonate species, such as UO2(CO3)22−, UO2(CO3)34−, and UO2CO3(aq) [10,18]. The equilibrium constants of UO22+ ions increased as the quantity of (bi)carbonate ions increased, via the following reactions [18]:
C O 3 2 + U O 2 2 + U O 2 ( C O 3 )                     K 1 = 10 9.94
2 C O 3 2 + U O 2 2 + U O 2 ( C O 3 ) 2 2                     K 2 = 10 16.61
3 C O 3 2 + U O 2 2 + U O 2 ( C O 3 ) 3 4                     K 3 = 10 21.84
The solubility and mobility of UO22+ ions were enhanced as a result of the increase in the stability of uranyl-carbonate complexes. Therefore, our experiments with neutral initial pH confirmed that U dissolution was not affected by Ca2+ ions.
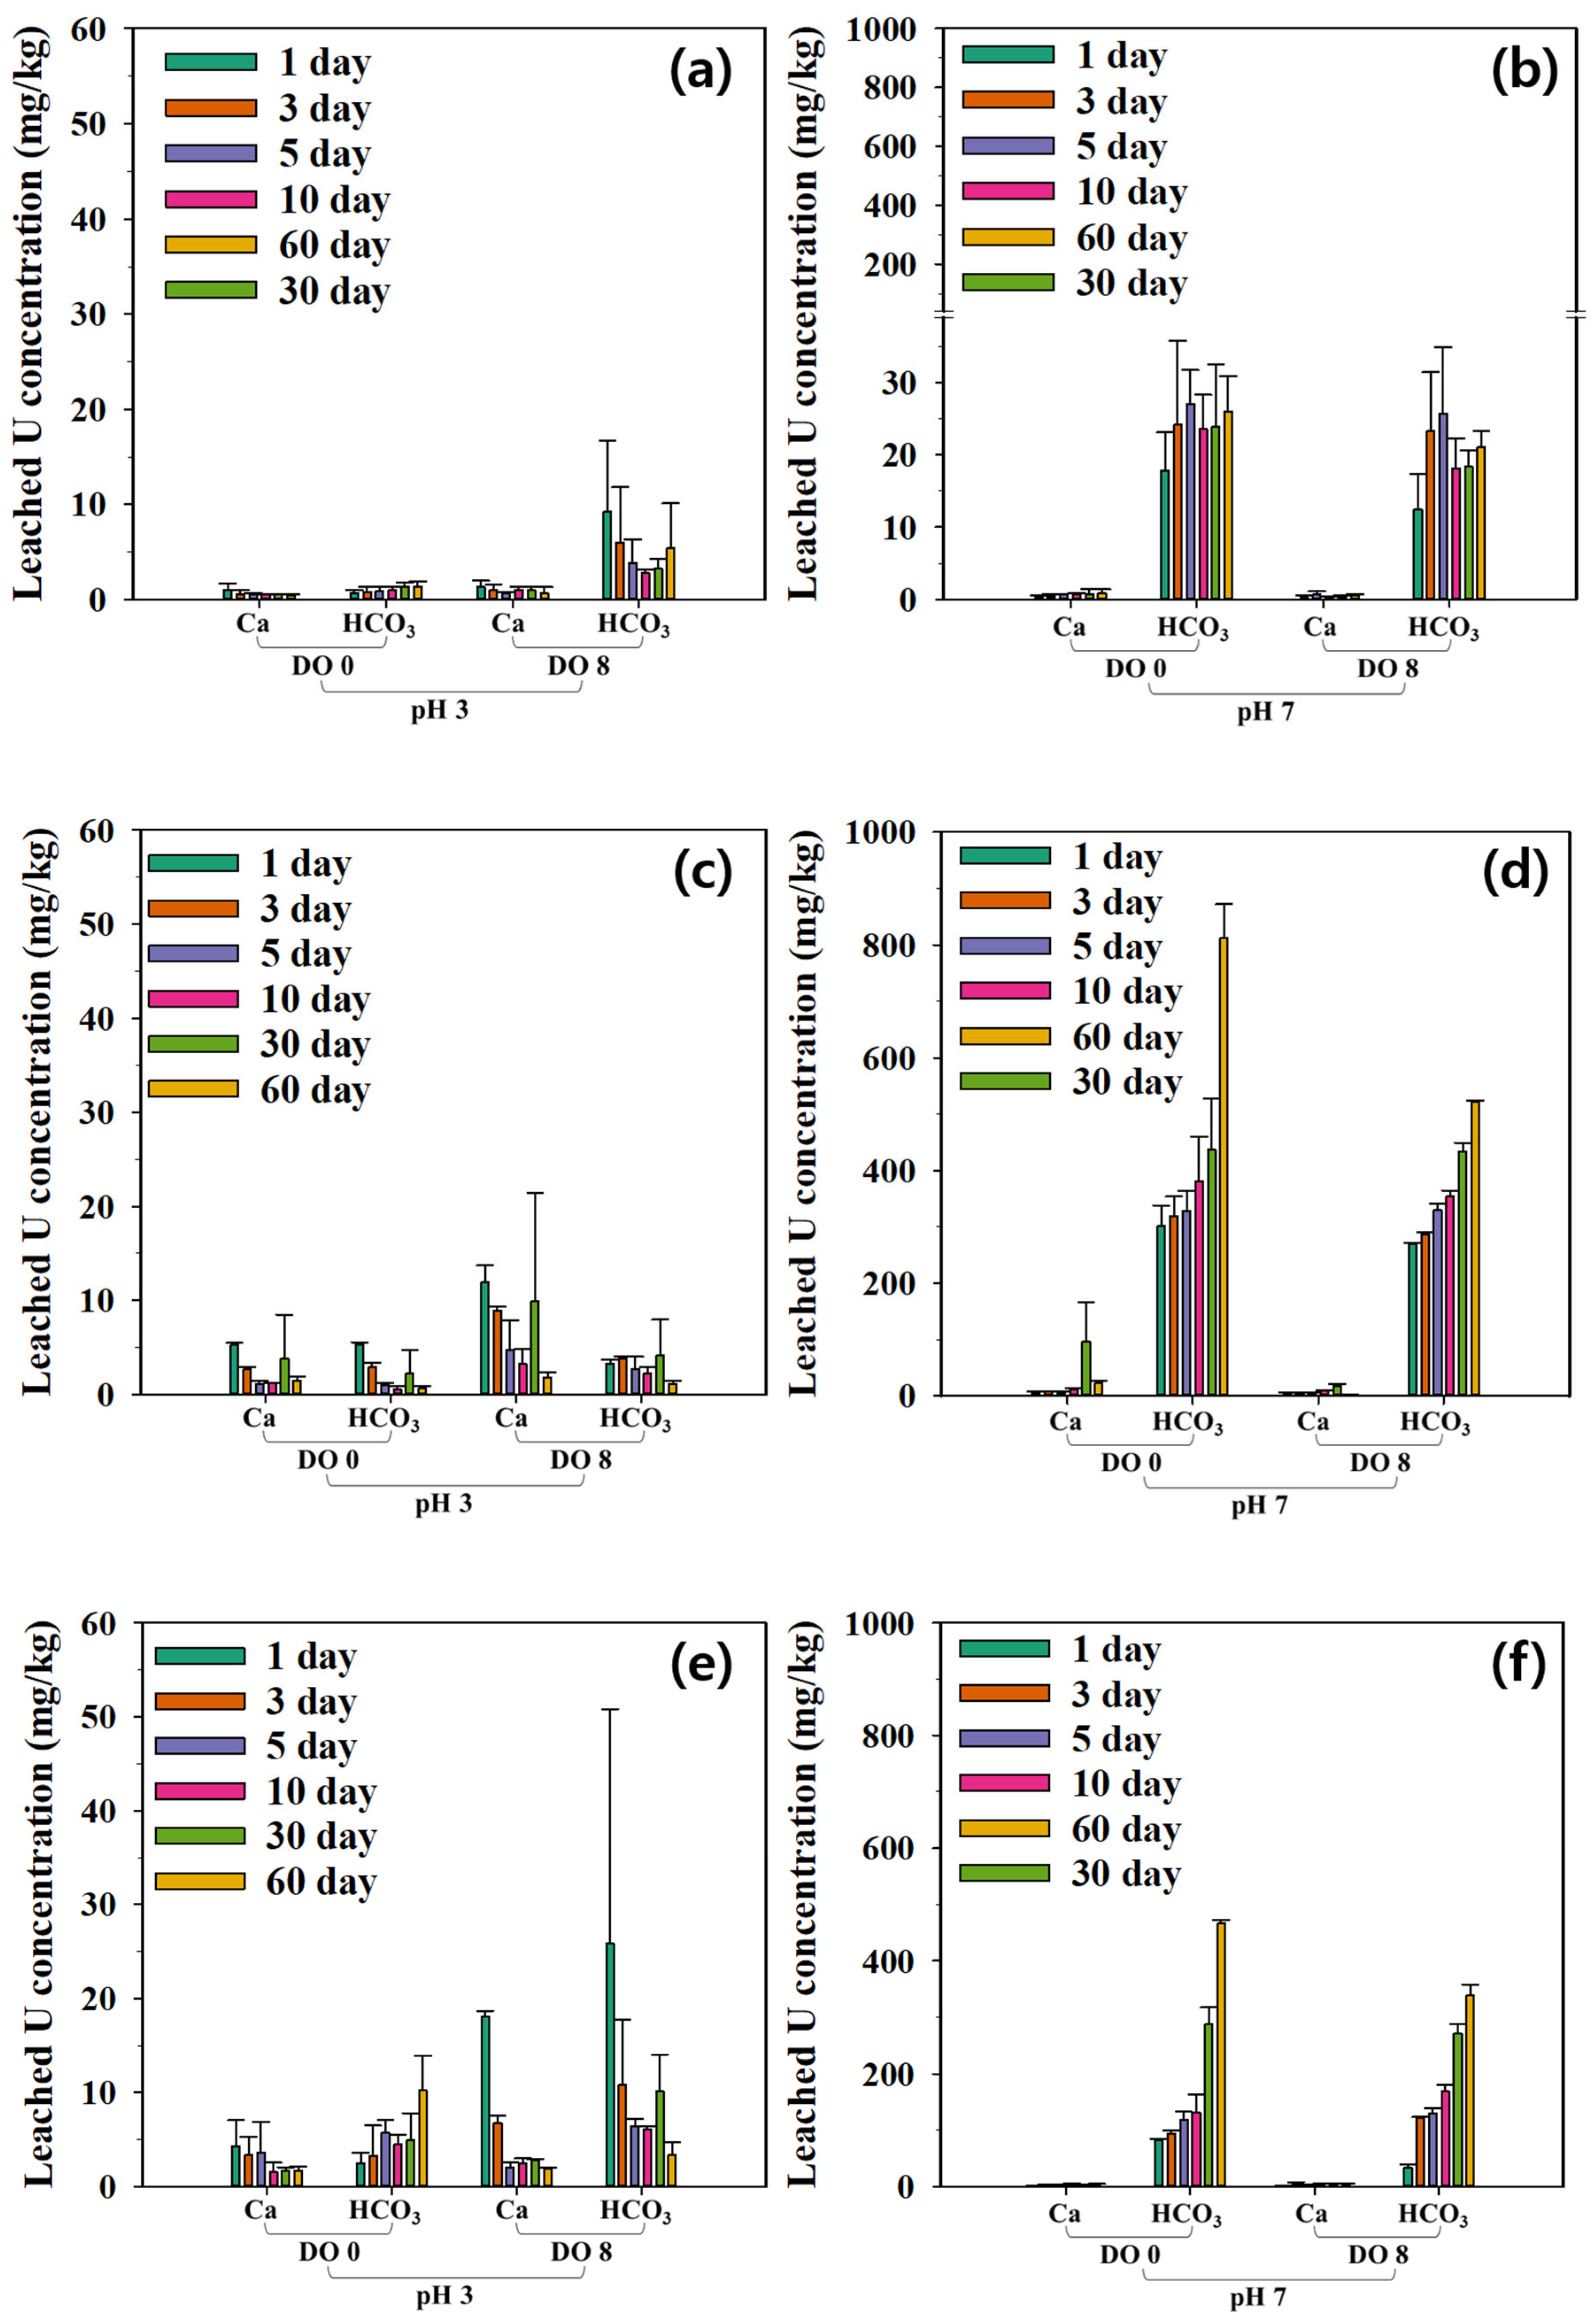
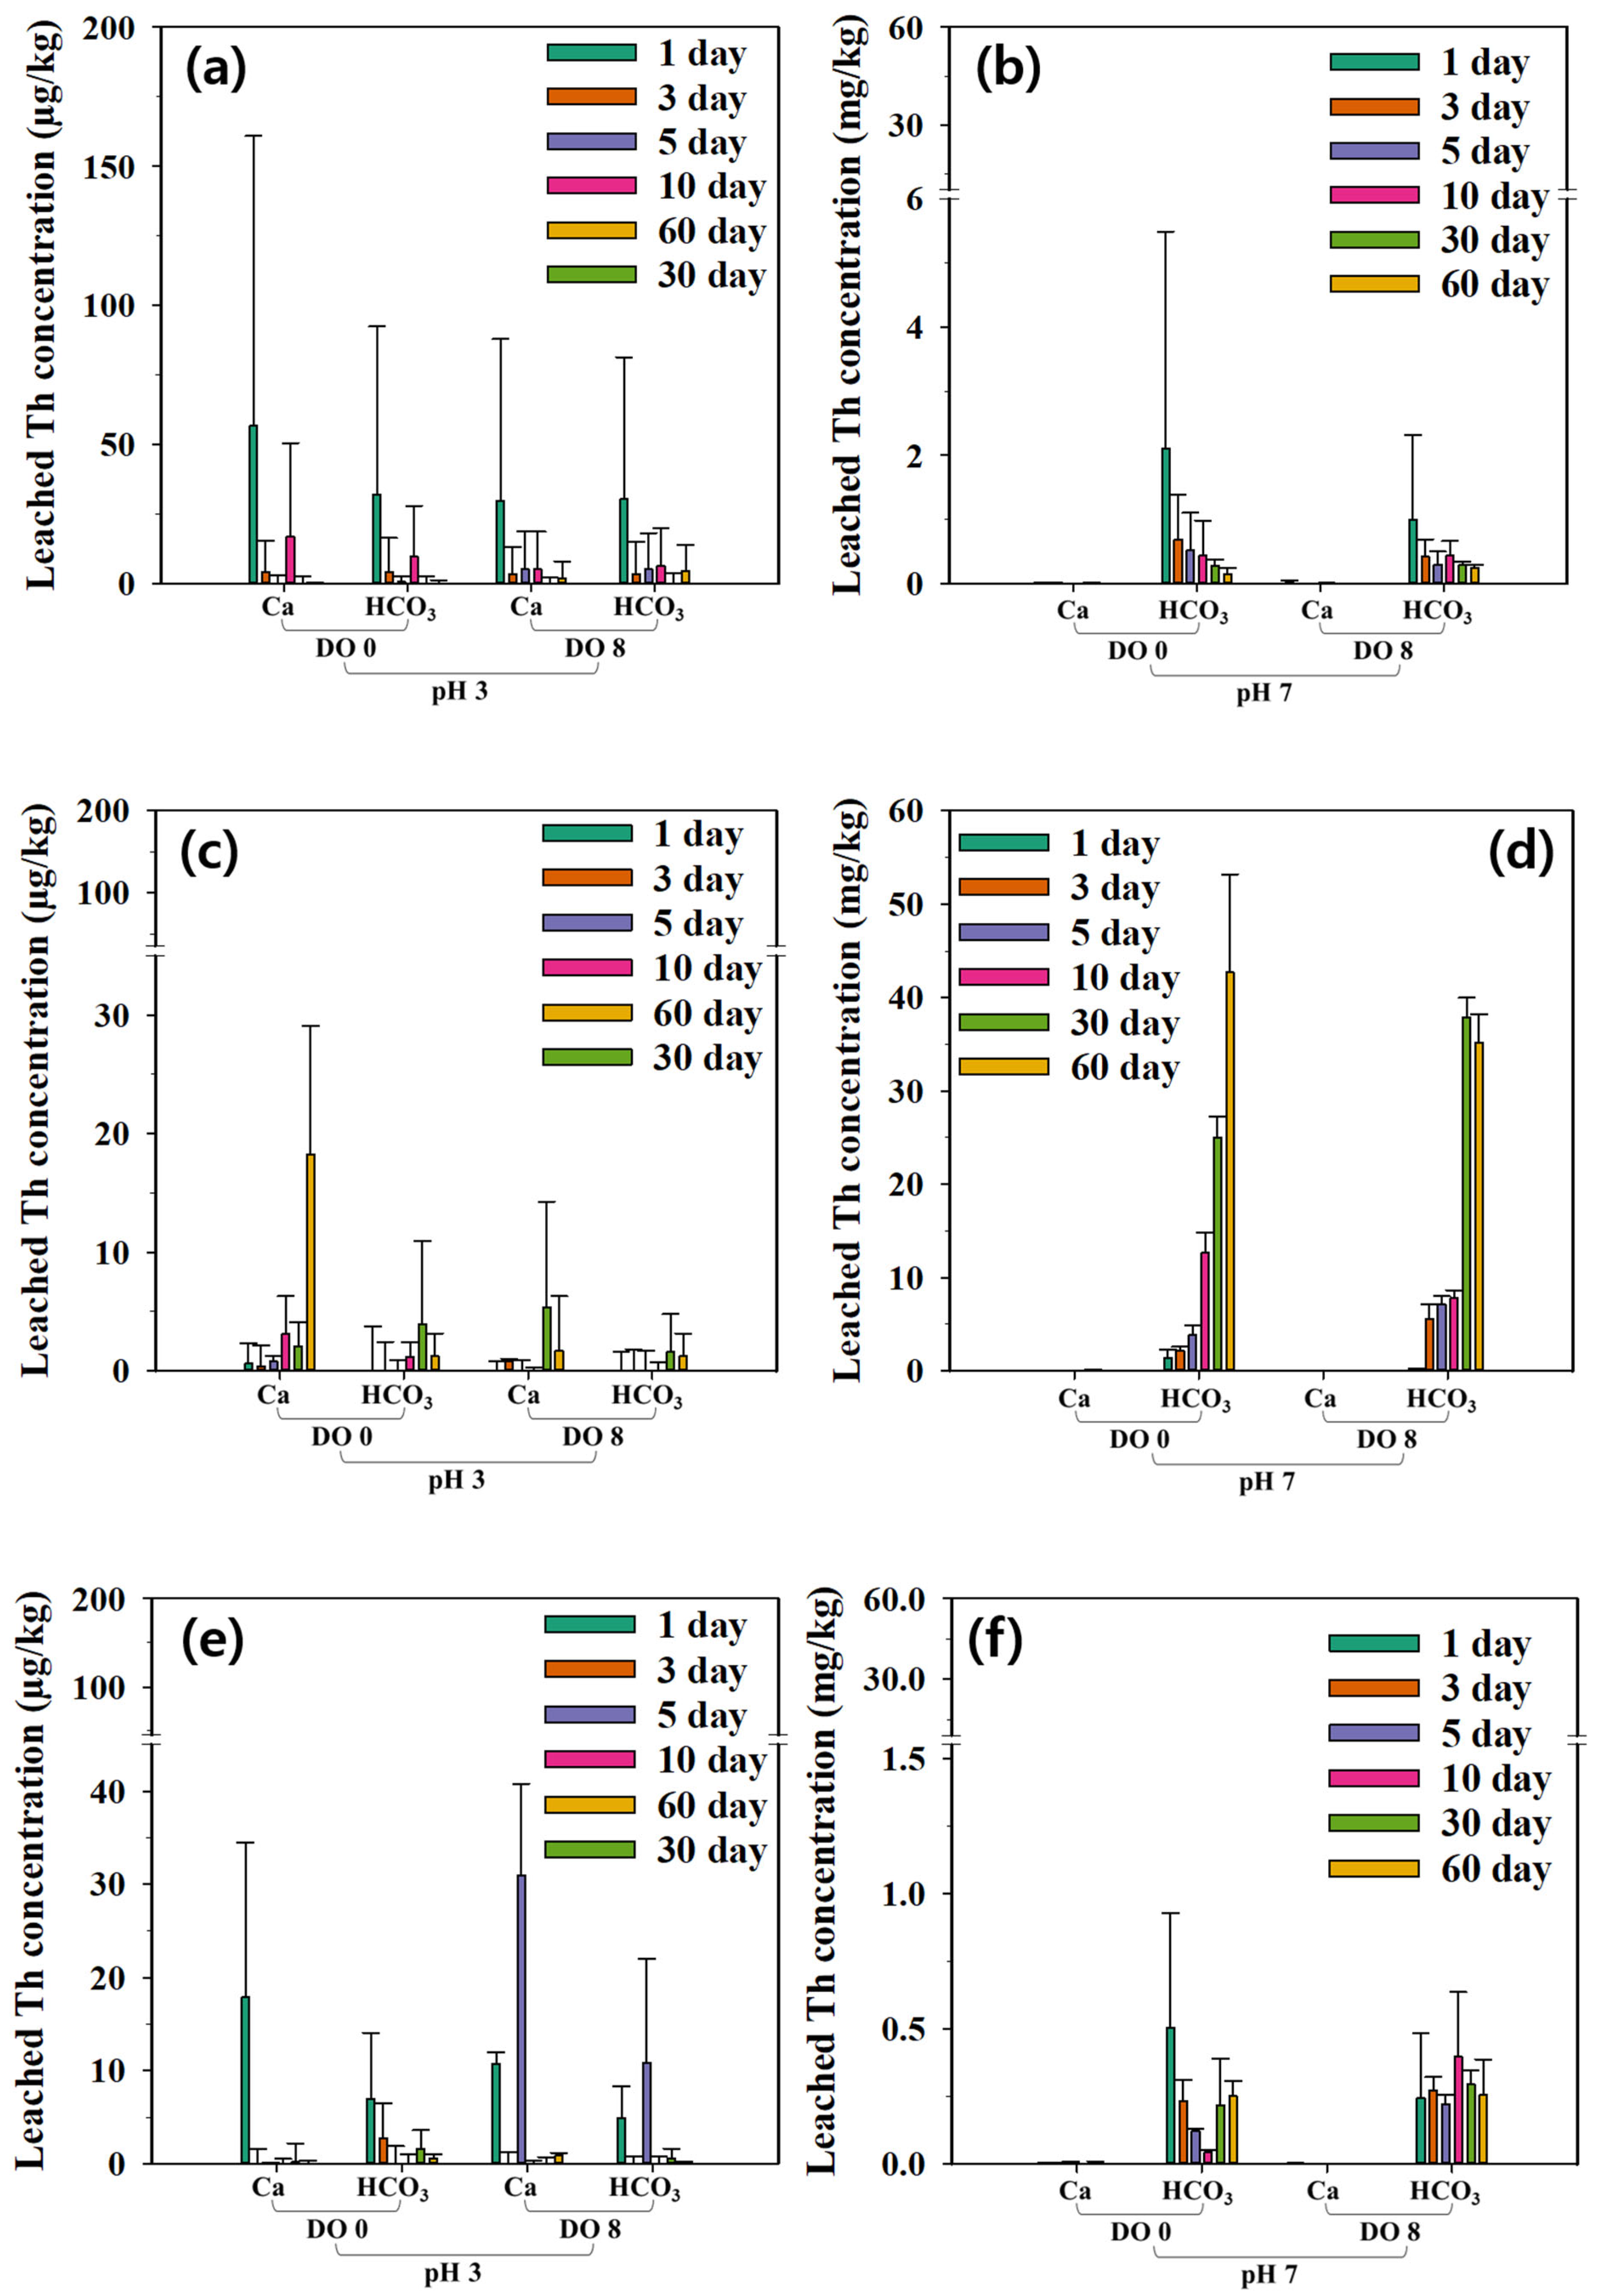
To compare U dissolution trends among samples from each collection site, we conducted experiments with an initial pH of 7 and the addition of bicarbonate ions via injection. U and Th leaching concentrations were highest in CJ samples, followed by AP and HK samples (Figure 8 and Figure 9). These differences are attributable to the weathering degree of U-bearing minerals in samples, which increased in the order CJ < AP < HK. Although CJ samples had the lowest weathering degree, several fractures were observed (Figure 2), and their U-bearing minerals were significantly influenced by environmental conditions, resulting in the highest concentration of dissolved U. In AP samples, which had an intermediate degree of weathering, concentrations of dissolved U increased at longer reaction times, as the resistance to weathering decreased. Unexpectedly, HK samples had the highest weathering degree, but the lowest concentration of dissolved U, perhaps due to low residual U content as a result of intensive prior leaching.
Together, these experimental results indicate that a neutral pH (7) and sufficient bicarbonate ions are the most favorable conditions to promote U and Th leachability. This finding confirms the results of Moon et al. [10], who reported markedly high concentrations of U among groundwater samples under neutral or slightly alkaline pH (7.5 and 8.2) and oxidizing (Eh 196–385 mV) conditions. We found that total Th contents was generally 3–10-fold higher than U content (Figure 6), but leached U concentrations were 20–500-fold higher (Figure 8 and Figure 9), perhaps due to differences in solubility and complexation properties between U and Th. Oxidized U species, such as U(IV) and U(VI), particularly the latter, are readily dissolved into groundwater due to their higher water solubility, whereas Th generally occurs as Th (IV), which has poor solubility. Additionally, U forms readily soluble uranyl-carbonate complexes, whereas Th does not form such complexes [33]. We hypothesized that dissolved U and Th concentrations would increase with weathering reaction times, but instead found that leached concentrations of Th decreased or remained stable over time, with the exception of CJ samples (Figure 9a,b,e,f). This finding is attributable to the presence of sulfide minerals, such as pyrite, galena, and sphalerite (Table 2). Th precipitates with these sulfate ions, which are produced through the dissolution of sulfide minerals [34]. Therefore, U solubility appears to have been enhanced by bicarbonate ions, whereas Th solubility was hindered by sulfate ions [10,35].
DO had a weaker effect on U and Th dissolution compared with pH and bicarbonate ions. Generally, U solubility is higher under oxidizing than under reducing conditions [36]. Therefore, we speculated that oxidizing conditions (DO = 8) might lead to higher dissolved U concentrations compared with reducing conditions (DO = 0). However, our experimental results revealed that U concentrations were similar or non-significantly higher under oxidizing conditions compared with reducing conditions (Figure 8a,b,e,f), indicating that the effects of pH and bicarbonate ions on U leachability were overwhelmingly more significant than those of redox conditions. Similarly, Th concentrations did not differ between the two redox conditions (Figure 9). Therefore, our artificial weathering experiments confirmed that dissolution of U and Th was controlled by several factors, including the weathering degree of these radioactive minerals and environmental conditions including pH and bicarbonate ions.

3.4. Regression Analysis of Kinetic Model Results

Based on our experimental artificial weathering results, we conducted correlation analyses to evaluate the relationships between concentrations of U, Th, Si, Sr and selected REEs (Sc, Y, La, Ce, Sm, and Eu) (Tables S5–S7). In HK samples, U concentrations were weakly and positively correlated with REEs, whereas those in AP and CJ samples were strongly and negatively correlated with Y, La, and Sr (Table S5). In terms of correlation between U and REEs and among REEs, significant positive correlations were detected for Ce-U, Ce-Sm and Sm-Eu (Table S5). In CJ samples, U and Th concentrations were strongly correlated (correlation coefficient (CC) = 0.86), but U concentrations were not significantly correlated with those of REEs (Table S6). In particular, Sc showed a relatively higher positive correlation (CC = 0.93) with Si (Table S6). In addition, concentrations of Y, La, Ce, Sm, and Eu were strongly correlated, suggesting that they may share the same dissolution mechanism. In AP samples, U and Th concentrations were significantly correlated (CC = 0.79), and U was significantly correlated with Ce (Table S7), whereas U concentrations were negatively correlated with those of Y, La, and Sr. Notably, Sr was negatively correlated with U and Th in samples from all sites, suggesting that U and Th leaching was suppressed at higher Sr concentrations, perhaps due to the sorption of Sr onto the surface of radioactive minerals, which limit their dissolution [37,38]. Sr also reportedly hinders the dissolution of carbonate minerals and drives the precipitation of U and Th [39]. Overall, our correlation analyses revealed that the dissolution mechanisms of U, Th, and REEs varied among sample collection sites, which may be attributable to variation in both the composition of REEs within radioactive minerals and the mineral composition of host rocks.
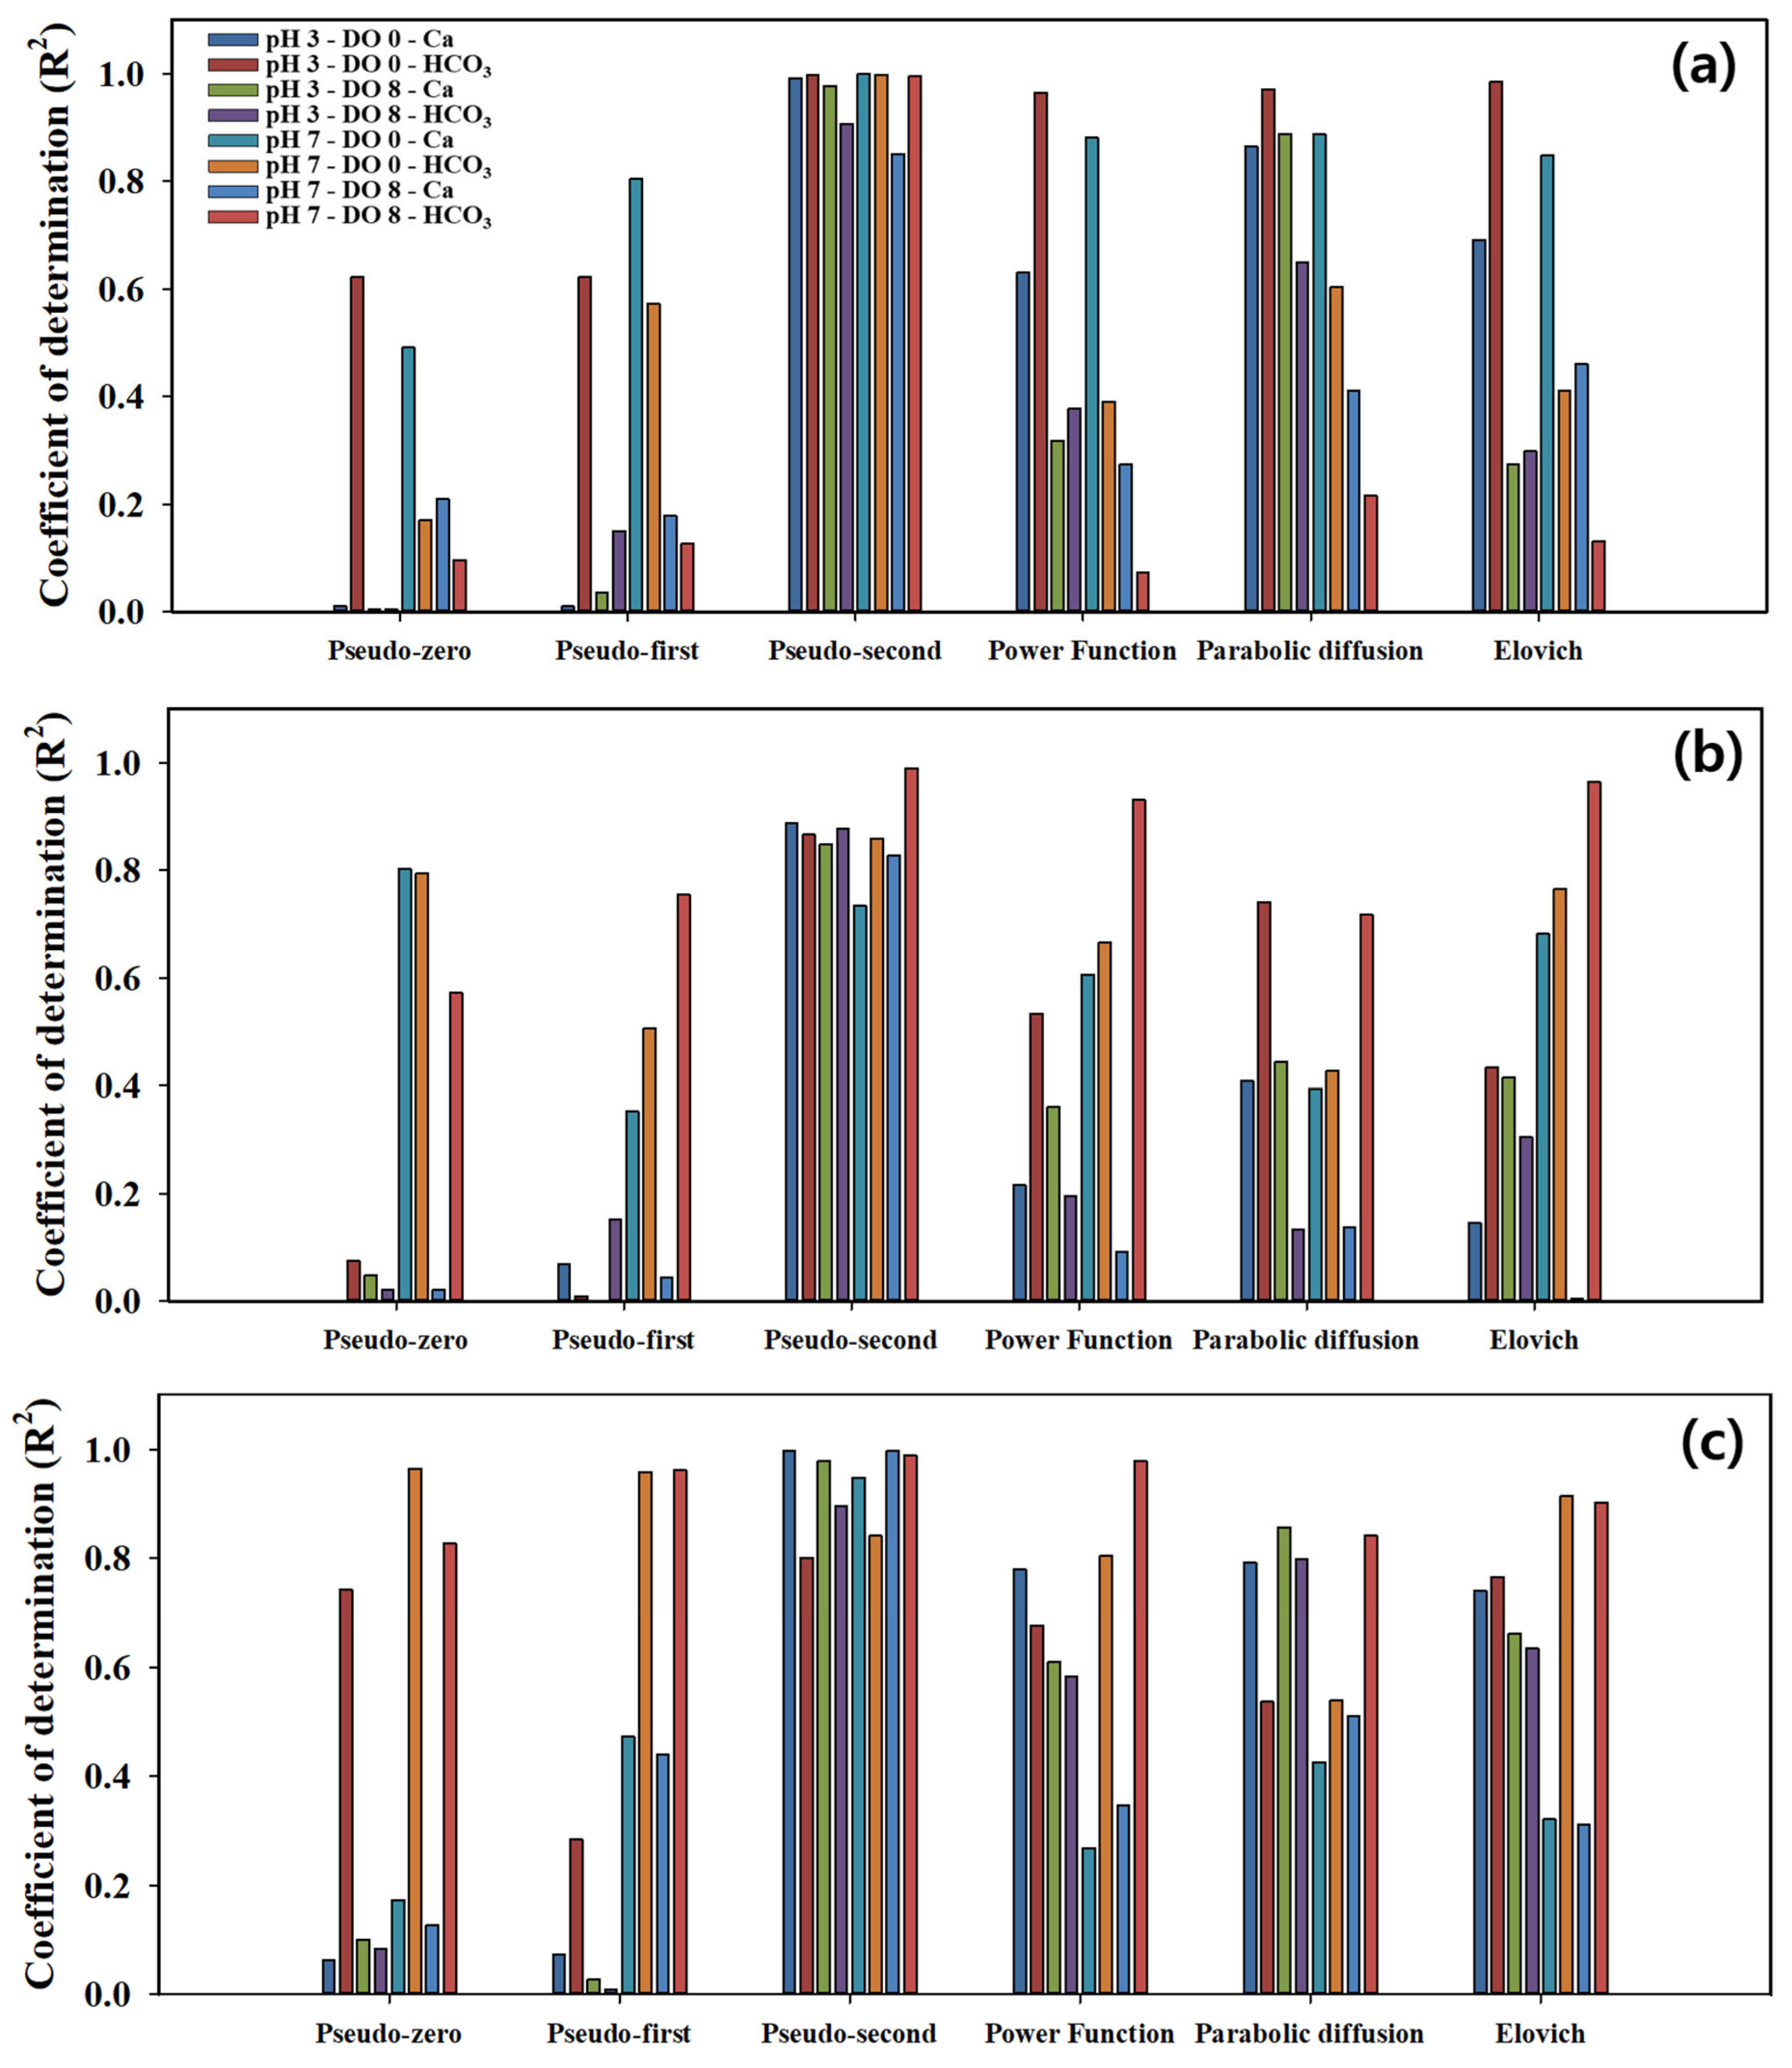
Next, we performed regression analysis of our experimental U leaching concentration results using six kinetic models; Figures S3–S5 present the coefficient of determination (R2). We excluded Th results from this analysis because the U concentrations were significantly higher and the associated risk of groundwater contamination is higher for U leaching. Among the six kinetics models, the pseudo-second-order model yielded the highest R2 values (>0.8), regardless of site and environmental conditions (Figure 10). Notably, R2 values for HK and AP samples exceeded 0.90 under all experimental conditions. However, CJ samples had an R2 value of 0.99 under neutral pH and reducing (DO = 0) conditions and following bicarbonate ion injection (0.1 M HCO3), whereas R2 values were lower than 0.90 under the other conditions. Next, we used the kinetic constants acquired by the pseudo-second-order model to estimate the time required for the U concentration to reach the drinking water standard (30 μg/L), and it was estimated according to each experimental condition (Table 3). For HK samples, the most reliable regression models (R2 > 0.95) yielded a maximum estimate of 12,387 years under acidic (pH = 3), reducing (DO = 0), and Ca2+-rich (0.1 M) conditions. U leaching time for CJ samples had relatively low R2 values, indicating unreliable results. Overall, U leaching times tended to decrease under neutral pH (7) conditions with excess bicarbonate ions. The shortest U leaching time estimated under these conditions were 181 years (DO = 0) and 226 years (DO = 8) for HK samples, 8.7 years (DO = 8) for CJ samples, and 12 years for AP samples (Table 3). Therefore, the importance of factors affecting the U leaching rate descended in the following order: bicarbonate concentration >> pH > DO. Elovich, parabolic diffusion, and power function models were unable to explain the reaction mechanism due to low R2 values (Figure 10). It might be worth noting that while a pseudo-second-order model fit best, all kinetic models are empirical simplifications. The long-term prediction (12,387 years in one scenario) should be taken as an extrapolation with assumptions. In other words, real systems could deviate from the model if conditions change or secondary processes occur.

3.5. Implications for Groundwater Management

Although this study mainly focused on the weathering and leaching processes of U-bearing minerals, the results also provide implications for the management of radioactive elements in the groundwater environment. The strong effects of pH, DO, and bicarbonate ions on U leaching indicate that controlling these hydrochemical conditions can reduce the dissolution and mobility of uranium in aquifers. For example, maintaining slightly reducing conditions or lowering bicarbonate concentrations may limit the formation of soluble uranyl–carbonate complexes. Furthermore, continuous monitoring of groundwater in granitic and gneissic aquifers is required to evaluate the long-term behavior of U and Th. Recent research has suggested that integrating geochemical management with engineering and natural approaches, such as adsorption and filtration systems or natural buffer zones, can effectively reduce the impact of radioactive elements on groundwater [40]. Therefore, the findings of this study are considered to contribute to the establishment of environmental management strategies for aquifers affected by U- and Th-bearing minerals.

4. Conclusions

Artificial weathering experiments showed that U leaching rates strongly depend on environmental conditions. Under neutral (pH = 7) and high bicarbonate (0.1 M HCO3) conditions, the estimated time required for groundwater U concentrations to reach the drinking-water standard (30 μg/L) ranged from approximately 8.7 to 226 years, depending on site and redox conditions. The importance of factors affecting U leaching rate decreased in the order of bicarbonate ≫ pH > DO. The frequency of linear structures and the degree of alteration in major minerals varied among the three sampling sites, increasing in the order HK ≥ CJ ≫ AP for structural frequency and HK > AP ≥ CJ for mineral alteration. These differences resulted in variations in U leaching: CJ samples showed the highest U leaching due to abundant inner cracks and moderate alteration, whereas HK samples showed the lowest U leaching due to intensive prior weathering and depletion of reactive minerals. Such site-specific differences are essential for evaluating U and Th behavior in similar geological environments. The experimental results indicated that pH, bicarbonate, and DO were the main hydrochemical factors controlling the dissolution and mobility of U. Under acidic conditions (pH = 3), acid-consuming minerals such as calcite rapidly neutralized the solution, whereas under neutral pH conditions, the addition of bicarbonate ions increased pH and enhanced U mobility through the formation of uranyl-carbonate complexes. In contrast, Th was less mobile because of its low solubility and co-precipitation with sulfate ions. Geological features, alteration characteristics, and environmental conditions collectively controlled the behavior of U and Th in rocks from the three sampling sites. Based on these findings, controlling bicarbonate concentrations and maintaining slightly reducing conditions may limit the formation of soluble uranyl-carbonate complexes. Continuous groundwater monitoring in granitic and gneissic aquifers, particularly those with abundant fractures, is required to evaluate and manage the long-term risks of U and Th contamination. The results of this study are considered to contribute to the establishment of environmental management strategies for aquifers affected by U- and Th-bearing minerals.

Supplementary Materials

The following supporting information can be downloaded at: https://www.mdpi.com/article/10.3390/environments12110415/s1, Table S1: Information on the kinetic models evaluated in this study, Table S2: XRF results of bulk chemical compositions of the samples (unit: wt.%), Table S3: EPMA results of chemical compositions of the radioactive minerals, Table S4: ICP-MS results of trace and REE in the bulk samples, Table S5: Correlation coefficients between radioactive elements, Sr, Si and selected REEs concentrations in HK samples, Table S6: Correlation coefficients between radioactive elements, Sr, Si and selected REEs concentrations in CJ samples, Table S7: Correlation coefficients between radioactive elements, Sr, Si and selected REEs concentrations in AP samples, Figure S1: The photo showing the experimental apparatus of purging air and nitrogen gas for DO titration (a) and serum bottle (b), Figure S2: The results of a polarizing microscope observations of samples from each site, Figure S3: Results of regression analyses for HK experiments. The kinetic experimental data were fitted with the pseudo-second-order model, Figure S4: Results of regression analyses for CJ experiments. The kinetic experimental data were fitted with the pseudo-second-order model, Figure S5: Results of regression analyses for AP experiments. The kinetic experimental data were fitted with the pseudo-second-order model.

Author Contributions

Conceptualization, H.-G.K., M.-S.K., and S.-O.K.; methodology, H.-G.K., W.-C.L., J.-H.L., S.-W.L., M.-S.K., and S.-O.K.; formal analysis, H.-G.K., W.-C.L., J.-H.L., and S.-O.K.; investigation, H.-G.K., W.-C.L., J.-H.L., S.-W.L., and S.-O.K.; resources, Y.-Y.J., D.-H.J., M.-S.K., and S.-O.K.; data curation, H.-G.K., S.-W.L., and S.-O.K.; writing– original draft, H.-G.K., W.-C.L., and S.-O.K.; writing–review & editing, M.-S.K. and S.-O.K.; visualization, W.-C.L., and S.-O.K.; supervision, M.-S.K. and S.-O.K.; project administration, Y.-Y.J., D.-H.J., M.-S.K., and S.-O.K.; funding acquisition, M.-S.K., and S.-O.K. All authors have read and agreed to the published version of the manuscript.

Funding

This work was financially supported by a grant from the National Institute of Environment Research (NIER), funded by the Korean Ministry of Environment (ME) (NIER-2023-04-02-080, NIER-2023-01-01-096). Authors are grateful to anonymous reviewers for their constructive reviews.

Data Availability Statement

The original contributions presented in this study are included in the article/Supplementary Materials. Further inquiries can be directed to the corresponding authors. No data were used for the research described in the article.

Conflicts of Interest

The authors declare no conflicts of interest.

References

  1. Hwang, J.; Moon, S.-H. Geochemistry of U and Th of Mesozoic granites in South Korea: Implications of occurrences of different U-host minerals and dissolved U and Rn between Jurassic and Cretaceous granite aquifers. Geosci. J. 2021, 25, 183–195. [Google Scholar] [CrossRef]
  2. Lee, W.-C.; Lee, S.-W.; Jeon, J.H.; Lee, J.H.; Jeong, D.-H.; Kim, M.-S.; Kim, H.-K.; Kim, S.-O. Uranium Concentrations in Private Wells of Potable Groundwater, Korea. Toxics 2022, 10, 543. [Google Scholar] [CrossRef]
  3. Hashemi, S.; Shin, I.; Kim, S.-O.; Lee, W.-C.; Lee, S.-W.; Jeong, D.H.; Kim, M.; Kim, H.-K.; Yang, J. Health risk assessment of uranium intake from private residential drinking groundwater facilities based on geological characteristics across the Republic of Korea. Sci. Total Environ. 2024, 913, 169252. [Google Scholar] [CrossRef]
  4. Research, N.I.o.E. Naturally Occurring Radioactive Materials (N.O.R.M.) in Private Groundwater Wells; National Institute of Envrionmental Research: Incheon. Republic of Korea, 2024; 270p. [Google Scholar]
  5. Hwang, J. Geological review on the distribution and source of uraniferous groundwater in South Korea. J. Eng. Geol. 2018, 28, 593–603. [Google Scholar] [CrossRef]
  6. Hwang, J. Occurrence of U-minerals and Source of U in Groundwater in Daebo Granite, Daejeon Area. J. Eng. Geol. 2013, 23, 399–407. [Google Scholar] [CrossRef]
  7. Jeong, C.H.; Yang, J.H.; Lee, Y.J.; Lee, Y.C.; Choi, H.Y.; Kim, M.S.; Kim, H.K.; Kim, T.S.; Jo, B.U. Occurrences of Uranium and Radon-222 from Groundwaters in Various Geological Environment in the Hoengseong Area. J. Eng. Geol. 2015, 25, 557–576. [Google Scholar] [CrossRef]
  8. Papageorgiou, F.; McDermott, F.; Van Acken, D. Uranium in groundwaters: Insights from the Leinster granite, SE Ireland. Appl. Geochem. 2022, 139, 105236. [Google Scholar] [CrossRef]
  9. Kim, M.S.; Yang, J.H.; Jeong, C.H.; Kim, H.K.; Kim, D.W.; Jo, B.U. Geochemical Origins and Occurrences of Natural Radioactive Materials in Borehole Groundwater in the Goesan Area. J. Eng. Geol. 2014, 24, 535–550. [Google Scholar] [CrossRef]
  10. Moon, S.H.; Hwang, J.; Lee, J.Y.; Hyun, S.P.; Bae, B.K.; Park, Y. Establishing the Origin of Elevated Uranium Concentrations in Groundwater near the Central Ogcheon Metamorphic Belt, Korea. J. Environ. Qual. 2013, 42, 118–128. [Google Scholar] [CrossRef]
  11. Hwang, J.; Moon, S.-H.; Ripley, E.M.; Kim, Y.H. Determining uraniferous host rocks and minerals as a source of dissolved uranium in granite aquifers near the central Ogcheon metamorphic belt, Korea. Environ. Earth Sci. 2014, 72, 4035–4046. [Google Scholar] [CrossRef]
  12. Kim, H.-G.; Lee, S.-W.; Kim, S.-O.; Jeong, D.-H.; Kim, M.-S.; Kim, H.-K.; Jeong, J.O. The Origin of Radioactive Elements Found in Groundwater Within the Chiaksan Gneiss Complex: Focusing on the Relationship with Minerals of the Surrounding Geology. Korean J. Mineral. Petrol. 2022, 35, 153–168. [Google Scholar] [CrossRef]
  13. Vesković, J.; Onjia, A. Influencing factors of groundwater 238U, 232Th, 40K, and rare earth element contamination: Insights from the two-dimensional Monte Carlo simulation of radiological risks. Mar. Pollut. Bull. 2025, 213, 117682. [Google Scholar] [CrossRef]
  14. Jwa, Y.-J. Possible source rocks of Mesozoic granites in South Korea: Implications for crustal evolution in NE Asia. Earth Environ. Sci. Trans. R. Soc. Edinb. 2004, 95, 181–198. [Google Scholar] [CrossRef]
  15. Lee, S.R.; Cho, K. Precambrian Crustal Evolution of the Korean Peninsula. J. Petrol. Soc. Korea 2012, 21, 89–112. [Google Scholar] [CrossRef]
  16. Kim, S.W.; Koh, H.J.; Kim, J. Geochronological study for the gneiss complex in the Wonju-Anheung-Pyeongchang area, central part of the Korean Peninsula. J. Geol. Soc. Korea 2014, 50, 327–342. [Google Scholar] [CrossRef]
  17. Balaram, V.; Subramanyam, K.S.V. Sample preparation for geochemical analysis: Strategies and significance. Adv. Sample Prep. 2022, 1, 100010. [Google Scholar] [CrossRef]
  18. APHA. Standard Methods For The Examination Of Water And Wastewater, 22nd ed.; Rice, E.W., Baird, R.B., Eaton, A.D., Clesceri, L.S., Eds.; American Public Health Association (APHA), American Water Works Association (AWWA) and Water Environment Federation (WEF): Washington, DC, USA, 2012. [Google Scholar]
  19. Mühr-Ebert, E.L.; Wagner, F.; Walther, C. Speciation of uranium: Compilation of a thermodynamic database and its experimental evaluation using different analytical techniques. Appl. Geochem. 2019, 100, 213–222. [Google Scholar] [CrossRef]
  20. Leal Filho, W.; Kotter, R.; Özuyar, P.G.; Abubakar, I.R.; Eustachio, J.H.P.P.; Matandirotya, N.R. Understanding Rare Earth Elements as Critical Raw Materials. Sustainability 2023, 15, 1919. [Google Scholar] [CrossRef]
  21. López-Luna, J.; Ramírez-Montes, L.E.; Martinez-Vargas, S.; Martínez, A.I.; Mijangos-Ricardez, O.F.; del Carmen Ángeles González Chávez, M.; Carrillo-González, R.; Solís-Domínguez, F.A.; del Carmen Cuevas-Díaz, M.; Vázquez-Hipólito, V. Linear and nonlinear kinetic and isotherm adsorption models for arsenic removal by manganese ferrite nanoparticles. SN Appl. Sci. 2019, 1, 950. [Google Scholar] [CrossRef]
  22. Neupane, A.; Herndon, E.M.; Whitman, T.; Faiia, A.M.; Jagadamma, S. Manganese effects on plant residue decomposition and carbon distribution in soil fractions depend on soil nitrogen availability. Soil Biol. Biochem. 2023, 178, 108964. [Google Scholar] [CrossRef]
  23. Sparks, D.L. 7—Kinetics of Soil Chemical Processes. In Environmental Soil Chemistry, 2nd ed.; Sparks, D.L., Ed.; Academic Press: Burlington, ON, Canada, 2003; pp. 207–244. [Google Scholar]
  24. Almaroai, Y.A.; Usman, A.R.A.; Mahtab, A.; Kwon-Rae, K.; Meththika, V.; Sik Ok, Y. Role of chelating agents on release kinetics of metals and their uptake by maize from chromated copper arsenate-contaminated soil. Environ. Technol. 2013, 34, 747–755. [Google Scholar] [CrossRef]
  25. Elkhatib, E.A.; Mahdy, A.M.; ElManeah, M.M. Effects of drinking water treatment residuals on nickel retention in soils: A macroscopic and thermodynamic study. J. Soils Sediments 2013, 13, 94–105. [Google Scholar] [CrossRef]
  26. Hwang, J.H.; Kihm, Y.H. Geological Report of the Jipori Sheet (Scale: 1:50,000); Korea Institute of Geoscience and Mineral Resources: Daejeon, Republic of Korea, 2007; pp. 1–67. [Google Scholar]
  27. Koh, H.J.; Kim, S.W.; Lee, S.R. Geological Report of the Anheungri Sheet Scale 1:50,000; Korea Institute of Geoscience and Mineral Resources: Daejeon, Republic of Korea, 2011. [Google Scholar]
  28. Finch, R.; Murakami, T. Systematics and Paragenesis of Uranium Minerals. In Uranium; Peter, C.B., Robert, J.F., Eds.; De Gruyter: Berlin, Germany; Boston, MA, USA, 1999; pp. 91–180. [Google Scholar]
  29. Burns, P.C.; Ewing, R.C.; Hawthorne, F.C. The crystal chemistry of hexavalent uranium; polyhedron geometries, bond-valence parameters, and polymerization of polyhedra. Can. Mineral. 1997, 35, 1551–1570. [Google Scholar]
  30. Piilonen, P.C.; Rowe, R.; Poirier, G.; Grice, J.D.; McDonald, A.M. Discreditation of thorogummite. Can. Mineral. 2014, 52, 769–774. [Google Scholar] [CrossRef]
  31. Ruiz-Agudo, E.; Kowacz, M.; Putnis, C.V.; Putnis, A. The role of background electrolytes on the kinetics and mechanism of calcite dissolution. Geochim. Cosmochim. Acta 2010, 74, 1256–1267. [Google Scholar] [CrossRef]
  32. Kopylova, Y.; Guseva, N.; Shestakova, A.; Khvaschevskaya, A.; Arakchaa, K. Uranium and thorium behavior in groundwater of the natural spa area “Choygan mineral water” (East Tuva). IOP Conf. Ser. Earth Environ. Sci. 2015, 27, 012034. [Google Scholar] [CrossRef]
  33. Gilbert, B.; Carrero, S.; Dong, W.; Joe-Wong, C.; Arora, B.; Fox, P.; Nico, P.; Williams, K.H. River thorium concentrations can record bedrock fracture processes including some triggered by distant seismic events. Nat. Commun. 2023, 14, 2395. [Google Scholar] [CrossRef]
  34. Abrão, A.; de Freitas, A.A.; de Carvalho, F.M.S. Preparation of highly pure thorium nitrate via thorium sulfate and thorium peroxide. J. Alloys Compd. 2001, 323–324, 53–56. [Google Scholar] [CrossRef]
  35. Krupka, K.; Serne, R. Geochemical Factors Affecting the Behavior of Antimony, Cobalt, Europium, Technetium, and Uranium in Vadose Sediments; Pacific Northwest National Laboratory: Richland, WA, USA, 2002. [Google Scholar] [CrossRef]
  36. Lee, W.-C.; Kim, S.-H.; Lee, B.-T.; Lee, S.-H.; Kim, K.-W.; Shim, Y.-S.; Park, H.-S.; Kim, S.-O. The Hydrogeochemical Study on the Passive Treatment System of the Dalseong Mine. J. Korean Soc. Miner. Energy Resour. Eng. 2013, 50, 56–69. [Google Scholar] [CrossRef]
  37. Aharoni, C.; Ungarish, M. Kinetics of activated chemisorption. Part 2.—Theoretical models. J. Chem. Soc. Faraday Trans. 1 Phys. Chem. Condens. Phases 1977, 73, 456–464. [Google Scholar] [CrossRef]
  38. Crank, J. The Mathematics of Diffusion, 2nd ed.; Oxford Science Publications: Oxford, UK, 1975. [Google Scholar]
  39. García, A.C.; Latifi, M.; Amini, A.; Chaouki, J. Separation of Radioactive Elements from Rare Earth Element-Bearing Minerals. Metals 2020, 10, 1524. [Google Scholar] [CrossRef]
  40. Biedunkova, O.; Kuznietsov, P. Integration of water management in the assessment of the impact of heavy metals discharge from the power plant with mitigation strategies. Ecol. Indic. 2025, 175, 113618. [Google Scholar] [CrossRef]
Figure 1. Geological map of the Cheorwon-Asan-Hoengseong area, Korea, showing the locations of samples (modified from Kim et al. [16]).
Environments 12 00415 g001
Figure 2. The photos of rock core samples in each area.
Environments 12 00415 g002
Figure 3. A flow diagram of the study.
Environments 12 00415 g003
Figure 4. The XRD (a) and XRF (b) results of bulk composition in each area. Chl: chlorite; Bt: biotite; Afs: alkali feldspar; Pl: plagioclase; Mus: muscovite; Qtz: quartz; Cal: calcite.
Environments 12 00415 g004aEnvironments 12 00415 g004b
Figure 5. The backscattered electron (BSE) images of U-bearing minerals identified in each area. The numbers within the images designate points for the analyses of a field-emission electron probe micro analyzer (FE-EPMA). The EPMA results of each point are given in Table S3.
Environments 12 00415 g005
Figure 6. The contents of U and Th and their ratios in the bulk core samples of each area.
Environments 12 00415 g006
Figure 7. Changes in pH values according to the variation in DO and calcium and bicarbonate ion concentrations. (a) initial pH of 3 for Hoengseong-Kangrim (HK) samples, (b) initial pH of 7 for Hoengseong-Kangrim (HK) samples, (c) initial pH of 3 for Cheorwon-Jadeung (CJ) samples, (d) initial pH of 7 for Cheorwon-Jadeung (CJ) samples, (e) initial pH of 3 for Asan-Punggi (AP) samples, and (f) initial pH of 7 for Asan-Punggi (AP) samples.
Environments 12 00415 g007
Figure 8. Leached U concentrations according to the variations in DO and calcium and bicarbonate ion concentrations. (a) Hoengseong-Kangrim (HK) samples at pH 3, (b) Hoengseong-Kangrim (HK) samples at pH 7, (c) Cheorwon-Jadeung (CJ) samples at pH 3, (d) Cheorwon-Jadeung (CJ) samples at pH 7, (e) Asan-Punggi (AP) samples at pH 3, (f) Asan-Punggi (AP) samples at pH 7.
Environments 12 00415 g008
Figure 9. Leached Th concentrations according to the variations in DO and calcium and bicarbonate ion concentrations. (a) Hoengseong-Kangrim (HK) samples at pH 3, (b) Hoengseong-Kangrim (HK) samples at pH 7, (c) Cheorwon-Jadeung (CJ) samples at pH 3, (d) Cheorwon -Jadeung (CJ) samples at pH 7, (e) Asan-Punggi (AP) samples at pH 3, (f) Asan-Punggi (AP) samples at pH 7.
Environments 12 00415 g009
Figure 10. Coefficient of determination (R2) of six kinetic models obtained from the regression analyses of artificial weathering experiment results. (a) Hoengseong-Kangrim (HK) samples, (b) Cheorwon-Jadeung (CJ) samples, (c) Asan-Punggi (AP) samples.
Environments 12 00415 g010
Table 1. Hydrochemical properties of groundwater obtained from three separate aquifers.
ParametersAquifer
Hoengseong-Kangrim
(HK)
Cheorwon-Jadeung
(CJ)
Asan-Punggi
(AP)
Uranium (µg/L)414.412.0174.7
Temperature (℃)13.312.016.3
pH7.95.67.9
Eh (mV)49182113
EC (μS/cm)129263313
DO (mg/L)0.70.50.4
Si7.511.89.3
Na8.014.316.6
K0.501.923.31
Mg0.275.696.65
Ca16.941.740.8
F0.360.370.27
Cl1.620.88.4
SO415.15.531.9
NO30.02.436.2
HCO363165118
Water typeCa-HCO3Ca-HCO3Ca-HCO3
Table 2. Summarized results of microscopic observation, XRD, SEM, and EPMA analyses on mineral composition of drilling cores collected from three separate aquifers.
Aquifer
Hoengseong-Kangrim
(HK)
Cheorwon-Jadeung
(CJ)
Asan-Punggi
(AP)
Rock typeGranite gneissBiotite GranitePorphyritic Granite
Major mineralsPlagioclase feldspar
Biotite
Quartz
Alkali feldspar
Chlorite
Amphibole
Calcite
Plagioclase feldspar
Biotite
Quartz
Alkali feldspar
Chlorite
Muscovite
Plagioclase feldspar
Biotite
Quartz
Alkali feldspar
Chlorite
Calcite
Accessory mineralsSphene
Allanite
Apatite
Zircon
Thorite
Ilmenite
Pyrite
Galena
Sphalerite
Monazite
Epidote
Apatite
Zircon
Monazite
Thorite
Ilmenite
Sphene
Monazite
Apatite
Zircon
Thorite
Ilmenite
Pyrite
Rutile
Table 3. The time required for the groundwater U concentration to reach the drinking water standard (30 μg/L), estimated using the kinetic constants of the pseudo-second-order model which was best fitted with the experimental results (refer to Figures S3–S5).
Experimental ConditionAquifer
Hoengseong Kangrim
(HK)
Cheorwon Jadeung
(CJ)
Asan Punggi
(AP)
pH 3DO 00.1 M Ca12387 ***28652729 ***
0.1 M HCO33164 ***6773469
DO 80.1 M Ca6475 **24422370 ***
0.1 M HCO3900 *39851337
pH 7DO 00.1 M Ca5154 ***1591505 *
0.1 M HCO3181 ***5.88.4
DO 80.1 M Ca8.419871577 ***
0.1 M HCO3226 ***8.7 ***12 **
*** R2 > 0.99, ** R2 > 0.95, * R2 > 0.90.
Disclaimer/Publisher’s Note: The statements, opinions and data contained in all publications are solely those of the individual author(s) and contributor(s) and not of MDPI and/or the editor(s). MDPI and/or the editor(s) disclaim responsibility for any injury to people or property resulting from any ideas, methods, instructions or products referred to in the content.