Article

An Expedited Procedure to Highlight Rapid Recharge Processes by Means of Nitrate Pollution Dynamics in the Northern Italy Plain

by
Dimitra Rapti
1 and
Giovanni Martinelli
2,3,4,*
1
Department of Chemical, Pharmaceutical and Agricultural Sciences, University of Ferrara, 44121 Ferrara, Italy
2
Istituto Nazionale di Geofisica e Vulcanologia (INGV), 90136 Palermo, Italy
3
Key Laboratory of Groundwater Quality and Health Ministry of Education, School of Environmental Sciences, China University of Geosciences, Wuhan 430078, China
4
Key Laboratory of Petroleum Resources Exploration and Evaluation, Northwest Institute of Eco-Environment and Resources, Chinese Academy of Sciences, Lanzhou 730000, China
*
Author to whom correspondence should be addressed.
Environments 2025, 12(11), 404; https://doi.org/10.3390/environments12110404
Submission received: 27 August 2025 / Revised: 17 October 2025 / Accepted: 23 October 2025 / Published: 28 October 2025
(This article belongs to the Special Issue Environmental Pollution Risk Assessment)

Abstract

In recent decades, increasing anthropogenic pressure and climate change have made the protection and sustainable management of groundwater resources essential. In this context, the identification of aquifer recharge zones, especially those characterized by rapid groundwater flow and high vulnerability to surface pollution sources, becomes a priority for the protection of underground resources. In the Po Plain (northern Italy), based on the lithological, geometric, hydraulic, and hydrodynamic characteristics of the aquifers, the recharge areas are mainly located in the alluvial fans of the Alpine and Apennine foothills. Due to the high hydraulic conductivity of the aquifer, the shallow depth of the water table and the agricultural activities, groundwater resources are vulnerable to nitrate (NO3) contamination. Given this background, the present study introduces a novel methodological approach based on the geochemical signature of groundwater, indicated by the presence of bicarbonate (HCO3) and NO3 ions, aimed at identifying aquifer recharge areas. Specifically, by analyzing time series of NO3 and HCO3 concentrations for the period 2012–2023, and applying criteria of an HCO3/NO3 ratio < 10 and NO3 > 30 mg/L, it was possible to identify areas where aquifer recharge processes are clearly evident. These recharge processes are rapid, as confirmed by the hydraulic gradient, the high hydraulic conductivity of the aquifers, and further supported by the isotopic composition of groundwater, especially tritium concentrations. Furthermore, due to the hydrogeological characteristics of the surveyed region, which resemble those of alluvial basins in close proximity to mountain ranges, the methodology and findings of this study can be used as an unconventional and expedited method for similar research conducted globally, offering hope for the future of groundwater research.

1. Introduction

1.1. Motivation

In recent decades, climate change and increasing anthropogenic pressure have resulted in, on one side, a rise in water demand for agricultural, domestic, and industrial use, stressing aquifer systems; and on the other hand, the occurrence of widespread groundwater contamination phenomena. The intelligent exploration and sustainable management of groundwater resources are fully aligned with the sustainable development goals (SDGs) of the United Nations ([1]; SDG 13).
Estimating groundwater recharge areas is a crucial process for assessing the availability of underground water resources and ensuring the sustainable management of aquifer systems. Groundwater recharge refers to the process of adding water to aquifer systems through direct or indirect infiltration, thereby increasing the aquifer’s water volume. This process can occur naturally, such as through infiltration from atmospheric events (e.g., precipitation or snowmelt), or through induced infiltration such as via injection wells, channels or ponds.
Furthermore, the identification of recharge areas provides an essential starting point for the application of subsequent models aimed at estimating recharge rates and for better understanding the dynamics of groundwater flow systems; for example, HYDRUS-1D based on the solution of the Richards equation [2], MODFLOW UZF based on the kinematic wave equation [3] and WetSpas based on soil water balance equations [4].
Over the past few decades, different methodological approaches have been applied to determining the groundwater recharge zone, such as: (a) hydrogeological methods based on the analysis of hydrological balance parameters and the determination of groundwater flow direction to identify recharge areas [5,6,7,8,9]; (b) hydrochemical, isotopic, and tracing methods integrated with the hydrogeological model (e.g., [10,11]); (c) application of groundwater numerical models [12,13]; and (d) remote sensing methods [14,15].
All these methods require high-quality data, in-depth analysis, several variables, and must be taken into account when selecting a technique for estimating natural groundwater recharge areas. It is crucial to have a comprehensive understanding of the characteristics of the various approaches (e.g., [16]). The space/time scales of recharge estimations are crucial as various research objectives require recharge estimates across varying spatial and temporal scales [17]. The susceptibility of aquifers to contamination is primarily determined by the recharge process and its rate, which transports contaminants into the aquifers (e.g., [18]). Water-resource planning often requires information on decadal-scale recharge, but the time scales needed for studying pollutant movement can vary from days to thousands of years, depending on the specific contaminants under consideration, the recharge process rates (rapid or slow), and the water flow velocity within the aquifers. Obtaining background information on prospective measures to regulate recharge is very important. The climate and geological features of a site influence the location and timing of recharge [19,20].
Therefore, based on these premises, the present research introduces a novel methodological approach that considers the behavior over time of the concentration of the NO3 and HCO3 parameter pair. This unconventional method could be particularly useful for an expeditive assessment of recharge areas and the consequent vulnerability of aquifers. It can be additionally employed as a tool complementary to traditional conventional approaches, contributing to enhancing their accuracy and robustness in identifying aquifer recharge processes.

1.2. Methodological Approach

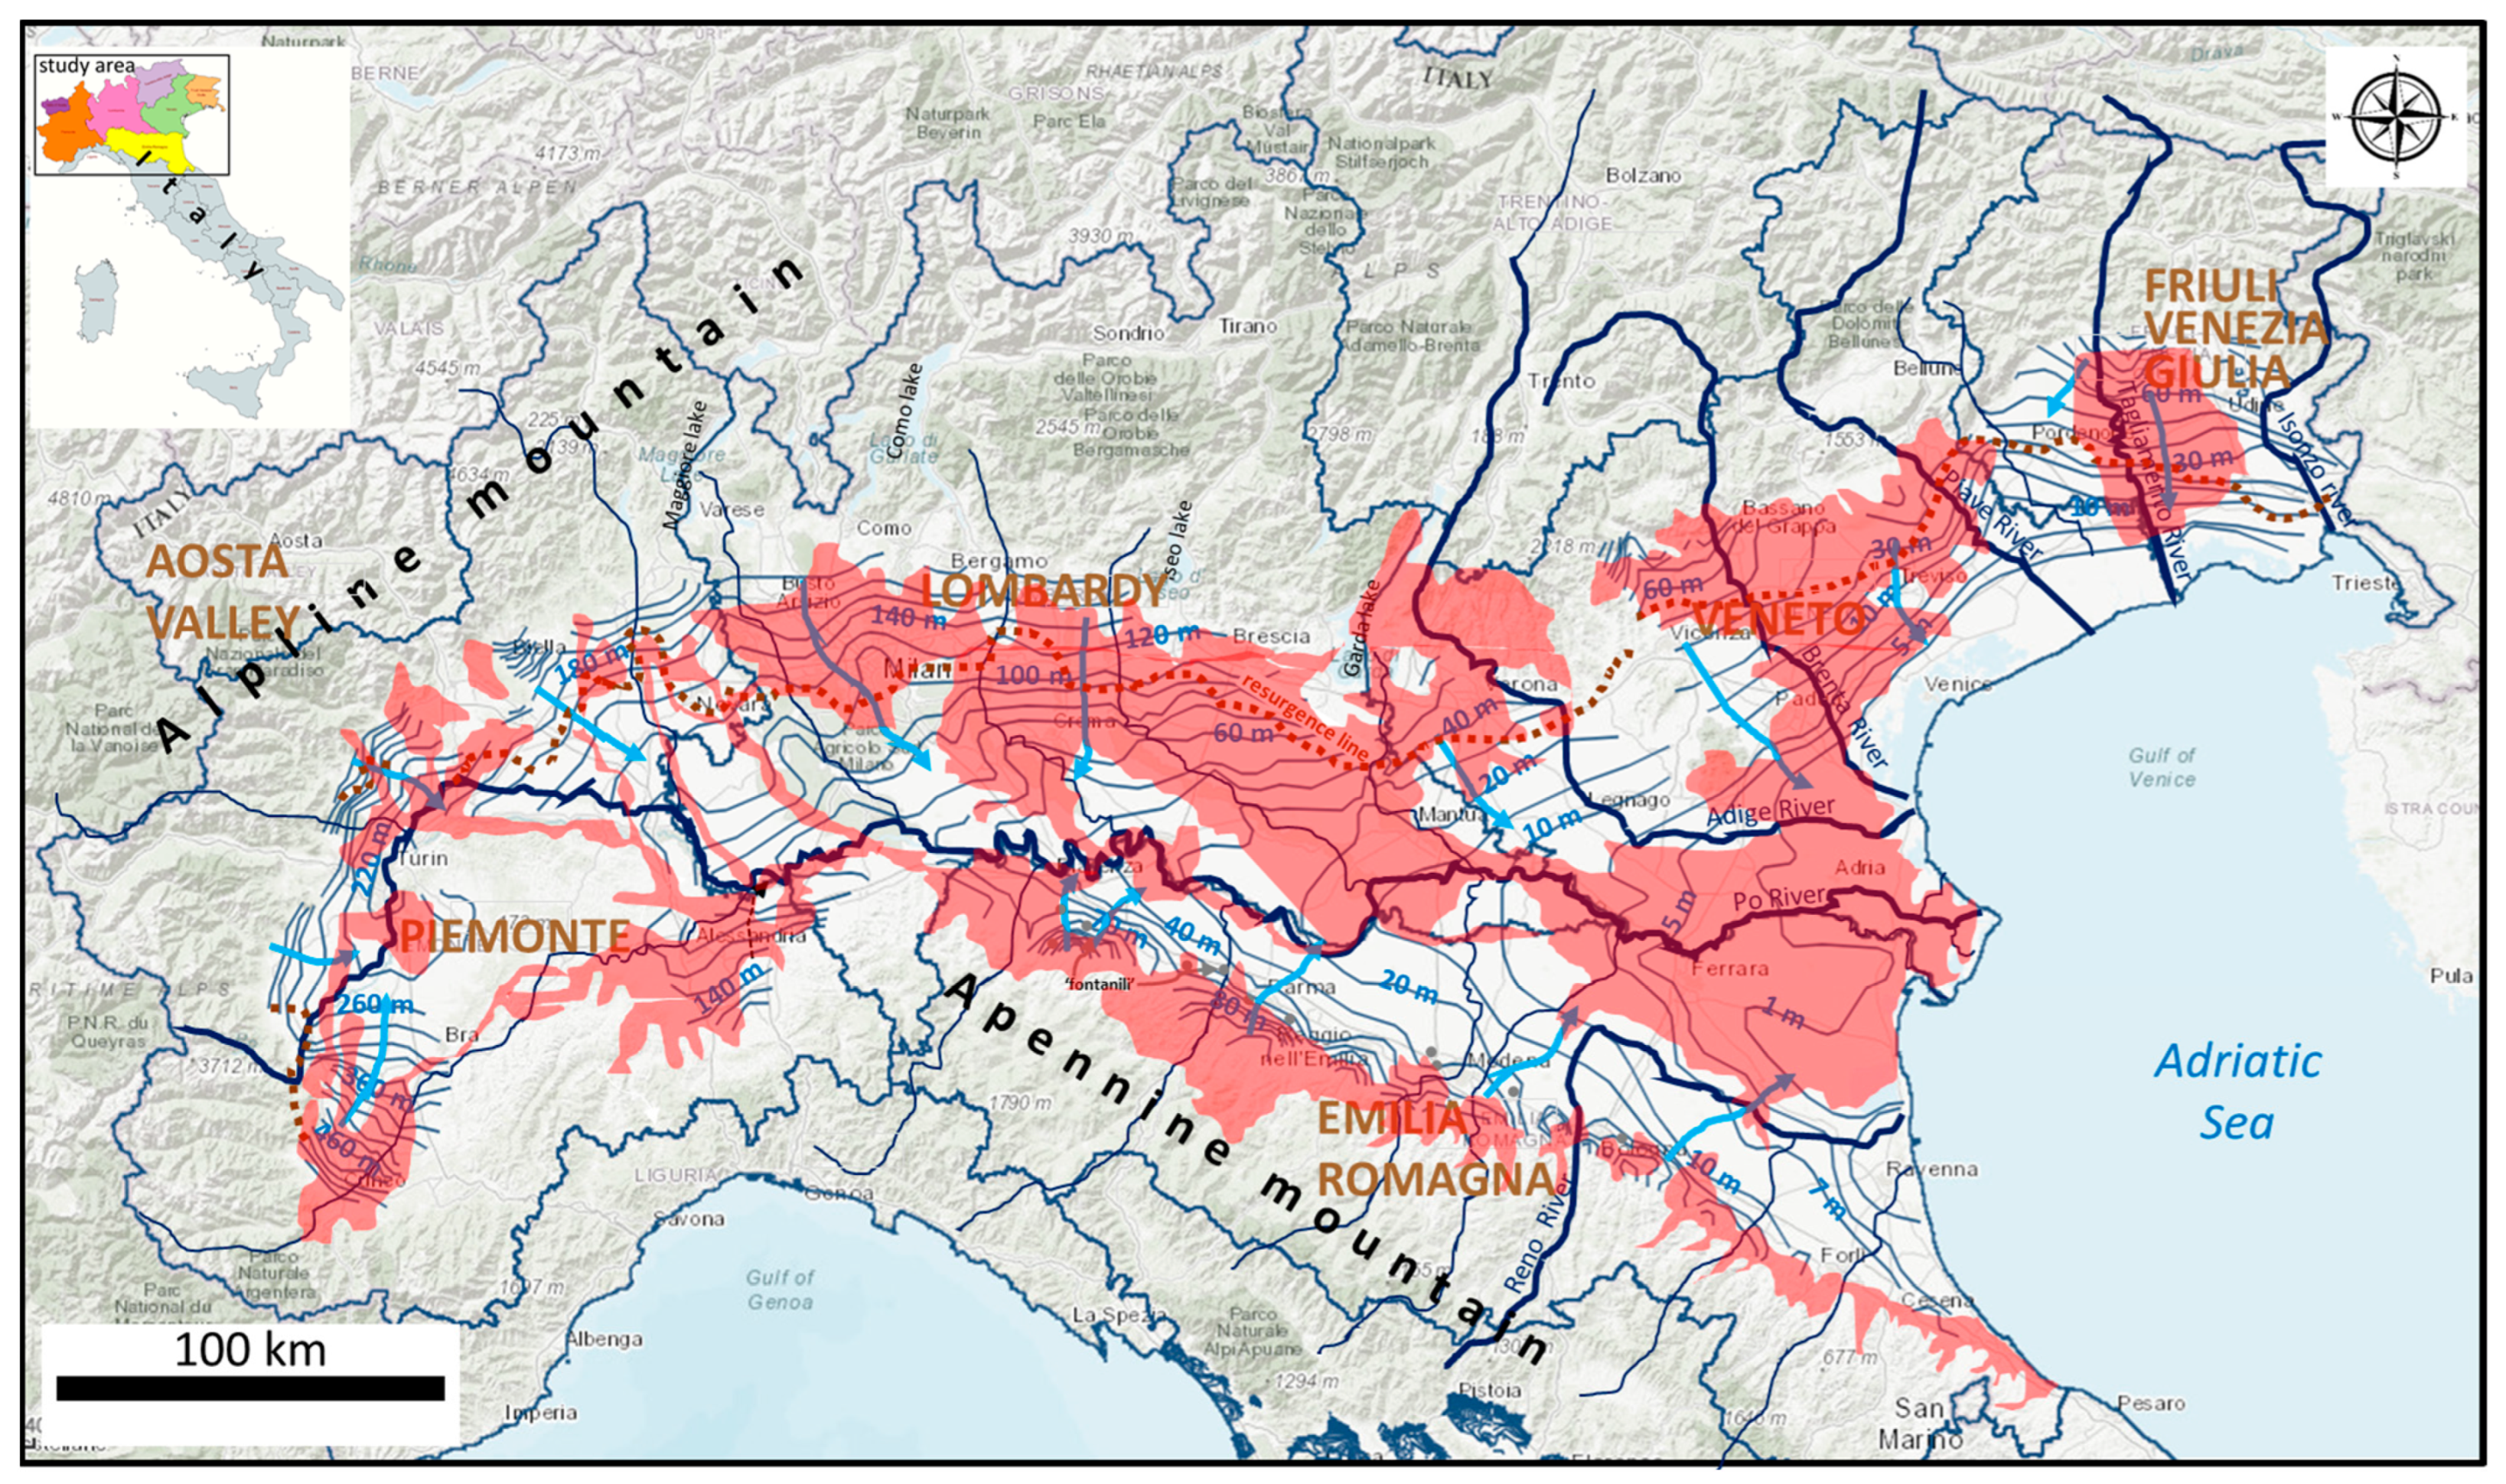
For these purposes, in an initial phase, at the regional scale (Northern Italy; Figure 1), the integrated analysis of existing hydrogeological data enabled: (a) the characterization of the main aquifer systems, and (b) the identification of their recharge areas. This was achieved by analyzing hydrodynamic parameters (piezometric levels, hydraulic conductivity) and by developing interpretative hydrogeological cross-sections (Section 2).
In a second phase, available time series of chemical analyses (2012–2023) were collected from a monitoring network comprising 402 wells, managed by the Regional Environmental Protection Agencies (ARPAs) of Northern Italy (Figure 1). The analysis focused on selected chemical parameters considered to be significant indicators of recharge processes, particularly bicarbonate and nitrate concentrations, with specific attention given to the HCO3/NO3 ratio (Section 3).
In the third phase, due to the large number of available point data (an average of 15 HCO3/NO3 ratio values per well) and their spatial distribution, it became necessary to establish robust criteria for identifying aquifer recharge processes based on this ratio. To this end, at a regional scale, ionic concentrations of bicarbonates and nitrates were analyzed using analytical data from Martinelli et al., 2014 [22]. Data processing allowed for the identification of characteristic ranges for the HCO3/NO3 ratio and NO3 concentrations in wells located within the Apennine fan areas, zones previously identified as recharge areas through hydrogeological and lithostratigraphic evidence (Section 3).
In a fourth phase, and based on the established criteria, chemical data from the monitoring network (territorial scale) were analyzed. Additionally, the sensitivity of nitrates and bicarbonates to recharge processes was investigated, and preliminary evaluations regarding the velocity of recharge were performed using both isotopic (tritium) and hydrochemical data (Section 4).
Finally, the main strengths and limitations of the proposed methodological approach are presented.

1.3. Study Area

The northern region of Italy is distinguished by a spacious alluvial valley that includes the Po and Veneto plains [23]. It is surrounded by the Alpine and Apennine mountain ranges to the north and south, respectively. Additionally, it is bounded by the Adriatic Sea to the east (Figure 1). The combined area of the Po and Veneto plains is around 100,000 square km.
The main hydrographic network is constituted by the Po, Adige and Tagliamento Rivers. The Po River, spanning a length of 675 km, gathers water from 141 tributary rivers originating from the Alpine and Apennine mountain ranges. In addition, the Adige River (410 km) and the Tagliamento River (170 km) collect water from 18 significant tributary rivers in the Eastern Alpine region.
The regions in Northern Italy that contain substantial flat terrain, listed from west to east, are Piedmont, Lombardy, Veneto, Emilia Romagna, and Friuli Venezia Giulia. Approximately 50% of the land area is dedicated to agricultural and animal husbandry activities, mostly focusing on cattle breeding, pig breeding, and poultry.
The rainy periods are more prevalent throughout the spring and autumn seasons. The average annual rainfall in the low plain sections is from 501 to 750 mm, while in the high plain areas it ranges from 751 to 1200 mm [24].

2. Materials and Methods

2.1. Geological Framework

The Po and Veneto plains were formed during the Quaternary period through the erosion of the Alpine and Apennine mountain ranges. These mountain ranges are mostly composed of crystalline basement rocks in the Western Alps, along with sedimentary deposits, generally of marine origin. Contemporary continental sediments were laid down in the Lower-Upper Pleistocene to Holocene period. The cumulative thickness of Quaternary sediments can reach around 0.5 km [25,26,27].
Consequently, from a geological perspective, the Po-Veneto plain can be divided into two distinct depositional environments: the High Plain and the Low Plain. The High Plain is composed of coarse-grained clastic sediments, primarily gravels, which are sometimes irregularly cemented into conglomerate layers (in the Veneto plain). These deposits are the result of the rapid progradation of an upper Pleistocene alluvial fan system [28,29]. The Low Plain, on the other hand, is characterized by sand and clay deposits, interspersed with gravel and peat horizons. These sediments are partly of fluvio-glacial origin, and partly of marine, lagoonal, and marshy origin [30].
In this depositional framework, the Po River tributaries and the other rivers of the eastern side of northern Italy erode rocks, producing coarse sediments that accumulate at the base of mountain belts (high-energy environment). In contrast, the river transports finer sediments (low energy environment) toward the sea. The alluvial deposits gradually decrease in size as they approach the middle of the plain and the river deltas along the Adriatic Sea coast.

2.2. Hydrogeological Features

The aquifer system in the studied region mostly comprises multiple layers of aquifers composed of gravel and sand interspersed with silt and clay. The shallow aquifers are typically unconfined, whereas the deeper aquifers are semiconfined or confined. Unconfined aquifers in low plain areas typically have little connectivity with underlying aquifers. These locations are characterized by a higher concentration of fine sediments. In contrast, alluvial fan areas, which have coarser sediments, show clear evidence of efficient connections between shallow and deep aquifers. The thickness of this aquifer system varies from a few dozen to several hundred meters (Figure 2).
The unconfined aquifer exhibits groundwater flow that is mostly directed towards the Po River. In the pre-alpine region, the flow is broadly oriented in a north–south direction, while closer to the Apennines, it is oriented south–north. In the center western sector, the movement of water is primarily influenced by the draining effect of the Po River and its tributaries. However, in the eastern sector, there is no direct connection between the Po River and the underground water.
Greater hydraulic gradients are observed near the Alpine and Apennine mountain ranges in areas with alluvial fans (Figure 1). The hydraulic gradients in the Piedmont region typically range from 8‰ to 10‰, whereas in the other sections of the Po and Veneto-Friuli high plain, they range from 8‰ to 4‰. The hydraulic gradients in low plain aquifers along the Po River typically range from 1‰ to 4‰. In the central-eastern section of the Po Valley, these gradients drop to values of 1–0.2‰. The decrease in the hydraulic gradient at the transition from the high to low plain is typically linked to the appearance of lowland springs (e.g., [10,31,32]).
Various authors have described alluvial fans in northern Italy; see, e.g., [33,34]. Shallow aquifers and aquifers found in alluvial fans exhibit relatively high intrinsic vulnerability values, whereas deep aquifers and shallow aquifers with fine sediments in the unsaturated zone display lower vulnerability [21]. Alluvial fan areas exhibit the highest hydraulic conductivity, ranging from 1 × 10⁻³ to 10−2 m/s. In contrast, low plain areas have lower values, ranging from 1 × 10⁻⁵ to 10−4 m/s [32]. However, certain regions in the western and central sectors of the low plain display relatively high permeability coefficients. The water level depth in shallow aquifers in the Po Plain exhibits significant variability. In the central portion of the plain, minimum values of 1–5 m below ground level (b.g.l.) are seen. However, as one moves closer to the Alps, the water level depth can reach 30–50 m, while in proximity to the Apennines, it is typically around 10 m.
In support of this, for example, and based on lithostratigraphic data, Figure 2 illustrates the following:
(a)
In the Friuli region (Figure 2, hydrogeological section A; [31]), north of the resurgence line (High Plain), the conceptual hydrogeological model comprises an unconfined undifferentiated aquifer (A), consisting of approximately 20 to 120 m of coarse-grained gravel and sandy sediments. Due to its high hydraulic conductivity (about 10−3 m/s), this unconfined aquifer is particularly vulnerable to surface pollution sources. Its primary recharge occurs through vertical infiltration of rainfall and lateral infiltration from the Tagliamento River bed (estimated flow of about 1.5 m3/s/km; in [31]). In general, the High Plain, corresponds to the recharge area of aquifers that develop in the Low Plain.
South of the resurgence line (Low Plain), a multi-aquifer system is present (aquifers A0, A1 and A2). This system includes one unconfined aquifer (A0) and, at increasing depths (up to 180 m), two confined aquifer (A1, A2) systems primarily composed of sandy lithologies. These aquifers demonstrate hydraulic conductivity values of approximately 5 × 10⁻⁴ to 10−5 m/s and are hydraulically separated from each other by predominantly clay layers.
(b)
Similarly, in Emilia-Romagna region, as illustrated in hydrogeological section B of Figure 2, there is a transition from the undifferentiated unconfined aquifer system (A), developed in the area of the fluvial fans (High Plain), to the multi-aquifer system of the Lower Plain (aquifers A1 and A2).
Specifically, the aquifer A reaches an overall thickness up to 100 m; whereas the confined aquifers of the Lower Plain present thicknesses typically ranging from 10 to 20 m.
Owing to its gravelly or gravelly–sandy composition, the unconfined aquifer has higher hydraulic conductivity values compared to the confined aquifers, which are predominantly sandy, sometimes with intercalations of small silty-sandy or silty sand lenses [32,35].
Recharge of the confined aquifer systems A1 and A2 occurs from the unconfined undifferentiated aquifer (A), and locally laterally via infiltration from the Po River. It is important to highlight that the undifferentiated aquifer A, developed within the conoid area, is recharged directly by atmospheric precipitation and indirectly through lateral infiltration from hydrographic network (see Section 2.3).
The ARPAs are responsible for the quantitative and qualitative monitoring of surface and groundwater in Italy. Two samplings per year are carried out in selected wells during spring and autumn. Anions, cations, and trace elements are routinely analyzed by standardized methods [36]. Anions are determined by ion chromatography while cations are determined by atomic absorption spectrophotometry. Bicarbonate is determined by titration. All reported values have an ionic balance within 5%.
In northern Italy, the Ca (Mg)-HCO3 hydrochemical facies is prevalent in all aquifers, followed by the Na (K)-HCO3, the Ca(Mg)-SO4 facies and the Na (K)-Cl facies [21,37]. The presence of Ca (Mg) HCO3 water is uniformly distributed across the study area, consistent with the groundwater properties seen in temperate region aquifers, as documented by multiple authors (e.g., [38]). Their formation is a result of the dissolving of carbonate deposits, which are the primary minerals that make up the aquifers. Local factors may influence the distribution of hydrochemical facies in different aquifers. Within the phreatic aquifers, the predominant kind of water sample consists of Ca (Mg)-HCO3, whereas the second most prevalent category comprises Ca (Mg)-SO4 water.
Nitrate leaching into groundwater is a major source of pollution phenomena frequently occurring in northern Italy, particularly in indifferent aquifer (alluvial fans; High Plain) and in the unconfined aquifer that develops in some areas of the alluvial plain (Low Plain). This phenomenon is primarily associated with:
(a)
the widespread prevalence of intensive agriculture and the extensive use of nitrate fertilizers, improper management of livestock waste, and leakage from urban sewage systems [39]. The areas adjacent to the Alps and the Apennines experience the most severe nitrate pollution, sometimes exceeding 100 mg/L; and
(b)
the high intrinsic vulnerability (Figure 3) of the indifferent aquifer, due to its high hydraulic conductivity, and of the unconfined aquifer systems, attributed to the shallow depth to the water table (1–2 m) and the lithological composition of the unsaturated zone (sandy or silty-sandy).

2.3. Sources and Description of Bicarbonate and Nitrate Data

The possible concomitant origin of relatively high HCO3 and NO3 values was verified through statistical analysis of chemical data produced during the time and made available in northern Italy by the ARPAs of the regions of Emilia-Romagna, Lombardy, Piedmont, Aosta Valley, Veneto, and Friuli Venezia Giulia (Figure 4).
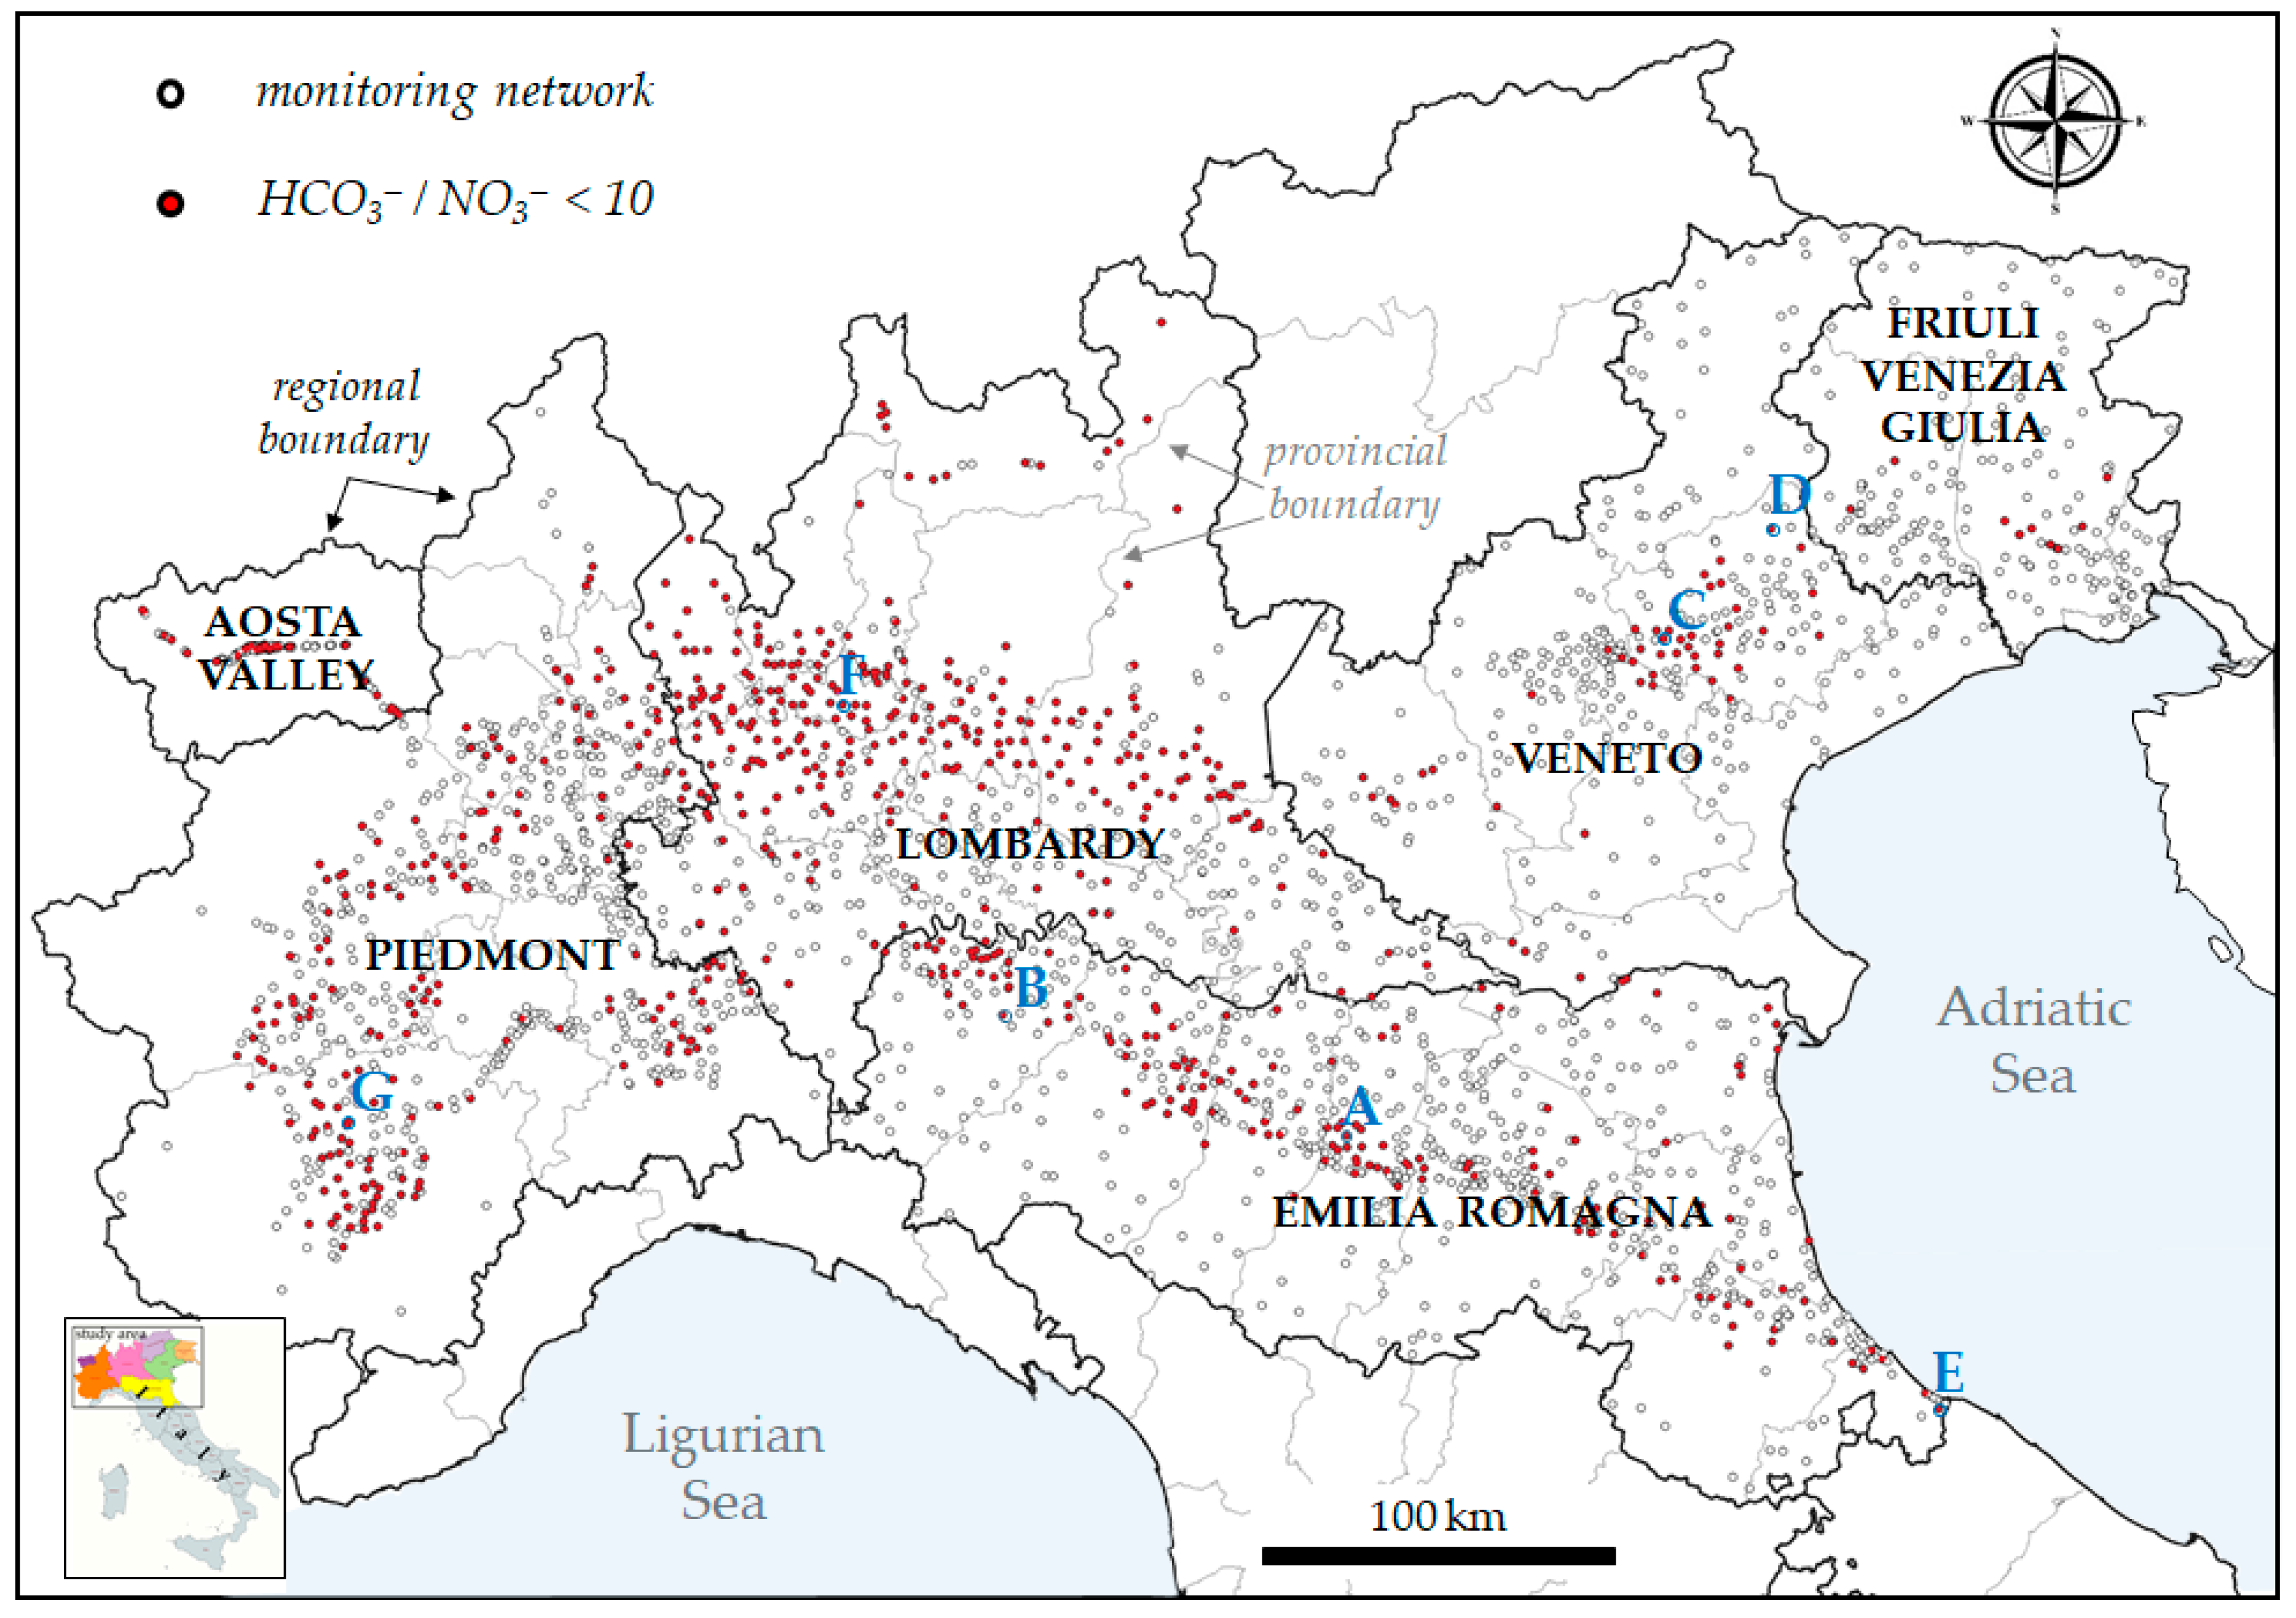
A database consisting of selected wells (sampling points) with available ion concentration data for bicarbonates and nitrates were considered for analysis. In Figure 5, all sampling locations are shown as empty circles (total 1280 wells), whereas red circles (402 point) indicate the wells that meet the selection criteria described in the next chapter (HCO3/NO3 < 10) and were subsequently included in further analysis. Also, A, B, … G (marked in blue) indicate the observation wells selected for detailed analyses and discussion in the following Section 3.2. All wells deemed reliable due to the technical characteristics of the ARPAs’ control networks were selected.
In particular, the data analyzed refer to the period between 2012 and 2023. The typical sampling frequency is generally twice a year (in autumn and spring). It is important to note that not all the observation points analyzed had a complete dataset over the entire time span considered. Based on the available data, the possible correlation between the two parameters was assessed over time in the wells. Correlation indices and trend lines were added to binary graphs relating to the same parameters; regression analyses, with standard error (SER), coefficient of determination (R2), and Pearson (r) correlation coefficient are also reported. Furthermore, for each observation point, (a) the main statistical measures were analyzed, including minimum, maximum, and average values, as well as the correlation coefficient (CV). This methodological approach allowed a comprehensive evaluation of groundwater chemical dynamics and the identification of key trends related to recharge processes.

3. Results

3.1. Criteria and Constraints

In Emilia-Romagna, Martinelli et al., 2014 [22] reported hydrochemical and isotopic data from a monitoring network consisting of 208 wells. Of these, 168 wells located in the middle and lower plain have depths ranging from 60 to 550 m, while 40 wells situated in the Apennine alluvial fan area (High plain; recharge area) have depths ranging from 10 to 58 m. Groundwater velocity can reach 2–4 m/day recharge areas of the High plain, while it drastically decreases in the low plain areas, down to almost 7 × 10⁻⁵ cm/day.
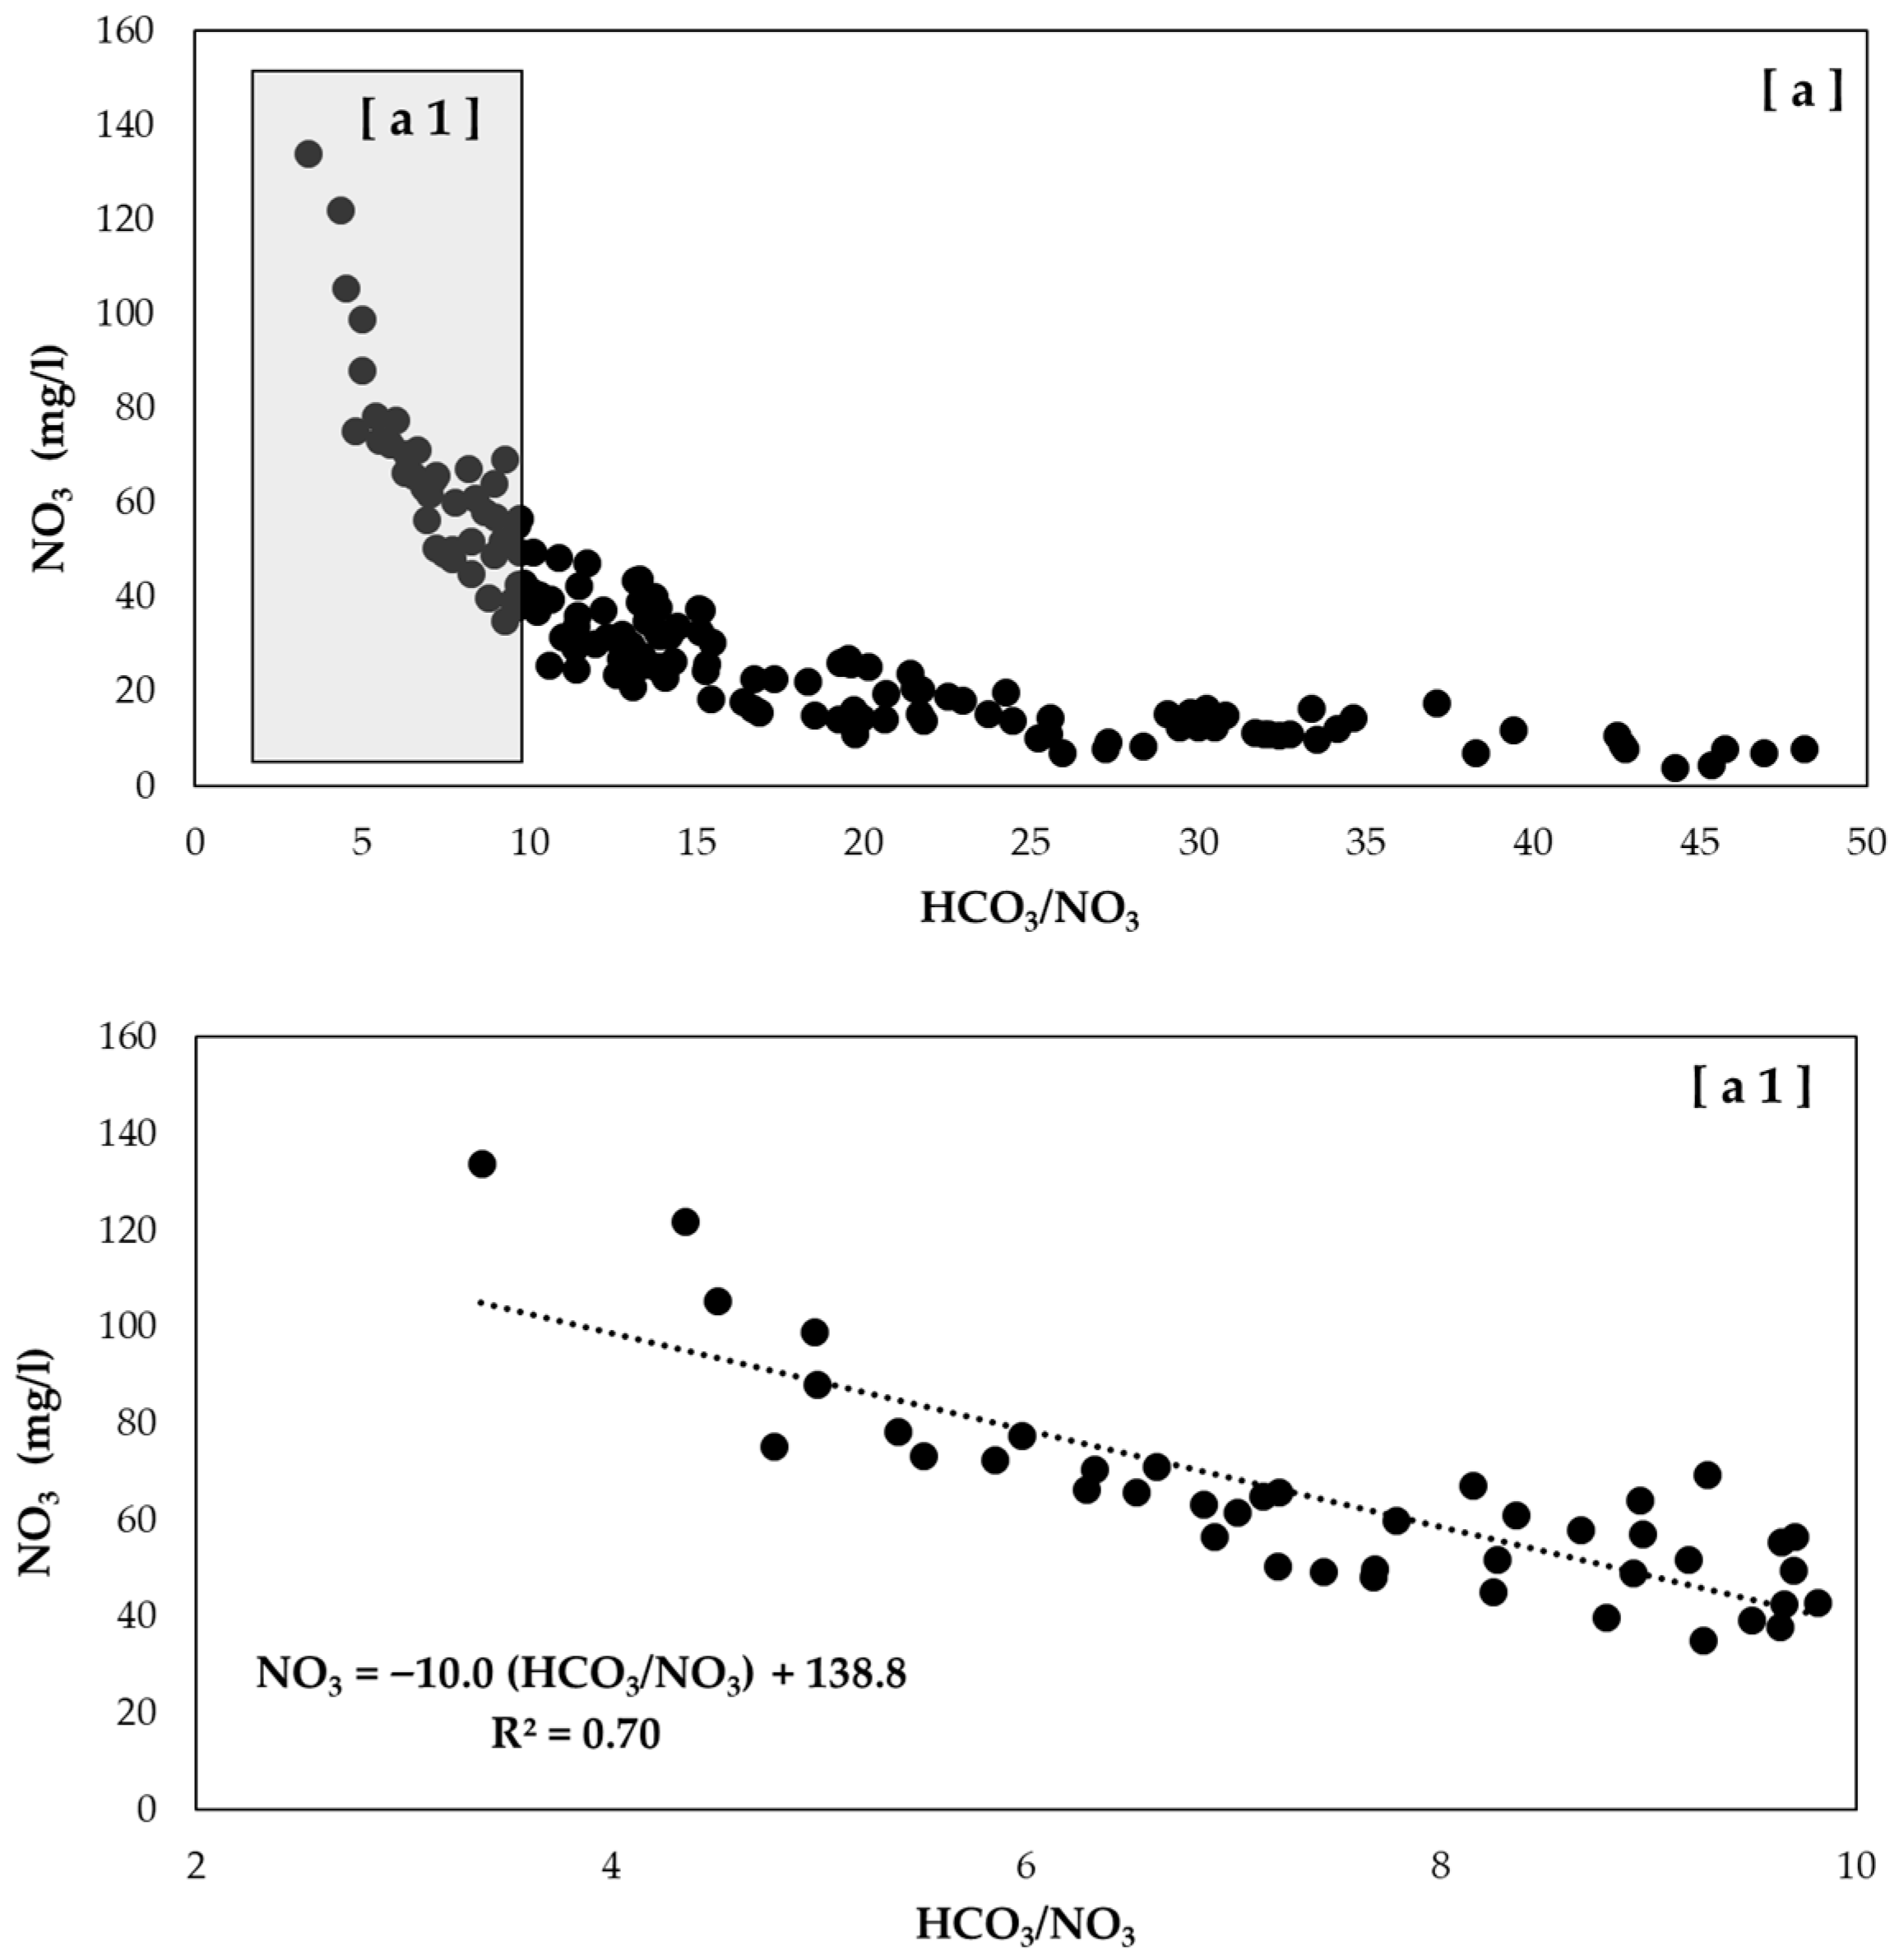
In Figure 5, based on the point hydrochemical data provided by Martinelli et al. [22], the HCO3/NO3 ratio versus NO3 concentration is calculated and presented. From the distribution of the analytical data, it can be observed that there is an exponential relationship between the considered parameters; higher NO3 concentrations are associated with lower values of the ratio.
Furthermore, for an HCO3/NO3 ratio lower than 10, the analytical data align along a line represented by the general equation y = a x + b. Notably, the corresponding sampling points are located within aquifer recharge zones, specifically in the alluvial fans of the High plain. The equation, their corresponding coefficient of determination, and the range of nitrate concentrations for which the equations are valid are presented in Table 1.
Taking these considerations into account, for the purposes of this study, the sampling points (wells) from the Po Valley were selected and analyzed based on the following criteria:
HCO3/NO3 < 10 and NO3 > 30 mg/L
Moreover, comparable results were obtained from the analysis of the analytical data reported in the study by Cheng et al. [41], employing the same methodological approach (Supplementary Materials; Table S1 and Figure S2). This comparison was useful for two major reasons: (a) it contributed defining and selecting the criteria and the constraints used in our analysis; and (b) it supports the broader applicability of our proposed methodological approach, showing that it is not limited to the alluvial aquifers in northern Italy (Po Plain), but may also be relevant in similar hydrogeological contexts.

3.2. Examples of HCO3/NO3 Trends Recorded in Wells of the Po Valley

This chapter presents and analyzes the spatio-temporal evolution of bicarbonate and nitrate concentrations in groundwater, based on data collected from selected monitoring points (Figure 4; labeled A to G). The selected sites (wells), identified according to the criteria and constraints described in the previous section (HCO3/NO3 < 10 and NO3 > 30 mg/L), have been selected for their ability to effectively represent HCO3 and NO3 concentrations in groundwater hosted in the alluvial fan aquifers of the Po Plain over the past ten years. The selection process also accounted for the geographic distribution of the monitoring locations as well as the availability, consistency, and continuity of the data series over time.
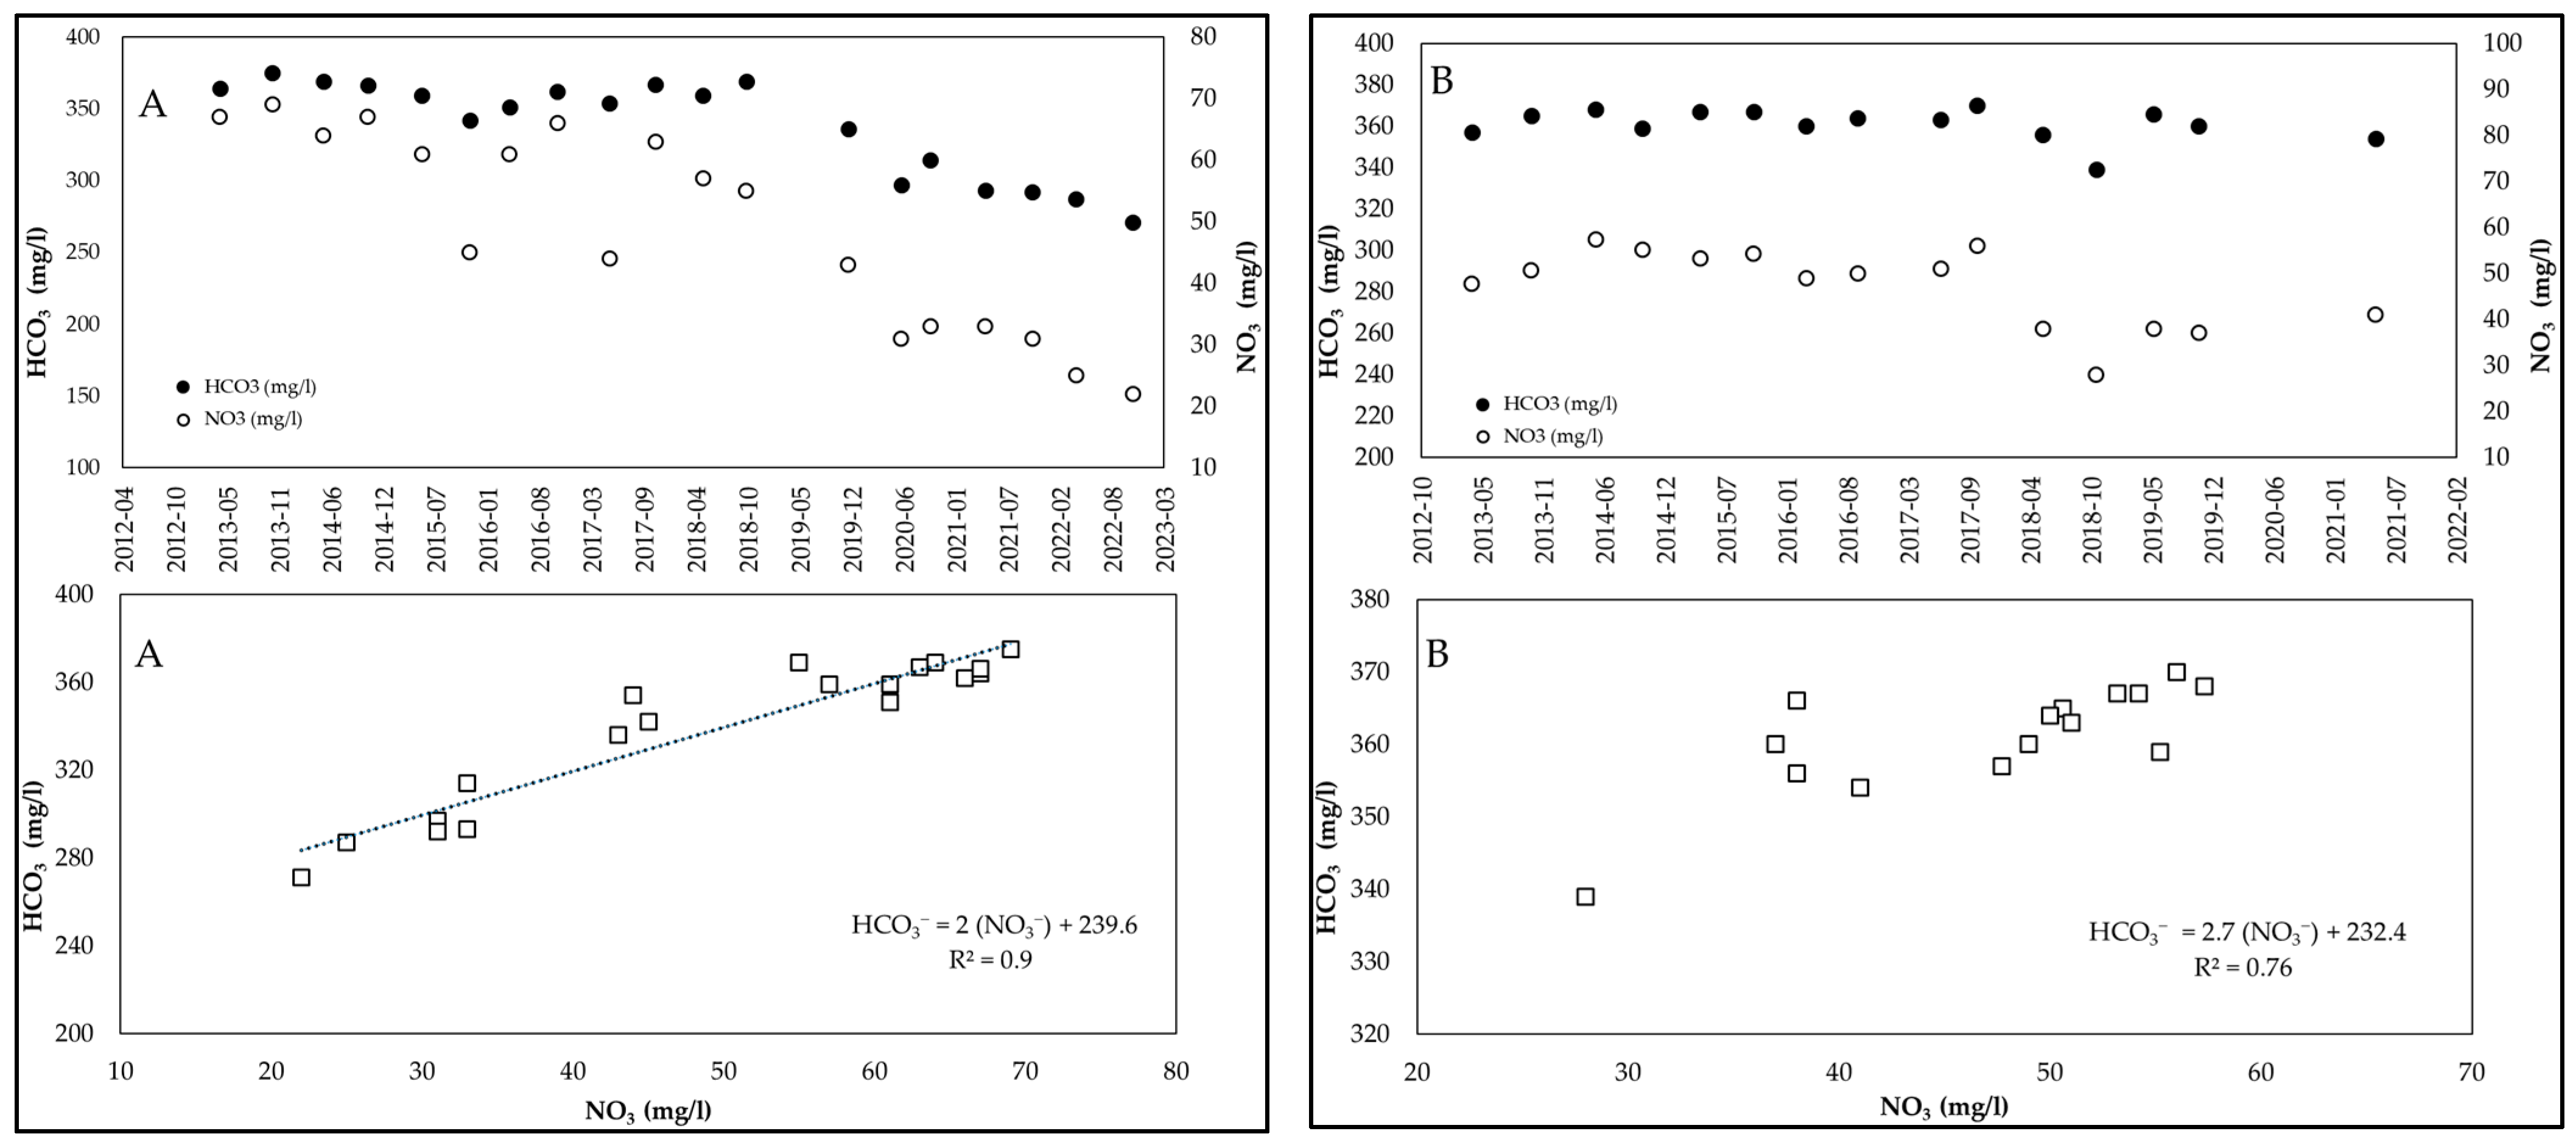
Monitoring well AFigure 6 shows the temporal variations in the concentrations of nitrate and bicarbonate in groundwaters covered by well A, located in the Modena province (Figure 4). A slight decrease in HCO3 and in NO3 concentration was observed during the period 2012–2023. Nitrate concentration is characterized by significant fluctuations (31 to 69 mg/L with mean value of 52 mg/L) and coefficient of variation (CV) values of about 27% (Table 2). The coefficient of variation (CV) is a dimensionless statistical measure used to assess the relative dispersion of a dataset and allows for the comparison of variability between datasets with different means. This is expressed as the ratio of the standard deviation to the mean, multiplied by 100.
The increase in nitrate concentrations during the time can be attributed to surface pollution sources, particularly agricultural activities. On the other hand, bicarbonate shows smaller fluctuations (271 to 375 mg/L), with a CV value of around 10%. The relationship between NO3 and HCO3 is expressed by the linear equation
HCO3 = 2 (NO3) + 239.6
with a coefficient of determination R2 = 0.9, r = 0.94 and SER = 11.5; concentration in mg/L.
All considered data satisfy the selection criteria described in Section 3.1.
Monitoring well BFigure 6 shows the temporal variations in the concentrations of nitrate and bicarbonate in groundwaters caught by well B, located in the Piacenza province (Figure 4). A very slight decrease in HCO3 and in NO3 concentration has been observed during the monitoring period. In groundwaters of well B, the 100% of recorded data is characterized by HCO3/NO3 < 10 while 93% of samples is characterized by NO3 > 30 mg/L. The average concentrations of NO3 is 47.1 (CV~12%) while the average concentration of HCO3 is 361 mg/L (CV~18%) and 361 mg/L, respectively.
The relationship between NO3 and HCO3 is expressed by the linear equation
HCO3 = 2.7 (NO3) + 232.4
with a coefficient of determination R2 = 0.76, r = 0.87 and SER = 21.8; concentration in mg/L.
Monitoring well C. Approximately constant trends of HCO3 and NO3 during the time have been observed at monitoring well C (Figure 7), located in the High Veneto plain (Figure 4; undifferentiated aquifer), where the relationship between bicarbonates and nitrates is expressed by the equation (concentration in mg/L):
HCO3 = 1.4 (NO3) + 267.4
Nonetheless, HCO3 and NO3 concentrations are linearly correlated (coefficient of determination R2 = 0.72, r = 0.85 and SER = 10.6) with a CV of 6% for HCO3 and 24% for NO3. Short term variations in the HCO3-NO3 couple characterize the dataset.
Monitoring well D. The monitoring well D (Figure 4 and Figure 7) catches phreatic waters since it is characterized by a depth of only 6 m. At this observation point, 36% of the NO3 samples is characterized by concentrations lower than 30 mg/L. The HCO3/NO3 ratio is less than 10 in 100% of samples. It is worth noting that HCO3 concentrations fluctuate between 112 and 439 mg/L, while NO3 are in the range 14.3–62.6 mg/L. The relationship between the considered analytical parameters is expressed by the equation:
HCO3 = 4.9 (NO3) + 105.5 with R2 = 0.68, r = 0.82 and SER = 58.6
The coefficient of variation of HCO3 (36%) and NO3 (48%) are relatively high (Figure 7; Table 2). These values imply high dispersion of data points around the mean value, and indicates that HCO3 and NO3 are probably contemporary influenced natural and by anthropogenic activities. Moreover, one should observe the synchronized variations in the ionic concentrations of the two parameters.
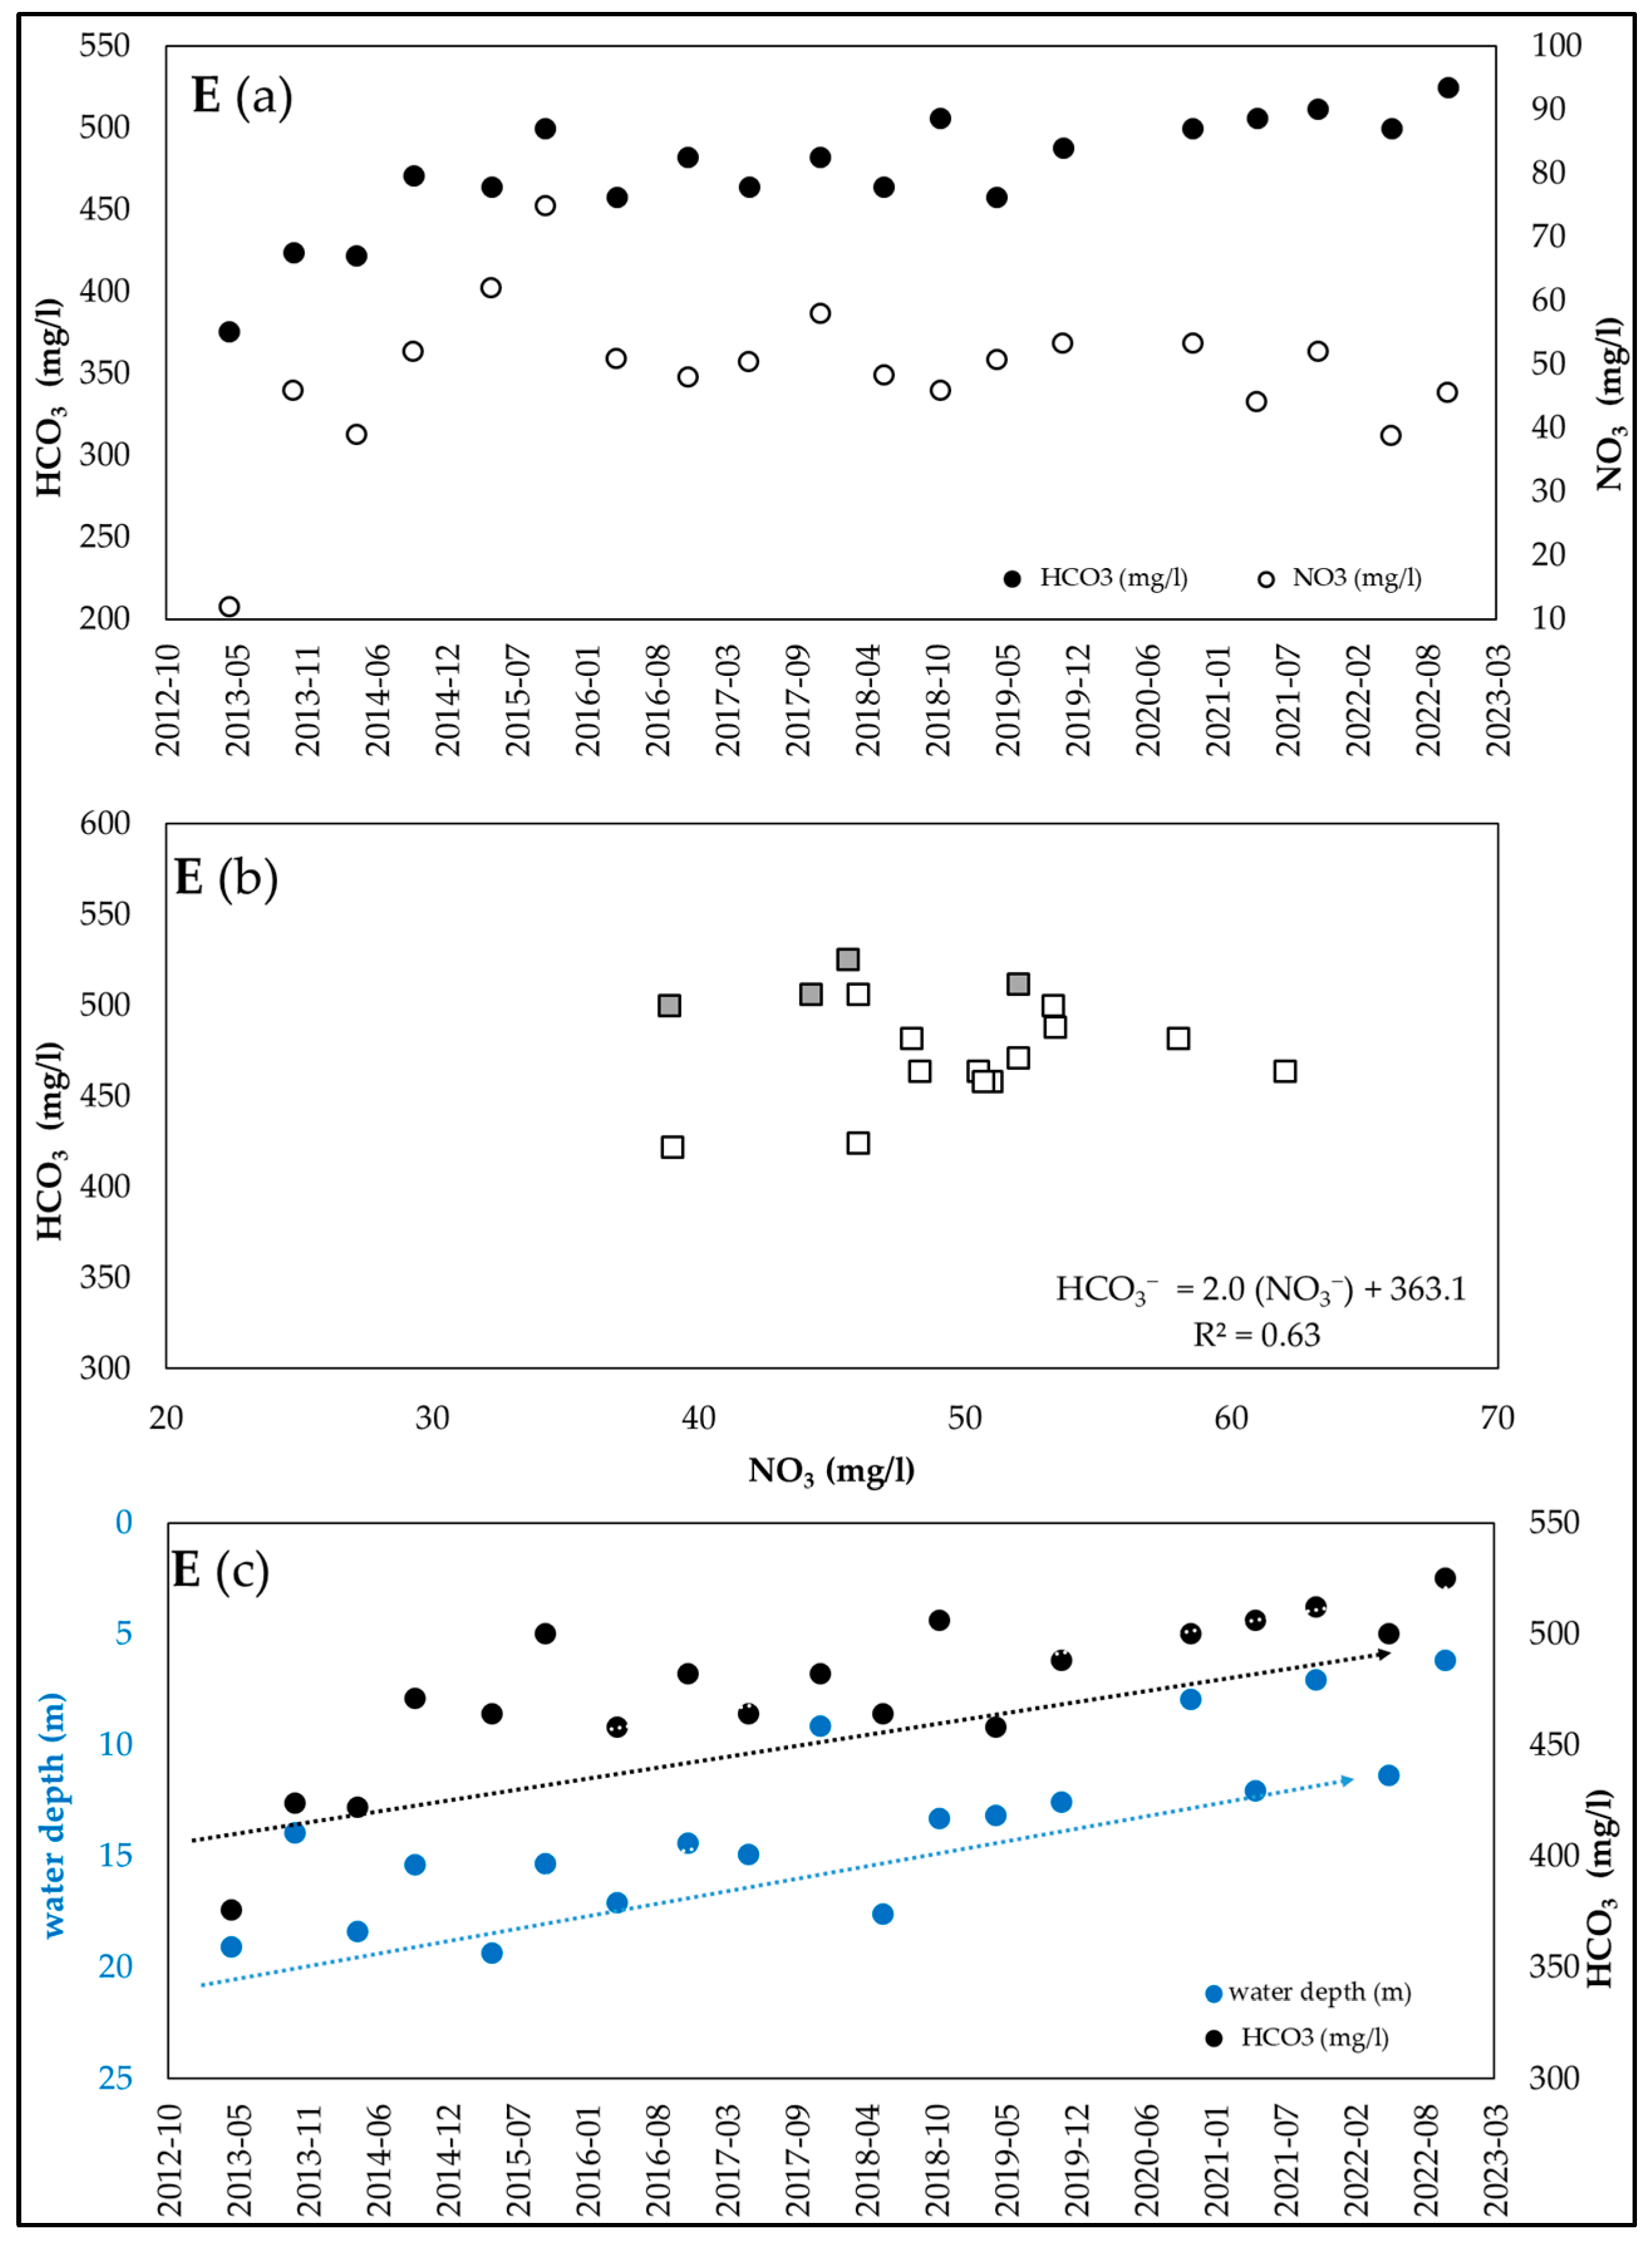
Monitoring well E. In the monitoring well E, 100% of the NO3 data exceed 30 mg/L, while the HCO3/NO3 ratio is below 10 in about 80% of the samples (Figure 4 and Figure 8).
However, in the last five measurement campaigns, the relative constancy in HCO3 concentrations coincides with a decrease in NO3 concentration. In these recent datasets, the HCO3/NO3 ratio is greater than 10. If we exclude these data from the analysis, the relationship between the considered analytical parameters is expressed by the equation (Figure 8b):
HCO3 = 2.0 (NO3) + 363.1
with a coefficient of determination R2 = 0.63, r = 0.79 and SER = 21.8; concentration in mg/L.
The recorded data show a positive short-term correlation between nitrates and bicarbonates, meaning an increase in one parameter implies an increase in the other (Figure 8a). The coefficient of variation of HCO3 is very low, about 8%, and implies low dispersion of data points around the mean value, signifying relatively variability in the time (Table 2).
NO3 variability (CV~16%), indicates that additional parameters (e.g., pollution due to human activities or variation in groundwater level) should also be taken into account for interpreting the data.
Finally, at this monitoring point, the availability of data on groundwater table depth allows for an assessment of the relationship between hydrogeological dynamics and bicarbonate concentrations. In particular, it is generally observed that fluctuations in groundwater depth and HCO3 concentrations tend to follow similar temporal trends, suggesting a potential correlation between the hydrodynamic parameter and the bicarbonate concentration within the system (Figure 8c).
Monitoring well F. In some cases, such as at monitoring well F (Figure 4 and Figure 9), HCO3 exhibits very low values, fluctuating between 129 and 214 mg/L, indicating a possible fast recharge rate for the aquifer. Meanwhile, NO3 concentrations remain stable over time, varying between 35.4 and 40.7 mg/L. The observed constancy is also reflected in the very low CV values (4%). Throughout the entire dataset, the HCO3/NO3 ratio is very low, fluctuating between 3.6 and 5.4 (Table 2).
Monitoring well G. Similar small variations have been observed at monitoring well G (Figure 4 and Figure 9), with coefficient of variation values for nitrates (31.2–35.7 mg/L) and bicarbonates (232.297 mg/L) of 4% and 5%, respectively, and variations in the HCO3/NO3 ratio between 6.6 and 8.2 (CV = 6.5%). These minor fluctuations in ionic concentrations over time suggest the presence of stable hydrogeological conditions, where the natural systems governing alimentation conditions and groundwater flow remain relatively unchanged over time without significant external disturbances.

4. Discussion

The temporal analysis of the analytical data revealed a strong correlation between the trends of nitrate and bicarbonate ion concentrations within the unconfined (undifferentiated) aquifer system of the High Plain in Northern Italy (Figure 2). Given that all monitored wells are located within the recharge area of the aquifers it is reasonable to hypothesize that the observed fluctuations are primarily governed by active recharge processes (as indicated by variations in groundwater level; Figure 8c), as well as by anthropogenic pollution phenomena, which are reflected in the high correlation coefficients of nitrate concentrations (e.g., monitoring point D; Figure 7).
In this context, the following research questions are addressed: (a) what is the sensitivity or response of bicarbonate and nitrate concentrations to the main meteorological factors? To which factors can the observed correlation between HCO3 and NO3 in aquifer recharge areas be attributed? To address these questions, the key parameters and processes governing the ionic concentrations of NO3 and HCO3 within groundwater recharge zones are analyzed; and (b) do these concentrations reflect rapid or slow recharge processes? To investigate the latter, the tritium–nitrate relationship was examined within selected recharge zones.

4.1. Sensitivity of Bicarbonate and Nitrate to Meteorological Factors: Theoretical Framework

Almost all groundwater is derived from precipitation in the atmosphere that seeps through the soil and enters flow networks in the underlying geological formations. Within recharge zones, the soil zone experiences a net depletion of mineral matter due to the movement of water [42]. Groundwater undergoes chemical transformations as it flows from sites of recharge to areas of discharge, according to various geochemical processes. The concentration of dissolved solids in atmospheric precipitation is typically a few milligrams per liter [38].
The pH levels of rainwater and melted snow in nonurban, nonindustrial environments typically range from 5 to 6. Water precipitations are highly diluted, mildly to moderately acidic, oxidizing solutions that can induce chemical transformations in the soils or geological materials they permeate.
Most of the water that seeps into natural groundwater flow networks traverses through the soil zone. The soil possesses the capacity to produce significant quantities of acid and to deplete a substantial portion or all of the dissolved oxygen present in the infiltrating water.
The primary acid generated in the soil zone is H2CO3, which is formed by the interaction between CO2 and H2O. CO2 is produced by the decomposition of organic matter and the respiration of plant roots (e.g., [43] and references therein). When carbon dioxide-charged water passes through the soil, it often comes into contact with minerals that can dissolve due to the presence of H2CO3. This happens because the minerals react with the water containing carbon dioxide. As groundwater flows through the saturated zone, it typically experiences a rise in total dissolved solids and most of the major ions. Groundwater research conducted in many regions of the world have consistently shown that shallow groundwater in recharge areas contains lower levels of dissolved solids compared to deeper water within the same system, as well as lower levels than water found in shallow zones in discharge areas [44].
Nitrate, in the form of dissolved nitrogen, is the predominant contaminant found in groundwater. This contamination is mostly caused by agricultural practices and the disposal of sewage on the soil’s surface. The presence of nitrate in groundwater primarily comes from nitrate sources located on the land surface and inside the soil zone. NH4+ is oxidized to NO3 through the process of nitrification. Nitrification typically takes place in the soil zone above the water table, where there is a substantial amount of organic matter and oxygen. Significant amounts of dissolved oxygen linked to atmospheric precipitations and to recharge processes are often found in shallow groundwater that is located in sediments affected by high permeability. NO3 may originate in these hydrogeologic settings.
Rupert et al. [45], Wei et al. [46], among others, underlined that frequent nitrate concentration fluctuations due to variations in the water level induced by recharge processes frequently occur. Recharge processes have been considered to be responsible for significant nitrate variations observed in groundwaters in northern Italy by various authors, such as Vicari and Zavatti [47], Di Lorenzo et al. [48], Severini et al. [49], and Cocca et al. [50].
The eventual and occasional presence of additional anions such as SO42− and Cl, or even additional elements such as Na+ and K+, in circumstances that are not supported by the geological and lithological situation can be attributed to the way that fertilizers of mineral or animal origin are used [21,39], or even the use of salt spread along roads [51].
Therefore, HCO3 and NO3 may originate in the same hydrogeologic environments and, in principle, could be influenced by a similar fate and could be sensitive to similar recharge processes.

4.2. Nitrate and Tritium in Groundwater Recharge Areas

In general, the proportion of young groundwater decreases from recharge areas, through intermediate and drained areas, to discharge areas. Both horizontal and vertical variations in groundwater age are reflected in the concentration of contaminants introduced into the aquifers. In this way, groundwater with young apparent age shows a rapid response to anthropogenic contaminants (e.g., high concentrations of NO3, SO42−). While in older waters, which follow longer paths underground, attenuation processes dominate, and water-rock interactions prevail, resulting in high hydrochemical concentrations derived from natural geogenic sources (e.g., [10,52,53,54,55,56,57]).
Therefore, considering both groundwater residence time and hydrochemistry can significantly improve our understanding of anthropogenic impacts on groundwater quality in addition to offering valuable insights into the vulnerability of aquifers.
In support of all this, for example, in agricultural areas of the U.S. Midwest and the Taihang Mountains (NCP), Hess et al. [58] and Zheng and Wang [59] respectively reported an increase in NO3 leaching into groundwater during extreme or heavy precipitation. This increase is attributed to the rapid transport of accumulated chemical fertilizers in the vadose zone, by fast flow, in the aquifers. Notably, these results suggest that, groundwater resources in such areas are vulnerable to climate variability and these areas are located within the recharge zone of aquifers.
Brkić et al. [60], in the Varaždin aquifer system (Croatia), compared groundwater age with nitrate concentrations, demonstrating that: (a) within the aquifer, the proportion of young groundwater decreases with depth; (b) approximately 80% of the groundwater in the shallow part of the aquifer (~15 m) was less than 10 years old, with a mean annual nitrate concentration of about 100 mg/L, while at a depth of 35 m, about 75% of the groundwater was less than 30 years old, with a mean annual nitrate concentration of about 30 mg/L.
In this regard, Ravikumar and Somashekar [61], Alikhani, et al. [62], Martinez-Salvador et al. [63], McNeil et al. [64], Castaldo et al. [65], Cheng et al. [41], and Galloway et al. [66] noted that the groundwater with the lowest nitrate concentration also has the lowest tritium level. In confirmation of this, in Figure S1 reported in the Supplementary Materials, we can observe how in the alluvial aquifer system of Shijiazhuang (China; [41]), in general, high concentrations of NO3 appear in younger groundwater, with mean residence time of less than 20 years.
In northern Italy, Nitrate Vulnerable Zones (NVZs; Figure 3) represent a percentage ranging between 50% and 60% of the total plain areas in each respective region (Italian institute for environmental protection and research, ISPRA) [40]. Within the NVZs, farmers are required to execute action programs that include mandatory restrictions on fertilizer application (both mineral and organic) and other measures at the farm level. The distribution of rainfall exhibits a notable decrease throughout the summer season and two peaks during the autumn and spring. By the end of the winter season, the snow cover at the main watershed divide may reach a depth of 2–3 m.
Tritium has proven to be an effective marker for tracking groundwater recharge phenomena in northern Italy in recent decades [67] and references therein [68]. A possible relationship between higher tritium values and some nitrate pollution phenomena due to agricultural practices and the vulnerability of the aquifer in the conoid areas was also noted [69] and references therein [70].
Tritium values are less common than the NO3 values that are constantly collected by various environmental agencies, but are useful for tracking pollution phenomena and estimating the mean residence time of water in aquifers. Therefore, NO3 values, when available, could tentatively be used as a low-cost proxy to track recharge phenomena.
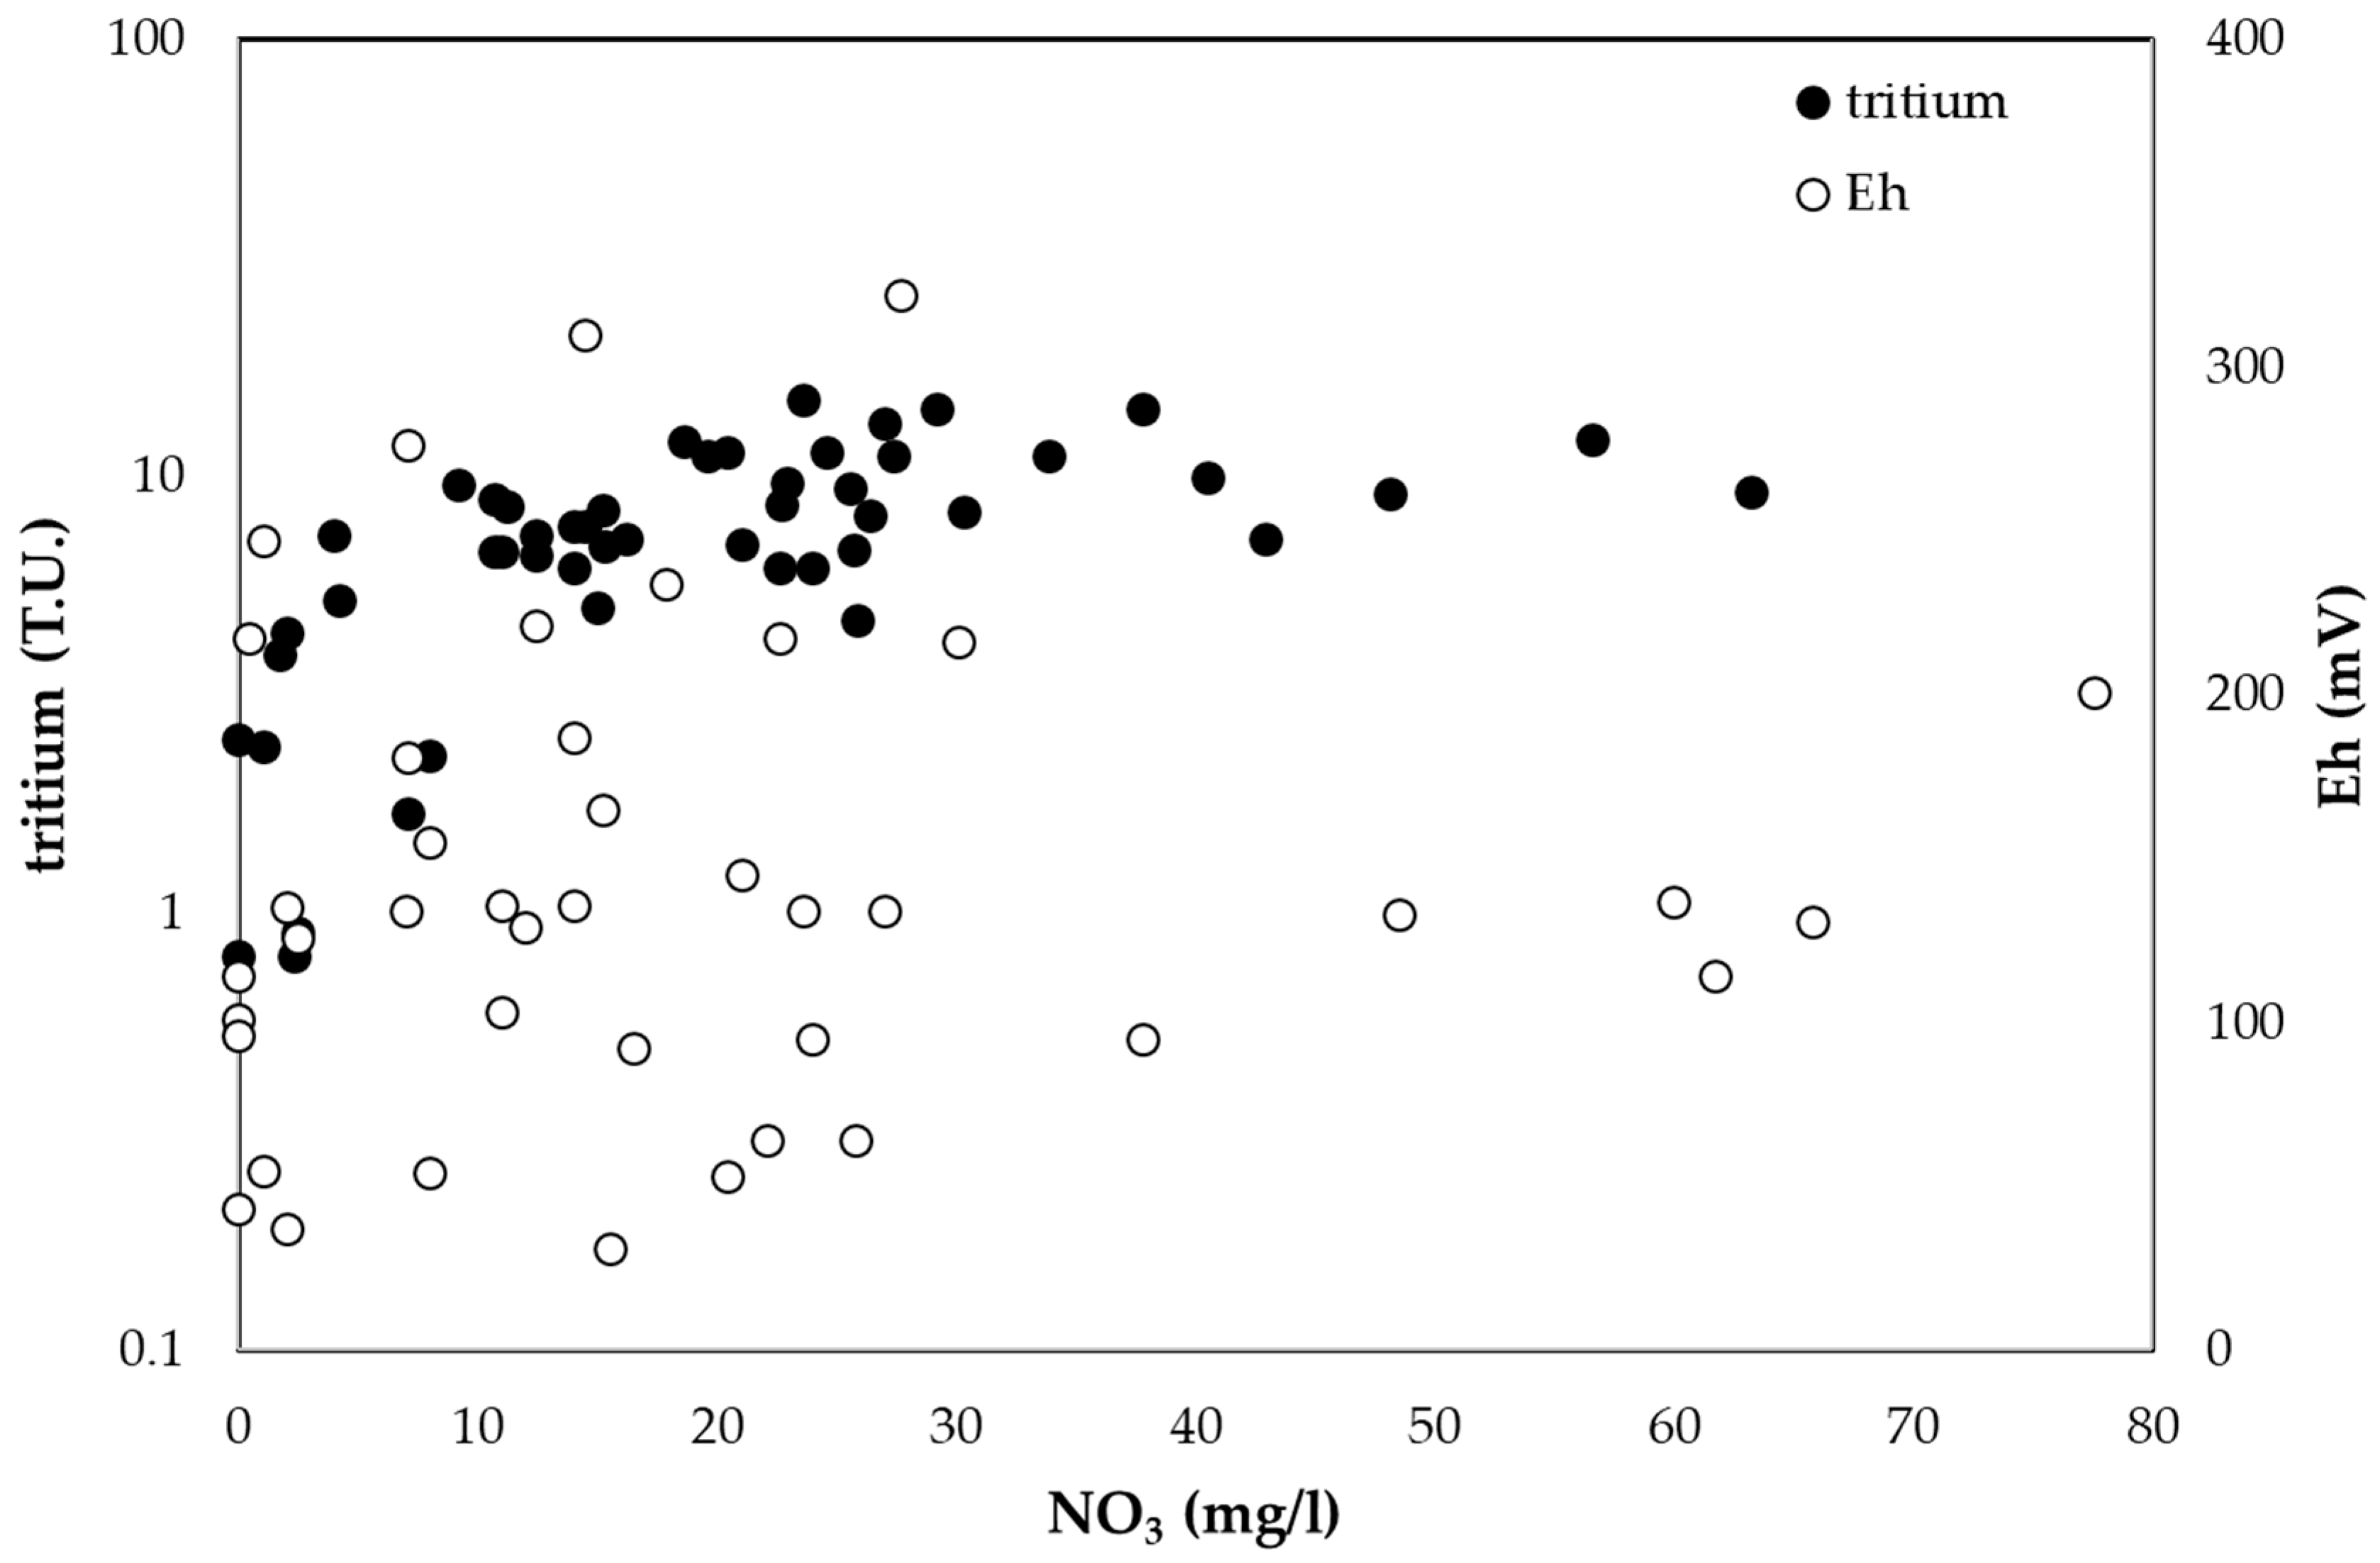
In the aquifers that develop in the conoid areas of the Emilia-Romagna Region (see section b in Figure 2), a possible relationship between tritium values and NO3 concentrations observed in groundwater is highlighted in Figure 10, based on the available analytical data.
It should be noted that, in the analyzed samples, the redox potential shows significant fluctuations, ranging from 31 to 322 mV, with an average value of 142 mV. The positive redox potential values are particularly noteworthy, as they indicate an oxidizing environment, while the high coefficient of variation values (50%) could be attributed to local hydrogeochemical factors such as groundwater pH, temperature or salinity. The observed low tritium values (long residence times) are related to low NO3 values, while relatively high NO3 values have been observed in Tritium-rich water samples indicating relatively short residence times. Thus, residence times significantly affect NO3 concentration values and could, in principle, be inferred when other local parameters are known.

5. Conclusions

Sustainable development meets the needs of the present without compromising the ability of future generations to meet their own needs [72]. Taking this definition into account, and considering climate change and the continuous increase in anthropogenic pressure, aquifer systems are expected to face substantial stress in the coming decades as they strive to satisfy the growing water demands of human populations, ecosystems, and economic activities. This growing challenge underscores the urgent need for effective strategies to preserve both the quantity and quality of groundwater.
A critical component of such strategies is the identification of aquifer recharge areas and processes of recharge, actions important for managing water availability and for the identification of areas where aquifers, due to their hydrostratigraphic structure and level of anthropogenic pressure, are more vulnerable to pollution from surface sources.
In this context, Northern Italy, specifically the Po and Venetian alluvial plain, was selected for the evaluation of aquifer recharge processes. The region covers approximately 100,000 km2, with roughly 50% of the land area utilized for agricultural and livestock activities.
In this area, time series of NO3 and HCO3 concentration values in groundwater over a period of 12 years were analyzed for wells with known tritium concentrations. This showed that the highest values in NO3 correlated with the highest tritium values and were attributable to a recent recharge. Moreover, choosing the wells that satisfy the criterion HCO3/NO3 ratio < 10 and NO3 > 30 mg/L, the time series of NO3 and HCO3 values were then analyzed, and synchronous variations were highlighted. This made it possible to estimate recharge processes with a seasonal or annual duration.
The processing of lithostratigraphic, hydrogeological, hydrochemical, and isotopic data through the adoption of a holistic approach enabled us to develop an unconventional method to highlight rapid recharge processes in groundwater through the use of a low-cost tracer present as a pollutant in areas affected by NO3 contamination. The method can also be used to highlight areas subject to the most intense NO3 pollution phenomena.
The adopted methodology can provide additional information on pollution dynamics if all available data over time is used. The groundwater most affected in the studied region is found in the alluvial fans of the Alpine and Apennine foothills. This is a result of the combination of a high level of soil permeability and the presence of intense agricultural activity. These shallow aquifers are distinguished by rapid groundwater flow and variable depths of the water table. The adopted expeditive method could probably benefit from a higher sampling rate, capable of better constraining assessments about the time of travel of pollutants, etc.
A critical assessment of the proposed methodological approach allows for the identification of its main strengths and limitations.
Strengths: (a) it represents a rapid and simplified method; (b) it is cost-effective; and (c) it can be integrated with conventional hydrogeological techniques to support identifying and characterizing active recharge zones within aquifer systems.
Limitations: (a) the applicability of the method is restricted to anthropogenically influenced environments, where nitrate (NO3) concentrations in groundwater exceed 30 mg/L; and (b) it is best suited for unconfined aquifers characterized by high hydraulic conductivity and relatively rapid groundwater flow (recharge areas), whereas it is not appropriate for confined aquifers, which display very low flow velocities and prolonged groundwater residence times.
Finally, the implementation of the methodological approach presented in this study requires the development of a preliminary, site-specific conceptual hydrogeological model. At the same time, the approach serves as an operational tool that enhances and strengthens the overall robustness of such a model. Furthermore, we aim to encourage researchers to test and validate the proposed method for the delineation of aquifer recharge zones in different hydrogeological contexts.

Supplementary Materials

The following supporting information can be downloaded at: https://www.mdpi.com/article/10.3390/environments12110404/s1, Figure S1: Mean residence time of the ground water [a] and nitrate concentration [b] versus depth in the alluvial aquifer system of Shijiazhuang (SJZ) in the Piedmont region of the north China plain (data from Cheng et al. [41]); Figure S2: Scattering distribution of nitrate concentration (mg/L) versus ratio HCO3/NO3. [a] all analytical data (from Cheng et al. [41]) and [a1], only data with a ratio HCO3/NO3 <10; Table S1: Equation describing the relationship between HCO3/NO3 and NO3; coefficient of determination (R2); and the range of HCO3/NO3 and NO3 values for which the equation is applicable (dataset is derived from the research by Cheng et al. [41]).

Author Contributions

Conceptualization, D.R. and G.M.; methodology, D.R. and G.M.; validation, D.R. and G.M.; formal analysis, D.R. and G.M.; investigation, D.R. and G.M.; resources, D.R.; data curation, D.R.; writing—original draft preparation, D.R. and G.M. writing—review and editing, D.R. and G.M.; visualization, D.R. and G.M.; supervision, D.R.; project administration, D.R. All authors have read and agreed to the published version of the manuscript.

Funding

This research received no external funding.

Data Availability Statement

The original contributions presented in the study are included in the article, further inquiries can be directed to the corresponding author.

Acknowledgments

We would like to express our sincerest gratitude to the Regional Environmental Protection Agencies of Emilia-Romagna, Veneto, Piedmont, Aosta Valley, and Lombardy for their invaluable support in the acquisition of analytical data, which was essential for the development of this study. We also extend our thanks to NEA, Geoinvest and Elena Baraldini for their valuable contribution to the processing and analysis of the dataset. Finally, thanks are also due to four anonymous Reviewers who contributed to improving the quality of the manuscript.

Conflicts of Interest

The authors declare no conflicts of interest.

References

  1. United Nations. Transforming Our World: The 2030 Agenda for Sustainable Development. 2015. 35p. Available online: https://documents.un.org/doc/undoc/gen/n15/291/89/pdf/n1529189.pdf (accessed on 28 June 2025).
  2. Šimůnek, J.; Huang, K.; van Genuchten, M.T. The HYDRUS Code for Simulating the One-Dimensional Movement of Water, Heat, and Multiple Solutes in Variably-Saturated Media; Version 6.0; Department of Environmental Sciences, University of California Riverside: Riverside, CA, USA, 1998. [Google Scholar]
  3. Niswonger, R.; Prudic, D.; Regan, R. Documentation of the Unsaturated-Zone Flow (UZF1) Package for Modeling Unsaturated Flow Between the Land Surface and the Water Table with MODFLOW-2005; U.S. Geological Techniques and Methods Book 6; U.S. Geological Survey Publication: Reston, VA, USA, 2006; Chapter A19. [Google Scholar]
  4. Batelaan, O.; De Smedt, F. WetSpass: A Flexible, GIS Based, Distributed Recharge Methodology For Regional Groundwater Modelling; IAHS-AISH Publication: Maastricht, The Netherlands, 2001; Volume 269, pp. 11–18. [Google Scholar]
  5. Veeranna, J.; Jeet, P. Groundwater Recharges Technology for Water Resource Management: A Case Study. In Groundwater Management and Resources; IntechOpen: London, UK, 2021. [Google Scholar] [CrossRef]
  6. Barua, S.; Cartwright, I.; Dresel, P.E.; Daly, E. Using multiple methods to investigate the effects of land-use changes on groundwater recharge in a semi-arid area. Hydrol. Earth Syst. Sci. 2021, 25, 89–104. [Google Scholar] [CrossRef]
  7. Hartmann, A. The Hydrology of Groundwater Systems-From Recharge to Discharge. In Encyclopedia of Inland Waters, 2nd ed.; Mehner, T., Tockner, K., Eds.; Elsevier: Amsterdam, The Netherlands, 2022; Volume 3, pp. 324–330. ISBN 9780128220412. [Google Scholar] [CrossRef]
  8. Han, R.; Liu, W.; Zhang, J.; Zhao, T.; Sun, H.; Xu, Z. Hydrogeochemical charac-teristics and recharge sources identification based on isotopic tracing of alpine rivers in the Tibetan Plateau. Environ. Res. 2023, 229, 115981. [Google Scholar] [CrossRef]
  9. Meadows, C.; Hagedorn, B. Temporal and Spatial Patterns of Groundwater Recharge Across a Small Watershed in the California Sierra Nevada Mountains. Front. Water 2022, 4, 815228. [Google Scholar] [CrossRef]
  10. Rapti-Caputo, D.; Martinelli, G. The geochemical and isotopic composition of aquifer systems in the deltaic region of the Po River plain (northern Italy). Hydrogeol. J. 2009, 17, 467–480. [Google Scholar] [CrossRef]
  11. Shi, P.; Huang, Y.; Yang, C.; Li, Z. Quantitative estimation of groundwater recharge in the thick loess deposits using multiple environmental tracers and methods. J. Hydrol. 2021, 603, 126895. [Google Scholar] [CrossRef]
  12. Yenehun, A.; Nigate, F.; Belay, A.S.; Desta, M.T.; Van Camp, M.; Walraevens, K. Groundwater recharge and water table response to changing conditions for aquifers at different physiography: The case of a semi-humid river catchment, northwestern highlands of Ethiopia. Sci. Total Environ. 2020, 748, 142243. [Google Scholar] [CrossRef]
  13. Gumuła-Kawęcka, A.; Jaworska-Szulc, B.; Szymkiewicz, A.; Gorczewska-Langner, W.; Pruszkowska-Caceres, M.; Angulo-Jaramillo, R.; Šimůnek, J. Estimation of ground-water recharge in a shallow sandy aquifer using unsaturated zone modeling and water table fluctuation method. J. Hydrol. 2022, 605, 127283. [Google Scholar] [CrossRef]
  14. Dekongmen, B.W.; Anornu, G.K.; Kabo-Bah, A.T.; Larbi, I.; Sunkari, E.D.; Dile, Y.T.; Agyare, A.; Gyamfi, C. Groundwater recharge estimation and potential recharge mapping in the Afram Plains of Ghana using SWAT and remote sensing techniques. Groundw. Sustain. Dev. 2022, 17, 1000741. [Google Scholar] [CrossRef]
  15. Shi, Z.; Hu, X.; Wang, C.Y. Hydro-mechanical coupling in the shallow crust—Insight from groundwater level and satellite radar imagery in a mining area. J. Hydrol. 2021, 594, 125649. [Google Scholar] [CrossRef]
  16. Healy, R.W. Estimating Groundwater Recharge; Cambridge University Press: Cambridge, UK, 2010; 256p, ISBN 978-0521863964. [Google Scholar]
  17. Scanlon, B.R.; Healy, R.W.; Cook, P.G. Choosing appropriate techniques for quantifying groundwater recharge. Hydrogeol. J. 2002, 10, 18–39. [Google Scholar] [CrossRef]
  18. Robins, N.S. Recharge: The key to groundwater pollution and aquifer vulnerability. In Groundwater Pollution, Aquifer Recharge and Vulnerability; Robins, N.S., Ed.; Special Publications; Geological Society: London, UK, 1998; Volume 130, 234p, ISBN 978-1897799987. [Google Scholar]
  19. Simmers, I.; Hendrickx, J.M.H.; Kruseman, G.P.; Rushton, K.R. Recharge of Phreatic Aquifers in (Semi-) Arid Areas. In IAH International Contributions to Hydrogeology 19, 1st ed.; Simmers, I., Ed.; A.A.Balkema: Rotterdam, The Netherlands, 1997; ISBN 90-5410-694-8. [Google Scholar] [CrossRef]
  20. Smerdon, B.D. A synopsis of climate change effects on groundwater recharge. J. Hydrol. 2017, 555, 125–128. [Google Scholar] [CrossRef]
  21. Giuliano, G.; Mari, G.; Cavallin, A.; De Amicis, M. Ricerca sulla vulnerabilità naturale e sul rischio di inquinamento delle acque sotterranee nella pianura padana e veneto friulana: Carta della infiltrabilità regionale, carta idrogeologica regionale, Carta della vulnerabilità regionale (scala 1:500,000). Mem. Descr. Della Carta Geol. D’italia 1998, 56, 1–102. [Google Scholar]
  22. Martinelli, G.; Chahoud, A.; Dadomo, A.; Fava, A. Isotopic Features of Emilia-Romagna Region (North Italy) Groundwaters: Environmental and Climatological Implications. J. Hydrol. 2014, 519, 1928–1938. [Google Scholar] [CrossRef]
  23. Castiglioni, G.B.; Biancotti, A.; Bondesan, M.; Cortemiglia, G.C.; Elmi, C.; Favero, V.; Gasperi, G.; Marchetti, G.; Orombelli, G.; Pellegrini, G.B.; et al. Geomorphological map of the Po plain, Italy, at a scale of 1: 250 000. Earth Surf. Proc. Land. 1999, 24, 1115–1120. [Google Scholar] [CrossRef]
  24. Pavan, V.; Antolini, G.; Barbiero, R.; Berni, N.; Brunier, F.; Cacciamani, C.; Cagnati, A.; Cazzuli, O.; Cicogna, A.; De Luigi, C.; et al. High resolution climate precipitation analysis for north-central Italy, 1961–2015. Clim. Dyn. 2019, 52, 3435–3453. [Google Scholar] [CrossRef]
  25. AGIP Mineraria. Campi gassiferi Padani. [Gas fields in the Po Plain]. In I Giacimenti Gassiferi Dell’Europa Occidentale [The Gas Fields of Western Europe]; Accademia Nazionale dei Lincei ed ENI, Vol. 2, Atti del Convegno di Milano, 30 September, 5 October 1957; AGIP: Rome, Italy, 1959; pp. 45–497. [Google Scholar]
  26. Pieri, M.; Groppi, G. Subsurface Geological Structure of the Po Plain, Italy; Progetto finalizzato Geodinamica—Sottoprogetto 5—Modello Strutturale, C.N.R., Pubbl. 414; Verlag Nicht Ermittelbar: Roma, Italy, 1981. [Google Scholar]
  27. Livani, M.; Petracchini, L.; Benetatos, C.; Marzano, F.; Billi, A.; Carminati, E.; Doglioni, C.; Petricca, P.; Maffucci, R.; Codegone, G.; et al. Subsurface geological and geophysical data from the Po Plain and the northern Adriatic Sea (north Italy). Earth Syst. Sci. Data 2023, 15, 4261–4293. [Google Scholar] [CrossRef]
  28. Orombelli, G.; Ravazzi, C. The Late Glacial and Early Holocene: Chronology and paleoclimate. Alp. Mediterr. Quat. 1996, 9, 439–444. [Google Scholar]
  29. Florineth, D.; Schlüchter, C. Alpine evidence for atmospheric circulation patterns in Europe during the last glacial maximum. Quat. Res. 2000, 54, 295–308. [Google Scholar] [CrossRef]
  30. Ori, G.G. Continental Depositional Systems of the Quaternary of the Po Plain (Northern Italy). Sediment. Geol. 1993, 83, 1–14. [Google Scholar] [CrossRef]
  31. Rapti-Caputo, D.; Bratus, A.; Santarato, G. Strategic groundwater resources in the Tagliamento River basin (Northern Italy): Hydrogeological investigation integrated with geophysical exploration. Hydrogeol. J. 2009, 17, 1393–1409. [Google Scholar] [CrossRef]
  32. Rapti Caputo, D. Risorse Idriche Sotterranee a est di Ferrara: Indagini sul Comportamento Idrogeologico e Idrochimico. Proposte per una Gestione Ottimale. Doctoral Thesis, Università degli Studi di Ferrara, Ferrara, Italy, 2000; p. 215. [Google Scholar]
  33. Amorosi, A.; Farina, M.; Severi, P.; Preti, D.; Caporale, L.; Di Dio, G. Genetically related alluvial deposits across active fault zones: An example of alluvial fan-terrace correlation from the upper Quaternary of the southern Po Basin, Italy. Sediment. Geol. 1996, 102, 275–295. [Google Scholar] [CrossRef]
  34. Fontana, A.; Mozzi, P.; Marchetti, M. Alluvial Fans and Megafans along the Southern Side of the Alps. Sediment. Geol. 2014, 301, 150–171. [Google Scholar] [CrossRef]
  35. Marrocchino, E.; Rapti-Caputo, D.; Vaccaro, C. Chemical-mineralogical characterization as useful tool in the assessment of the decay of the Mesola Castle (Ferrara, Italy). Constr. Build. Mater. 2010, 24, 2672–2683. [Google Scholar] [CrossRef]
  36. Belli, M.; Centioli, D.; de Zorzi, P.; Sansone, U.; Capri, S.; Pagnotta, R.; Pettine, M. Metodi Analitici per le Acque; APAT-IRSA-CNR, Manuali e Linee Guida; I.G.E.R.: Roma, Italy, 2004; Volume 29, 110p, ISBN 88-448-0083-7. [Google Scholar]
  37. Orecchia, C.; Giambastiani, B.M.S.; Greggio, N.; Campo, B.; Dinelli, E. Geochemical Characterization of Groundwater in the Confined and Unconfined Aquifers of the Northern Italy. Appl. Sci. 2002, 12, 7944. [Google Scholar] [CrossRef]
  38. Hem, J. Study and Interpretation of the Chemical Characteristics of Natural Water; Geological Survey Water-Supply Paper 1473; United States Government Printing Office: Washington, DC, USA, 1979; 363p. [CrossRef]
  39. Viaroli, P.; Soana, E.; Pecora, S.; Laini, A.; Naldi, M.; Fano, E.A.; Nizzoli, D. Space and time variations of watershed N and P budgets and their relationships with reactive N and P loadings in a heavily impacted river basin (Po River, Northern Italy). Sci. Total Environ. 2018, 639, 1574–1587. [Google Scholar] [CrossRef]
  40. Italian National Institute for Environmental Protection Research—I.S.P.R.A. Progress Status of Action Programs for the Protection and Remediation of Water from Pollution Caused by Nitrates from Agricultural Sources. Mignuoli, M.C., Peleggi, M., Salvati, S., Galanti, V., Martinelli, A., Eds.; 2023. Available online: https://indicatoriambientali.isprambiente.it/it/acque-interne/stato-di-avanzamento-dei-programmi-dazione-la-tutela-e-il-risanamento-delle-acque-dallinquinamento (accessed on 1 October 2025). (In Italian).
  41. Cheng, Z.; Su, C.; Zheng, Z.; Chen, Z.; Wei, W. Characterize groundwater vulnerability to intensive groundwater exploitation using tritium time-series and hydrochemical data in Shijiazhuang, North China Plain. J. Hydrol. 2021, 603, 126953. [Google Scholar] [CrossRef]
  42. Appelo, C.A.J.; Postma, D. Geochemistry, Groundwater and Pollution; CRC Press: Boca Raton, FL, USA; Taylor and Francis Group: Amsterdam, The Netherlands, 2009; 649p, ISBN 9780429152320. [Google Scholar] [CrossRef]
  43. Kessler, T.J.; Harvey, C.F. The global flux of carbon dioxide into groundwater. Geophys. Res. Lett. 2001, 28, 279–282. [Google Scholar] [CrossRef]
  44. Freeze, R.A.; Cherry, J.A. Groundwater; Prentice-Hall Inc.: Englewood Cliffs, NJ, USA, 1979; 604p, ISBN 978-0133653120. [Google Scholar]
  45. Rupert, M.G. Decadal-scale changes of nitrate in ground water of the United States, 1988–2004. J. Environ. Qual. 2008, 37, S240–S248. [Google Scholar] [CrossRef] [PubMed]
  46. Wei, Y.; Chen, Y.; Cao, X.; Xiang, M.; Huang, Y.; Li, H. A Critical Review of Groundwater Table Fluctuation: Formation, Effects on Multifields, and Contaminant Behaviors in a Soil and Aquifer System. Environ. Sci. Technol. 2024, 58, 2185–2203. [Google Scholar] [CrossRef]
  47. Vicari, L.; Zavatti, A. Idrochimica. In Studi Sulla Vulnerabilità Degli Acquiferi, L’alta e Media Pianura Modenese; Paltrinieri, N., Pellegrini, M., Zavatti, A., Eds.; Pitagora Editrice: Bologna, Italy, 1990; pp. 27–72. ISBN 978-8837107109. [Google Scholar]
  48. Di Lorenzo, T.; Brilli, M.; Del Tosto, D.; Galassi, D.M.P.; Petitta, M. Nitrate source and fate at the catchment scale of the Vibrata River and aquifer (central Italy): An analysis by integrating component approaches and nitrogen isotopes. Environ. Earth Sci. 2012, 67, 2383–2398. [Google Scholar] [CrossRef]
  49. Severini, E.; Bartoli, M.; Pinardi, M.; Celico, F. Reactive silica traces manure spreading in alluvial aquifers affected by nitrate contamination: A case study in a high plain of northern Italy. Water 2020, 12, 2511. [Google Scholar] [CrossRef]
  50. Cocca, D.; Lasagna, M.; De Luca, D.A. Groundwater Chemical Trends Analyses in the Piedmont Po Plain (NW Italy): Comparison with Groundwater Level Variations (2000–2020). Water 2024, 16, 1240. [Google Scholar] [CrossRef]
  51. Baraza, T.; Cassidy, K.J.; Hasenmueller, E.A. Road salt applications mobilize trace elements from roadside soil to shallow groundwater. Sci. Total Environ. 2024, 942, 173435. [Google Scholar] [CrossRef]
  52. Broers, H.P. The spatial distribution of groundwater age for different geohydrological situations in the Netherlands: Implications for groundwater quality monitoring at the regional scale. J. Hydrol. 2004, 299, 84–106. [Google Scholar] [CrossRef]
  53. Pisinaras, V.; Polychronis, C.; Gemitzi, A. Intrinsic groundwater vulnerability determination at the aquifer scale: A methodology coupling travel time estimation and rating methods. Environ. Earth Sci. 2016, 75, 85. [Google Scholar] [CrossRef]
  54. Santoni, S.; Huneau, F.; Garel, E.; Vergnaud-Ayraud, V.; Labasque, T.; Aquilina, L.; Jaunat, J.; Celle-Jeanton, H. Residence time, mineralization processes and groundwater origin within a carbonate coastal aquifer with a thick unsaturated zone. J. Hydrol. 2016, 540, 50–63. [Google Scholar] [CrossRef]
  55. Gurdak, J.J.; Qi, S.L. Vulnerability of recently recharged groundwater in principal [corrected] aquifers of the United States to nitrate contamination. Environ. Sci. Technol. 2012, 46, 6004–6012. [Google Scholar] [CrossRef] [PubMed]
  56. Rapti, D.; Martinelli, G.; Zheng, G.; Vincenzi, C. Bottled Mineral Waters as Unconventional Sampling in Hydro-Geological Research. Water 2023, 15, 3466. [Google Scholar] [CrossRef]
  57. Gerhart, J.M. Ground-Water Recharge and Its Effects on Nitrate Concentration Beneath a Manured Field Site in Pennsylvania. Groundwater 1986, 24, 483–489. [Google Scholar] [CrossRef]
  58. Hess, L.J.T.; Hinckley, E.-L.; Robertson, G.P.; Matson, P.A. Rainfall intensification increases nitrate leaching from tilled but not no-till cropping systems in the U.S. Midwest. Agric. Ecosyst. Environ. 2020, 290, 106747. [Google Scholar] [CrossRef]
  59. Zheng, W.; Wang, S. Extreme precipitation accelerates the contribution of nitrate sources from anthropogenetic activities to groundwater in a typical headwater area of the North China Plain. J. Hydrol. 2021, 603, 127110. [Google Scholar] [CrossRef]
  60. Brkić, Z.; Larva, O.; Kuhta, M. Groundwater age as an indicator of nitrate concentration evolution in aquifers affected by agricultural activities. J. Hydrol. 2021, 602, 126799. [Google Scholar] [CrossRef]
  61. Ravikumar, P.; Somashekar, R.K. Environmental Tritium (3H) and hydrochemical investigations to evaluate groundwater in Varahi and Markandeya River basins, Karnataka, India. J. Environ. Radioact. 2011, 102, 153–162. [Google Scholar] [CrossRef] [PubMed]
  62. Alikhani, J.; Deinhart, A.L.; Visser, A.; Bibby, R.K.; Purtschert, R.; Moran, J.E.; Massoudieh, A.; Esser, B.K. Nitrate vulnerability projections from Bayesian inference of multiple groundwater age tracers. J. Hydrol. 2016, 543, 167–181. [Google Scholar] [CrossRef]
  63. Martinez-Salvador, C.; Moreno-Gomez, M.; Liedl, R. Estimating pollutant residence time and NO3 concentrations in the Yucatan karst aquifer; considerations for an integrated karst aquifer vulnerability methodology. Water 2019, 11, 1431. [Google Scholar] [CrossRef]
  64. McNeill, G.W.; Anderson, J.; Elliot, T. Nitrate levels and the age of groundwater from the upper Devonian sandstone aquifer in Fife, Scotland. Environ. Geochem. Health 2003, 25, 105–113. [Google Scholar] [CrossRef]
  65. Castaldo, G.; Visser, A.; Fogg, G.F.; Harter, T. Effect of Groundwater Age and Recharge Source on Nitrate Concentrations in Domestic Wells in the San Joaquin Valley. Environ. Sci. Technol. 2021, 55, 2265–2275. [Google Scholar] [CrossRef]
  66. Galloway, J.N.; Townsend, A.R.; Erisman, J.W.; Bekunda, M.; ZCai, Z.; Freney, J.R.; Martinelli, L.; Seitzinger, S.P.; Sutton, M. Transformation of the nitrogen cycle: Recent trends, questions, and potential solutions. Science 2008, 320, 889–892. [Google Scholar] [CrossRef]
  67. Zuppi, G.M.; Sacchi, E. Hydrogeology as a climate recorder: Sahara-Sahel (North Africa) and the Po Plain (Northern Italy). Glob. Planet. Change 2004, 40, 79–91. [Google Scholar] [CrossRef]
  68. Pilla, G.; Sacchi, E.; Zuppi, G.; Braga, G.; Ciancetti, G. Hydrochemistry and Isotope Geochemistry as Tools for Groundwater Hydrodynamic Investigation in Multilayer Aquifers: A Case Study from Lomellina, Po Plain, South-Western Lombardy, Italy. Hydrogeol. J. 2006, 14, 795–808. [Google Scholar] [CrossRef]
  69. Martinelli, G.; Dadomo, A.; De Luca, D.A.; Mazzola, M.; Lasagna, M.; Pennisi, M.; Pilla, G.; Sacchi, E.; Saccon, P. Nitrate Sources, Accumulation and Reduction in Groundwater from Northern Italy: Insights Provided by a Nitrate and Boron Isotopic Database. Appl. Geochem. 2018, 91, 23–35. [Google Scholar] [CrossRef]
  70. Martinelli, G.; Cervi, F.; Dadomo, A.; Medioli, G. A preliminary assessment of young water fractions in groundwater from alluvial aquifers facing the northern Italian Apennines. Water 2022, 14, 659. [Google Scholar] [CrossRef]
  71. ARPAe Database. 2014. Available online: https://dati.arpae.it/dataset/rete-regionale-per-la-qualita-ambientale-acque-sotterranee-dati-2014 (accessed on 28 October 2024).
  72. World Commission on Environment and Development. Our Common Future; Oxford University Press: Oxford, MI, USA, 1987; 247p. [Google Scholar]
Figure 1. Study area, major hydrographic network (dark blue curves); piezometric lines (thin blue curves with relative elevation) from Giuliano et al. [21], modified; mean direction of groundwater flow (light blue arrows); A, B: hydrogeological section; the boundaries of the Italian administrative regions are also shown.
Environments 12 00404 g001
Figure 2. Simplified hydrogeological sections. Hydrogeological section A, from Rapti et al. [31]. For the position of monitoring well B, see Figure 1. Legend: (1) borehole; (2) sand; (3) gravel; (4) conglomerate; (5) clay; (6) aquifer system; A: undifferentiated aquifer (High Plain); A0: unconfined aquifer; A1, A2: confined aquifer; ‘?’ absence of lithostratigraphical data (for the position see Figure 1; red line).
Environments 12 00404 g002
Figure 3. Red-colored polygons correspond to the Nitrate Vulnerable Zones (from Italian institute for environmental protection and research-ISPRA [40]) modified.
Environments 12 00404 g003
Figure 4. Map showing the spatial distribution of the groundwater monitoring network (empty circles; ARPAs database). Wells with HCO3/NO3 < 10 are highlighted in red circles. Observation wells are indicated by A, B, … G (highlighted in blue). For the position of well B, see Figure 2. Administrative boundaries are included: regional boundaries are represented by black lines, while provincial boundaries are shown as gray lines.
Environments 12 00404 g004
Figure 5. Scattering distribution of nitrate concentration (mg/L) versus ratio HCO3/NO3. [a], all analytical data (from Martinelli et al. [22]) and [a1], only data with a ratio HCO3/NO3 < 10 corresponding in the alluvial fans area.
Environments 12 00404 g005
Figure 6. Monitoring well A and B—top: variations in nitrate and bicarbonate concentrations versus time; bottom: scatter plot of nitrates versus bicarbonates. Ionic concentrations in mg/L (for the well location, see Figure 4).
Environments 12 00404 g006
Figure 7. Monitoring well C and D—top: variations in nitrate and bicarbonate concentrations versus time; bottom: scatter plot of nitrates versus bicarbonates. Ionic concentrations in mg/L (for the well location, see Figure 4).
Environments 12 00404 g007
Figure 8. Monitoring well E—(a) variations in nitrate and bicarbonate concentrations versus time; (b) scatter plot of nitrates versus bicarbonates; (c) water depth (m) and bicarbonate versus time. Ionic concentrations in mg/L (for the well location, see Figure 4).
Environments 12 00404 g008
Figure 9. Monitoring well F and G—variations in nitrate and bicarbonate concentrations versus time. Ionic concentrations in mg/L (for the well location, see Figure 4).
Environments 12 00404 g009
Figure 10. Nitrate concentration (in mg/L) versus Tritium (T.U.; black circles) and versus redox potential (mV; empty circles), in the alluvial fan aquifer system of Emilia Romagna Region (data from Martinelli et al. [69], and ARPAe database [71]).
Environments 12 00404 g010
Table 1. Equation describing the relationship between HCO3/NO3 and NO3; coefficient of determination (R2); and the range of HCO3/NO3 and NO3 values for which the equation is applicable (analytical data is derived from Martinelli et al. [22]).
EquationR2 (n = 43)HCO3/NO3NO3 (mg/L)
NO3 = −10.0 (HCO3/NO3) + 138.80.70<10>30
Table 2. Statistical description at the observation points (wells; n = number of data). Minimum, maximum, and mean values are given in mg/L; the coefficient of variation (CV) expressed as a percentage. For the position, see Figure 4.
WellParameterMinimumMaximumMeanCV (%)
A (n = 19)HCO3 (mg/L)27137534510
NO3 (mg/L)31695227
HCO3/NO35.49.67.023
B (n = 15)HCO3 (mg/L)33937036112
NO3 (mg/L)3057.347.118
HCO3/NO36.4107.920
C (n = 16)HCO3 (mg/L)302371337.96
NO3 (mg/L)31.470.348.924
HCO3/NO35.29.87.220
D (n = 14)HCO3 (mg/L)112439276.636
NO3 (mg/L)14.362.634.548
HCO3/NO35.810.08.523
E (n = 19)HCO3 (mg/L)376525473.88
NO3 (mg/L)38.97550.716
HCO3/NO36.612.89.515
F (n = 12)HCO3 (mg/L)129214177.515
NO3 (mg/L)35.440.739.04
HCO3/NO33.65.44.5512
G (n = 10)HCO3 (mg/L)232279260.45
NO3 (mg/L)31.235.734.24
HCO3/NO36.68.27.66
Disclaimer/Publisher’s Note: The statements, opinions and data contained in all publications are solely those of the individual author(s) and contributor(s) and not of MDPI and/or the editor(s). MDPI and/or the editor(s) disclaim responsibility for any injury to people or property resulting from any ideas, methods, instructions or products referred to in the content.