Article

Evaluation of Scenarios for the Application of the Future PM2.5 and PM10 Standards: A Case Study of Three Urban Areas in Romania and Implications for Public Policies

by
Liliana Drăgoi (Oniu)
1,
Marius-Mihai Cazacu
2,* and
Iuliana-Gabriela Breabăn
1,*
1
Faculty of Geography and Geology, Doctoral School of Geosciences, “Alexandru Ioan Cuza” University of Iasi, Carol I Boulevard, No. 11, 700506 Iasi, Romania
2
Department of Physics, “Gheorghe Asachi” Technical University of Iasi, 700050 Iasi, Romania
*
Authors to whom correspondence should be addressed.
Environments 2025, 12(10), 373; https://doi.org/10.3390/environments12100373 (registering DOI)
Submission received: 20 August 2025 / Revised: 9 October 2025 / Accepted: 10 October 2025 / Published: 11 October 2025
(This article belongs to the Special Issue Environmental Pollution Risk Assessment)

Abstract

Strengthening air quality protection across the EU, Directive (EU) 2024/2881 sets stricter daily standards and alert thresholds for particulate matter, which become applicable in 2030. Member States must transpose these standards by 2027. This study retrospectively applies the new framework to daily data from three urban areas in Romania from 2019 to 2024. The objective is to evaluate the risks of noncompliance and test additional, more sensitive indicators of pollution severity and source characteristics. The results show that the new standards would cause the daily and annual limits for PM2.5 and PM10 to be exceeded in at least two of the three analyzed cities. Three indicators are proposed and applied: (i) Excess Concentration (EC), which quantifies the total amount of daily exceedances of the limit value; (ii) Toxic Load Index (TLI), which integrates the PM2.5/PM10 ratio as a proxy for toxicological potential; and (iii) Episode Index (EI), which captures the magnitude and duration of episodes that would trigger alert thresholds. The study includes a summary review of the air quality legislative framework and contributes to public policy literature by emphasizing risk-proportionate interventions. The proposed indicators support a smoother transition to forthcoming European requirements.

1. Introduction

Air pollution is considered the greatest environmental health risk in Europe [1], contributing substantially to the burden of cardiovascular, respiratory, and other chronic diseases. It is estimated to cause hundreds of thousands of premature deaths and lost years of healthy life in Europe each year [2,3].
Particulate matter (PM) is among the most harmful atmospheric pollutants [1,4].
The EEA’s annual estimates for Romania for 2022 attribute 17,900 deaths each year (or 185,100 years of life lost) to fine particulate matter PM2.5 [5].
The toxic effects of particle pollution on humans depend on the particles’ size and chemical composition [6,7].
The two regulated sizes of particulates are PM10 (particles with a diameter of 10 μm or less) and PM2.5 (particles with a diameter of 2.5 μm or less) [8,9]. Of these particles, fine particles (PM2.5) are considered the most dangerous to human health. They penetrate deep into the lungs and can reach the alveolar region [1]. There is a strong causal relationship between PM2.5 exposure and increased risk of all-cause mortality, acute respiratory infections, chronic obstructive pulmonary disease, ischemic heart disease [10,11], cancer [12], and ischemic stroke [2,13].
The coarse fraction of particles, PM10–2.5(coarse fraction, particles with an aerodynamic diameter between 2.5 and 10 μm) is mainly deposited in the upper respiratory tract (thoracic region) [14]. Exposure to this type of PM has been associated with adverse respiratory effects, including chronic obstructive pulmonary disease, asthma, and respiratory hospitalizations. Sometimes, the short-term effects are stronger than those associated with fine particles [15]. These health findings underscore the necessity of increasingly stringent air quality standards.
Over the past three decades, the European Union has regularly updated its air quality directives to reflect the latest scientific findings on the relationship between pollution and human health.
Directive 96/62/EC on ambient air quality assessment and management, known as the “Framework Directive,” laid the foundations for the assessment and management of ambient air quality and was supplemented by daughter directives for specific pollutants: Directive 1999/30/EC (for sulphur dioxide, nitrogen dioxide and oxides of nitrogen, particulate matter and lead), Directive 2000/69/EC (for benzene and carbon monoxide) and Directive 2002/3/EC (for ozone).
These directives were subsequently consolidated and simplified by Directive 2008/50/EC on ambient air quality and cleaner air for Europe, which became the main legislative act in this field. The World Health Organization’s (WHO) guidelines were used as a reference point for setting air quality standards. Directive 2008/50/EC was transposed into Romanian law by Law No. 104/2011 on ambient air quality.
In 2021, the WHO published new Global Air Quality Guidelines based on scientific evidence showing that air pollution has adverse effects even at exposure levels lower than previously considered safe. The document establishes significantly more restrictive guideline values for key air pollutants, including PM10 and PM2.5. These values correspond to concentrations at which the risk to health is minimal, according to the most recent scientific data [2].
In accordance with the 2021 WHO guidelines, the European Union adopted Directive (EU) 2024/2881 on ambient air quality and cleaner air for Europe. Romania must transpose the directive into national legislation by December 11 2026 at the latest, thereby updating the current framework established through Law No. 104/2011, which incorporated Directive 2008/50/EC.
This directive reforms previous legislation, Directive 2008/50/EC, by introducing ambitious targets aimed at reducing the impact of pollution on health by 2030 and achieving “zero pollution” by 2050.
Directive (EU) 2024/2881 significantly reduces the limit values for PM10 and PM2.5, bringing them closer to WHO recommendations (Table 1). For example, the annual limit value for PM2.5 decreases from 25 μg/m3 to 10 μg/m3. For PM10, the daily limit value is reduced from 50 μg/m3 to 45 μg/m3, with a significant reduction in the number of permitted exceedances per year from 35 to just 18 exceedances per year. A new feature is the introduction of a daily limit value for PM2.5 [8,9].
The new directive establishes alert and information plans to manage intense pollution episodes. It sets two thresholds. Alert thresholds signal a risk to the entire population after short-term exposure and require immediate measures. Information thresholds indicate increased risk to vulnerable and sensitive groups, and require rapid, appropriate dissemination of relevant information. Alert thresholds for PM10 and PM2.5 are assessed based on daily averages over a period of up to three consecutive days (or less), while information thresholds are determined based on the daily average for a single day. According to Directive (EU) 2024/2881, exceeding the alert threshold results in the activation of the short-term action plan for the protection of public health [8].
However, despite this legislative progress, the compliance indicators defined in EU directives, including annual limit values, daily limit values and the maximum number of daily exceedances, alert and information thresholds (Table 1 and Table 2), provide only a partial perspective. Although they are effective for determining compliance, they do not capture the magnitude of exceedances, the duration of pollution episodes, or the toxicological relevance of fine versus coarse particles. This study bridges the gap between legal compliance indicators and exposure characteristics that are most relevant to health: magnitude, duration, and toxicological potential.
To address this need, the study proposes three complementary indicators: (1) Excess Concentration (EC), which sums the excess concentration relative to the daily limit value over a calendar year, (2) Episode Index (EI), which integrates the magnitude of pollution episodes throughout each episode, and (3) Toxic Load Index (TLI), which considers both the PM2.5/PM10 ratio necessary to identify potential dominant sources of pollution and the excess relative to the PM2.5 limit value.
The EC captures the magnitude of exceedances, which is consistent with the epidemiological evidence that long-term health risks are driven by the cumulative dose of pollutants [16,17].
The EI indicator is justified by epidemiological studies showing that the adverse effects of PM10 and PM2.5 depend not only on daily concentration but also on the number of consecutive days with high exposure [2,16].
The TLI integrates both exceedances of limit values and the PM2.5/PM10 ratio, reflecting the fact that the toxicity of particles depends not only on mass, but also on source and composition [18,19].
Together, these indicators offer a more nuanced, health-oriented assessment of air quality than conventional indicators alone. They are being applied for the first time in a Romanian urban context under forthcoming EU standards.
This paper expands on two previous studies [20,21] which analysed trends in PM10 and PM2.5 concentrations in Suceava, Botoșani, and Iași, as well as spatial differences in these three northeastern Romanian urban areas. One of these studies examined the PM2.5/ PM10 ratio as an indicator of particle origin and composition.
This study makes new contributions by integrating data from 2024 and including a rural background station as a baseline pollution level reference. Three complementary indicators are also used.
Based on this framework, the research objectives are as follows: (i) comparing PM10 and PM2.5 concentrations with current and future limit values (Directives 2008/50/EC and (EU) 2024/2881), considering the mandatory application of these values starting in 2030; (ii) testing complementary indicators (EC, EI, and TLI) to highlight aspects ignored by traditional indicators; and (iii) formulating recommendations for reducing concentrations below the new limit values and for managing exceedances of alert thresholds.

2. Materials and Methods

2.1. Study Area

The study was conducted in three urban areas in northeastern Romania: Suceava, Iași, and Botoșani. These areas were previously studied by Drăgoi et al. [20,21].

2.2. Air Quality Data

This study uses data on daily concentrations of PM10 and PM2.5. These concentrations were determined using the gravimetric reference method at air quality monitoring stations within the National Air Quality Monitoring Network from 2019 to 2024. The data are publicly available on the national website https://www.calitateaer.ro (accessed on 4 June 2025).
The data were validated by local environmental protection agencies and certified by the National Environmental Protection Agency. Therefore, no additional filtering was necessary.
The website validates annual averages only for years that meet the quality and aggregation requirements set out in Annex 4 of Law 104/2011 and Annex I of Directive 2008/50/CE, including the minimum annual data capture of 90% for daily gravimetric measurements of PM10 and PM2.5 (excluding maintenance periods).
Consequently, only those years for which the annual mean was available on the mentioned website were included in the study, thus ensuring compliance with the minimum data capture requirement.
However, the dataset has certain limitations. Data are not consistently available for all years and monitoring zones, which may affect the completeness of the temporal and spatial analyses.
Table 3 shows the locations of the stations in the study.
The city of Suceava is implementing an Air Quality Plan for the PM10 parameter, with the period of application of the measures being 2023–2027 [22]. An integrated plan for NO2/NOx and PM10/PM2.5 is currently being developed in Iași, with measures to be implemented between 2024 and 2028 [23].

2.3. Definition and Calculation of the Proposed Indicators

All of the proposed indicators relate to the future limit values established in Directive (EU) 2024/2881.

2.3.1. Definition and Calculation of the Excess Concentration (EC)

The EC is an additional indicator that complements the annual number of daily exceedances. It provides more information about the magnitude of daily limit value exceedances. The EC indicator for a calendar year is calculated by summing the daily differences between particulate matter concentrations and the daily limit value. This calculation only takes into account days on which the daily limit was exceeded.
The formula for EC is given by
E C = i = 1 n C i L V
where
  • C i =   daily concentration of PM (µg/m3)
  • L V =   daily limit value (45 µg/m3 for PM10 and 25 µg/m3 for PM2.5)
  • n =   the duration in days when C i > L V
The annual EC is calculated by adding together all the daily EC values obtained from a given station over the course of a calendar year.
The classification thresholds for the EC indicator were set up in order to evaluate the population’s exposure to particulate matter (Table 4).
These thresholds were set based on the daily limit values of 45 µg/m3 for PM10 and 25 µg/m3 for PM2.5, the maximum of 18 daily exceedances per year, as specified in Directive (EU) 2024/2881, and the daily exceedance values recorded at all air quality monitoring stations during the study period.
Based on data from all stations included in the study, the mean daily exceedance above the limit value in the future directive would be 13.1 µg/m3 for PM10. Assuming 18 permitted annual exceedances, the average annual EC would be 236 µg/m3. Rounding this value down, the lower threshold of 250 µg/m3 is chosen for PM10, which corresponds to low but frequent exposure in areas that comply with the directive.
For PM2.5, the daily excess average calculated over the entire study period was not used because the data set is more limited. Only three stations monitor PM2.5, and the available data do not fully cover all the analysed years. Information on the criteria for selecting the data used is presented in Section 2.2. Air Quality Data. Therefore, the lower threshold for EC for PM2.5 was determined by adjusting the reference EC value for PM10 using the ratio of the corresponding daily limit values (25 µg/m3 for PM2.5 and 45 µg/m3 for PM10). This results in an adjustment factor of 0.56, corresponding to a reference EC of approximately 140 µg/m3.
However, the data analysis shows that the EC of 142 µg/m3 was reached at the SV-1 station in 2022 with only 15 values above 25 µg/m3. This suggests that a threshold of 140 µg/m3 may underestimate exposure in real-life scenarios, even when the number of exceedances is below the legal limit. The threshold for the low PM2.5 exposure category is 150 µg/m3, a value that considers the ratio to the thresholds set for PM10 and the actual situations observed in the available data.
The annual analysis of EC values for monitored stations (Section 3.3.1), shows that the upper threshold of 750 µg/m3 for PM10 in the Moderate EC category indicates situations in which exposure is moderate, though frequent, and not persistently severe. The PM2.5 equivalent was set at 500 µg/m3, considering the PM2.5/PM10 ratio, which aligns with the average values observed in the study areas [21].
EC values become chronic and fall into the High or Very High EC category above values of 750 µg/m3 for PM10 and 500 µg/m3 for PM2.5.
Annual EC values above 1000 µg/m3 for PM10 and above 800 µg/m3 for PM2.5 coincide with years in which extremely high daily concentrations are not just occasional. Further details can be found in Section 3. Results.
These thresholds were proposed as guidelines for assessing pollution levels at different stations and in different years. They were not regulated by any normative act.

2.3.2. Definition and Calculation of the Episode Index (EI)

The pollution episode index (EI) was used to characterize PM10 and/or PM2.5 pollution episodes. The EI integrates the magnitude of the excess above the alert threshold over the entire duration of the episode, thus providing a better estimate of the potential health risk.
They are calculated as the sum of the daily differences between the recorded daily concentrations and the alert threshold set by the directive, for each day on which the threshold is exceeded. An episode of pollution is defined as a succession of at least three consecutive days (or two days with very high values) during which the alert threshold is exceeded.
The formula for EI is given by
E I = i = 1 n C i P a l e r t  
where
  • C i =   concentration on day i (µg/m3)
  • P a l e r t =   alert threshold (Directive (EU) 2024/2881: ≥50 µg/m3 for PM2.5 and ≥90 µg/m3 for PM10).
  • n =   number of consecutive days during the pollution episode where C i > P a l e r t .
The classification of PM10 and PM2.5 pollution magnitude starts at a high level because the identification of these episodes begins with the alert thresholds of 90 µg/m3 and 45 µg/m3, respectively, as specified in Directive (EU) 2024/2881. Exceeding these thresholds requires the implementation of urgent measures, which will be included in short-term action plans aimed at reducing the immediate risk or duration of exceeding the alert thresholds. Since these values are double the daily limit values (45 µg/m3 and 25 µg/m3, respectively), any episode reaching or exceeding the alert threshold is considered a high-risk health event.
The thresholds for separating classes were established by considering the concentrations recorded during the study period and the references used in international practice. These references include the daily classifications applied in the United Kingdom, in accordance with air quality assessment guidelines [13].
For PM10, data from the study period showed that the EI values tended to be concentrated around 25 µg/m3 and 100 µg/m3 (Section 3.3.2). These values were used to classify the data in Table 5, which reflects both the magnitude of the exceedance and the duration of exposure.
The limit values and alert thresholds for PM2.5 differ from those for PM10. However, similar classification intervals were used (Table 5). This is because the EI is calculated relative to the alert threshold specific to each pollutant. This approach allows for comparison of the magnitude of episodes between the two particle fractions based on total exposure above the threshold, regardless of the concentration value.
The threshold ranges used to classify the magnitude of pollution episodes were based on data from the literature on the health effects of exposure to PM [16,24].
A sensitivity analysis was conducted to evaluate the robustness of the proposed EC and EI thresholds. The thresholds were adjusted by 10% and 20%, applied globally to all thresholds simultaneously and selectively to only the lower threshold. Details are provided in the Results section and the Supplementary Materials.

2.3.3. Definition and Calculation of the Toxic Load Index (TLI)

The TLI aims to supplement traditional quantitative indicators, such as the daily average, the maximum number of daily exceedances, and the annual average, as well as the other two indicators proposed in this study, EC and EI, by integrating qualitative characteristics related to the toxic potential of particulate matter. TLI takes into account the excess of PM2.5 concentration above the daily limit value as well as the proportion of PM2.5 in total PM10, expressed as the PM2.5/PM10 ratio.
The daily calculation of the TLI indicator enables the quick and precise evaluation of the health risks posed by fine particle pollution on a given day. It captures the fluctuating variations in PM2.5 and PM10 levels, which differ significantly from day to day depending on weather conditions and emission sources. Thus, this indicator identifies acute pollution episodes.
The TLI can be integrated into air quality warning systems to provide summary information on pollution episode risk. This supports rapid decision-making by authorities.
The formula for TLI is given by:
T L I i = P M 2.5 , i P M 10 , i × ( C i 25 )
where
  • T L I i = TLI daily
  • C i = the PM2.5 concentration on day i, when the LV is exceeded (µg/m3)
  • P M 2.5 ,   i P M 10 , i = the ratio of concentrations on day i
  • 25 (µg/m3) = daily limit value for PM2.5
On days when the PM2.5 concentration does not exceed the daily limit value, the TLI value will be zero, indicating an absence of significant toxicity.
Conversely, as the PM2.5/PM10 ratio increases, so does the TLI, reflecting a higher proportion of PM2.5 in the total mass of PM, which is associated with increased toxicological potential [21].
Although there is no indicator in the literature that is identical to the TLI, the TLI is based on the principles employed by other authors in environmental risk assessments. These principles include quantifying excess over limit values associated with acute adverse health effects [17], using the PM2.5/PM10 ratio to indicate the source and nature of the particles [21,25], and integrating these principles into a single indicator. Combining quantity and relative toxicity is a common approach in environmental risk assessment. For instance, cumulative risk assessment uses products of exposure and toxicity coefficients [24].
The classification thresholds for daily TLI values were established based on methodological and toxicological considerations (Table 6). For the excess component, the daily limit value of 25 µg/m3 for PM2.5 was used. Thus, the zero reference value for TLI directly corresponds to an absence of exceedances and an insignificant toxic load. Subsequent thresholds were set according to the severity levels of PM2.5 excess, weighted by the PM2.5/PM10 ratio. This rationale is consistent with the findings of Park et al. (2018), who demonstrated that the toxicity of PM2.5 depends on its source and proposed a differentiated toxicity score [18].
The PM2.5/PM10 ratio varies from approximately 0.3 (in episodes with coarse dust) to 0.9–1.0 (in cases of combustion-source pollution with increased toxic potential) [25].
Thus, with an excess of 10 µg/m3 and a high PM2.5 proportion (e.g., 0.8), the TLI reaches 8, corresponding to a moderate–high risk zone. Threshold values of 5, 12, and 20 were selected as progressive benchmarks to distinguish between different exposure types (e.g., occasional or hazardous). These thresholds, derived mathematically, provide a structured scale for categorizing exposure severity and can be refined further in future studies as more toxicological and epidemiological evidence becomes available.

3. Results

3.1. Measured Annual Mean Concentrations Compared with Current and Future LIMIT Value

3.1.1. Annual Mean Concentrations of PM10

Between 2019 and 2024, annual mean PM10 concentrations were below the limit value in force. Applying the new limit from Directive (EU) 2024/2881, compliance was observed only at SV-1 and IS-4 in 2022–2023. For SV-2 (2022–2024) and IS-4 (2024), compliance could not be assessed due to insufficient data (Table 7).

3.1.2. Annual Mean Concentrations of PM2.5

For the years in the analysed period for which the data quality objective was met, it can be concluded that the annual mean concentrations of PM2.5 were below the annual limit value in force. However, if the annual limit value set in Directive (EU) 2024/2881 had been applied, the concentrations recorded at the stations in Suceava and Iași would have exceeded the future limit value (Table 8).

3.2. Daily Exceedances Relative to Current and Future Daily Limit Values for PM10 and PM2.5

3.2.1. Analysis of Daily Exceedances for PM10

During the analysed period, the maximum number of 35 daily exceedances permitted by Law 104/2011 (which transposes Directive 2008/50/EC) was not exceeded at any station except in 2019 at IS-2, where 36 values were above 50 μg/m3. This threshold was also reached in 2019 at SV-2 and in 2020 at IS-2 (Figure 1).
For IS-4 in 2024 and for SV-2 in 2022, the 90.4th percentile is used to verify compliance regarding the number of exceedances of the daily limit value since the annual PM10 data capture did not meet the target for fixed measurements. This value must be less than or equal to the limit value of 50 μg/m3. In 2024, the 90.4th percentile at IS-4 was 30.93 μg/m3, and at SV-2 in 2022 was 39.82 μg/m3 (In 2023 and 2024, the data coverage at SV-2 was 0% and 8%, respectively).
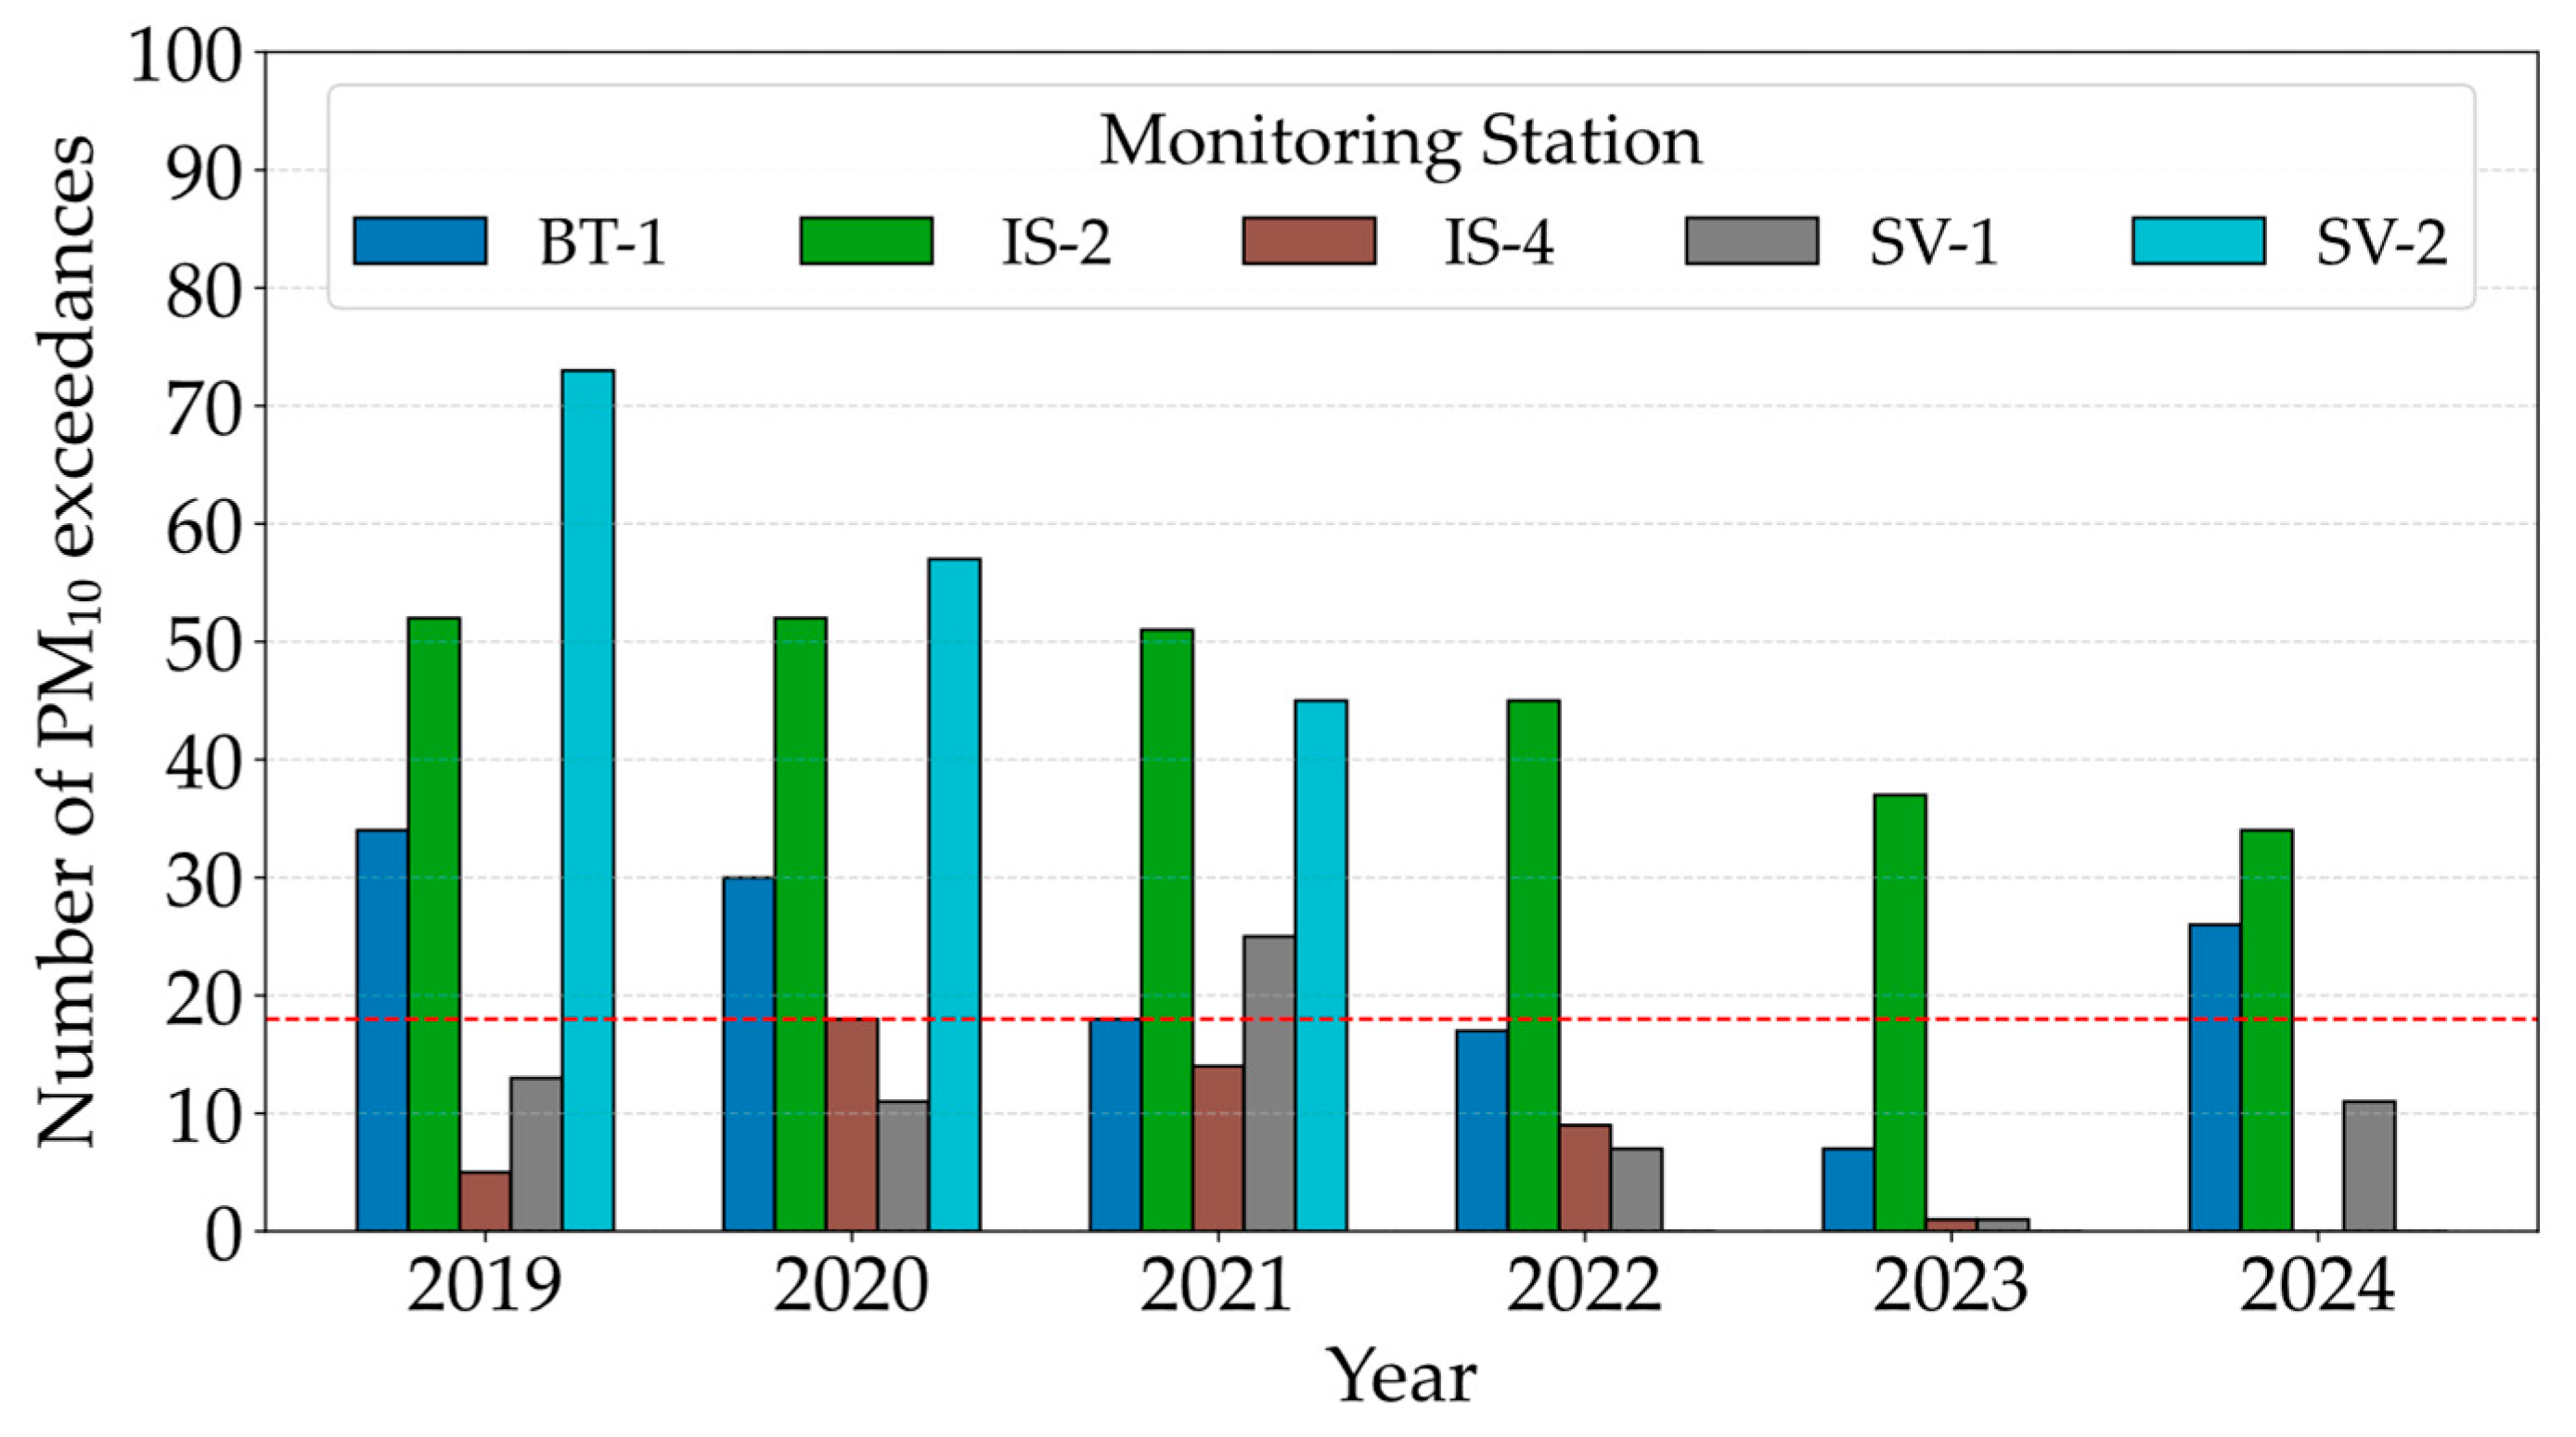
Applying the future daily limit value of 45 µg/m3 (not to be exceeded more than 18 times a calendar year), as set out in Directive (EU) 2024/2881, results in a substantial increase in hypothetical exceedances at all analysed stations. This suggests that, under the stricter standard, the assessment framework for population exposure to PM10 pollution would flag exceedances more frequently, reflecting higher sensitivity in evaluating air quality impacts.
Stations IS-2 and SV-2 would be the most affected by the application of the new directive. For example, in 2019, SV-2 registered 35 exceedances, but would record 73 hypothetical exceedances when applying the future daily limit value of 45 µg/m3 (not to be exceeded more than 18 times a calendar year). Similarly, IS-2 recorded 36 exceedances in 2019, but would reach 52 hypothetical exceedances under the new directive, almost three times the future permitted maximum.
Stations IS-4 and SV-1, which typically record lower PM10 levels, are less affected by the future daily limit value. Regardless of the legislative requirements applied, a decrease in the number of exceedances at all stations between 2019 and 2023. In 2024, however, a partial increase was noted at several locations (e.g., BT-1, IS-2 and SV-1), although the number of exceedances remained below the maximum values recorded in 2019. This trend may suggest a general improvement in air quality, potentially due to measures implemented to reduce PM10 pollution [22,23], but it is also influenced by meteorological conditions (Figure 2).

3.2.2. Analysis of Daily Exceedances for PM2.5

Current legislation does not specify a daily limit for PM2.5.
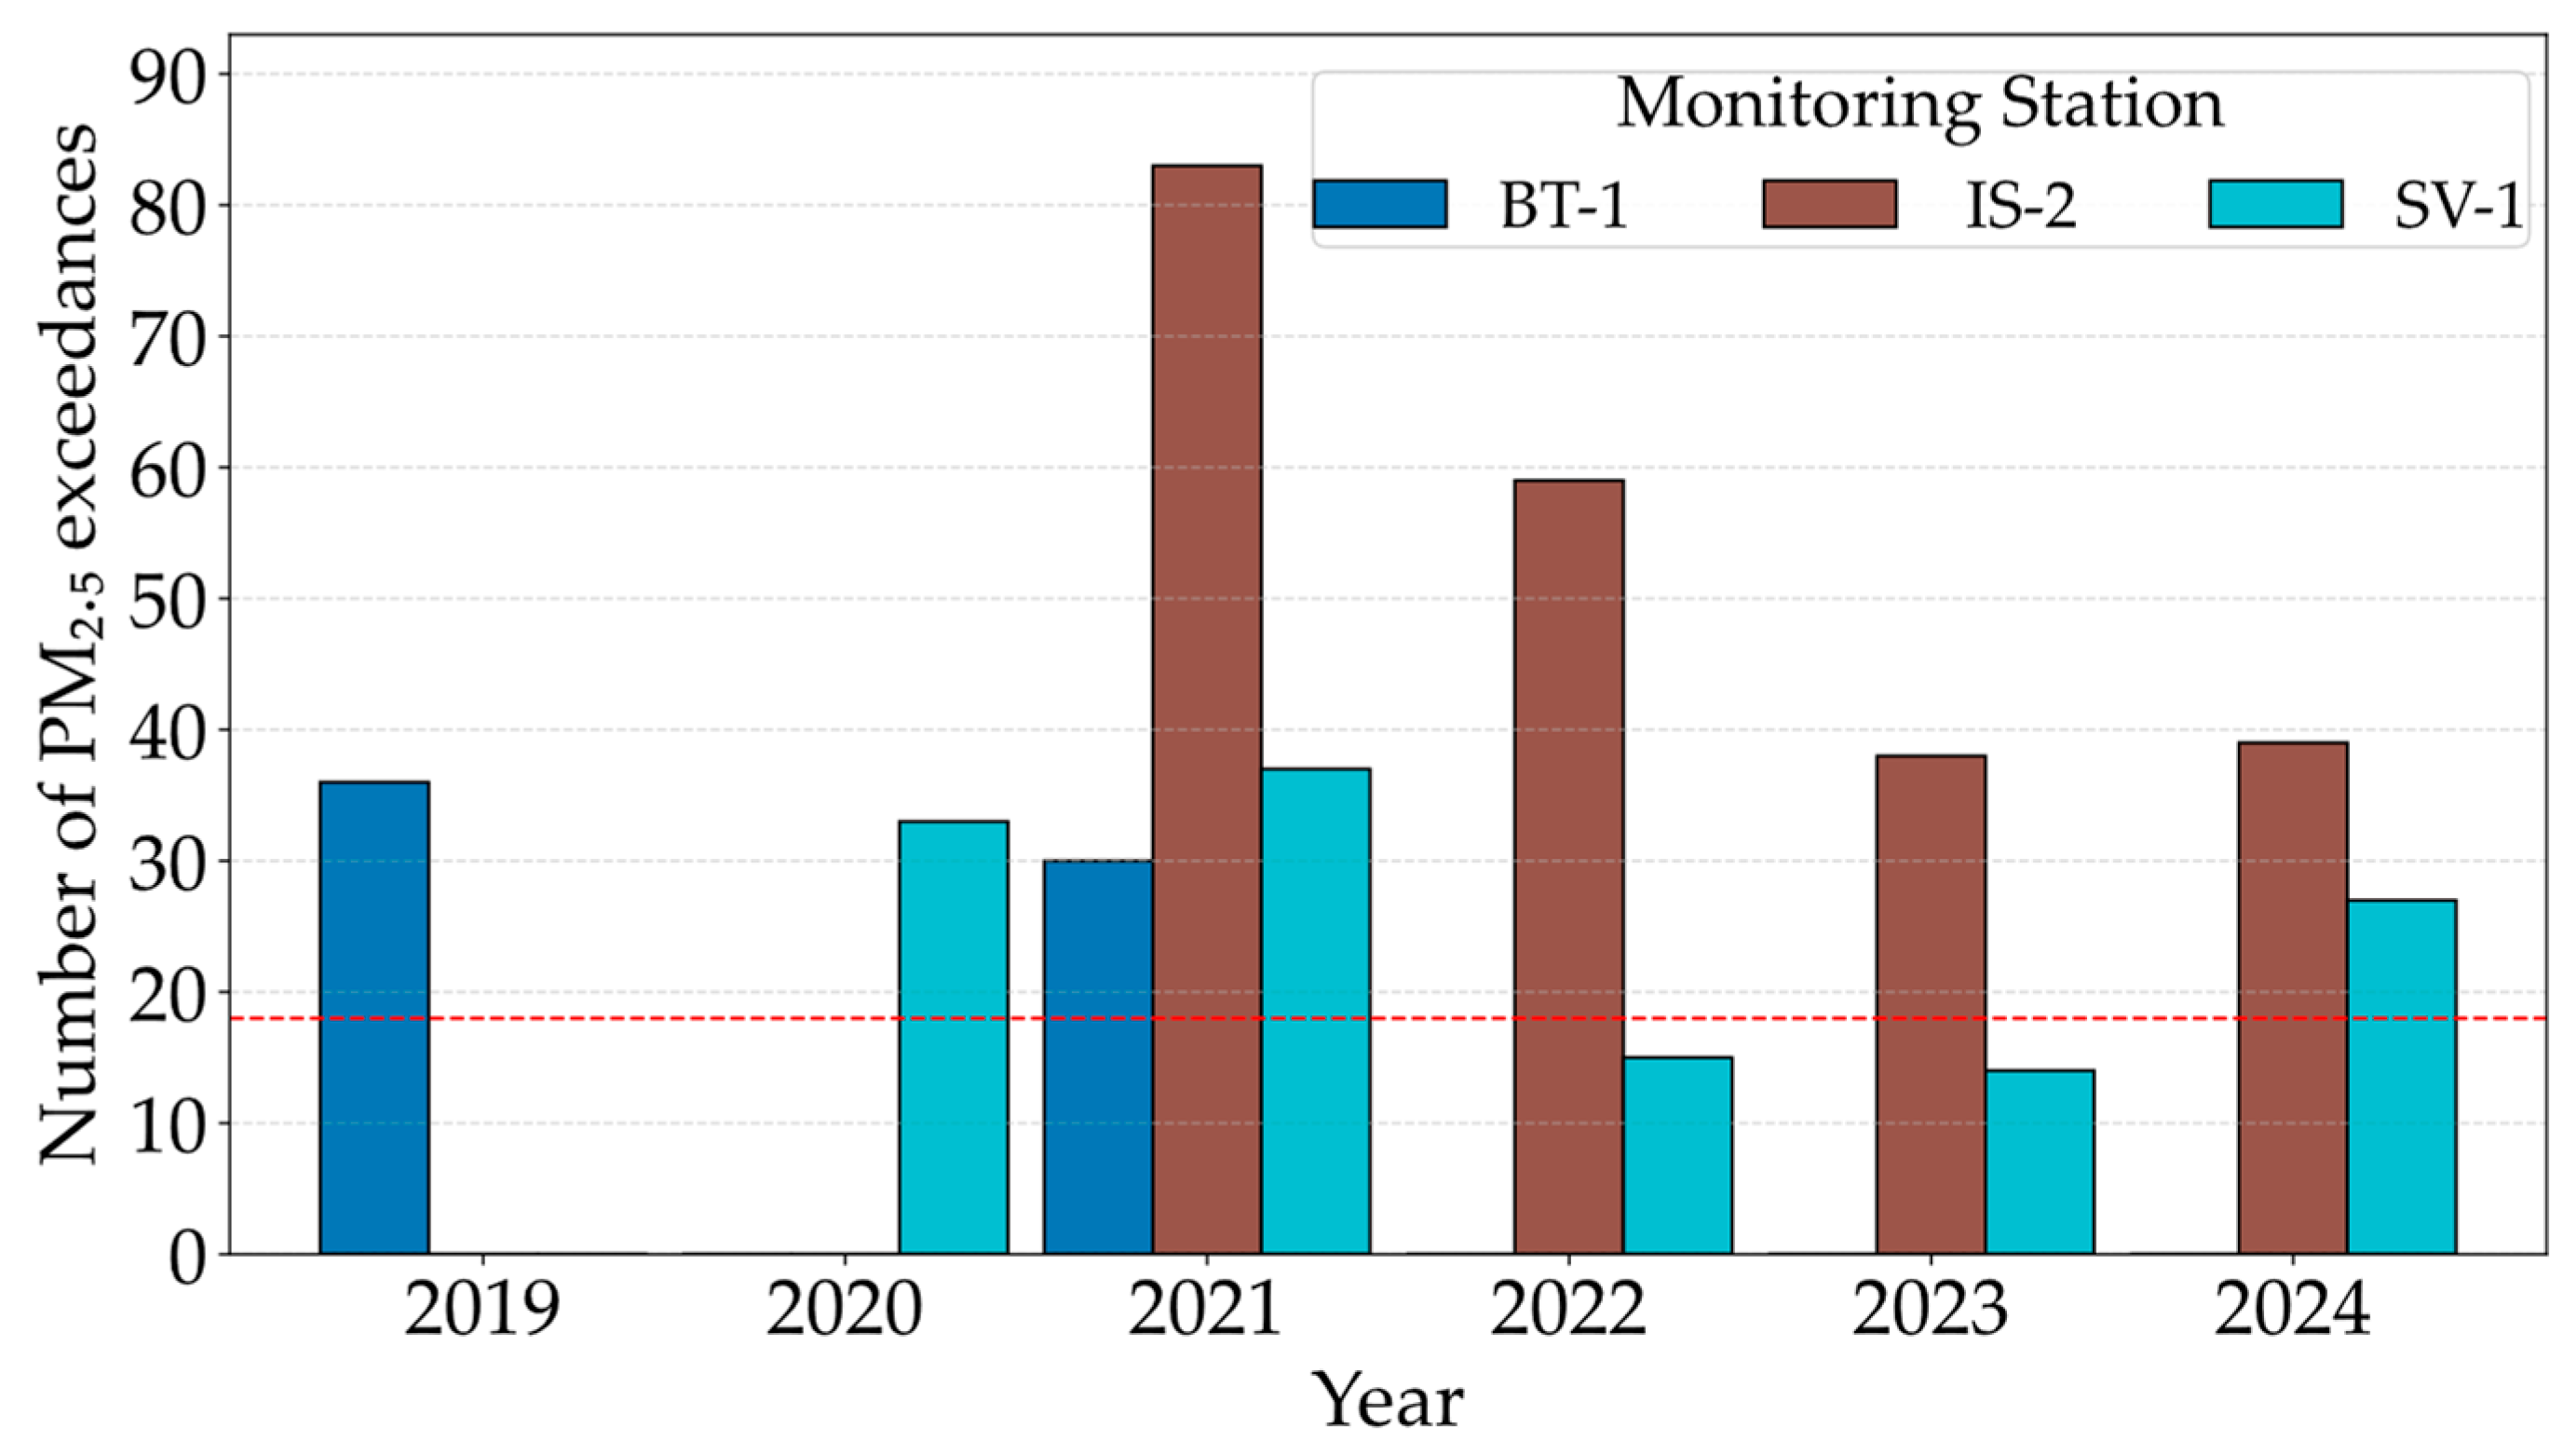
Based on the data from the study period and the future daily limit value (25 µg/m3, not to be exceeded more than 18 times a calendar year) established in Directive (EU) 2024/2881, the limit value would have been exceeded at all stations in most years. The only exceptions were SV-1 in 2022 and 2023, when the number of exceedances was below the threshold. In contrast, IS-2 consistently had the most exceedances, peaking critically in 2021 before gradually declining from 2022 to 2024. While this indicates some improvement, levels remain far above the threshold. These results suggest that while compliance with the new standard is possible under favourable conditions, this outcome is unlikely to be representative of the general trend without additional emission reduction measures (Figure 3).

3.3. Proposed Supplementary Indicators for PM10 and PM2.5

For the daily and annual mean PM values to fall below the limit values set by the new directive, additional measures to reduce emissions are necessary. When identifying and prioritising the most effective measures, the meteorological characteristics of the area and the following additional indicators can be taken into account: Excess Concentration, Episode Index and Toxic Load Index.

3.3.1. Excess Concentration

The EC indicator, as defined in point 2.2.1, was correlated with the number of daily exceedances of the future daily limit values for PM10 and PM2.5 for the purposes of interpretation.
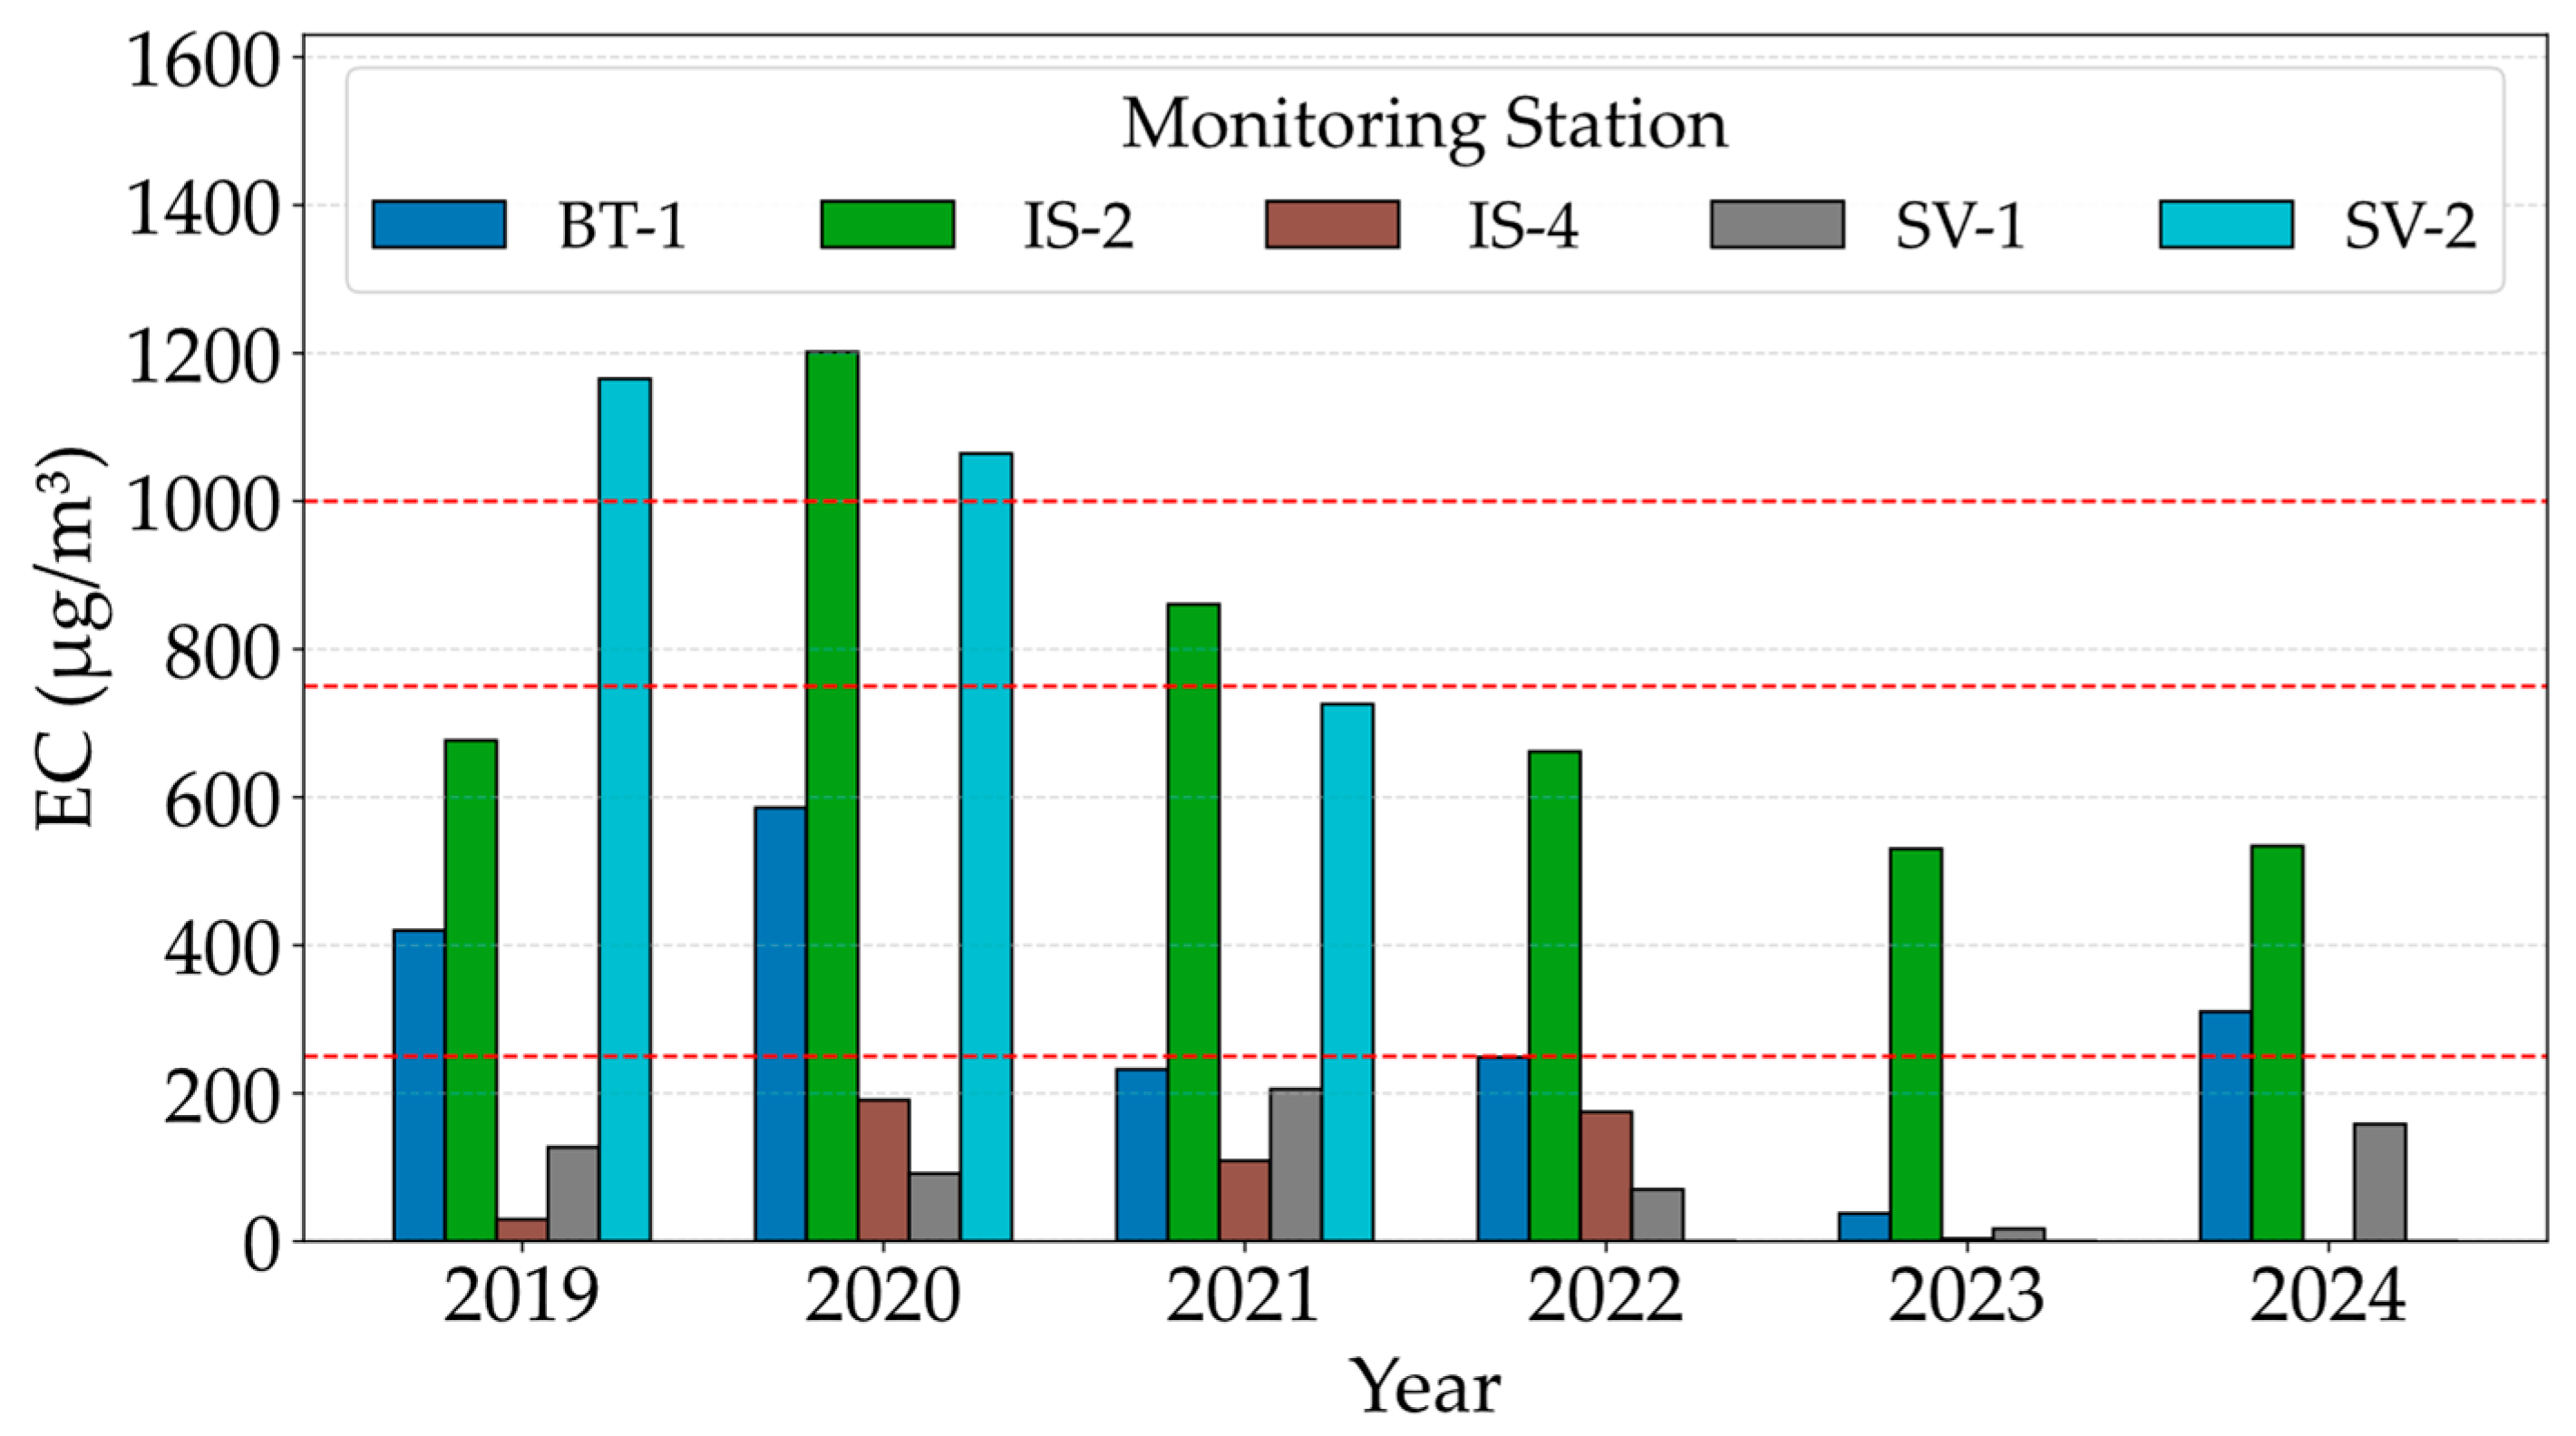
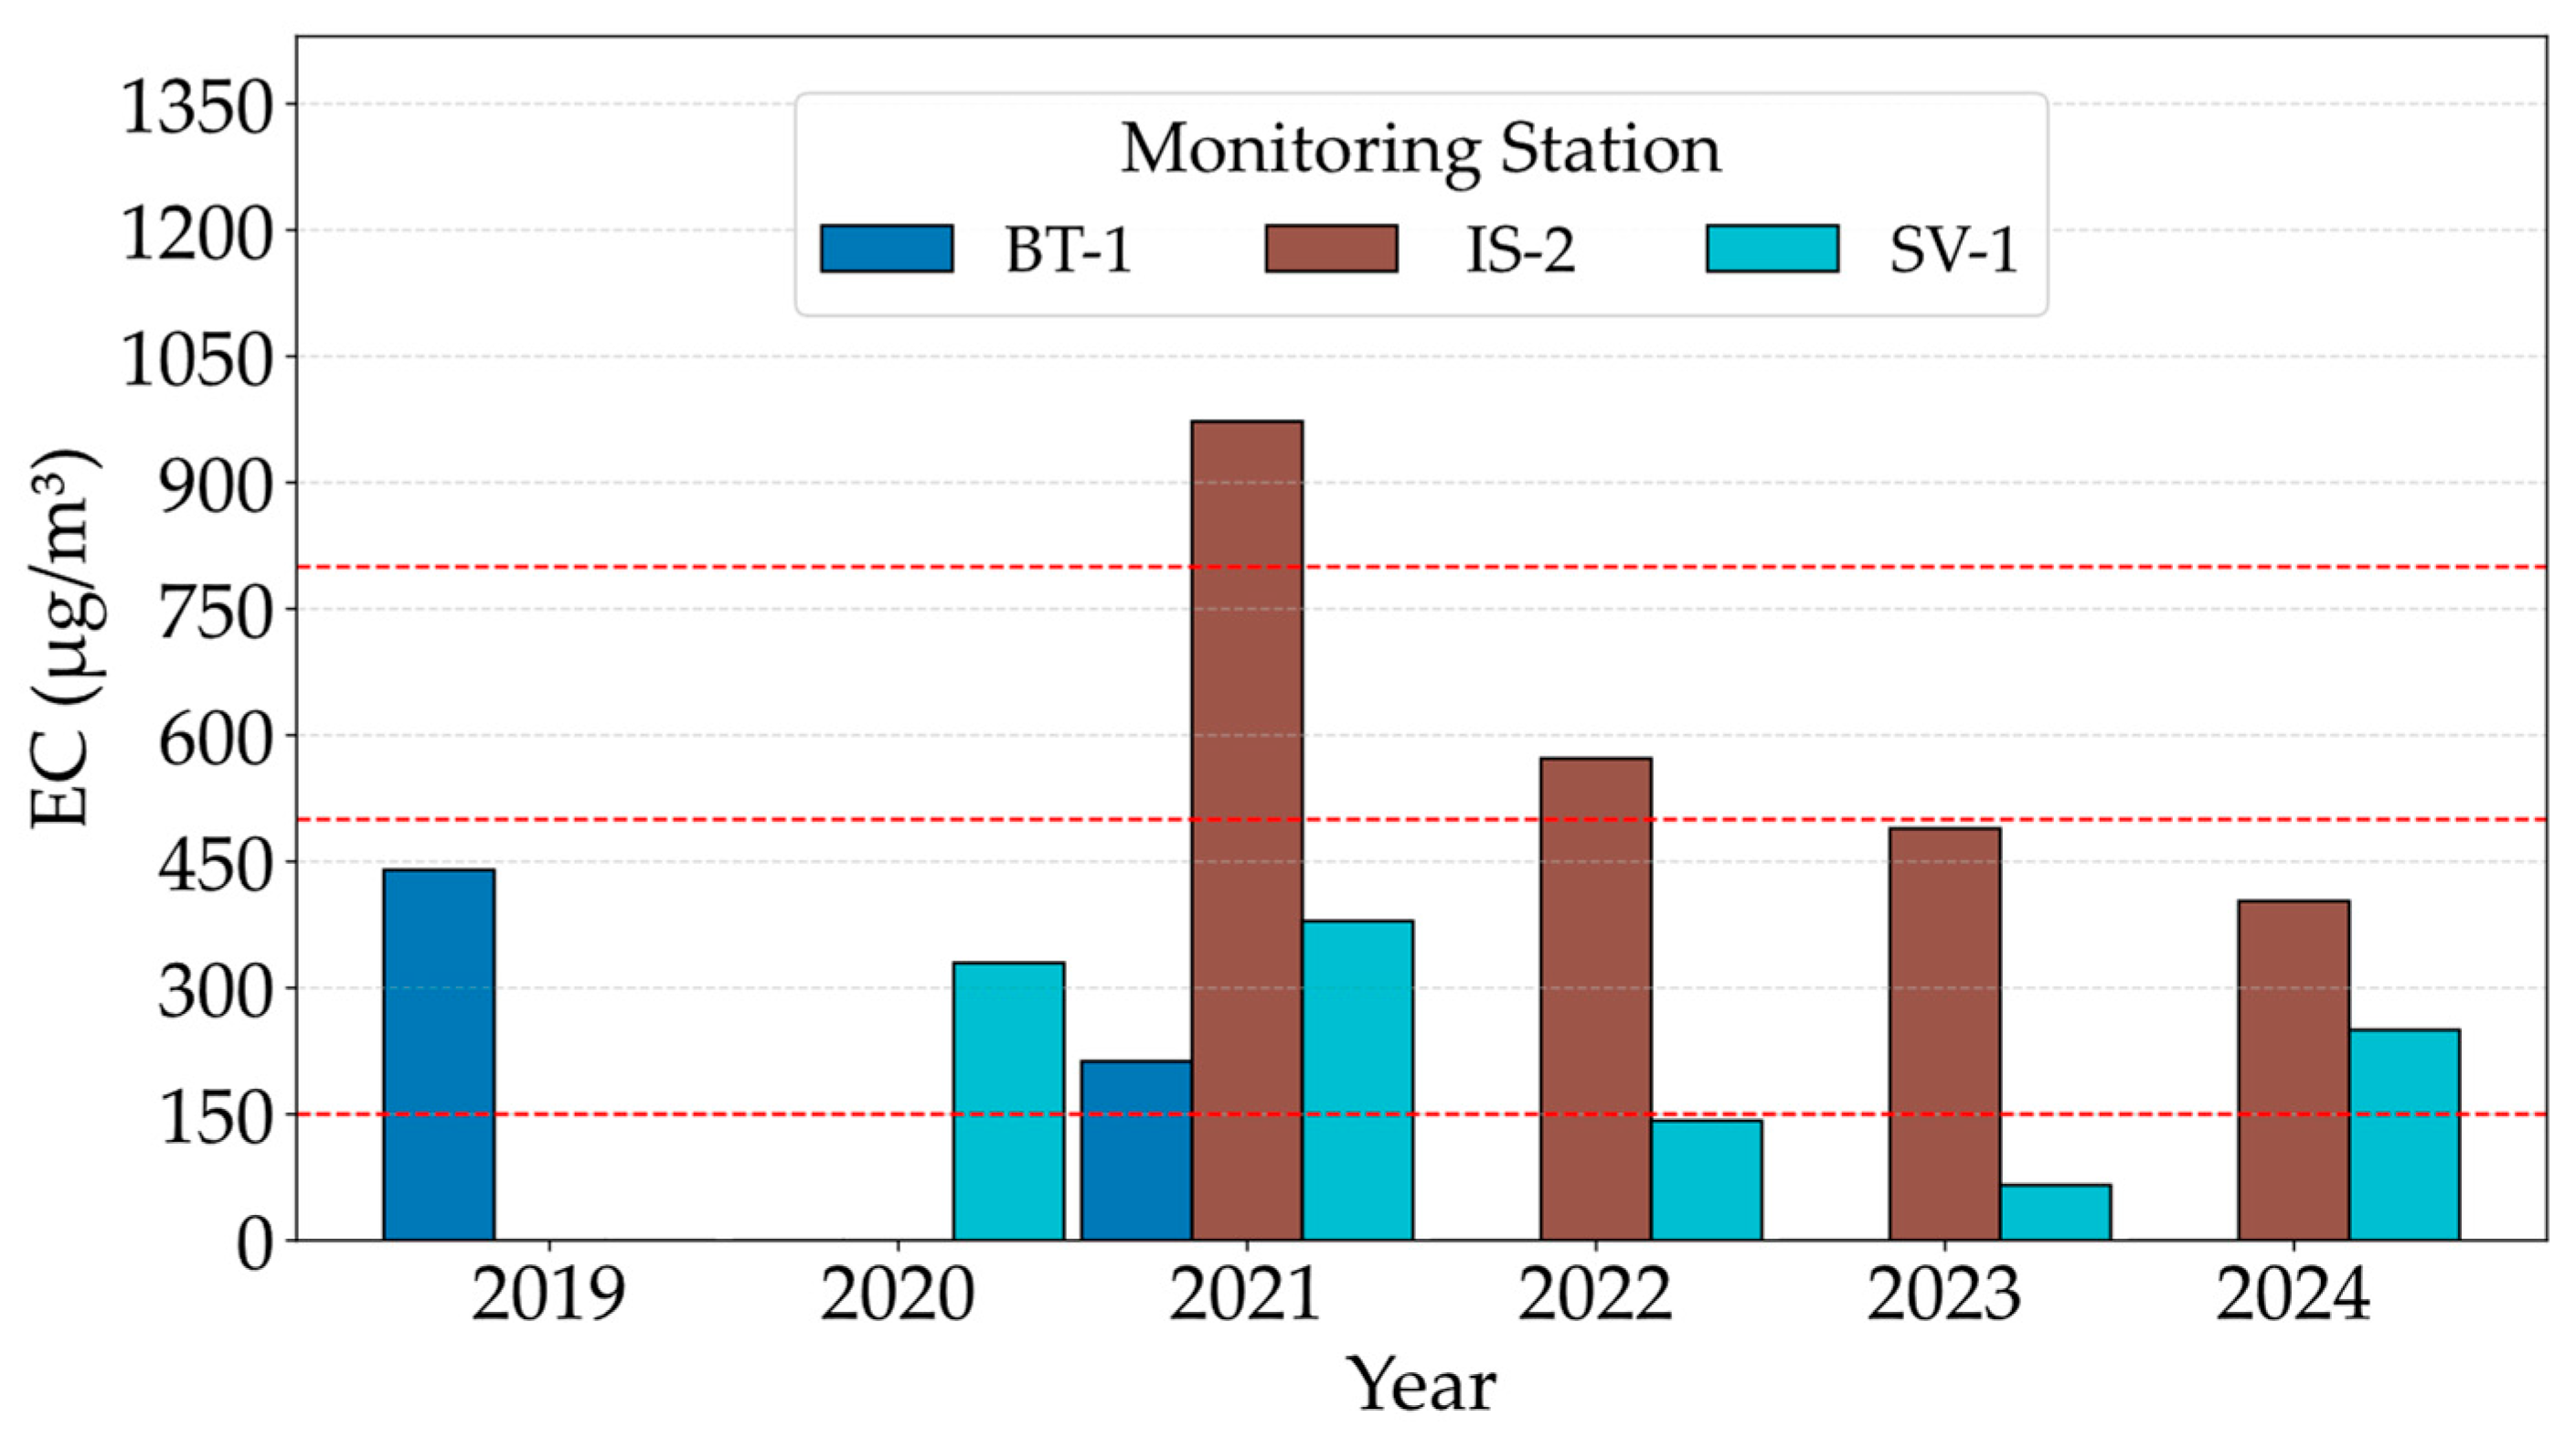
Figure 2 and Figure 4 show that assessing exposure to PM10 involves quantifying both the frequency and magnitude of hypothetical exceedances of the daily limit value. A similar pattern is observed for PM2.5, as illustrated in Figure 3 and Figure 5. Therefore, correlating the number of hypothetical daily exceedances with the annual excess concentration enables differentiation between situations characterised by frequent, low-magnitude exceedances, and situations with fewer, but significantly higher, exceedances.
The highest cumulative excess (1165 µg/m3) would have been recorded in 2019 at station SV-2, corresponding to 73 hypothetical daily exceedances, if the future PM10 limit values had been applied. In 2020, a cumulative excess of 1064 µg/m3 would have been recorded with 57 hypothetical exceedances.
At station IS-2, a cumulative PM10 excess of 677 µg/m3 would have been recorded in 2019, increasing to 1202 µg/m3 in 2020. However, there were only 52 hypothetical exceedances in both years (Figure 2 and Figure 4). According to the classification in Section 2.1 of the annual PM concentration excess magnitude, stations SV-2 and IS-2 fell into the Very High EC category in 2019 and 2020, indicating severe pollution.
From 2021 to 2023, the number of hypothetical daily exceedances of the future daily limit value for PM10 decreased, as did excess magnitude at all stations. Most stations fell into the Low EC category, with IS-2 and SV-2 in the Moderate EC category.
EC increased in 2024 compared to 2023. BT-1 returned to the Moderate EC category, but values remained below 2019–2020 levels. The trend for station SV-2 from 2022 to 2024 cannot be interpreted due to a lack of data.
IS-4 and SV-1 stations were in the Low EC category in all years for which data was available, with fewer exceedances and lower magnitude (Figure 2 and Figure 4).
A sensitivity analysis was conducted to test the robustness of the proposed thresholds. The thresholds were adjusted by 10% and 20%, both globally and selectively. Global adjustments were made simultaneously for all thresholds, while selective adjustments were made only for the lower threshold.
The results suggest that the classification system is robust overall, with reclassifications primarily occurring at stations close to category boundaries. Stability ranged from 73% to 100%, indicating the robustness of the proposed thresholds to moderate adjustments (see Table 9). A graphical representation of annual EC values under different scenarios is provided in Supplementary Figure S1.
Based on the classification of annual PM excess magnitude (Table 4), the results show significant variations in PM2.5 levels between years and locations. In 2021, station IS-2 was in the Very High EC category, with an annual excess of 973 µg/m3 and 83 hypothetical exceedances of the daily limit value. This indicates severe, sustained PM2.5 pollution levels. During the same period, the BT-1 and SV-1 stations recorded 30 and 37 hypothetical exceedances, respectively, reflecting their Moderate EC classification. At IS-2, the cumulative excess decreased from high EC in 2022 to Low EC in 2024, with fewer and less intense exceedances. At SV-1, cumulative exceedances remained low in 2022 and 2023, but in 2024 they returned to Moderate EC, below 2021 levels (Figure 5).
The sensitivity analysis for PM2.5 (Table 10 and Figure S2) shows that classifications remain stable under adjustments of ±10–20%, with changes mainly occurring near category boundaries. These results confirm the robustness of the proposed thresholds, with stability decreasing notably only in the −20% extreme scenario.

3.3.2. Episode Index (EI)

To characterise the magnitude of PM pollution episodes, the EI indicator was applied, which takes into account both the duration and the average excess concentration above the alert threshold.
Of the data analysed for the period 2019–2024, the highest EI values for PM10 were recorded at stations IS-2 and SV-2, where short episodes of very high concentrations occurred. For instance, IS-2 recorded an episode in February 2021 with an average excess of 23.34 µg/m3 over three days, resulting in an EI of 70.03 µg/m3, which was the highest value during the analysed period. Similar values were also identified at SV-2 in 2020 (Table 11).
The longest PM2.5 episode above 50 µg/m3, with the highest mean daily excess, was recorded in Iași in 2021 (Table 12). In the same 4-day interval, Suceava recorded one value above 50 µg/m3 on 22.02.2021, one day earlier, while no significant increases were observed in Botoșani. In Iași, PM10 also exceeded the future directive’s alert threshold during this period (Table 11), while no significant increases were observed in Suceava and Botoșani.
The sensitivity analysis of the EI thresholds for PM10 and PM2.5 (Table 5 and Supplementary Figures S3 and S4) shows that the classification remains highly stable with adjustments of ±20%. For PM10, one episode shifted from “Very High” to “High,” and for PM2.5, one episode alternated between “Extremely High” and “Very High.” All other episodes retained their categories, confirming that the proposed EI thresholds are robust overall, with changes occurring only when values are close to category limits.

3.3.3. Toxic Load Index (TLI)

Figure 6 illustrates the annual TLI totals that met PM2.5 data quality objectives, classified according to the criteria in Table 6. The TLI distribution showed significant variability between years and cities. The most pronounced toxic episodes were observed at IS-2 in 2021, when the highest percentage of high and very high toxicity days were recorded. At BT-1, toxicity levels were mostly low, with no year exceeding the 25% threshold for high or very high episodes. SV-1 exhibited intermediate patterns, with notable peaks in 2021 (27.3%), 2022 (26.7%), and 2024 (31.8%). While IS-2 never surpassed the 25% threshold, with a maximum of 23% in 2023, the absolute number of high toxicity days remained significant due to frequent PM2.5 exceedances.
Table 13 summarizes the main exceedance patterns and EC/EI classifications by city.

4. Discussion

Based on these results, the discussion covers three main topics: projected compliance with Directive (EU) 2024/2881, the value of the proposed indicators (EC, EI, and TLI), and the implications of these indicators for public policy.

4.1. Projected Compliance Under Directive (EU) 2024/2881

The application of Directive (EU) 2024/2881 leads to a stricter reassessment of air quality, where values previously considered acceptable become relevant in terms of exposure.
According to the new annual PM10 limit value, only the mean concentrations measured in 2022 and 2023 at SV-1 and IS-4 would comply with the future standard. For SV-2 (2022–2024) and IS-2 (2024), compliance could not be assessed due to incomplete data Table 7.
Applying the daily limit values for PM10 and PM2.5, which will come into force in 2030, provides a useful estimate of current exposure relative to future standards. Retrospective analysis shows that, in almost all years, most stations would have exceeded the threshold of 18 daily exceedances per year. Exceptions for PM10 include stations IS-4 (2019–2023; no data available for 2024), SV-1 (2019–2020; 2023–2024), and BT-1 (2021–2023). For PM2.5, only SV-1 complied in 2022 and 2023.
Between 2021 and 2023, both the number of exceedance days and the cumulative excess showed a downward trend, suggesting an overall improvement in air quality at most monitored stations. This development may be linked to the implementation of emission reduction measures [20,21] and/or favourable meteorological conditions for pollutant dispersion. In 2024, the number of daily PM10 exceedances increased slightly at SV-1 and BT-1 compared to 2023, due to less favourable dispersion conditions. However, these values remained considerably lower than in 2019, indicating a possible stabilization of pollution at a lower level. At IS-2, PM10 exceedances decreased in 2024, pointing to local rather than regional influences.
In conclusion, achieving the 2030 targets will require sustained and targeted emission reduction efforts. Instances of compliance, such as SV-1 in 2022 and 2023, demonstrate that meeting the standards is feasible under favourable local conditions and effective interventions. Nevertheless, data gaps (e.g., the absence of PM10 records for SV-2 between 2022 to 2024) remain a limitation for a comprehensive compliance assessment.

4.2. Added Value of EC, EI, and TLI

Traditional air quality indicators, such as annual limit value and daily limit value, are necessary for compliance with Directive (EU) 2024/2881. However, these indicators do not capture the magnitude, duration, or toxicological potential of pollution episodes. The proposed indicators—Excess Concentration (EC), Episode Index (EI), and Toxic Load Index (TLI)—are designed as complementary tools. Integrating them with existing metrics allows authorities to identify risks earlier, differentiate between mild and severe episodes, and develop locally tailored interventions (Figure 7).
The EC distinguishes between frequent, moderate exceedances and rare, severe ones. For instance, in 2019, IS-2 recorded 73 hypothetical daily PM10 exceedances under projected limit values, with an annual cumulative excess above 1000 µg/m3, indicating sustained exposure. In contrast, IS-2 registered fewer exceedances (52) in 2020 but a substantial cumulative excess, reflecting intense pollution episodes. These results illustrate that the frequency of exceedances and cumulative excess can diverge, providing complementary insights. SV-2 reflects chronic exposure to moderate exceedances, while IS-2 captures acute health risks from intense episodes.
At SV-2, high cumulative excess is associated with unfavourable weather conditions that limit dispersion and strong contributions from residential heating and industrial sources [21]. This explains why cumulative excess may remain high even when the number of exceedances declines slightly.
Exceedance variability between stations and years reflects differences in local emission sources, urban morphology, and meteorological conditions. We have analysed these aspects in detail in previous studies [20,21], and summarize them here to explain the heterogeneity observed in the present dataset.
The most severe situation for PM2.5 was observed at IS-2 in 2021, which confirms the higher toxicological potential of fine particles. While more recent years generally showed moderate or low EC values, episodic pollution at IS-2 and SV-1 suggests that adverse conditions or increased activity could still trigger high-risk events. These findings highlight that not all exceedances are the same and that differentiated emission reduction measures tailored to local sources and area characteristics are necessary. Incorporating EC into air quality plans or roadmaps could help identify high-risk areas, even when exceedance counts appear low.
Sensitivity analyses confirmed the robustness of the proposed EC thresholds, though refining the lower threshold may be necessary in future studies.
The EI is designed to capture the intensity and duration of pollution episodes, providing a more accurate representation of short-term exposure risks. Epidemiological studies, including a meta-analysis of 59 studies in China [24] and a case study in Brescia, Italy [16], consistently demonstrate that a 10 µg/m3 increase in daily PM concentrations is associated with an increased risk of mortality and morbidity. The effects are stronger for PM2.5 due to its ability to penetrate deeper into the respiratory tract.
From 2020 to 2021, IS-2 and SV-2 recorded high PM10 EI values, reflecting brief yet intense episodes lasting several days. These episodes often coincided across multiple stations, suggesting regional drivers such as thermal inversions and stagnant weather. The highest EI observed during the study was for PM2.5 at IS-2 in 2021 (105.82 µg/m3), which highlights the acute risk posed by fine particles. In contrast, PM2.5 episodes were less frequently simultaneous across stations, reflecting their origin in local combustion and secondary formation processes.
These findings confirm that EIs complement exceedance counts by quantifying episode severity and duration. Sensitivity analyses further support the robustness of the proposed thresholds, requiring only minor refinements near category boundaries. Comparing EIs across stations and years allows for better prioritization of interventions, such as restricting traffic during inversions or strengthening control of industrial emissions.
TLI offers a comprehensive view of particulate matter toxicity, combining exceedance magnitude and particle composition. This indicator revealed significant spatial and temporal variability across the three cities. BT-1 generally displayed lower toxicity levels, while SV-1 and IS-2 recorded years with a significant proportion of high-toxicity days (e.g., >30% in 2024 at SV-1), indicating periods of increased health risk despite annual averages suggesting compliance.
These results confirm the added value of TLI in identifying high-risk situations that conventional indicators miss. Similar to recommendations from advisory bodies such as COMEAP [13], incorporating toxicity-sensitive indicators can strengthen air quality assessments and support more effective public health policies. This concept aligns with approaches that emphasize cumulative exposure and urban resilience in air pollution management [26,27,28].
Together, these indicators allow a more nuanced characterization of air quality by capturing magnitude, duration, and toxicological relevance. They also enable the differentiation of exposure patterns across locations and years, thereby supporting more tailored and effective interventions. However, their broader applicability requires further validation in other regions and correlation with health outcome data.
Direct numerical comparisons cannot be made for EC, EI, and TLI since these indicators are newly introduced, but the frequency of PM exceedances observed in Romanian cities is consistent with patterns reported in other European urban areas. Studies from Poland [29], the Czech Republic [30] and Italy [31] indicate that exceedances of the WHO guideline values for PM10 and PM2.5 are common, suggesting that the situation in Iași, Suceava, and Botoșani reflects a broader regional challenge rather than an isolated case.

4.3. Policy Implications

Proposing additional indicators, such as EC, EI, and TLI, establishes a stronger scientific basis for designing differentiated urban air quality policies that align with future EU limit values. These metrics complement current directives by capturing cumulative exposure, episode intensity and duration, and the toxicological profile of particulate matter. This added value allows us to transition from generic interventions based on exceedance counts to locally tailored measures that target dominant sources and reduce real health impacts.
Based on our results and municipal air quality plans [22,23], the top intervention priorities are reducing emissions from residential biomass heating, modernizing road transport, and addressing industrial processes, such as asphalt production. While these sources contribute differently to air pollution in different cities—industrial activities are particularly relevant in Iași, while road transport is particularly relevant in Suceava—the combined evidence confirms that biomass heating, traffic, and industrial processes account for the largest share of particulate emissions. These findings are consistent with the exceedance patterns captured by EC, EI, and TLI, which underscore the importance of targeting these three areas.
Our analysis shows that policies should be differentiated by both indicator and location. In Suceava (SV-2), for example, EC values indicate frequent moderate exceedances. Therefore, priority should be given to long-term structural measures, such as replacing biomass heating systems and reducing background traffic. In Iași (IS-2), high EI values highlight short but intense episodes, suggesting the need for rapid response measures, including temporary traffic restrictions, and targeted public health warnings. In Botoșani (BT-1), overall levels are lower; however, TLI indicates periods of elevated toxicological burden, which supports enhanced monitoring and protective measures for sensitive groups. These differences demonstrate that a uniform policy approach is inadequate and that strategies tailored to local conditions are necessary.
The proposed indicators can be implemented by municipalities through category-based thresholds. EC provides a medium to long-term perspective. Areas that repeatedly fall within the high or very high EC categories should be prioritized for structural interventions, such as upgrading heating systems or modernizing traffic infrastructure. EC is particularly suited for long-term action plans, whereas EI is suited for short-term action plans. When episodes reach the Very High or Extremely High categories, municipalities could implement temporary measures such as traffic restrictions, bans on residential burning, or public health warnings. High episodes may be managed through awareness campaigns. TLI identifies periods with an excessive toxicological burden and justifies enhanced monitoring and protective measures for vulnerable groups. This categorization (low, moderate, high, very high, and extremely high) provides municipalities with decision-making thresholds based on exposure intensity and duration. These thresholds complement standard exceedance counts.
Evidence from other European and international contexts supports the effectiveness of these measures. For example, Progiou et al. (2023) demonstrated that reducing biomass emissions by 45% could eliminate daily exceedances of the PM10 limit value [32]. In Beijing in 2007, traffic restrictions implemented for four consecutive days led to a 6–15% decrease in hourly PM10 concentrations in the urban area [33]. In Lanzhou, temporary traffic bans during international marathons produced stronger effects, reducing submicron particles (100–200 nm) by up to 67%. This fraction of PM2.5 poses significant health risks [34]. In Krakow, street washing campaigns reduced PM10 and PM2.5 concentrations by up to 17% and 15%, respectively. The largest effects were observed in high-traffic areas [35]. In German cities such as Berlin and Munich, introducing low-emission zones led to moderate decreases in overall PM10 and significant reductions in soot and toxic fine particles, particularly from diesel combustion [36,37].
These cases demonstrate how targeted, evidence-based actions can supplement the structural measures already planned in Romanian municipalities.
This study has several limitations that should be acknowledged. First, the limited availability of PM monitoring data restricts temporal coverage, particularly at stations such as BT-1 and SV-2. This limits the robustness and generalizability of comparative analyses. Second, meteorological variability strongly influences pollutant dispersion and may introduce interannual fluctuations that do not reflect structural changes in emission sources. Despite these limitations, the proposed indicators (EC, EI, and TLI) are still valuable for characterizing exposure and can serve as operational tools to support long-term assessments and public policy planning.
By operationalizing EC, EI, and TLI, municipalities can translate these lessons into interventions tailored to local conditions. These indicators provide decision support thresholds that guide structural, short-term, and health-oriented actions. This enables Iași, Suceava, and Botoșani to align local strategies with proven European practices and move beyond compliance reporting.

5. Conclusions

This study shows that, without additional measures, Suceava and Iași will likely exceed the 2030 EU limit values for PM10 and PM2.5. Insufficient data prevent a clear assessment for Botoșani. The proposed indicators: Excess Concentration (EC), Episode Index (EI), and Toxic Load Index (TLI), provide added value by capturing exceedance magnitude, episode intensity, and toxicological load, thereby strengthening both real-time decision-making and long-term evaluations.
Three priorities emerge to effectively guide policy: (i) reducing emissions from residential heating, (ii) addressing traffic-related pollution, and (iii) supplementing structural strategies with short-term measures during pollution episodes. Future research should focus on validating these indicators’ thresholds against health outcomes, extending the analysis to other Romanian cities, and incorporating the chemical composition of PM to refine toxic load and exposure assessments.

Supplementary Materials

The following supporting information can be downloaded at: https://www.mdpi.com/article/10.3390/environments12100373/s1, Figure S1: Annual EC values of PM10 under reference thresholds and sensitivity scenarios (−10%, −20%, +10%, +20%). Red dashed lines represent the proposed classification thresholds. The results illustrate that most classifications remain unchanged, with reclassifications occurring mainly at stations close to category boundaries; Figure S2. Annual EC values of PM2.5 under reference thresholds and sensitivity scenarios (−10%, −20%, +10%, +20%). Red dashed lines represent the proposed classification thresholds. Classifications remain largely stable, with reclassifications primarily occurring near category limits. There is a clear drop in stability only for the −20% scenario; Figure S3. Sensitivity analysis of EI classification for PM10 under reference thresholds and adjusted thresholds (±20%). The results indicate that almost all episodes retain their category, with only one reclassification, confirming the robustness of the proposed EI thresholds; Figure S4. Sensitivity analysis of EI classification for PM2.5 under reference thresholds and adjusted thresholds (±20%). The results indicate that most episodes retain their category, with only one case shifting between Extremely high and Very high, confirming the robustness of the proposed EI thresholds.

Author Contributions

Conceptualization, L.D., M.-M.C. and I.-G.B.; methodology, L.D. and M.-M.C.; software, L.D. and M.-M.C.; validation, M.-M.C.; formal analysis, L.D. and M.-M.C.; investigation, L.D.; resources, I.-G.B.; data curation, L.D.; writing—original draft preparation, L.D. and M.-M.C.; writing—review and editing, I.-G.B.; visualization, L.D.; supervision, I.-G.B.; funding acquisition, I.-G.B. All authors have read and agreed to the published version of the manuscript.

Funding

This research was funded by Doctoral Grants from the Geoscience Doctoral School in the Department of Geography, Faculty of Geography and Geology.

Data Availability Statement

All data used in the paper are publicly available. We may supply the data that we gathered from public sources upon reasonable request to the corresponding author.

Acknowledgments

L.D. expresses appreciation to the University Alexandru Ioan Cuza for its financial support via the fellowship. M.-M.C. and I.-G.B. wish to extend their appreciation to the Operational Program Competitiveness 2014–2020, Axis 1, related to POC/448/1/1 Research infrastructure projects for public R&D institutions/Sections F 2018, through the Research Center with Integrated Techniques for Atmospheric Aerosol Investigation in Romania (RECENT AIR) project, under grant agreement MySMIS no. 127324.

Conflicts of Interest

The authors declare no conflicts of interest.

Abbreviations

The following abbreviations are used in this manuscript:
AQGAir Quality Guidelines
ECExcess Concentration
EIEpisode Index
PMParticulate matter
TLIToxic Load Index
WHOWorld Health Organization

References

  1. European Environment Agency. The European Environment-State and Outlook 2020. Knowledge for Transition to a Sustainable Europe; EEA: Copenhagen, Denmark, 2020; Volume 60, ISBN 9789294800909. [Google Scholar] [CrossRef]
  2. World Health Organization. WHO Global Air Quality Guidelines: Particulate Matter (PM2.5 and PM10), Ozone, Nitrogen Dioxide, Sulfur Dioxide and Carbon Monoxide: Executive Summary; World Health Organization: Geneva, Switzerland, 2021; ISBN 978-92-4-003443-3. [Google Scholar]
  3. European Environment Agency. Premature Deaths Caused by Environmental Pollution. European Zero Pollution Dashboards. 2025. Available online: https://www.eea.europa.eu/en/european-zero-pollution-dashboards/indicators/premature-deaths-as-a-result-of-environmental-pollution (accessed on 30 July 2025).
  4. European Environment Agency. Air Quality Status Report 2025. 2025. Available online: https://www.eea.europa.eu/en/analysis/publications/air-quality-status-report-2025 (accessed on 15 August 2025).
  5. European Commission. 2025 Environmental Implementation Review - Country Report: ROMANIA; Commission Staff Working Document, SWD(2025) 322 final, Brussels, 7 July 2025; Publications Office of the European Union: Luxembourg, 2025; Available online: https://environment.ec.europa.eu/publications/2025-environmental-implementation-review-country-report-romania_en (accessed on 15 May 2025).
  6. Philip, S.; Martin, R.V.; Snider, G.; Weagle, C.L.; Van Donkelaar, A.; Brauer, M.; Henze, D.K.; Klimont, Z.; Venkataraman, C.; Guttikunda, S.K.; et al. Anthropogenic fugitive, combustion and industrial dust is a significant, underrepresented fine particulate matter source in global atmospheric models. Environ. Res. Lett. 2017, 12, 044018. [Google Scholar] [CrossRef]
  7. Van Den Heuvel, R.; Staelens, J.; Koppen, G.; Schoeters, G. Toxicity of urban PM10 and relation with tracers of biomass burning. Int. J. Environ. Res. Public Health 2018, 15, 320. [Google Scholar] [CrossRef]
  8. Directive (EU) 2024/2881 of the European Parliament and of the Council of 23 October 2024 on Ambient Air Quality and Cleaner Air for Europe (Recast). Official Journal of the European Union 2024, L, 2024/2881. Available online: https://eur-lex.europa.eu/legal-content/EN/TXT/?uri=CELEX:32024L2881 (accessed on 1 May 2025).
  9. Directive 2008/50/EC of the European Parliament and of the Council of 21 May 2008 on Ambient Air Quality and Cleaner Air for Europe. Official Journal of the European Union 2008, L 152, 1–44. Available online: https://eur-lex.europa.eu/legal-content/EN/TXT/?uri=CELEX:32008L0050 (accessed on 1 May 2025).
  10. Pražnikar, Z.J.; Pražnikar, J. The effects of particulate matter air pollution on respiratory health and on the cardiovascular system. Zdr. Varst. 2012, 51, 190–199. [Google Scholar] [CrossRef]
  11. Park, J.; Kim, H.J.; Lee, C.H.; Lee, C.H.; Lee, H.W. Impact of long-term exposure to ambient air pollution on the incidence of chronic obstructive pulmonary disease: A systematic review and meta-analysis. Environ. Res. 2021, 194, 110703. [Google Scholar] [CrossRef] [PubMed]
  12. Taj, T.; Poulsen, A.H.; Ketzel, M.; Geels, C.; Brandt, J.; Christensen, J.H.; Puett, R.; Hvidtfeldt, U.A.; Sørensen, M.; Raaschou-Nielsen, O. Exposure to PM2.5 constituents and risk of adult leukemia in Denmark: A population-based case–control study. Environ. Res. 2021, 196, 110418. [Google Scholar] [CrossRef] [PubMed]
  13. Ayres, J.G. Review of the UK Air Quality Index: Committee on the Medical Effects of Air Pollutants (COMEAP); Health Protection Agency: London, UK, 2011. Available online: https://www.gov.uk/government/publications/comeap-review-of-the-uk-air-quality-index (accessed on 28 May 2025).
  14. Kappos, A.D.; Bruckmann, P.; Eikmann, T.; Englert, N.; Heinrich, U.; Höppe, P.; Koch, E.; Krause, G.H.M.; Kreyling, W.G.; Rauchfuss, K.; et al. Report The German view Health effects of particles in ambient air. Int. J. Hyg. Environ. Health 2004, 207, 399–407. [Google Scholar] [CrossRef]
  15. Brunekreef, B.; Forsberg, B. Epidemiological evidence of effects of coarse airborne particles on health. Eur. Respir. J. 2005, 26, 309–318. [Google Scholar] [CrossRef]
  16. Pini, L.; Giordani, J.; Gardini, G.; Concoreggi, C.; Pini, A.; Perger, E.; Vizzardi, E.; Di Bona, D.; Cappelli, C.; Ciarfaglia, M.; et al. Emergency department admission and hospitalization for COPD exacerbation and particulate matter short-term exposure in Brescia, a highly polluted town in northern Italy. Respir. Med. 2021, 179, 106334. [Google Scholar] [CrossRef]
  17. Abbey, D.E.; Euler, G.L.; Moore, J.K.; Petersen, F.; Hodgkin, J.E.; Magie, A.R. Applications of a method for setting air quality standards based on epidemiological data. J. Air Pollut. Control Assoc. 1989, 39, 437–445. [Google Scholar] [CrossRef]
  18. Park, M.; Joo, H.S.; Lee, K.; Jang, M.; Kim, S.D.; Kim, I.; Borlaza, L.J.S.; Lim, H.; Shin, H.; Chung, K.H.; et al. Differential toxicities of fine particulate matters from various sources. Sci. Rep. 2018, 8, 17007. [Google Scholar] [CrossRef]
  19. Dai, L.; Zanobetti, A.; Koutrakis, P.; Schwartz, J.D. Associations of fine particulate matter species with mortality in the united states: A multicity time-series analysis. Environ. Health Perspect. 2014, 122, 837–842. [Google Scholar] [CrossRef]
  20. Dragoi (Oniu), L.; Breabăn, I.G.; Cazacu, M.M. 2017–2020 trends of particulate matter PM10 concentrations in the cities of Suceava and Botoșani. Present Environ. Sustain. Dev. 2023, 17, 335–349. [Google Scholar] [CrossRef]
  21. Drăgoi (Oniu), L.; Cazacu, M.-M.; Breabăn, I.-G. Analysis of the PM2.5/PM10 Ratio in Three Urban Areas of Northeastern Romania. Atmosphere 2025, 16, 720. [Google Scholar] [CrossRef]
  22. Mayor of Suceava Municipality, Air Quality Plan in Suceava Municipality for PM10 Particulate Matter, 2023–2027 Period 2023–2027. Available online: https://primariasv.ro/dm_suceava/site.nsf/atasament/77984F10279689EBC2258CAE0032003C/$FILE/PCA%20municipiul%20Suceava%202023_2027_avizat.pdf?Open (accessed on 14 June 2025). (In Romanian).
  23. Mayor of Iasi Municipality. Integrated Air Quality Plan for Iasi Municipality for Nitrogen Dioxide and Nitrogen Oxides (NO2/NOX) and Particulate Matter Indicators, Period 2024–2028. Available online: https://www.primaria-iasi.ro/dm_iasi/portal.nsf/pagini/planuri+de+calitatea+a+aerului-0001465A?Open (accessed on 14 June 2025). (In Romanian).
  24. Lu, F.; Xu, D.; Cheng, Y.; Dong, S.; Guo, C.; Jiang, X.; Zheng, X. Systematic review and meta-analysis of the adverse health effects of ambient PM2.5 and PM10 pollution in the Chinese population. Environ. Res. 2015, 136, 196–204. [Google Scholar] [CrossRef] [PubMed]
  25. Li, Z.; Yang, X. Ratio of PM2.5 to PM10 Mass Concentrations in Beijing and Relationships with Pollution from the North China Plain. Asia-Pacific J. Atmospheric Sci. 2020, 57, 421–434. [Google Scholar] [CrossRef]
  26. Tanasa, I.; Cazacu, M.; Sluser, B. Air Quality Integrated Assessment: Environmental Impacts, Risks and Human Health Hazards. Appl. Sci. 2023, 13, 1222. [Google Scholar] [CrossRef]
  27. Cazacu, M.-M.; Schiopu Catalin Emil, R.C. Politica Publică Alternativă Pentru Măsuri Integrate de Reducere a Poluării Aerului; StudIS: Iasi, Romania, 2024; ISBN 9196320559. [Google Scholar]
  28. Cariolet, J.M.; Colombert, M.; Vuillet, M.; Diab, Y. Assessing the resilience of urban areas to traffic-related air pollution: Application in Greater Paris. Sci. Total Environ. 2018, 615, 588–596. [Google Scholar] [CrossRef]
  29. Kobza, J.; Geremek, M.; Dul, L. Characteristics of air quality and sources affecting high levels of PM10 and PM2.5 in Poland, Upper Silesia urban area. Environ. Monit. Assess. 2018, 190, 515. [Google Scholar] [CrossRef]
  30. Volná, V.; Blažek, Z. Contribution to the study of possible transport of PM10 aerosols in the eastern part of the Czech Republic. Heliyon 2024, 10, e36850. [Google Scholar] [CrossRef]
  31. Mecca, D.; Boanini, C.; Vaccaro, V.; Gallione, D.; Mastromatteo, N.; Clerico, M. Spatial variation, temporal evolution, and source direction apportionment of PM1, PM2.5, and PM10: 3-year assessment in Turin (Po Valley). Environ. Monit. Assess. 2024, 196, 1251. [Google Scholar] [CrossRef]
  32. Progiou, A.; Liora, N.; Sebos, I.; Chatzimichail, C.; Melas, D. Measures and Policies for Reducing PM Exceedances through the Use of Air Quality Modeling: The Case of Thessaloniki, Greece. Sustainability 2023, 15, 930. [Google Scholar] [CrossRef]
  33. Wu, Q.; Wang, Z.; Gbaguidi, A.; Tang, X.; Zhou, W. Numerical study of the effect of traffic restriction on air quality in beijing. Sci. Online Lett. Atmos. 2010, 6A, 17–20. [Google Scholar] [CrossRef]
  34. Zhao, S.; Yu, Y. Effect of short-term regional traffic restriction on urban submicron particulate pollution. J. Environ. Sci. 2017, 55, 86–99. [Google Scholar] [CrossRef] [PubMed]
  35. Kryłów, M.; Generowicz, A. Impact of Street Sweeping and Washing on the PM10 and PM2.5 Concentrations in Cracow (Poland). Rocz. Ochr. Sr. 2019, 29, 691–711. [Google Scholar]
  36. Fensterer, V.; Küchenhoff, H.; Maier, V.; Wichmann, H.E.; Breitner, S.; Peters, A.; Gu, J.; Cyrys, J. Evaluation of the impact of low emission zone and heavy traffic ban in Munich (Germany) on the reduction of PM10 in ambient air. Int. J. Environ. Res. Public Health 2014, 11, 5094–5112. [Google Scholar] [CrossRef]
  37. Cyrys, J.; Peters, A.; Soentgen, J.; Wichmann, H.E. Low emission zones reduce PM10 mass concentrations and diesel soot in German cities. J. Air Waste Manag. Assoc. 2014, 64, 481–487. [Google Scholar] [CrossRef]
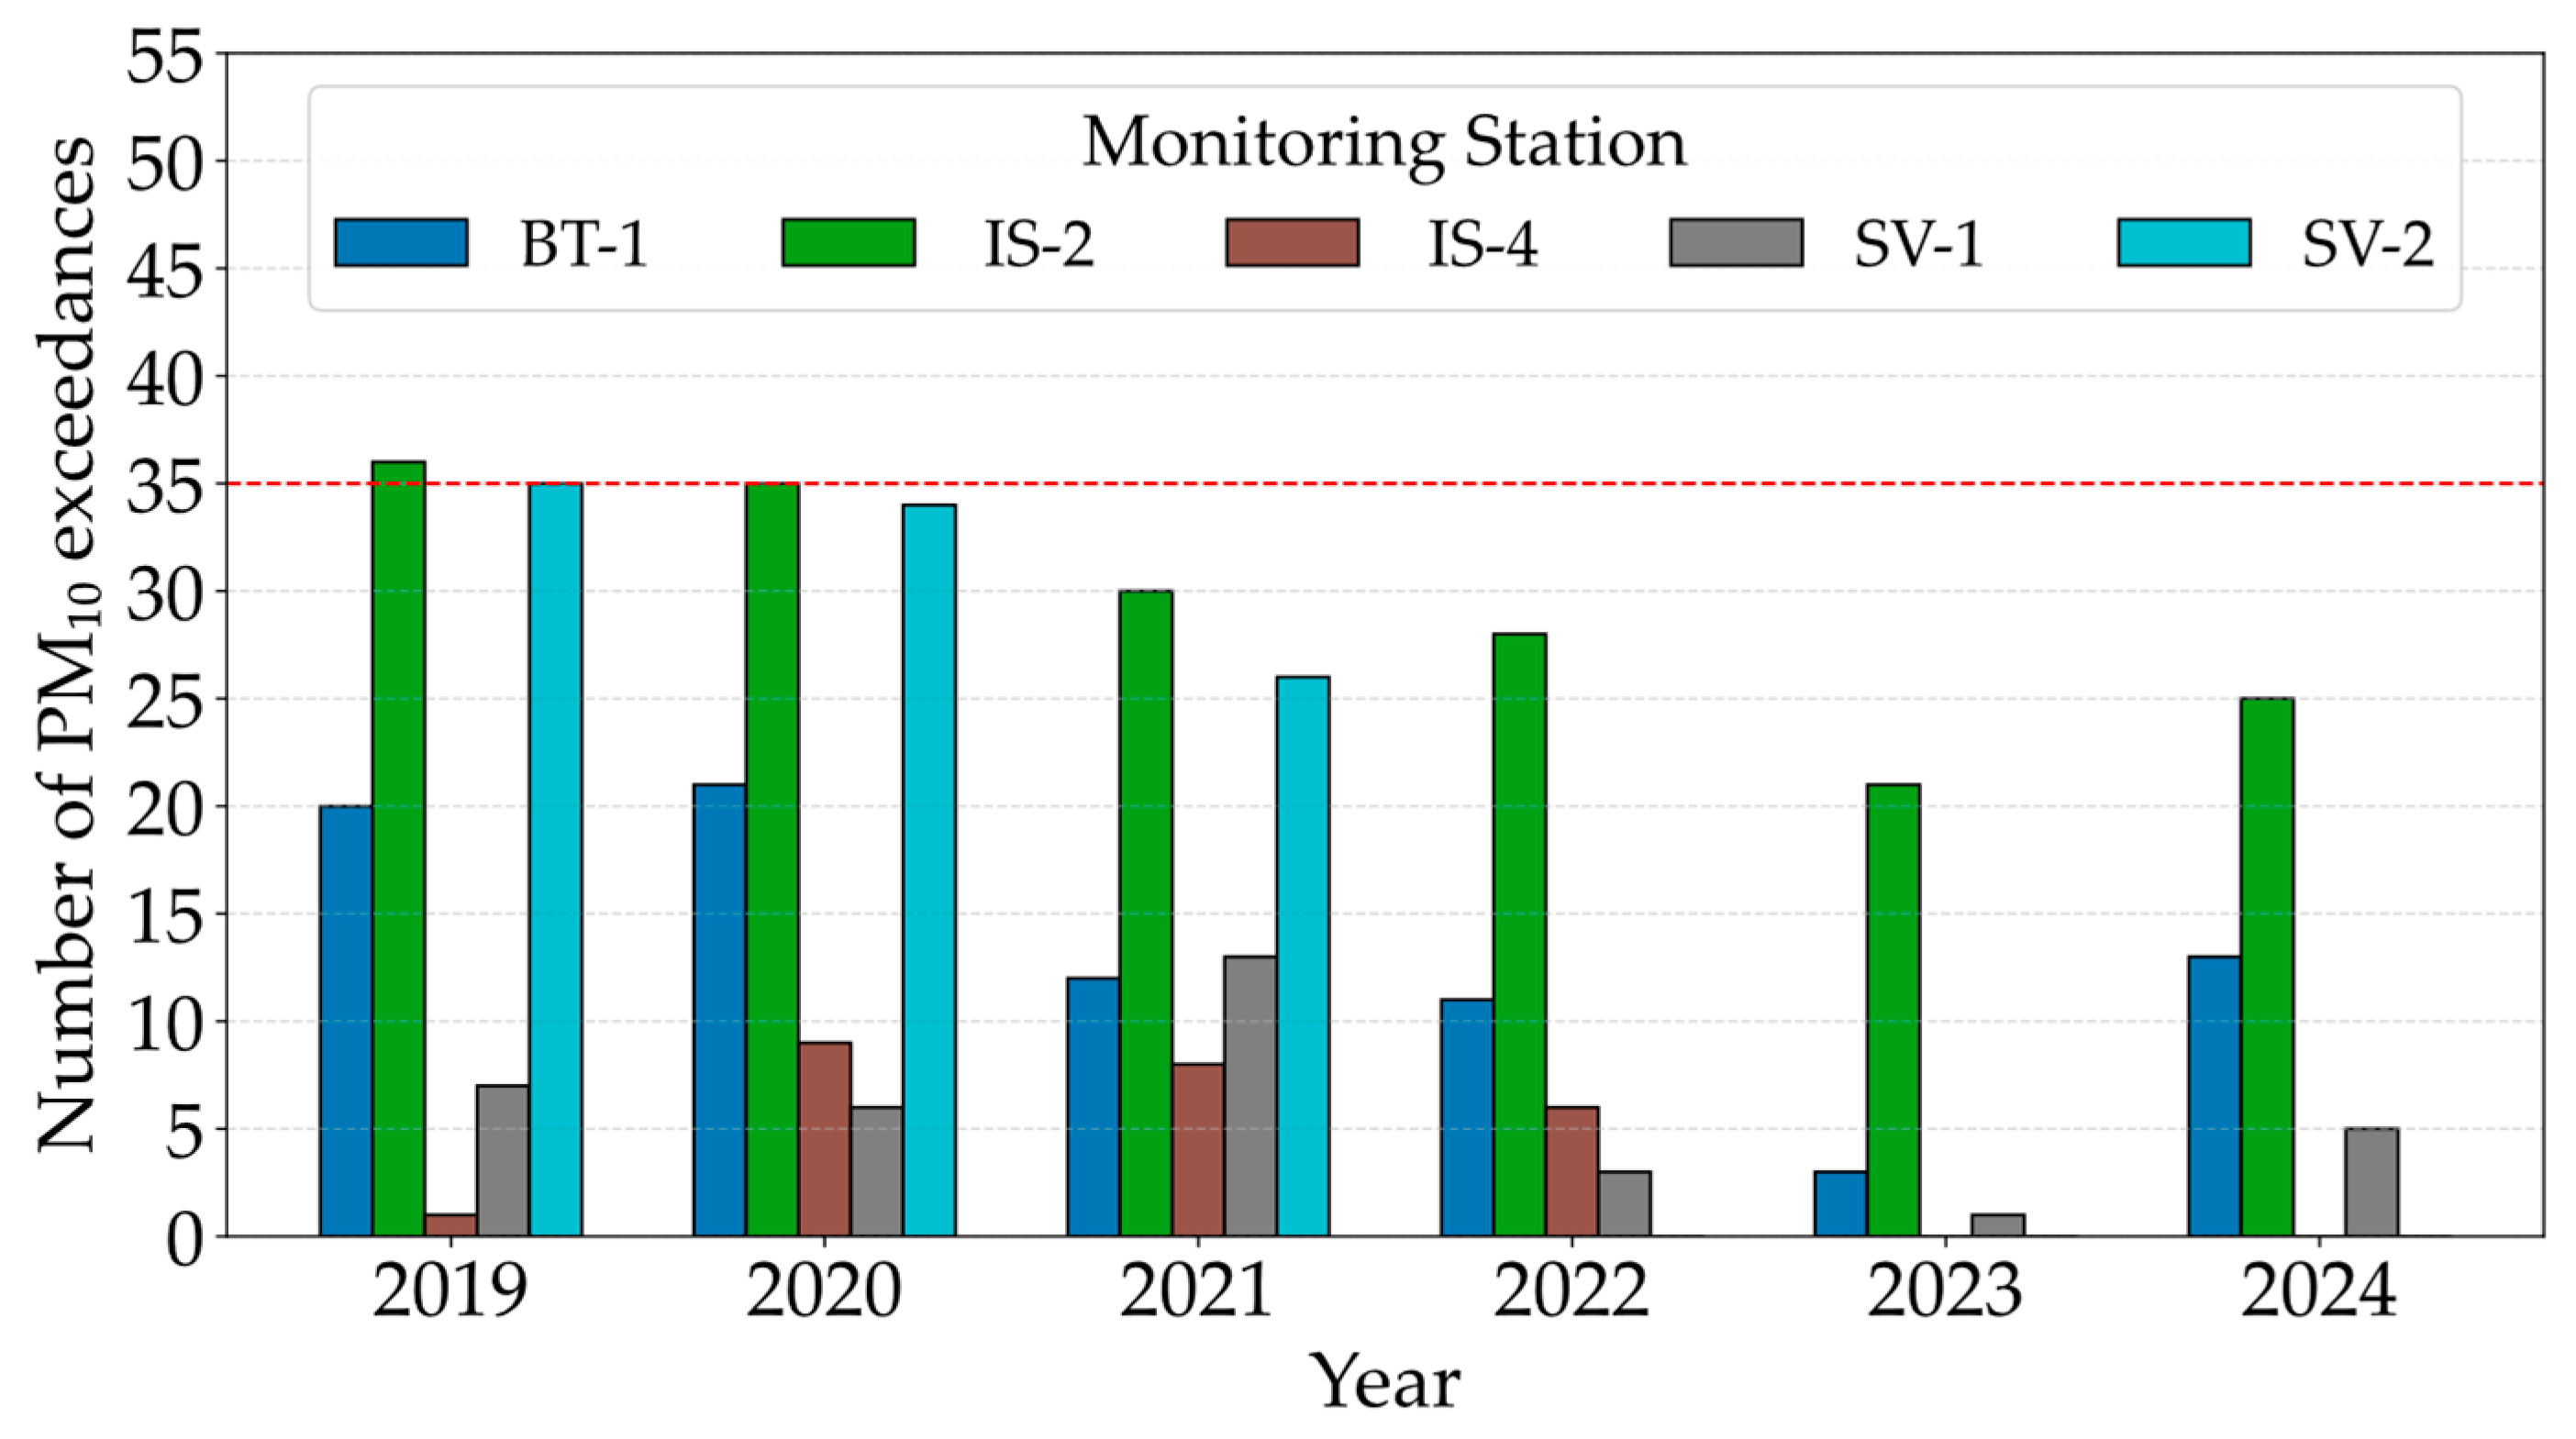
Figure 1. Annual number of PM10 daily exceedance by station. The red line indicates the Directive 2008/50/CE limit (35 exceedances/year).
Environments 12 00373 g001
Figure 2. Annual number of PM10 daily exceedance by station. The red line indicates the Directive (EU) 2024/2881 limit (18 exceedances/year).
Environments 12 00373 g002
Figure 3. Annual number of PM2.5 daily exceedances by station (2019–2024). The red line indicates the Directive (EU) 2024/2881 limit (18 exceedances/year).
Environments 12 00373 g003
Figure 4. Annual Excess Concentration PM10. (EC thresholds according to Table 4).
Environments 12 00373 g004
Figure 5. Annual Excess Concentration PM2.5. (EC thresholds according to Table 4).
Environments 12 00373 g005
Figure 6. Distribution of TLI Levels by station and year.
Environments 12 00373 g006
Figure 7. Complementarity of Excess Concentration (EC), Episode Index (EI), and Toxic Load Index (TLI) with traditional indicators.
Environments 12 00373 g007
Table 1. Comparison of Limit Values for human health protection.
PollutantAveraging
Period
Directive 2008/50/EC * Directive (EU) 2024/2881 **WHO, 2021
Recommended
Limit ValueAQG Level
PM2.5
µg/m3
Calendar year25105
1 day-25
not to be exceeded more than 18 times per calendar year
15
not to be exceeded more than 3–4 times per calendar year
PM10
µg/m3
Calendar year402015
1 day50
not to be exceeded more than 35 times per calendar year
45
not to be exceeded more than 18 times per calendar year
45
not to be exceeded more than 3–4 times per calendar year
* to be attained by 11 December 2026. ** to be attained by 1 January 2030.
Table 2. Alert thresholds and Information thresholds—Directive (EU) 2024/2881.
PollutantAveraging PeriodDirective (EU) 2024/2881
PM2.51 day50 µg/m3
PM101 day90 µg/m3
Table 3. Locations of the monitoring stations.
StationLatitudeLongitudeAltitude
SuceavaSV-147.649259° N26.249009° E376 m
SV-2 147.668825° N26.281403° E289 m
BotoșaniBT-147.739945° N26.658999° E167 m
IasiIS-247.150951° N27.581920° E42 m
IS-4 147.213306° N27.611074° E186 m
1 The SV-2 and SV-4 stations only provide daily PM10 concentration data.
Table 4. Exposure categories for annual excess concentrations (EC).
CategoryAnnual
EC (µg/m3)
PM10
Annual EC (µg/m3) PM2.5Interpretation Criteria
Low<250 <150 Less than 18 daily exceedances or low-magnitude exceedances
Moderate251–750 151–500 Frequent moderate daily exceedances, slightly above the limit value and/or occasional high daily exceedances
High751–1000501–800Frequent daily exceedances and/or high daily concentration levels
Very high>1000 >800 Severe pollution with numerous daily exceedances or extreme episodes
Table 5. Classification of pollution episode index (EI).
CategoryEI (µg/m3) PM10EI (µg/m3) PM2.5Interpretation Criteria
High1–251–252–3 consecutive days with concentrations close to 90 µg/m3 for PM10, 50 µg/m3 for PM2.5
Very high26–10026–1003–4 consecutive days with concentrations around 100–115 µg/m3 for PM10, 60–70 µg/m3 for PM2.5
Extremely high>101>101Long episodes and/or high peaks (>115 µg/m3 for PM10, >75–90 µg/m3 for PM2.5).
Table 6. Classification of daily toxic load index (TLI) for PM2.5.
CategoryTLI (µg/m3)Interpretation Criteria
No risk0PM2.5 below the daily limit value (25 µg/m3), insignificant toxic load
Low0.1–5Slight exceedance or a lower PM2.5/PM10 ratio
Moderate5.1–12Significant exceedance and a high PM2.5/PM10 ratio
High12.1–20Severe pollution episodes with toxic composition
Very high>20Critical episode, major toxicological risk
Table 7. Annual mean concentrations of PM10 compared to current and future annual limit value.
YearBT-1IS-2IS-4SV-1SV-2Directive
2008/50/EC
Directive (EU)
2024/2881
PM10
µg/m3µg/m3µg/m3µg/m3µg/m3LVLV
201927.3032.1020.2222.6032.8740 µg/m320 µg/m3
202025.1530.4320.6820.7530.51
202123.2730.7320.4722.2928.54
202221.7029.6018.3417.88-
202320.7227.1818.6218.53-
202426.2327.53-21.39-
Table 8. Annual mean concentrations of PM2.5 compared to current and future annual limit.
YearBT-1IS-2SV-1Directive
2008/50/EC
Directive (UE)
2024/2881
PM2.5
µg/m3µg/m3µg/m3LVLV
201913.34--25 µg/m310 µg/m3
2020--14.47
202113.7420.2115.14
2022-18.0212.12
2023-14.9111.23
2024-15.5013.75
Table 9. Sensitivity Analysis of Proposed Annual EC Thresholds for PM10.
ScenarioReclassificationsReclassification Details
(Station/Year)
Stability (%)
All thresholds
decrease by 10%
4BT-1(2021,2022)
IS-2 (2019), SV-2(2021)
84.62
All thresholds
decrease by 20%
7BT-1(2021,2022), IS-2 (2019, 2021, 2022) SV-1 (2021), SV-2(2021) 73.08
All thresholds
increase by 10%
1SV-2(2020) 96.15
All thresholds
increase by 20%
3SV-2(2019, 2020)
IS-2 (2021)
88.46
Only the lower threshold decreases by 10%2BT-1(2021,2022) 92.31
Only the lower threshold decreases by 20%3BT-1(2021,2022)
SV-1(2021)
88.46
Only the lower threshold increases by 10%0-100
Only the lower threshold increases by 20%0-100
Table 10. Sensitivity Analysis of Proposed Annual EC Thresholds for PM2.5.
ScenarioReclassificationsReclassification Details
(Station/Year)
Stability (%)
All thresholds decrease by 10%2SV-1(2022), IS-2 (2023)81.82
All thresholds decrease by 20%4BT-1(2019), IS-2 (2023, 2024) SV-1 (2022)63.64
All thresholds increase by 10%0-100
All thresholds increase by 20%1IS-2 (2022) 90.91
Only the lower threshold decreases by 10%1SV-1(2022) 90.91
Only the lower threshold decreases by 20%1SV-1(2022)90.91
Only the lower threshold increases by 10%0-100
Only the lower threshold increases by 20%0-100
Table 11. Episodes of PM10 pollution > 90 µg/m3, 2019–2024.
StationStart DateEnd DateDuration (Days)Mean
Exceedance
(µg/m3)
EI
(µg/m3)
EI
Classification
SV-208-01-202010-01-2020322.1166.33Very high
IS-209-01-202010-01-202026.5613.11High
SV-225-01-202028-01-202048.8935.56Very high
IS-225-01-202028-01-202046.4225.68Very high
BT-126-11-202027-11-202027.6915.37High
IS-226-11-202028-11-202038.6125.83Very high
IS-224-02-202126-02-2021323.3470.03Very high
Table 12. Episodes of PM2.5 pollution PM2.5 > 50 µg/m3, 2019–2024.
StationStart DateEnd DateDuration (Days)Mean
Exceedance
(µg/m3)
EI
(µg/m3)
EI
Classification
BT-106-12-201908-12-2019328.1284.36Very high
SV-126-01-202027-01-202024.859.7High
BT-126-11-202027-11-2020217.4534.9Very high
SV-126-11-202027-11-202025.0710.14High
SV-119-01-202120-01-202127.1514.3High
IS-223-02-202126-02-2021426.46105.82Extremely high
BT-113-11-202114-11-2021216.6433.28Very high
IS-215-03-202216-03-202228.9717.94High
IS-209-02-202311-02-2023322.5867.74Very high
IS-229-12-202330-12-202327.6115.22High
IS-206-11-202408-11-2024315.2245.66Very high
Table 13. Summary of key findings on exceedances and EC/EI classifications by city (2019–2024).
City (Station Examples)PM10
Exceedances *
PM2.5
Exceedances **
EC CategoriesEI Highlights
Iași (IS-2)Frequent (≥50 days in 2019–2021)Up to 83 days (2021)PM10–ranges from
Very High (2020) to Moderate (2022–2024)
PM2.5 ranges from Very High (2021) to Moderate (2023, 2024)
Severe episodes, including one extreme PM2.5 event
(EI = 106 µg/m3)
Suceava
(SV-2, SV-1)
Very high at SV-2 (73 days in 2019); Low at SV-1 (≤20 days in 2022–2024)Up to 37 days
SV-1 (2021)
PM10—ranges from Very High SV-2 (2019, 2020) to Low (SV-1)
PM2.5 (SV-1)—ranges from Moderate (2020, 2021, 2024) to Low (2022, 2023)
Episodic PM10 peaks at SV-2;
minor episodes at SV-1
Botoșani
(BT-1)
Moderate
(≤30 days in 2021–2024)
Up to 36 days (2019)Moderate to LowOccasional moderate PM2.5 episodes
* Exceedances—Days above 45 µg/m3 (PM10, Directive 2024/2881). ** Exceedances—Days above 25 µg/m3 (PM2.5, Directive 2024/2881).
Disclaimer/Publisher’s Note: The statements, opinions and data contained in all publications are solely those of the individual author(s) and contributor(s) and not of MDPI and/or the editor(s). MDPI and/or the editor(s) disclaim responsibility for any injury to people or property resulting from any ideas, methods, instructions or products referred to in the content.