Abstract
In recent decades, road transport has become one of the dominant factors shaping environmental conditions, with both beneficial and adverse consequences. While transport infrastructure facilitates access to essential services and supports societal well-being, vehicular emissions remain a major source of air quality degradation. Among the pollutants released, nitrogen dioxide (NO2) and fine particulate matter (PM2.5) are of particular concern due to their adverse health effects, especially in densely trafficked urban areas. Pollutant levels are determined not only by traffic intensity but also by external influences such as meteorological conditions and roadway design. This study examines how different intersection configurations affect ambient concentrations of PM10, PM2.5, and NO2. Field monitoring and dispersion modeling were carried out for a three-arm intersection and a roundabout. NO2 concentrations were quantified using a reference chemiluminescence method, while PM10 and PM2.5 were measured with an optical aerosol spectrometer. Traffic flow characteristics associated with each intersection geometry were simulated in PTV Vissim, and pollutant dispersion patterns were subsequently analyzed using the CadnaA modeling environment. Field measurements revealed lower PM concentrations (reduction in PM10, PM2.5–10 and PM2.5 concentration—30.1%, 45.1% and 22.8%) and higher NO2 concentrations (increase in NO2 concentration—143.3%) at the roundabout.
1. Introduction
Road transport, particularly its infrastructure, acts as a linear source of pollution situated at ground level, significantly contributing to environmental contamination, especially air pollution from harmful substances [1,2,3,4,5].
Although fuel combustion produces most pollutants, reducing health risks requires multiple measures since sources vary; for example, road traffic is the main source of NO2, making it a specific urban problem [1,6,7,8]. While transport also contributes to PM10 and PM2.5, local household combustion is a significant source as well, with agricultural and industrial activities further contributing to the emissions [9,10,11,12,13].
Particulate matter (PM) from motor vehicles originates from exhaust emissions and non-exhaust processes such as brake and tire wear, road surface degradation, and dust resuspension; with stricter exhaust regulations, non-exhaust sources now dominate, accounting in 2022 for about 75% of PM10 and 59% of PM2.5 from road traffic, and are projected to represent the majority of such pollution [14]. This trend is expected to intensify with the decarbonization of the transport sector and the widespread adoption of heavier vehicles, particularly those powered by batteries [15,16,17,18]. The scientific consensus underscores that non-exhaust emissions are becoming a critical source of transport-related PM and that exposure to these particles poses serious health risks [14,19,20]. PM2.5 may include not only solid particles such as organic and inorganic carbon or mineral dust but also acidic aerosol phases; CO2 can dissolve in aqueous aerosol droplets to form weak carbonic acid, although in polluted environments aerosol acidity is usually dominated by sulfates and nitrates [21,22].
In the search for solutions to reduce road emissions, we asked ourselves: “Can changing the type of intersection affect the production and dispersion of road pollutants?” Similar studies, combining field measurements and modeling of air pollution and traffic flow, have not been conducted to date. Another specific feature of this study is that it involves the same intersection but with a different structural design, where real air pollution measurements were carried out. The research in this study supports the justification for changing the intersection design from the perspective of reducing dust in a given environment and at the same time calming road traffic.
For example, a study [23] compared three solutions for a three-arm intersection—a turbo roundabout, a single-lane roundabout and a stop-controlled restricted crossing U-Turn—using microsimulation in PTV VISSIM and emission estimation based on Vehicle Specific Power. The results showed that the turbo roundabout achieved the lowest values for travel times, delays and CO2 and NOx emissions, while the stop-controlled restricted crossing U-turn was the second most advantageous alternative. On the other hand, the single-lane roundabout had the highest emissions and time losses, especially at higher traffic volumes. Some other studies have compared signalized intersections and roundabouts using modeling, with mixed results. The study [24] describes a before-and-after experimental analysis at an intersection where a traffic light-controlled intersection was replaced by a roundabout; direct measurements of emissions (CO2, NOx, CO) showed that the roundabout tends to reduce CO2 emissions, while the traffic light-controlled intersection has the advantage of lower NOx emissions. The study [25] revealed that a roundabout typically generates lower vehicle emissions than a traffic light-controlled intersection with fixed timing, with the difference in environmental impacts being considerably smaller than the difference in traffic efficiency.
The results of the study [26] show that with a suitable geometric modification of the intersection, it is possible to reduce total emissions by more than 50% in saturated traffic or with several intersections close to each other. At the three analyzed two-lane roundabouts, their replacement with a signalized or turbo-roundabout brought about a significantly more favorable situation in terms of emissions.
The authors also conducted a study [27], in which they modeled the production of noise emissions and air pollution from road traffic at a four-arm intersection and a turbo-roundabout. In this study, a reduction in noise emissions and an increase in PM10, and nitrogen oxide concentrations were observed at the turbo-roundabout.
The change in the function of the territory will create new requirements for the transport solution of transport nodes. Especially in urban environments, it is necessary to pay attention to non-motorized transport and pedestrian safety. In urban environments, the proposals include elements of traffic calming. The speed of the intersection will be reduced, and pedestrian and cyclist crossings will be designed to be safer and more visible. These impacts cause a change in the emission impacts on the territory. The emission load caused by motorized transport depends on a number of indicators, attributes, and characteristics.
According to [28], vehicle-induced pollution has become a significant source of air pollution with the accelerated development of urbanization. Since transport emissions are major contributors to greenhouse gases, they represent a key area of study within the field of transport research.
According to [29], traffic calming encompasses a range of methods to slow down cars, but not necessarily prohibit them. The benefit for pedestrians and cyclists is that cars travel at speeds that are safer and more compatible with walking and cycling. In reality, there is a kind of balance between all the ways of using the street, ensuring that no single transport mode dominates at the expense of others.
According to [30], priority control is generally used at intersections with increasing vehicle volumes. At priority intersections, the side road has either a “Give Priority” or “Stop—Give Priority” sign. In general, pedestrians must give priority when crossing intersections.
A roundabout is particularly unique in that it changes the speed of all passing vehicles. According to [31], there are three distinct speed profiles of a vehicle approaching a single-lane roundabout, covering all possible combinations of stop/no-stop conditions. In addition, vehicles are exposed to two types of stop-start cycles—short and long. Their frequency depends on the expected length of the vehicle queue.
This article deals with the impact of the conversion of a three-arm intersection into a roundabout. The intersection is located on the outskirts of the city of Žilina in Slovakia, near the Vodné dielo Žilina recreation center. The intersection mainly connects residential areas with a local recreation area. The attractiveness of the area has increased significantly over the past ten years. The presented study aimed to describe and analyze the impact of the solution of converting a three-arm intersection into a roundabout on the emission load in the area. Measurements of pollutants and traffic load were taken directly on site using a mobile air quality monitoring station (AQMS) and a traffic volume counter. The results indicate an increase in nitrogen oxide concentrations and a decrease in particulate matter concentrations at the roundabout. Partial results from field measurements were published [32], and in this study an extended approach to processing measurements in R using various functions of the OpenAir module was chosen. A parallel activity was the processing of microscopic models of the original and current traffic solutions and a comparison of traffic flow. The model confirmed the longer vehicle travel times at the roundabout. The microsimulation model was developed in the PTV Vissim program. A model of the spread of air pollution in the vicinity of both intersections was also processed in the CadnaA program as a comparison to real measurements of pollutants. The impact of changing the design of this intersection on the noise pollution of the environment was also studied in previous research [33]. As with field measurements, the model also indicated higher nitrogen oxide concentrations and lower particulate matter concentrations.
2. Materials and Methods
2.1. Study Area
The original three-arm intersection was not a high-accident location, but collisions occurred when pedestrians, cyclists, and cars interacted (Figure 1). Nearby, there were parking lots from which vehicles would exit into traffic in an uncontrolled manner, causing hazardous situations and polluting the road with dust from unpaved surfaces, which was subsequently resuspended into the air.
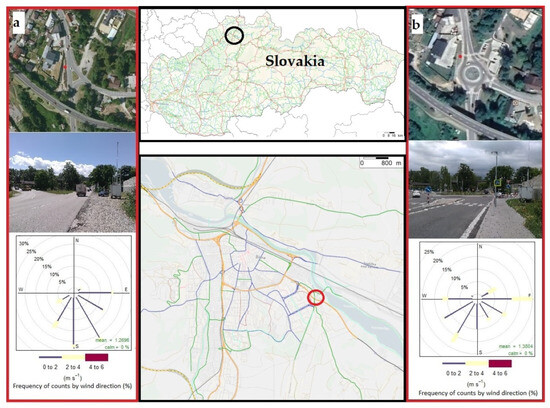
Figure 1.
Location of the investigated intersection in Žilina city, Slovakia; (a) three-arm intersection, (b) roundabout; black circle—location of Žilina city, red circle—location of intersection.
The reconstruction aimed to build a roundabout with a diameter of D = 36 m in an optimal position to ensure smooth and safe traffic while considering impacts on the population and the environment (Figure 1). The new solution was to provide a capacity-adequate and high-quality traffic node not only for car traffic but also for pedestrians and cyclists, with connections to existing businesses, residential areas and recreational areas. To safely guide pedestrians and cyclists through the intersection, dividing islands of adequate width were designed on the main approaches.
At the same time, a change in the production of pollutants is expected, as the reconstruction will affect the nature of traffic through the intersection, driving speeds and the quality of the road surface.
A mobile air quality monitoring station (AQMS) was placed next to intersections (a three-arm intersection and a roundabout) at the same location in 2016 and 2017 (49°12′49.5″ N 18°46′21.4″ E) (Figure 1). AQMS has various measurement methods for measuring pollutants. For the purpose of measuring nitrogen oxides, a standard chemiluminescence method was used, and for particulate matter, an optical method was used.
2.2. Field Measurements of Pollutants
The first measurement was carried out between 27 June and 3 July 2016 at the three-arm intersection (Pri celulózke Street and Rosinská cesta)—the original layout. The three-arm intersection is located at the interface of the industrial and recreational part of the city of Žilina, with the development of businesses and leisure facilities and services. It is located near the state road I/18 Žilina-Martin-Košice.
The second measurement was carried out between 26 June and 2 July 2017 at a roundabout—a new solution was built. The same calendar period of 2016 and 2017 was chosen for field measurements, hoping to capture the most similar external conditions for measurements. This approach proved effective, as there were no major differences in the measured meteorological parameters (see Results chapter). This is important in view of the significant seasonal variability in NOx and PM pollutant concentrations [13,34,35,36].
Nitrogen oxides and particulate matter concentrations were recorded as hourly concentrations in µg/m3.
For the measurement of nitrogen oxides, the chemiluminescent nitrogen oxide analyzer AC32M from Environnement S.A. was used. The AC32M analyzer is designed to monitor the concentrations of nitric oxide and nitrogen dioxide in ambient air. The quality of the data obtained using this method is ensured by regular calibrations of the device at intervals of one year. This method is maintained in our testing laboratory as an accredited procedure for determining nitrogen oxide concentrations in ambient air. As part of the quality management of measurements, the measurement uncertainty is regularly determined from the required monitored parameters of the device.
The Fidas® 200 S (Palas GmbH, Karlsruhe, Germany) device was used for PM measurement. The sampling system of the Fidas® 200 S device operates with a volumetric flow rate of approximately 0.3 m3/h. It allows the detection of particulate matter of various fractions PM10, PM4, PM2.5, PM1.
Although optical techniques estimate particle mass indirectly (as an equivalence method), the application of empirically derived correction factors allows for strong agreement with standard reference procedures. Data quality assurance was performed by comparison with the accredited gravimetric reference method for ambient PM10 and PM2.5 determination. The results of these parallel measurements demonstrated excellent correlations, with coefficients of r = 0.96 for PM10, r = 0.97 for PM2.5, and r = 0.93 for PM1.
The measured data were processed in the R programming environment, where a script was created for data analysis using various functions/methods: OpenAir—windRose, timeVariation, polarPlot, percentilRose.
Openair is an R package (version 4.3.2) developed for the analysis of air quality data—or more generally, atmospheric composition data. The package is widely used in academia, the public sector, and the private sector.
2.3. Air Pollution Modeling
Air pollution dispersion within the study area was simulated using the CadnaA (version 2022 MR 2) software package. This modeling tool is well established for both regional and local applications and allows for detailed assessments of emission dispersion under urban conditions. The key input parameters included the urban structure represented in the base map, building heights, wind rose data (Figure 1), road surface characteristics, and traffic survey results describing flow intensity, direction, and vehicle composition along the evaluated road segments. These inputs were derived either from direct field measurements or from verified environmental data representing actual site conditions.
Traffic flow was divided into two categories. The first group represented light goods vehicles (LGV), which included passenger cars and small commercial vehicles, and the second group represented heavy goods vehicles over 3.5 t (HGV), including trucks and buses. For the purpose of air pollution prediction, we considered the real observed traffic volume and the actual percentage share of heavy goods traffic for different time periods of the day.
Radar-based traffic counts indicated that 13,910 vehicles traversed the three-arm intersection within a 24 h period, while 15,036 vehicles passed through the roundabout on an average weekday. Traffic volume and flow direction were recorded concurrently with air quality monitoring at both intersections, and these datasets formed the basis for estimating local emission loads. The same traffic data was subsequently applied in the PTV Vissim simulations. The modeling framework utilized a three-dimensional map obtained from OpenStreetMap contributors, which provided the fundamental geometry of the intersections, surrounding buildings, vegetation, and associated infrastructure. The spatial data were then transformed into the “Krovak S-JTSK (Ferro South/West positive)” coordinate system. Each intersection was divided into homogeneous sections according to traffic flow characteristics, such as volume, speed and density, and according to road gradient (Figures S1 and S2, Table S1). Each section was assigned parameters including traffic volume, road type, flow speed, surface characteristics, traffic composition, gradient and wind rose. These parameters influence the resulting modeled pollutant concentrations in the vicinity of the roads.
The CadnaA-APL option extends the CadnaA program to include the ability to calculate, evaluate, and present the impact of air pollutants [37] and uses the AUSTAL2000 (version 2.6) calculation model developed by the German Federal Environment Agency. Road emissions are calculated based on the Handbook Emission Factors for Road Transport (HBEFA), which contains emission factors for different types of routes and traffic flows; these factors have been adjusted to provide consistent results when using CadnaA-APL with AUSTAL2000 [38]. AUSTAL2000 simulates the atmospheric dispersion of substances and odors and serves as the official reference implementation in accordance with Annex 3 of the German Air Quality Ordinance (TA Luft) [39]. The model is based on the VDI guideline 3945, part 3, which uses a Lagrangian particle model to numerically calculate the movement of trace substances in the atmosphere [40]. The concentration of NO2 is calculated indirectly through the rate of NO decomposition because NOx from road transport is mainly produced as NO and only partially as NO2, while the emission factors are always given as the sum of nitrogen oxides, which makes it possible to consider NOx as an inert compound in the calculations. Total emission factors for PM10 include emissions from combustion processes as well as wear and swirl. The modeling was based on traffic data obtained from the survey and was performed for PM10 and NOx. The model was validated using field measurements using regression analysis, which determined the coefficient of determination for NOx R2 = 0.99 and PM10 R2 = 0.98.
This study applies numerical simulations of tracer dispersion using a Lagrangian particle model. In this approach, individual particles representing a tracer substance are tracked as they are transported by the mean wind field and influenced by atmospheric turbulence. Concentration fields are derived by counting particles within defined sampling volumes and are expressed as time-averaged values over spatial grid elements. A key strength of the Lagrangian framework is its realistic representation of physical processes governing turbulent diffusion, while avoiding the problem of numerical diffusion. The method conserves mass, ensures non-zero mass densities, and can accommodate arbitrary source geometries as well as temporally variable emissions. Furthermore, the model is capable of accounting for particle sedimentation, resuspension, and both physical and linear chemical transformation processes. Required inputs include wind field data, turbulence characteristics, emission parameters, and, when necessary, additional case-specific variables. Trace substances can be present in gaseous or aerosol form. The model simulates the trajectories of a large number of gaseous and/or aerosol particles that are transported independently of each other by turbulent flow.
2.4. Traffic Microscopic Model
The microscopic model describes the behavior of an individual vehicle in response to the movement of the preceding vehicle [41]. The models simulate the details of the traffic flow and the interaction that takes place within it. Dynamic microscopic models represent variables such as the position and speed of individual vehicles. The analysis uses microsimulations in the PTV Vissim (version 2023) software, which forms part of the PTV VISION® software environment.
Two traffic models were developed for the analysis. The first traffic model (Figure 2a) was developed for the traffic solution at the three-arm intersection. The input data were obtained from the traffic survey. The second traffic model (Figure 2b) was defined based on the new state of the roundabout for the purpose of traffic calming and safe pedestrian crossing.
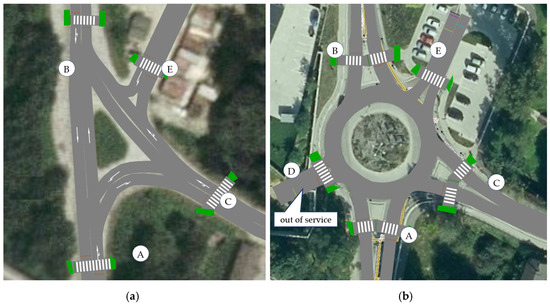
Figure 2.
Diagram of intersection arm marking: (a) with three arms; (b) roundabout (A–E—intersection arms).
For the purpose of comparing data, traffic load data from traffic surveys conducted at both the three-arm intersection and the roundabout were used (Table 1). The results can thus be compared at the same traffic load.

Table 1.
Traffic volumes (veh/h) with % of heavy traffic used in PTV Vissim.
In the case of the three-arm intersection, the direction A-B represented the main traffic flow (Figure 2a), arm E in both cases of the intersection was not used at the time of the measurements and was therefore not included in the modeling (Figure 2).
The reason for applying the micro-spatial model was the comparison of the spatio-temporal characteristics of the arms of both types of intersections at the same load [42,43,44]. Waiting time at the entrances and the course of speeds were monitored on each arm of the intersection. The model evaluated vehicle trajectory data, specifically projections of instantaneous speeds and densities along short segments of the monitored sections. Identification of the occurrence of congestion groups is based on the analysis of vehicle time intervals. The traffic flow was parameterized by spatiotemporal graphs (Figure 3). The microscopic model was defined for a total duration of 3600 s, with data from 600 s to 3600 s included in the analysis. The microscopic model was defined for a total duration of 3600 s, with data from 600 s to 3600 s included in the analysis. Data analysis was performed for 10 m road segments, with average speeds calculated over 60 s intervals.
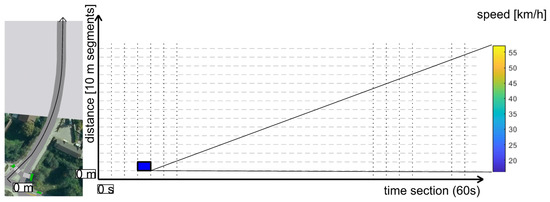
Figure 3.
Example of a time–space diagram of an intersection leg.
3. Results
Air pollutant concentrations were systematically monitored at two intersection configurations within the city of Žilina: a three-arm intersection and a roundabout, both located at the same site. The measurements focused on particulate matter in three size fractions (PM10, PM2.5, PM1) and nitrogen oxides (NO, NO2, NOx). To capture the main factors influencing pollutant variability, traffic volume was recorded as the dominant emission source, while meteorological parameters were simultaneously monitored as secondary determinants of dispersion conditions. All concentration values were calculated as averages from hourly data over a continuous seven-day period (Table 2).
Table 2.
Average values of air pollutants, meteorological conditions, and traffic volume: three-arm intersection and roundabout.
The first monitoring campaign was conducted at the three-arm intersection from 27 June to 3 July 2016, and the second campaign at the roundabout from 26 June to 2 July 2017. Both campaigns were carried out under comparable meteorological conditions, without precipitation. Minor deviations were observed in selected parameters: during the roundabout campaign, average air temperature was 0.9 °C higher, while relative humidity was 5.1% lower compared with the earlier measurement period (Table 2). Mean wind speeds were consistent, reaching 1.3 m/s (three-arm intersection) and 1.4 m/s (roundabout). Wind roses for both periods indicated distinct prevailing wind regimes: south–southeast–east winds dominated during the three-arm intersection campaign, whereas west–southwest–south–southeast–east directions prevailed at the roundabout. In both cases, prevailing winds advected traffic-related pollutants toward the AQMS (Figure 1, Table 2).
Traffic volume was simultaneously measured for each approach leg of the intersection (denoted A, B, C; Figure 2). Monitoring covered an entire week, encompassing both working days and weekends, thereby reflecting variations in traffic dynamics across different timeframes. A systematic difference was observed between the two sites: traffic volumes at the roundabout consistently exceeded those at the three-arm intersection, with an average increase of 8.1% over the monitoring period (Table 2).
The average values of nitrogen oxide concentrations were higher at the roundabout than at the three-arm intersection (by 151.2% for NO, 143.3% for NO2 and 149.4% for NOx on average) (Table 2, Figure 4).
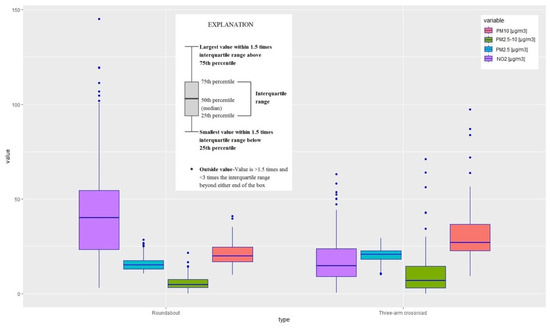
Figure 4.
Boxplot for pollutants measured at intersections in the city of Žilina.
On the other hand, a decrease in PM concentrations was observed at the roundabout compared to the three-arm intersection (by 30.1% for PM10, 22.8% for PM2.5, 45.1% for PM2.5–10 and 19.9% for PM1) (Table 2, Figure 4).
Next, the change in concentrations of pollutants PM10, PM2.5, PM2.5–10 and NO2 was assessed using R software (version 4.3.2) and various functions.
In air quality studies, analyzing the temporal variations in pollutants across hours of the day and days of the week provides valuable insights into their potential sources. Road traffic emissions, for instance, typically exhibit consistent and well-defined daily and weekly patterns. In contrast, some industrial emissions or pollutants from local combustion may have very different patterns.
The timeVariation function produces four graphs: the change in day of the week, the change in average hour of the day, and a combined hour of the day—day of the week and monthly graph. The graphs also show the 95% confidence interval on the average. The function can take into account more than one input variable. In addition, there is the possibility of “normalizing” the concentrations (or other quantities).
In the case of this study, the pollutants PM10, PM2.5, PM2.5–10 and NO2 and traffic volume were evaluated. In the case of an intersection with three arms, an increase in traffic volume was observed in the morning (7:00 a.m.) and afternoon (3:00 p.m.). Simultaneously, or with a small shift, we can observe an increase in NO2 and also in the coarse fraction of PM2.5–10 in these time periods. This trend can also be seen within the week, where traffic intensity reaches its maximum on Thursday and the maximums for the pollutants PM10, PM2.5–10 and NO2 correspond to this situation (Figure 5).
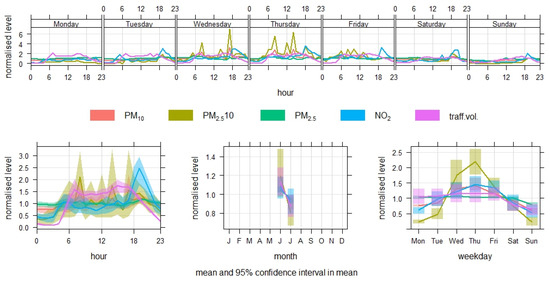
Figure 5.
Temporal variation in pollutants and traffic volume—tree-arm intersection.
In the case of the roundabout, the trend of traffic volumes during the day is similar to the previous case. That is, the traffic volume reaches its maximum during the day between 7:00 a.m. and 3:00 p.m. However, a similar pattern was observed only for NO2. Within the week, we observe a maximum on Thursday, but the pollutant maxima no longer belong to that day (Figure 6). This observation confirmed similar behavior patterns between traffic volume, NO2 and PM2.5–10 at the three-arm intersection. For the roundabout, the relationship was primarily between traffic volume and NO2.
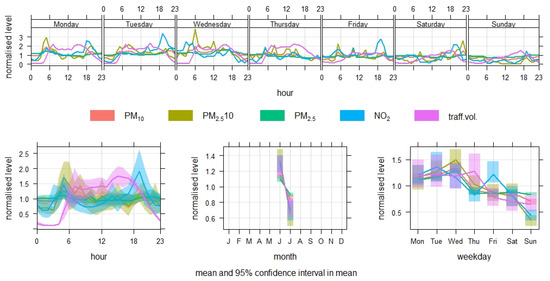
Figure 6.
Temporal variation in pollutants and traffic volume—roundabout.
The polarPlot function is used to visualize a two-dimensional polar plot of concentrations, taking into account their relationship to wind speed and direction. The result is displayed as a smooth colored surface, which is created by modeling using smoothing methods. The plots processed in this way allow a quick assessment of the possible impact of pollution sources in a given environment. In this study, polar plots were used to reveal the distribution of pollutant concentrations according to the respective directions and wind speeds. The polar plots are arranged so that differences between the three-arm intersection and the roundabout for each pollutant can be directly compared (Figure 7). In the case of the three-arm intersection and PM10, PM2.5 and PM2.5–10 particulate matter, we observe high concentrations concentrated around the measuring point and are mainly associated with lower wind speeds (<2 m/s). They also correspond to the main direction and location of the intersection in relation to the measuring point (Figure 7(a1–a3)). The distribution of NO2 concentrations in the case of the three-arm intersection is similar to that for particulate matter. The highest concentrations are concentrated around the measuring point and are associated with wind speeds < 2 m/s (Figure 7(a4)). This situation can be interpreted as the generation of pollutants by road traffic at the adjacent three-arm intersection. On the other hand, we observe a distribution of particulate matter concentrations at the roundabout, where high concentrations are no longer near the measuring station, and therefore near the intersection itself. They are more likely related to higher wind speeds > 2 m/s (Figure 7(b1–b3)). This situation can be interpreted as a decrease in particulate matter concentrations directly from the source road traffic at the roundabout and high particulate matter concentrations are more likely related to a more distant source. For the NO2 pollutant bar, the effect of the roundabout is different from that for particulate matter. On the contrary, NO2 concentrations are more strongly concentrated at the roundabout and are more than twice as high as at the three-arm intersection. NO2 concentrations are associated with low wind speeds (<2 m/s) (Figure 7(b4)). Note that different concentration scales were applied in the polar plots to better highlight high-percentile values for each pollutant (Figure 7).
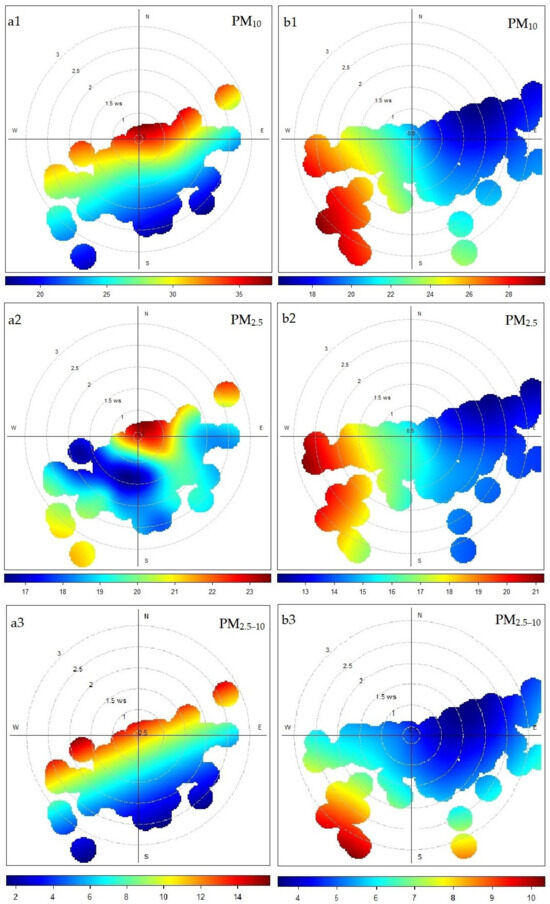
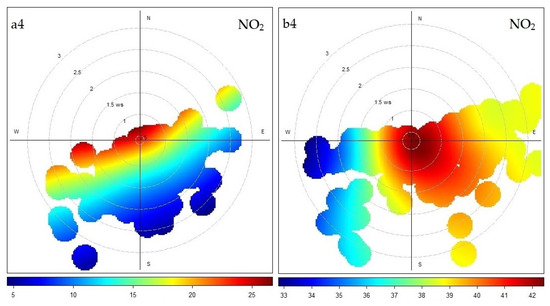
Figure 7.
Polar graphs for pollutant concentrations: tree-arm intersection (a1–a4) and roundabout (b1–b4) (color scale values in µg/m3).
Another useful analysis was performed using the percentileRose function. This function calculates and displays percentile levels of pollutant concentrations according to wind direction. One or more percentile values can be specified, which are then plotted either as solid areas or lines. By default, the data is displayed in 10° segments, which provides a detailed overview of the distribution of concentrations according to wind directions. Such visualization is extremely useful for identifying potential sources of pollution—including those that only show up at high percentile values. The use of this function is a suitable addition to the Boxplot graph (Figure 4), where we can observe high percentile values. The highest percentile values (75th–95th percentile) were observed for PM10 and PM2.5–10 from the south/southeast direction, i.e., from the direction of the three-arm intersection (Figure 8a). The black line in the graphs represents the average of the concentrations in that direction, with the largest averages observed from the southeast/south (Figure 8a). High concentrations (75th–95th percentile) of NO2 were prevalent at the three-arm intersection from the southeast direction, which is directly from the intersection (Figure 8a). In the case of the roundabout, the highest concentrations were observed from the west/southwest direction (75th–95th percentile), mainly for PM (Figure 8b). High NO2 concentrations were observed from the southeast direction of the roundabout, which corresponds to the directions of origin of concentrations at the three-arm intersection (Figure 8b), but also from the southwest direction. It is also important to draw attention to the fact of a different range of concentrations for polluting substances. The scale is smaller at the roundabout for solid particles and, conversely, larger for NO2 (Figure 8).
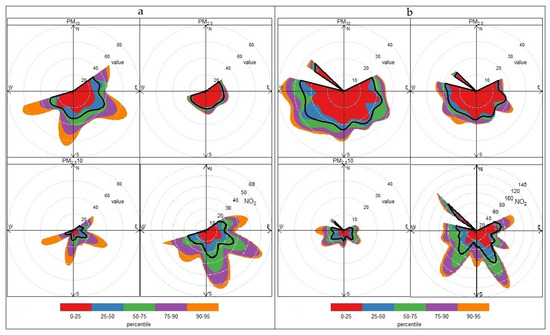
Figure 8.
PercentileRose for pollutant concentrations: (a) three-arm intersection; (b) roundabout (values in μg/m3).
To further investigate the origin of pollutant concentrations at the studied intersection, the percentileRose function was supplemented with a conditional probability function (CPF). The CPF analysis is very useful for showing which wind directions are dominant for high concentrations and gives the probability that this will happen. In Figure 9, for each pollutant, the wind directions contributing most to the highest (90th percentile) concentrations.
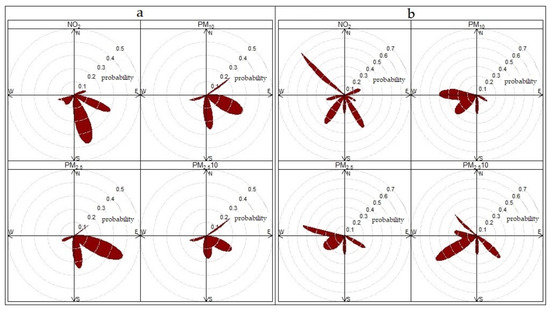
Figure 9.
CPF plot of pollutant concentrations: (a) tree-arm intersection; (b) roundabout.
In Figure 9a for the three-arm intersection case, it is clear that high concentrations (above the 90th percentile of all observations) are dominated by southeasterly wind directions. There is a very low conditional probability of these concentrations occurring for other wind directions.
High concentrations at the intersection with three arms are mainly influenced by southeasterly wind directions (in the direction from the intersection). Conversely, in the case of the roundabout, high concentrations from the west/southwest dominate, indicating a source other than road traffic at the intersection in question. Also, the probability of occurrence of these concentrations is higher than from other directions (Figure 9b). For NO2, high concentrations were also observed from the southeast, with a higher probability of occurrence (Figure 9b).
These analyses confirmed the change in the occurrence of different levels of pollutant concentrations at the roundabout compared to the three-arm intersection. The occurrence and values of PM concentrations from the direction away from the roundabout were lower and conversely, NO2 concentrations were higher.
3.1. Air Pollution Model for PM10 and NOx
Three models were created in CadnaA for PM10 (average annual concentrations, Figure 10; average daily concentrations, Figure 11) and NOx (average annual concentrations, Figure 12). The task was to observe the change in the distribution of pollutant concentrations in the vicinity of a three-arm intersection and a roundabout. In each model, a reference point was placed at the same position, which represented the location of the AQMS during field measurements. At this point, the concentration of a specific pollutant was monitored and its change with respect to the type of intersection used. For the average daily concentration of PM10 at the reference point, we observe a decrease at the roundabout by 20.80% (Figure 10). Similarly, the average annual concentration at the roundabout decreased by 18.45% (Figure 11). For the pollutant NOx, a different scenario can be observed than for PM10. The average annual concentration of NOx at the reference point increased by 52.9% at the roundabout compared to the concentration at the reference point at the three-arm intersection (Figure 12).
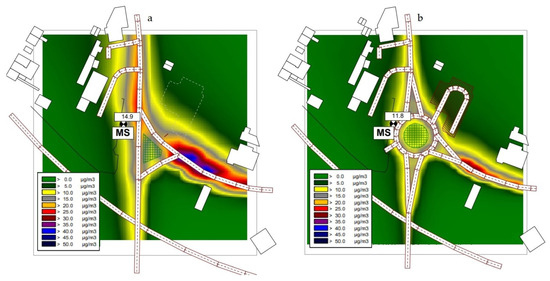
Figure 10.
Modeled dispersion of average daily concentrations of the pollutant PM10: (a) three-arm intersection; (b) roundabout.

Figure 11.
Modeled dispersion of average annual concentrations of the pollutant PM10: (a) three-arm intersection; (b) roundabout.

Figure 12.
Modeled dispersion of average annual concentrations of the pollutant NOx: (a) three-arm intersection; (b) roundabout.
3.2. Microscopic Model—Vehicle Speed and Travel Time
The microsimulation model assessed the smoothness of the traffic flow on each arm of the intersection (Video S1). The average speed of the entering vehicles was evaluated in 60 s intervals on 10 m segments. The data indicate an average speed reduction of 11% at the entrance to the roundabout, which is 6 km/h compared to the intersection with three arms. A graphical representation of the average speeds is shown in Figure 13. The horizontal axis represents the time interval of the microsimulation and the vertical axis the length of the segment. The color spectrum represents vehicle speed, ranging from 0 to 60 km/h.
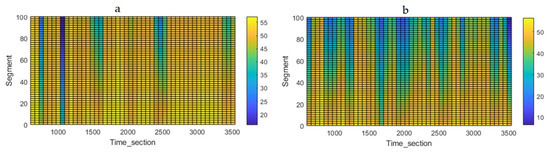
Figure 13.
Comparison of traffic flow on the approach arms: (a) three-arms intersection; (b) roundabout.
The largest increase in average travel times was recorded on the crossing from arm B towards arm C by a value of 8.6 s. The smallest increase, 2.6 s, occurred for the movement from arm A to arm C. Overall, the roundabout increased travel times by an average of 5.5 s. The results are presented in the following Figure 14.
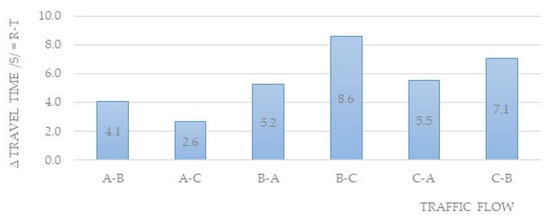
Figure 14.
Increase in travel time through a roundabout compared to a three-arm intersection in seconds.
4. Discussion
The transition from a three-arm intersection to a roundabout resulted in notable changes in pollutant emissions. The observed variation in nitrogen oxide concentrations is largely attributable to the altered geometry of the intersection. At the original three-arm intersection, vehicle speeds were higher due to the design of the main and secondary approaches, allowing vehicles on the main route to pass through without slowing. This resulted in stronger dispersion of gaseous nitrogen oxides, preventing their accumulation near the intersection. Furthermore, the lack of frequent acceleration and deceleration reduced engine load and consequently limited NOx emissions [7,45,46]. Some studies collectively underscore the complex relationship between engine load and NOx emissions, influenced by factors such as fuel type, engine design, and after-treatment systems (higher engine load → higher NOx, mainly due to higher combustion temperature and higher pressure) [47,48].
In contrast, at the roundabout, vehicles are required to slow down before entry and yield to circulating traffic. This reduces travel speeds and slightly increases crossing times (on average by 5.5 s). The additional engine workload associated with deceleration and subsequent acceleration leads to higher NO2 (NOx) emissions, while lower speeds promote a longer residence time of these pollutants in the vicinity of the intersection [7,46,49]. Some studies collectively demonstrate that aggressive acceleration is a primary contributor to increased NOx emissions, while deceleration has a minimal effect. Implementing eco-driving practices that promote smooth acceleration and braking can effectively reduce emissions and improve air quality [50,51,52].
Other processes can affect NO2 concentrations in the air. Photocatalytic processes (both natural photolysis and artificial surfaces) tend to reduce NO2 in air by breaking it down into other products [53]. However, the efficiency of NO2 removal can vary based on factors like surface area, UV light intensity, and environmental conditions. NO2 concentrations exhibit significant seasonal variability, influenced by both natural and anthropogenic factors. During colder months, increased heating and energy production lead to higher emissions, while meteorological conditions such as lower temperatures and reduced sunlight can hinder the dispersion and photolysis of NO2, resulting in elevated concentrations [34,35].
Regarding particulate matter, the coarse fraction (PM2.5–10) represented 33.6% of total PM10 at the three-arm intersection, compared to 26.3% at the roundabout. This difference is primarily reflected in the ambient concentrations of coarse particles. Measurements conducted during the summer, when coarse particle content is typically elevated, suggest that PM2.5–10 originates mainly from resuspension of road dust and material from surrounding surfaces [13,36,54,55]. These particles are generated through abrasion of vehicle components, road surfaces, and deposited mineral matter, and are re-entrained into the air as vehicles pass [12,18,56,57,58]. Notably, the coarse fraction exhibited the largest reduction at the roundabout relative to the three-arm intersection, with a decrease of 45.1%, despite higher traffic volumes at the roundabout. As part of the roundabout layout solution, the areas around the intersection were also structurally separated, which prevents uncontrolled movement of cars onto unpaved shoulders and thus reduces the resuspension of road dust.
At the three-arm intersection, vehicles traveling along the main direction maintained higher speeds, which intensified the resuspension of dust particles from the road surface [59,60]. Additionally, the surrounding areas included more unpaved surfaces, contributing to greater contamination of the roadway.
In contrast, at the roundabout, lower vehicle speeds—resulting in an average increase in travel time of 5.5 s—reduced the resuspension of road dust. The surrounding infrastructure was also upgraded, with reinforced areas such as sidewalks and parking spaces, reducing the availability of loose particulate matter. Among meteorological factors, wind speed and precipitation exert the strongest influence on particulate concentrations [61,62]. During both measurement campaigns, wind speeds and directions were comparable (difference of only 0.1 m/s; prevailing winds from southwest/south/southeast), and no precipitation occurred. These observations indicate that the conversion from a three-arm intersection to a roundabout led to a decrease in particulate matter concentrations, while nitrogen oxide levels increased.
Many other methods are already widely applied for reducing traffic-related emissions, especially vehicle emission standards, low-sulfur fuels, DPFs (diesel particulate filters), and catalytic converters. Urban planning measures like LEZs (low emissions zones), congestion charging, and improved public transport are increasingly common. Some innovations like photocatalytic pavements are still limited to pilot projects but show promise in localized NO2 reduction [63,64,65,66,67].
Roads and road transport play and will continue to play a significant role in the environment, especially in terms of the increasing number of vehicles on the road and the increasing production of non-exhaust PM emissions. Emerging contaminants, such as microplastics, are also becoming important problems in the field of air pollution near roads [15,16,68]. Therefore, it is important to address this issue already when planning road infrastructure, which can contribute to a less destructive impact of road transport on the environment and, air.
In this study, the authors did not consider background pollutant concentrations, as the main analysis was the overall change in pollutant concentrations. However, the use of additional methods to estimate background concentrations could be applicable to this or future studies of a similar type [69].
The presented study brings one possible approach not only to influencing road transport emissions but also to calming road traffic, addressing pedestrian and cyclist safety through changes to road transport infrastructure.
5. Conclusions
This study discusses the change in environmental pollution—air pollutants PM10, PM2.5–10, PM2.5 and NO2 generated by road traffic at two types of intersections—a three-arm intersection and a roundabout. The original three-arm intersection was rebuilt into a roundabout. The motivation for this study was the question of what such a change in the layout of the intersection would bring in terms of the production of pollutants from road traffic.
The results of this study point to a significant change in the construction of a roundabout instead of a three-arm intersection, which affected the nature of road traffic through the intersection and thus the formation and spread of PM10, PM2.5–10, PM2.5 and NO2 pollutants in its area:
- Converting the three-arm intersection to a roundabout significantly altered local air quality: increase in NO2 and decrease in PM10, PM2.5, PM2.5–10.
- NO2 rise was driven by lower vehicle speeds with more frequent acceleration and deceleration, increasing engine load and limiting dispersion.
- PM reductions resulted from smoother traffic, reduced resuspension of road dust, and road surface characteristics.
- The change of layout of the three-arm intersection to a roundabout resulted in a change in the way traffic passes through the intersection, reducing speed and increasing travel time.
The use of a roundabout had a significant effect in terms of lower particulate emissions compared to a three-arm junction, while roundabouts are generally characterized by higher safety for road users. However, the roundabout caused higher NOx emissions compared to a three-arm junction, which could be addressed by some other measures (for example, the use of special Photocatalytic Pavements).
Supplementary Materials
The following supporting information can be downloaded at: https://www.mdpi.com/article/10.3390/environments12100378/s1, Figure S1: Homogeneous sections at three-arm intersection used in CadnaA software; Figure S2: Homogeneous sections at roundabout used in CadnaA software; Table S1: Parameters of homogenous sections used in CadnaA software; Video S1: Microscopic model of two intersections in PTV Vissim software (video sample).
Author Contributions
Conceptualization, D.J. and M.D.; methodology, D.J. and M.D.; software, D.J. and M.D.; validation, D.J. and M.D.; formal analysis, D.J.; investigation, D.J., M.D., M.C. and M.B.; resources, D.J., M.D., M.C. and M.B.; data curation, D.J., M.D., M.C. and M.B.; writing—original draft preparation, D.J. and M.D.; writing—review and editing, M.C. and M.B.; visualization, D.J., M.D., M.C. and M.B.; supervision, D.J.; project administration, D.J.; funding acquisition, D.J. All authors have read and agreed to the published version of the manuscript.
Funding
This research received no external funding.
Data Availability Statement
The original contributions presented in this study are included in the article/Supplementary Materials. Further inquiries can be directed to the corresponding author.
Acknowledgments
The paper was supported by a VEGA 1/0337/22 grant entitled “Analysis of the influence of the pavement surface texture on skid friction, road safety, and the potential of road dust resuspension”.
Conflicts of Interest
The authors declare no conflicts of interest.
References
- EEA Air Quality Status Report 2025. Available online: https://www.eea.europa.eu/en/analysis/publications/air-quality-status-report-2025 (accessed on 8 September 2025).
- Bañuelos-Gimeno, J.; Sobrino, N.; Arce-Ruiz, R. Initial Insights into Teleworking’s Effect on Air Quality in Madrid City. Environments 2024, 11, 204. [Google Scholar] [CrossRef]
- Matara, C.; Osano, S.; Yusuf, A.; Akech, E. An Assessment of the Contribution of Vehicular Traffic to Ambient Air Quality—A Case Study of Nairobi Expressway Corridor. Civ. Environ. Eng. 2024, 20, 54–67. [Google Scholar] [CrossRef]
- Matara, C.; Osano, S.; Yusuf, A.; Akech, E. Public perceptions on exposure to traffic-related air pollution along nairobi expressway corridor. Civ. Environ. Eng. 2025, 28, 393–408. [Google Scholar] [CrossRef]
- EEA. Decarbonising Road Transport: The Role of Vehicles, Fuels and Transport Demand; Publications Office of the European Union: Luxembourg, 2022. [Google Scholar]
- Brimblecombe, P.; Chu, M.; Liu, C.H.; Fu, Y.; Wei, P.; Ning, Z. Roadside NO2/NOx and Primary NO2 from Individual Vehicles. Atmos. Environ. 2023, 295, 119562. [Google Scholar] [CrossRef]
- Krecl, P.; Harrison, R.M.; Johansson, C.; Targino, A.C.; Beddows, D.C.; Ellermann, T.; Lara, C.; Ketzel, M. Long-Term Trends in Nitrogen Oxides Concentrations and on-Road Vehicle Emission Factors in Copenhagen, London and Stockholm. Environ. Pollut. 2021, 290, 118105. [Google Scholar] [CrossRef]
- Hot, J.; Fériot, C.; Lenard, E.; Ringot, E. NOx Abatement by a TiO2-Based Coating under Real-Life Conditions and Laboratory-Scale Durability Assessment. Environments 2024, 11, 166. [Google Scholar] [CrossRef]
- Holubcik, M.; Jandacka, J.; Nosek, R.; Baranski, J. Particulate Matter Production of Small Heat Source Depending on the Bark Content in Wood Pellets. Emiss. Control Sci. Technol. 2018, 4, 33–39. [Google Scholar] [CrossRef]
- Jandacka, D.; Durcanska, D.; Nicolanska, M.; Holubcik, M. Impact of Seasonal Heating on PM10 and PM2.5 Concentrations in Sučany, Slovakia: A Temporal and Spatial Analysis. Fire 2024, 7, 150. [Google Scholar] [CrossRef]
- Renna, S.; Lunghi, J.; Granella, F.; Malpede, M.; Di Simine, D. Impacts of Agriculture on PM10 Pollution and Human Health in the Lombardy Region in Italy. Front. Environ. Sci. 2024, 12, 1369678. [Google Scholar] [CrossRef]
- Jandacka, D.; Durcanska, D.; Cibula, R. Concentration and Inorganic Elemental Analysis of Particulate Matter in a Road Tunnel Environment (Žilina, Slovakia): Contribution of Non-Exhaust Sources. Front. Environ. Sci. 2022, 10, 952577. [Google Scholar] [CrossRef]
- Jandacka, D.; Durcanska, D. Seasonal Variation, Chemical Composition, and PMF-Derived Sources Identification of Traffic-Related PM1, PM2.5, and PM2.5–10 in the Air Quality Management Region of Žilina, Slovakia. Int. J. Environ. Res. Public Health 2021, 18, 10191. [Google Scholar] [CrossRef]
- OECD. Non-Exhaust Particulate Emissions from Road Transport; OECD: Paris, France, 2020; ISBN 9789264452442. [Google Scholar]
- Giechaskiel, B.; Grigoratos, T.; Mathissen, M.; Quik, J.; Tromp, P.; Gustafsson, M.; Franco, V.; Dilara, P. Contribution of Road Vehicle Tyre Wear to Microplastics and Ambient Air Pollution. Sustainability 2024, 16, 522. [Google Scholar] [CrossRef]
- Jan Kole, P.; Löhr, A.J.; Van Belleghem, F.G.A.J.; Ragas, A.M.J. Wear and Tear of Tyres: A Stealthy Source of Microplastics in the Environment. Int. J. Environ. Res. Public Health 2017, 14, 1265. [Google Scholar] [CrossRef]
- Polukarova, M.; Gaggini, E.L.; Rødland, E.; Sokolova, E.; Bondelind, M.; Gustafsson, M.; Strömvall, A.M.; Andersson-Sköld, Y. Tyre Wear Particles and Metals in Highway Roadside Ditches: Occurrence and Potential Transport Pathways. Environ. Pollut. 2025, 372, 125971. [Google Scholar] [CrossRef] [PubMed]
- Costagliola, M.A.; Marchitto, L.; Giuzio, R.; Casadei, S.; Rossi, T.; Lixi, S.; Faedo, D. Non-Exhaust Particulate Emissions from Road Transport Vehicles. Energies 2024, 17, 4079. [Google Scholar] [CrossRef]
- Grytting, V.S.; Kirkerød, E.; Skuland, T.; Refsnes, M.; Låg, M.; Sadiktsis, I.; Gustafsson, M.; Svensson, N.; Øvrevik, J. Pro-Inflammatory Effects of Road Wear Particles and Diesel Exhaust Particles in Bronchial Epithelial Cells and Macrophages. Environ. Res. 2025, 283, 122134. [Google Scholar] [CrossRef]
- Hänninen, O.; Lehtomäki, H.; Korhonen, A.; Kokkola, T.; Hartikainen, A.; Sippula, O.; Haverinen-Shaughnessy, U.; Leviäkangas, P.; Rumrich, I.K. Health Risks Related to Air Pollution by Transport Categories and Vehicle Types: Comparison by Mortality Indicators. Environ. Int. 2025, 202, 109657. [Google Scholar] [CrossRef]
- Mansilla, G.; Barja, B.; Godoi, M.A.; Cid-Agüero, P.; Gorena, T.; Cereceda-Balic, F. Chemical Characterization of Atmospheric Aerosols in Monte Fenton, Punta Arenas, Chilean Southern Patagonia. Atmosphere 2023, 14, 1084. [Google Scholar] [CrossRef]
- Zhang, T.; Shen, Z.X.; Su, H.; Liu, S.X.; Zhou, J.M.; Zhao, Z.Z.; Wang, Q.Y.; Prévôt, A.S.H.; Cao, J.J. Effects of Aerosol Water Content on the Formation of Secondary Inorganic Aerosol during a Winter Heavy PM2.5 Pollution Episode in Xi’an, China. Atmos. Environ. 2021, 252, 118304. [Google Scholar] [CrossRef]
- Fernandes, P.; Coelho, M.C. Can Turbo-Roundabouts and Restricted Crossing U-Turn Be Effective Solutions for Urban Three-Leg Intersections? Sustain. Cities Soc. 2023, 96, 104672. [Google Scholar] [CrossRef]
- Giuffrè, T.; Canale, A. Road Intersections Design and Environmental Performances A New Operational Analysis Allowed by Traffic Microsimulation. J. Multidiscip. Eng. Sci. Technol. 2016, 3, 6050–6059. [Google Scholar]
- Gastaldi, M.; Meneguzzer, C.; Rossi, R.; Lucia, L.D.; Gecchele, G. Evaluation of Air Pollution Impacts of a Signal Control to Roundabout Conversion Using Microsimulation. Transp. Res. Procedia 2014, 3, 1031–1040. [Google Scholar] [CrossRef]
- Šarić, A.; Sulejmanović, S.; Albinović, S.; Pozder, M.; Ljevo, Ž. The Role of Intersection Geometry in Urban Air Pollution Management. Sustainability 2023, 15, 5234. [Google Scholar] [CrossRef]
- Jandacka, D.; Cingel, A.; Brna, M.; Cingel, M. Environmental benefits of turbo roundabout: A case study of noise and air pollution modelling in the village of Košťany nad Turcom, Slovakia. Civ. Environ. Eng. 2024, 20, 1303–1319. [Google Scholar] [CrossRef]
- Lyu, P.; Wang, P.; Liu, Y.; Wang, Y. Review of the Studies on Emission Evaluation Approaches for Operating Vehicles. J. Traffic Transp. Eng. (Engl. Ed.) 2021, 8, 493–509. [Google Scholar] [CrossRef]
- Hass-Klau, C. An Illustrated Guide to Traffic Calming: The Future Way of Managing Traffic; Friends of the Earth: London, UK, 1990; p. 19. [Google Scholar]
- NZ Transport Agency Waka Kotahi. Pedestrian Network Guidance-3. Design–3.5. Intersections; NZ Transport Agency Waka Kotahi: Wellington, New Zealand, 2025. Available online: https://www.nzta.govt.nz/assets/Walking-Cycling-and-Public-Transport/docs/pedestrian-network-guidance/docs/3.5-intersections-feb-2025.pdf (accessed on 13 October 2025).
- Coelho, M.C.; Farias, T.L.; Rouphail, N.M. Effect of Roundabout Operations on Pollutant Emissions. Transp. Res. D Transp. Environ. 2006, 11, 333–343. [Google Scholar] [CrossRef]
- Jandacka, D.; Durcanska, D.; Kovalova, D. Concentrations of Traffic Related Pollutants in the Vicinity of Different Types of Urban Crossroads. Commun.-Sci. Lett. Univ. Zilina 2019, 21, 49–58. [Google Scholar] [CrossRef]
- Jandacka, D.; Decky, M.; Hodasova, K.; Pisca, P.; Briliak, D. Influence of the Urban Intersection Reconstruction on the Reduction of Road Traffic Noise Pollution. Appl. Sci. 2022, 12, 8878. [Google Scholar] [CrossRef]
- Assimakopoulos, V.; Fameli, K.-M.; Šedivá, T.; Štefánik, D. The Seasonality of PM and NO2 Concentrations in Slovakia and a Comparison with Chemical-Transport Model. Atmosphere 2024, 15, 1203. [Google Scholar] [CrossRef]
- Vandeninden, B.; Devleesschauwer, B.; Otavova, M.; Vanpoucke, C.; Hooyberghs, H.; Faes, C.; Bouland, C.; De Clercq, E.M. Implications of Spatial and Seasonal Air Pollution Patterns, Socioeconomic Disparities, and 15-Minute Communities for Achieving WHO Air Quality Guidelines. Sci. Rep. 2025, 15, 13683. [Google Scholar] [CrossRef]
- Pio, C.A.; Cardoso, J.G.; Cerqueira, M.A.; Calvo, A.; Nunes, T.V.; Alves, C.A.; Custódio, D.; Almeida, S.M.; Almeida-Silva, M. Seasonal Variability of Aerosol Concentration and Size Distribution in Cape Verde Using a Continuous Aerosol Optical Spectrometer. Front. Environ. Sci. 2014, 2, 15. [Google Scholar] [CrossRef]
- DataKustik. GmbH Manual for CadnaA-Option APL-Calculation of Air Pollutants; DataKustik: Gilching, Germany, 2017. [Google Scholar]
- Janicke Consulting. AUSTAL2000 Program Documentation of Version 2.6; Janicke Consulting: Dunum, Germany, 2014. [Google Scholar]
- Federal Ministry for the Environment, Climate Action, Nature Conservation and Nuclear Safety. Technical Instructions on Air Quality Control–TA Luft; Federal Ministry for the Environment, Climate Action, Nature Conservation and Nuclear Safety: Bonn, Germany, 2002.
- Verein Deutscher Ingenieure e.V. Verein Deutscher Ingenieure Atmospheric Dispersion Models Particle Model VDI 3945 Blatt 3/Part 3; Verein Deutscher Ingenieure e.V.: Düsseldorf, Germany, 2020. [Google Scholar]
- Kumar, P.; Merzouki, R.; Ould Bouamama, B.; Haffaf, H. Microscopic Traffic Dynamics and Platoon Control Based on Bond Graph Modeling. In Proceedings of the 16th International IEEE Conference on Intelligent Transportation Systems (ITSC 2013), The Hague, The Netherlands, 6–9 October 2013; pp. 2349–2354. [Google Scholar] [CrossRef]
- Kniz, A.; Kocianova, A. Analysis in the Field of Volume-Delay Function Research. Transp. Res. Procedia 2023, 74, 1022–1029. [Google Scholar] [CrossRef]
- Jakubec, M.; Cingel, M.; Lieskovská, E.; Drliciak, M. Integrating Neural Networks for Automated Video Analysis of Traffic Flow Routing and Composition at Intersections. Sustainability 2025, 17, 2150. [Google Scholar] [CrossRef]
- Kociánová, A.; Kníž, A.; Pisca, P. Comparative analysis of traffic speed data on two-lane rural road segments: Radar technology, google maps api, and license plate recognition. Civ. Environ. Eng. 2025, 28, 698–711. [Google Scholar] [CrossRef]
- Żak, M.; Melaniuk-Wolny, E.; Widziewicz, K. The Exposure of Pedestrians, Drivers and Road Transport Passengers to Nitrogen Dioxide. Atmos. Pollut. Res. 2017, 8, 781–790. [Google Scholar] [CrossRef]
- Lozhkina, O.V.; Lozhkin, V.N. Estimation of Nitrogen Oxides Emissions from Petrol and Diesel Passenger Cars by Means of On-Board Monitoring: Effect of Vehicle Speed, Vehicle Technology, Engine Type on Emission Rates. Transp. Res. D Transp. Environ. 2016, 47, 251–264. [Google Scholar] [CrossRef]
- Ge, J.C.; Kim, J.Y.; Yoo, B.O.; Song, J.H. Effects of Engine Load and Ternary Mixture on Combustion and Emissions from a Diesel Engine Using Later Injection Timing. Sustainability 2023, 15, 1391. [Google Scholar] [CrossRef]
- Wang, F.; Zhao, J.; Li, T.; Guan, P.; Liu, S.; Wei, H.; Zhou, L. Research on NOx Emissions Testing and Optimization Strategies for Diesel Engines Under Low-Load Cycles. Atmosphere 2025, 16, 190. [Google Scholar] [CrossRef]
- Yli-Tuomi, T.; Aarnio, P.; Pirjola, L.; Mäkelä, T.; Hillamo, R.; Jantunen, M. Emissions of Fine Particles, NOx, and CO from on-Road Vehicles in Finland. Atmos. Environ. 2005, 39, 6696–6706. [Google Scholar] [CrossRef]
- Shridhar Bokare, P.; Kumar Maurya, A. Study of effect of speed, acceleration and deceleration of small petrol car on its tail pipe emission. Int. J. Traffic Transp. Eng. 2013, 3, 465–478. [Google Scholar] [CrossRef]
- Bagheri, E.; Masih-Tehrani, M.; Azadi, M.; Moosavian, A.; Sayegh, S.; Hakimollahi, M. Unveiling the Impact of Date-Specific Analytics on Vehicle Fuel Consumption and Emissions: A Case Study of Shiraz City. Heliyon 2024, 10, e36713. [Google Scholar] [CrossRef]
- Pečman, J.; Šarkan, B.; Ližbetinová, L.; Lupták, V.; Loman, M.; Bartuška, L. Impact of Acceleration Style on Vehicle Emissions and Perspectives for Improvement through Transportation Engineering Solutions. Arch. Motoryz. 2024, 104, 48–62. [Google Scholar] [CrossRef]
- Rhimi, B.; Padervand, M.; Jouini, H.; Ghasemi, S.; Bahnemann, D.W.; Wang, C. Recent Progress in NOx Photocatalytic Removal: Surface/Interface Engineering and Mechanistic Understanding. J. Environ. Chem. Eng. 2022, 10, 108566. [Google Scholar] [CrossRef]
- Alshetty, D.; Nagendra, S.M.S. Impact of Vehicular Movement on Road Dust Resuspension and Spatiotemporal Distribution of Particulate Matter during Construction Activities. Atmos. Pollut. Res. 2022, 13, 101256. [Google Scholar] [CrossRef]
- Bouh, H.A.; Bounakhla, M.; Benyaich, F.; Noack, Y.; Tahri, M.; Foudeil, S. Seasonal Variation of Mass Concentration and Chemical Composition of PM2.5 and PM10, Source Identification and Human Health Risk Assessment in Meknes City in Morocco. Aerosol. Sci. Eng. 2023, 7, 151–168. [Google Scholar] [CrossRef]
- Matthaios, V.N.; Lawrence, J.; Martins, M.A.G.; Ferguson, S.T.; Wolfson, J.M.; Harrison, R.M.; Koutrakis, P. Quantifying Factors Affecting Contributions of Roadway Exhaust and Non-Exhaust Emissions to Ambient PM10–2.5 and PM2.5–0.2 Particles. Sci. Total Environ. 2022, 835, 155368. [Google Scholar] [CrossRef]
- Svensson, N.; Lundberg, J.; Janhäll, S.; Kulovuori, S.; Gustafsson, M. Effects of a Porous Asphalt Pavement on Dust Suspension and PM10 Concentration. Transp. Res. D Transp. Environ. 2023, 123, 103921. [Google Scholar] [CrossRef]
- Casotti Rienda, I.; Alves, C.A.; Nunes, T.; Soares, M.; Amato, F.; Sánchez de la Campa, A.; Kováts, N.; Hubai, K.; Teke, G. PM10 Resuspension of Road Dust in Different Types of Parking Lots: Emissions, Chemical Characterisation and Ecotoxicity. Atmosphere 2023, 14, 305. [Google Scholar] [CrossRef]
- Gulia, S.; Goyal, P.; Goyal, S.K.; Kumar, R. Re-Suspension of Road Dust: Contribution, Assessment and Control through Dust Suppressants—A Review. Int. J. Environ. Sci. Technol. 2019, 16, 1717–1728. [Google Scholar] [CrossRef]
- Casotti Rienda, I.; Alves, C.A. Road Dust Resuspension: A Review. Atmos. Res. 2021, 261, 105740. [Google Scholar] [CrossRef]
- Yang, J.; Shi, L.; Lee, J.; Ryu, I. Spatiotemporal Prediction of Particulate Matter Concentration Based on Traffic and Meteorological Data. Transp. Res. D Transp. Environ. 2024, 127, 104070. [Google Scholar] [CrossRef]
- Bamola, S.; Goswami, G.; Dewan, S.; Goyal, I.; Agarwal, M.; Dhir, A.; Lakhani, A. Characterising Temporal Variability of PM2.5/PM10 Ratio and Its Correlation with Meteorological Variables at a Sub-Urban Site in the Taj City. Urban Clim. 2024, 53, 101763. [Google Scholar] [CrossRef]
- Ling, S.; Jin, S.; Wang, H.; Zhang, Z.; Feng, Y. Transportation Infrastructure Upgrading and Green Development Efficiency: Empirical Analysis with Double Machine Learning Method. J. Environ. Manag. 2024, 358, 120922. [Google Scholar] [CrossRef] [PubMed]
- Sekadakis, M.; Sousouni, M.I.; Garefalakis, T.; Oikonomou, M.G.; Ziakopoulos, A.; Yannis, G. Evaluating the Environmental and Safety Impacts of Eco-Driving in Urban and Highway Environments. Sustainability 2025, 17, 2762. [Google Scholar] [CrossRef]
- Khreis, H.; Sanchez, K.A.; Foster, M.; Burns, J.; Nieuwenhuijsen, M.J.; Jaikumar, R.; Ramani, T.; Zietsman, J. Urban Policy Interventions to Reduce Traffic-Related Emissions and Air Pollution: A Systematic Evidence Map. Environ. Int. 2023, 172, 107805. [Google Scholar] [CrossRef]
- Šimaitis, J.; Lupton, R.; Vagg, C.; Butnar, I.; Sacchi, R.; Allen, S. Battery Electric Vehicles Show the Lowest Carbon Footprints among Passenger Cars across 1.5–3.0 °C Energy Decarbonisation Pathways. Commun. Earth Environ. 2025, 6, 476. [Google Scholar] [CrossRef]
- Smit, R.; Ayala, A.; Kadijk, G.; Buekenhoudt, P. Excess Pollution from Vehicles—A Review and Outlook on Emission Controls, Testing, Malfunctions, Tampering, and Cheating. Sustainability 2025, 17, 5362. [Google Scholar] [CrossRef]
- Seo, J.H.; Shin, Y.; Song, I.-g.; Lim, J.; Ok, Y.S.; Weon, S. Atmospheric Microplastics: Challenges in Site- and Target-Specific Measurements. TrAC Trends Anal. Chem. 2024, 178, 117859. [Google Scholar] [CrossRef]
- Draper, E.L.; Whyatt, J.D.; Taylor, R.S.; Metcalfe, S.E. Estimating background concentrations of PM2.5 for urban air quality modelling in a data poor environment. Atmos. Environ. 2023, 314, 120107. [Google Scholar] [CrossRef]
Disclaimer/Publisher’s Note: The statements, opinions and data contained in all publications are solely those of the individual author(s) and contributor(s) and not of MDPI and/or the editor(s). MDPI and/or the editor(s) disclaim responsibility for any injury to people or property resulting from any ideas, methods, instructions or products referred to in the content. |
© 2025 by the authors. Licensee MDPI, Basel, Switzerland. This article is an open access article distributed under the terms and conditions of the Creative Commons Attribution (CC BY) license (https://creativecommons.org/licenses/by/4.0/).