Article

Distribution, Characterization and Risk Assessment of Microplastics in Two Rivers in West Central Scotland: The Black Cart Water and White Cart Water

by
Daniel E. Enenche
,
Christine M. Davidson
*,
Walter B. Osungbemiro
and
John J. Liggat
Department of Pure and Applied Chemistry, University of Strathclyde, 295 Cathedral Street, Glasgow G1 1XL, UK
*
Author to whom correspondence should be addressed.
Environments 2025, 12(10), 342; https://doi.org/10.3390/environments12100342
Submission received: 22 August 2025 / Revised: 19 September 2025 / Accepted: 22 September 2025 / Published: 25 September 2025
(This article belongs to the Special Issue Editorial Board Members’ Collection Series: Plastic Contamination)

Abstract

Improved understanding of the behaviour of microplastics in freshwater systems is important as rivers are major conduits for the transport of particles from land to sea. This study investigated microplastics in two tributaries of the River Clyde, Scotland, UK, that flow through rural, suburban and urban areas. Surface water and sediment were obtained from 25 locations in the Black Cart Water and White Cart Water. Microplastics were isolated and characterized by digital microscopy and ATR-FTIR spectroscopy. Particles were found in four water samples, all from the White Cart. Sediment analysis revealed microplastic abundance ranging from 300 to 600 items/kg in the Black Cart and 33.3 to 567 items/kg in the White Cart. Fragments were the most common particle type and white/transparent the most common particle colour. The most common polymers in the Black Cart were PP > PET > PS > PVC > PTFE and in the White Cart PE > PP > PTFE > PET > PA. Identification of some microplastics was challenging because their FTIR spectra did not correspond well to reference spectra of pure polymers. Although the polymer hazard index at some locations was high due to the presence of particles composed of PVC and PA, the ecological risk from microplastics in the Cart river system was generally low.

1. Introduction

Plastic wastes have become a global issue, with concerns over their accumulation in the aquatic environment and potential ecological and health risks [1]. In 2015, about 80 million metric tonnes (Mt) of generated plastic waste was reportedly mismanaged globally, and this number is projected to reach over 213 million Mt by 2060 [2]. Plastic debris becomes even more of a concern when it breaks down in the environment by physical, chemical, and biological processes into microplastics [3].
Microplastics are plastic particles less than 5 mm in diameter [4]. They exist in the form of fragments, fibres, films, foams and pellets [5], depending on their source and whether they are primary microplastics (deliberately manufactured in this size range) or secondary microplastics (derived from larger items of plastic waste). Their small sizes make them readily ingestible by marine organisms. They can then be transferred through the food chain [6], leading to ill-health effects in higher animals, including digestive disorders, inflammatory bowel disease, neurological symptoms and a decline in cardiovascular health [7]. They also act as vectors for chemical substances, including persistent organic pollutants and potentially toxic elements (PTE), which are easily adsorbed on their surfaces and transported [8].
Microplastics have become ubiquitous in the environment but much is still unknown about their biogeochemical cycles [9]. Numerous factors, both social and environmental, influence their distribution and abundance. These include human population density, industrial activities, urbanisation, water currents and circulation patterns, wind patterns, and water and sediment composition [10]. Understanding how these factors together affect the types and numbers of plastic particles found in different compartments of the environment is challenging. However, this information is required to assess the environmental and human health impacts of plastic pollution and inform the development of appropriate remediation strategies.
Early research on microplastics in the aquatic environment mainly focused on marine systems, but more attention has recently been paid to freshwater. Small rivers and tributaries have been identified as major conduits transporting microplastics to larger rivers and, hence, the marine environment. Indeed, they are suggested often to contribute more microplastics than main river channels [11,12,13]. Key factors affecting the input of microplastics to small rivers are the types of activities occurring within their catchments. Once in the waterbody, hydrodynamic factors such as water flow rate (which is in turn affected by meteorological conditions such as rainfall events), impoundments such as dams, and sediment characteristics all influence the balance between microplastics deposition and resuspension.
To improve understanding of the complex interplay of factors affecting the concentrations, distribution and fate of microplastics in freshwater environments, several recent studies have featured river systems that flow through multiple settlements or areas with different land uses. Some researchers have considered entire river catchments, sampling not only from the main channel but also from smaller tributaries to assess the accumulation and transport of particles downstream [14,15,16,17]. Others have focused on rural–urban gradients, sampling along the length of a river as it flows from (usually relatively uncontaminated) upstream regions through centres of population [18,19,20]. Further studies have investigated trans-urban rivers, with particular reference to the impact of different types of land-use, e.g., industrial vs. residential areas [11,21,22,23]. Sediment microplastic concentrations in selected studies of these types are shown in Table 1.
It can be seen that microplastic abundance varies widely from a few tens of items per kg in some studies to tens of thousands of items per kg in others. Numerous polymers have been identified, although polyethylene (PE) and polypropylene (PP) are common. Whilst direct comparison between studies must be carried out with caution since they were performed at different points in time and used different sampling regimes and analytical procedures (in particular density separation reagent and organic matter digestion procedure), urbanisation was consistently identified as a major source of microplastic pollution [12,16,24,25,26]. Further research is therefore required to provide a more detailed understanding of the influence of the urban environment on microplastics in river systems, considering both diffuse and point inputs. Wastewater treatment plants and stormwater runoff are of particular interest as they play a dual role—both contributing to and mitigating microplastic pollution—depending on treatment efficiency and local hydrological conditions.
The current study adopted a recently proposed harmonised extraction protocol [27] to study microplastics in sediments of two small neighbouring rivers in West Central Scotland. Both pass through a mixture of land-use types but one—the Black Cart Water—is predominantly rural whilst the other—the White Cart Water—is predominantly urban. The goals were to assess the influence of land-use and wastewater assets on microplastic types and concentration, and to determine if particles were present at levels sufficient to constitute ecological risks.
Table 1. Selected studies on microplastics in river sediments between 2020 and 2025.
Study AreaDensity Separation ReagentOrganic
Matter Removal
Abundance
(Items/kg)
Polymers Found
Yongjiang River, Nanning City, South China [28]NaCl/NaIFenton’s reagent90–550PA, PE, PET, PP, PS
Ganga River, India [16]NaClFenton’s reagent17–36Cellophane, PE, PEs, PP, PS, PVC
River Tame, Northwest England UK [26]NaINone24–138,400 PA, PET, PS, styrene acrylonitrile
Red River Delta, Vietnam [29]NaClH2O21450–56,000EVA, PE, PET, PP
Yamaguchi Prefecture, Japan [22]ZnCl2Fenton’s reagent8–1010PE, PP, PS, PVC
Selangor River Basin, Malaysia [25]ZnCl2H2O210–55LDPE, PE, PET, PP, PS, PVC
Ganges River Basin, Bangladesh [30]ZnCl2H2O22950–4010Cellulose, PA, PE, PET, PP, PS, PVC
Kamniška Bistrica (KB) and Ljubljanica, Slovenia [19]NaClFenton’s reagent5–40PA, PE, PET, PS, PU
Liangfeng River, Guilin City, China [31]NaClH2O210,300–82,900PA, PE, PP, PS, PVC
Mahanadi River, India [18]NaClFenton’s reagent49–354PA, PE, Pes, PVC, PP, PS
Nanming River, Guiyang, China [21]NaClH2O21000–5500PE, PEG, PP, PVAc, PVM/MA
River Jinjiang, China [32]NaClFenton’s reagent21–924PE, PET, PP, PS, rayon
Wei River, China [17]CaCl2H2O2120–840PE, PET, PP, PS, PVC
Nanming River, Guizhou China [33]NaCl, NaIKOH:NaClO870–7500EVA, PC, PE, PVC
Yitong River, China [34]NaClH2O2300–850PE, PET, PP, PS
River Kelvin, Glasgow, Scotland [11]NaClH2O250–244PE, PP
Jungnang Stream, South Korea [12]ZnCl2Fenton’s reagent820–8060Cellophane, PE, PP
Wolf River, Memphis, Tennessee, USA [23]ZnCl2H2O2250–3000Acrylic, PE, PET, PP,
PU, PVA, PVC
Mahaweli River, Sri-Lanka [15]NaClH2O23.1–247 PE, PET, PS, PU
Chichiriviche de la Costa, Venezuela [20]NaClKOH:H2O210–150EPDM, PA, PE, PET, PP, PVA
EPDM—ethylene-propylene-diene monomer rubber; EVA—ethylene-vinyl acetate; LDPE—low-density polyethylene; PA—polyamide; PC—polycarbonate; PE—polyethylene; PEG—poly(ethylene glycol); PEs—polyester; PET—poly(ethylene terephthalate); PMMA—poly(methyl methacrylate); PP—polypropylene; PS—polystyrene; PU—polyurethane; PVA—poly(vinyl alcohol); PVAc—poly(vinyl acetate); PVC—poly(vinyl chloride); PVM//MA—poly(methyl vinyl ether/maleic anhydride).

2. Materials and Methods

2.1. Study Area

As shown in Figure 1, the Black Cart Water and White Cart Water are two rivers in West Central Scotland that converge and enter the River Clyde from the south, approximately 10 km west of Glasgow City Centre. The Black Cart Water is a slow-moving water body that rises at Castle Semple Loch and flows north-eastwards for approximately 19 km until its convergence with the White Cart Water, passing through farmland, and close to the village of Howwood and the towns of Johnstone and Linwood, as well as Glasgow International Airport. It has a significant industrial history. In the 18th and 19th centuries, it powered at least 50 mills—mainly cotton mills—and water-driven industries along its banks [35]. The White Cart Water rises on Eaglesham Moor and flows for approximately 35 km, passing through various Glasgow suburbs, across a large urban green space (Pollock Country Park) then through the major industrial town of Paisley. It too was crucial in the development of Glasgow and its environs from the late 1600s to early 1800s. The water powered various mills including paper mills, snuff mills, and bleachfields [36]. Additionally, unlike the Black Cart, the White Cart was navigable from the Clyde up to Paisley. It is a fast-flowing river, prone to flooding, with water levels rising by as much as 6 m [37].
Following the decline of heavy industry in West Central Scotland during the 20th century, the Black Cart and White Cart are no longer industrial rivers. In the 21st century, the riverbanks serve mainly as habitats for wildlife and locations for recreational activities such as walking and fishing. A few point sources remain, the most notable of which is Laighpark Wastewater Treatment Works, just upstream of sampling point WC2 on the White Cart Water. Other Scottish Water utilities such as combined sewer overflows are located at various points on both rivers, e.g., upstream of BC4 on the Black Cart Water [38]. Combined sewer overflows are a means to manage excess surface water during episodes of heavy rainfall by combining stormwater runoff with untreated (or partially treated) sewage, which often contains microplastics, and releasing the mixture into nearby waterbodies.

2.2. Sample Collection

Samples were collected from 25 locations (Figure 1). Seven were from the Black Cart Water (BC), fifteen from the White Cart Water (WC), one from downstream of the confluence of the two rivers (Cart Waters, CW) and two from major tributaries feeding into the Cart river system (the River Gryfe, RG, and the Levern Water, LW). Sampling was conducted in the summer of 2024 when weather conditions were mostly dry and water levels were low, making it easy to collect samples of shallow submerged sediment for analysis. Waterborne microplastics were collected using a stainless-steel trawling net (dimensions 32 × 40 cm, mesh aperture 0.32 mm). The net was held so that its top was just below the surface of the river and 20 L of water (calculated based on an estimation of the river flow rate at each site) was allowed to pass through. Collected material was backflushed from the net with distilled water through a 0.35 mm aperture stainless steel sieve. The residue trapped by the sieve was transferred to an aluminium foil container for return to the laboratory. For sediments, an Ekman grab sampler or metal trowel was used to collect material to a depth of 5–10 cm. At each location, sediment was obtained from five points, then combined and homogenised in a metal bucket to make a bulk composite sample, which was transferred to an aluminium foil container for return to the laboratory.
The most prominent land-use features of the sampling locations are given in Table 2.

2.3. Pre-Treatment and Extraction of Microplastics

On return to the laboratory, the sediments, and any particles recovered from the surface waters, were air-dried in aluminium foil trays then sieved through a 5 mm stainless steel sieve before being stored in aluminium foil containers for further assessment. Microplastics from water samples were readily visible and recovered without further processing. The dried sediments were extracted (10 g test portions, n = 3) using the method reported by Enenche et al. [27], i.e., CaCl2 (100 mL) for density flotation and Fenton’s reagent (30 mL at room temperature for 24 h) for organic matter removal. The isolated microplastics were collected on glass fibre membrane filters using vacuum filtration.

2.4. Microplastic Observation and Identification

The isolated microplastics were viewed and photographed using a digital microscope (Bysamee, Shenzhen, Guangdong, China) set at a typical magnification of 10×. The abundance of microplastics in items/kg (dry weight) and items/m3 was obtained by multiplying the count for each sample by a factor of 100 for sediments (since 10 g test portions were processed) and 50 for water (since 20 L samples were analysed).
Over 70% of the microplastics isolated were large enough for the polymer type to be identified by ATR-FTIR spectroscopy. This was performed using a Nicolet IS5 spectrometer (Thermo Scientific, Loughborough, UK) equipped with a Specac Golden Gate diamond ATR accessory (Specac Ltd., Orpington, UK). Each spectrum was acquired from sixty-four scans over the range of 4000–600 cm−1 at a resolution of 4 cm−1. Error corrections for the spectra were achieved by baseline and background corrections, with a new background collected every ninety minutes. Boxcar apodization was employed, and the instrument’s in-built OMNIC (version 9.9.509) software was used to process the spectra. A preliminary identification of microplastic types was made by comparing the spectra obtained from samples to reference spectra from the polymer database of Hummel & Aldrich [39]. A careful visual inspection of all microplastics and their associated spectra was also carried out to confirm the polymer identity proposed by the database, as described in Section 3.2.2.

2.5. Contamination and Risk Evaluation of Microplastics

2.5.1. Contamination Factor

The contamination factor (CF) can be utilized to assess the pollution level of the environment. Although originally proposed for pollutants such as PTE, it has been applied in microplastics studies in recent years [30]. The CF was calculated using Equation (1).
C F = C i C o
where Ci denotes the microplastic concentration at a sampling site and Co represents the baseline microplastic concentration. Selection of an appropriate baseline value can be challenging even for PTE, and this is even more problematic for microplastics since they are wholly synthetic pollutants with no ‘natural’ background concentration. Previous workers have used the lowest (non-zero) mean microplastic concentration found in their study areas as a baseline value [30,40,41] and the same approach was adopted here. The baseline value used in the current study was 33.3 items/kg, obtained at both WC3 and WC5. The use of an identical value for both rivers allowed comparisons to be drawn between them. Contamination levels are designated low where 0 < CF < 1, moderate where 1 < CF < 3, high where 3 < CF < 6 and very high where CF > 6.

2.5.2. Pollution Load Index

The pollution load index (PLI) is another metric originally developed for pollutants such as heavy metals, where it is used to assess the severity of contamination by multiple PTEs at the same site. In the current study, it was used to compare microplastic pollution in the Black and White Cart Waters overall, by calculating a PLIzone value for each river using Equation (2).
P L I z o n e = C F 1 × C F 2 × C F 3 × C F n n
where ‘n’ is the total number of sampling points [30].
A PLIzone value < 1 indicates that pollution levels are low, whilst values >1 indicate there may be cause for concern warranting further investigation [42].

2.5.3. Polymer Hazard Index

The polymer hazard index (PHI) was used to assess the potential health impact of microplastics identified in the study by considering not only particle abundances but also the types of polymers found. The PHI was calculated using Equation (3) [43].
P H I = P n × S n
where Pn represents the percentage abundance of each polymer at each site and Sn is the hazard score of each polymer. The scores used were those proposed by Lithner et al. [44] based on a hazard ranking model that considered the hazard classifications of the monomers making up each polymer. Hazard is divided into five categories: category 1 (PHI < 10); category II (PHI 10–100); category III (PHI 101–1000); category IV (PHI 1001–10,000); and category V (PHI > 10,000). In the current study, a hazard score of 1 was assigned to unidentified polymers and those that were not assigned scores by Lithner et al. [44].

2.5.4. Potential Ecological Risk Index

The potential ecological risk index (PERI) was used to evaluate the risk associated with the microplastics found. It was calculated by multiplying the toxicity response Tr (Equation (4)) by the contamination factor Cf as given in Equation (5) [45].
T r = n = 1 n P n C i × S n
P E R I = T r × C f
The PERI is interpreted in terms of risk categories: category 1 (PERI < 150); category II (PERI 150–300); category III (PERI 301–600); category IV (PERI 601–1200); and category V (PERI > 1200).

2.6. Statistical Analysis

The data obtained were analysed using Microsoft Excel (Office 365) and IBM-SPSS (version 26). The microplastics’ concentrations are presented as mean ± one standard deviation (n = 3 unless otherwise stated). Comparison of mean concentrations between locations was performed by one-way ANOVA at 95% confidence limit, with values considered statistically significant when the p-value was <0.05.

2.7. Quality Control and Contamination Avoidance

To avoid contamination of environmental samples with laboratory-derived microplastics, nitrile gloves and 100% cotton laboratory coats were worn. A blank of distilled water was kept open in the analysis area during sample processing to detect any airborne inputs (most likely of fibres). Samples were covered with aluminium foil when left standing during density separation. Filter papers containing microplastics were kept in covered glass Petri dishes to prevent cross contamination or loss. Control plastics of commercial origin were used to test the operation of the ATR-FTIR instrument and to check the spectrum-matching capabilities of the equipment and software.

3. Results and Discussion

3.1. Surface Water

No microplastics were found in the surface water samples from the Black Cart Water. Samples from only four locations in the White Cart Water contained microplastics (see Table 3) and the abundances were low (2–4 particles per 20 L sample, equivalent to 100–200 items/m3).
The absence of microplastics in the waters of the Black Cart could be due to limited input immediately preceding the time of sampling or effective sedimentation processes. The presence of microplastics at specific points on the White Cart likely reflects localised sources. For example, input from the Blacksey Burn may be responsible for the microplastics detected at site WC6. This tributary is known to be impacted by both PTE [46] and persistent organic pollutants [47] and so may also be a source of microplastics. General anthropogenic and recreational activities may explain the presence of microplastics at sites WC12 and WC13, which are located in densely populated residential areas with nearby children’s playgrounds. Recreational activities could also be the source of the particles at WC9.
The estimated surface velocity of the rivers ranged from 0.12 to 0.50 m/s, depending on sampling location, which is considered low to moderate [48,49]. The site with the lowest flow rate (WC6) had the highest particle concentration. Reduced water movement creates conditions that promote the accumulation of microplastics in a river since they are less likely to be easily carried off [50].
The microplastic concentration was comparable to that reported in studies of semi-urban areas in Taiwan (0–230 items/m3) [51] and southwestern Germany (0–215 item/m3) [52], but lower than values for the Yangtze River, China (4137 items/m3) [53], and urban watersheds in Texas, USA (520 items/m3) [54]. The larger mesh size of the trawling net used in the current study (320 µm) and in Taiwan and Germany (both 300 µm), compared to nets used for the Yangtze (32 µm) and in Texas (53 µm), may be partially responsible for the different abundances, as smaller mesh sizes are more effective at trapping microplastics [55]. It also meant that any microplastics smaller than 320 µm were not collected, which may explain the low abundances observed, although an approximately 300 µm mesh size is commonly used for river sampling of microplastics, which is why it was chosen for the current study [56]. Fragments were the most abundant type, followed by fibres, with film at one location. Fragments typically form from breakdown of household and commodity plastics and enter water systems from urban runoff, whilst fibres are present in household sewage and wastewater effluents from laundry and other activities that involve synthetic fabrics [54]. Two separate studies on the River Thames [57,58] and another of streams in New Zealand [59] reported fragments and fibres as dominant microplastic shapes in surface water. The colours (white, blue, green, red and black) found are common in household plastic products, and similar to results reported elsewhere [58,60].
The microplastics identified were predominantly PP (48%) and PE (27%). These polymers are widely used due to their cost-effectiveness, excellent mechanical properties and chemical resistance. Additionally, their densities (0.970 g/cm3 for PE and 0.920 g/cm3 for PP) are lower than that of water (1 g/cm3), allowing them to float and be easily transported in river systems. Low density also means that they are easily carried from land to water by wind action [61]. Previous studies have also reported PE and PP as dominant microplastics found in freshwaters [51,58,60,62].

3.2. Sediments

3.2.1. Microplastic Abundance

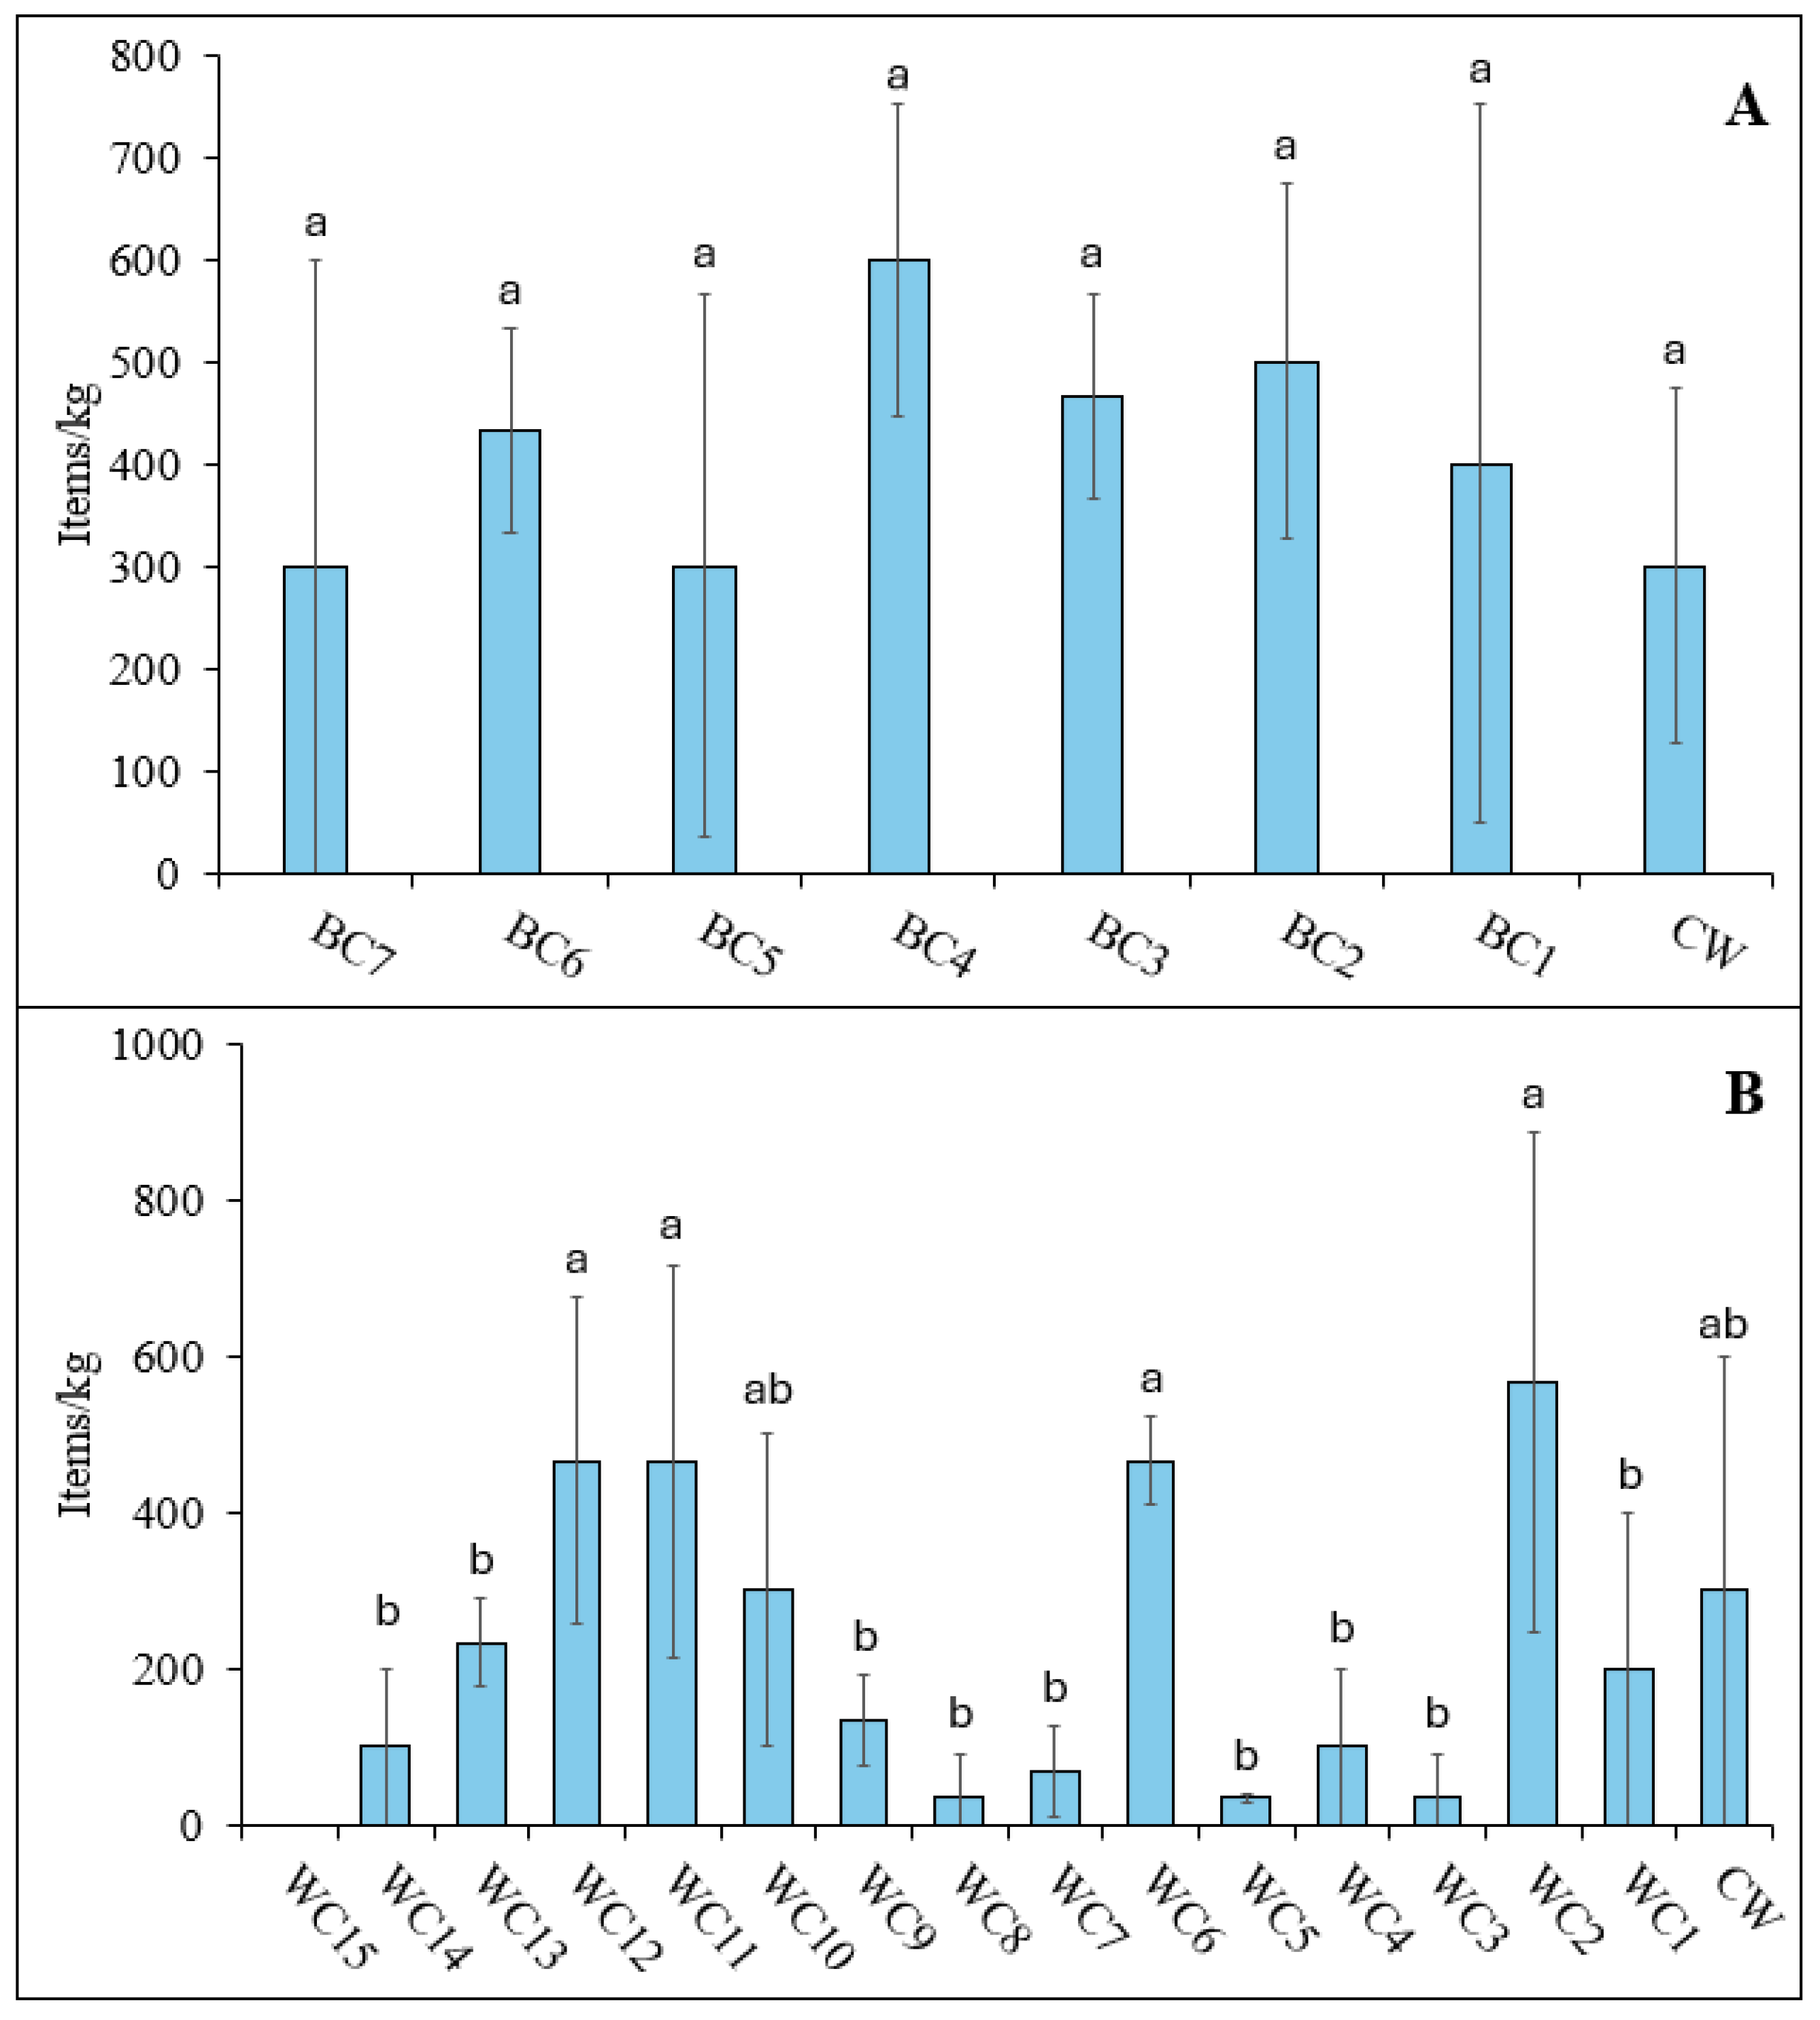
The mean concentrations of microplastics found in sediments sampled from the Black Cart Water and White Cart Water are given in Figure 2.
The microplastic concentration in the Black Cart sediments ranged from 300 ± 170 to 600 ± 100 items/kg (Figure 2A). The highest value was obtained at site BC4. This lies downstream of two combined sewer overflows, which are potential sources of microplastics during flood episodes. However, no statistically significant difference (p < 0.05) was found in the microplastic concentrations across all sampled locations including the combined Cart Water sediment. Neither were microplastics found in the sediment sample from the River Gryfe, suggesting that it may not be a major source of plastic input.
With the exception of site WC15, where no particles were found, the microplastic concentrations in the White Cart sediments ranged from 33.3 ± 5.8 to 567 ± 321 items/kg (Figure 2B). The lowest number of particles was observed in the headwaters, with levels generally increasing as the river flows through residential suburbs, decreasing again in the middle stretches where there is more greenspace (with the exception of site WC6) before increasing again in the final 2 km before joining the Black Cart Water. Sampling sites could be divided into two groups. Sites WC2 (567 ± 321 items/kg), WC6 (466 ± 58), WC11 (467 ± 252 items/kg) and WC12 (467 ± 208 items/kg) contained significantly larger amounts of microplastics (p < 0.05) than sites WC1, WC3, WC4, WC5, WC7, WC8, WC9, WC13, WC14 and WC15, which were less contaminated (highest value 233 ± 57.7 items/kg). Sediments from the Cart Waters and WC10 sites contained intermediate levels of particles that were statistically similar to both groups. The higher value at site WC2 may be due to its proximity to the Laighpark Wastewater Treatment Works, which serves almost 250,000 people in Paisley and the surrounding area. Wastewater treatment plants are widely reported to release microplastics to receiving waters [26]. Another location that showed elevated microplastic abundance was site WC6. This is downstream of the junction with the Levern Water, but the number of particles found in sediment from that waterbody (66.6 ± 57.7 items/kg) was not enough to explain the high concentration observed. As discussed for water samples, a more likely source may be the Blacksey Burn. Site WC6 also had the lowest water flow rate (0.12 m/s) which may have promoted the accumulation of particles in sediment [50]. Locations WC11 and WC12 both lie within areas of high residential population density, which can contribute many different types of plastic waste to the local environment, from vehicle tyre wear particles to discarded food wrappers.
Broadly similar concentrations of microplastics have been reported in sediments of the River Kelvin, which is also a tributary of the River Clyde. Shokunbi et al. [11] reported that abundance increased from 50.0 ± 17.3 items/kg in the upper reaches of the Kelvin to 244 ± 19.2 items/kg close to the point where it joins the Clyde, whilst Blair et al. [63] found 161–432 items/kg at an urban site close to the river mouth. Considerably higher concentrations have been reported in the River Clyde itself, e.g., 50,000 items/kg [64] indicating that accumulation from multiple sources, including the smaller rivers in the Clyde catchment, occurs.
Similar microplastic concentrations have been found in freshwater systems elsewhere in the UK that pass through areas with different combinations of rural, semi-urban and urban land use, including the River Thames (181–660 items/kg) [60] and the River Tame (20–350 items/kg) [65]. Studies from other parts of the world have also reported comparable findings, e.g., the River Antua in Portugal (100–629 items/kg) [24] and the Bloukrans River system in South Africa (13–563 items/kg) [66], although higher microplastic concentrations have been found in the Wen-Rui Tang River in China (32,947 items/kg) [67], Nigerian inland rivers (up to 2200 items/kg) [68], the Ganges River Basin in Bangladesh (2950–4010 items/kg) [30], and the Red River Delta in Vietnam (1450–56,000 items/kg) [29].
Microplastics were obtained from too few water samples to allow meaningful statistical comparison to be made between concentrations in water and in sediment, though it was noted that two of the locations where waterborne plastics were recovered also had relatively high levels of microplastic in their sediment.
The maximum microplastic concentrations found in the Black Cart Water (600 ± 100 items/kg) and White Cart Water (567 ± 321 items/kg) were similar, which is perhaps surprising given that the catchment of the former is more rural and agricultural whereas that of the latter is more urban and industrial/residential. The levels of microplastics in the Black Cart Water were relatively similar across sampled locations, whereas those in the White Cart were more variable, possibly due to a greater diversity of inputs and abundance of point (as opposed to diffuse) sources.

3.2.2. Identification of Microplastics by ATR-FTIR

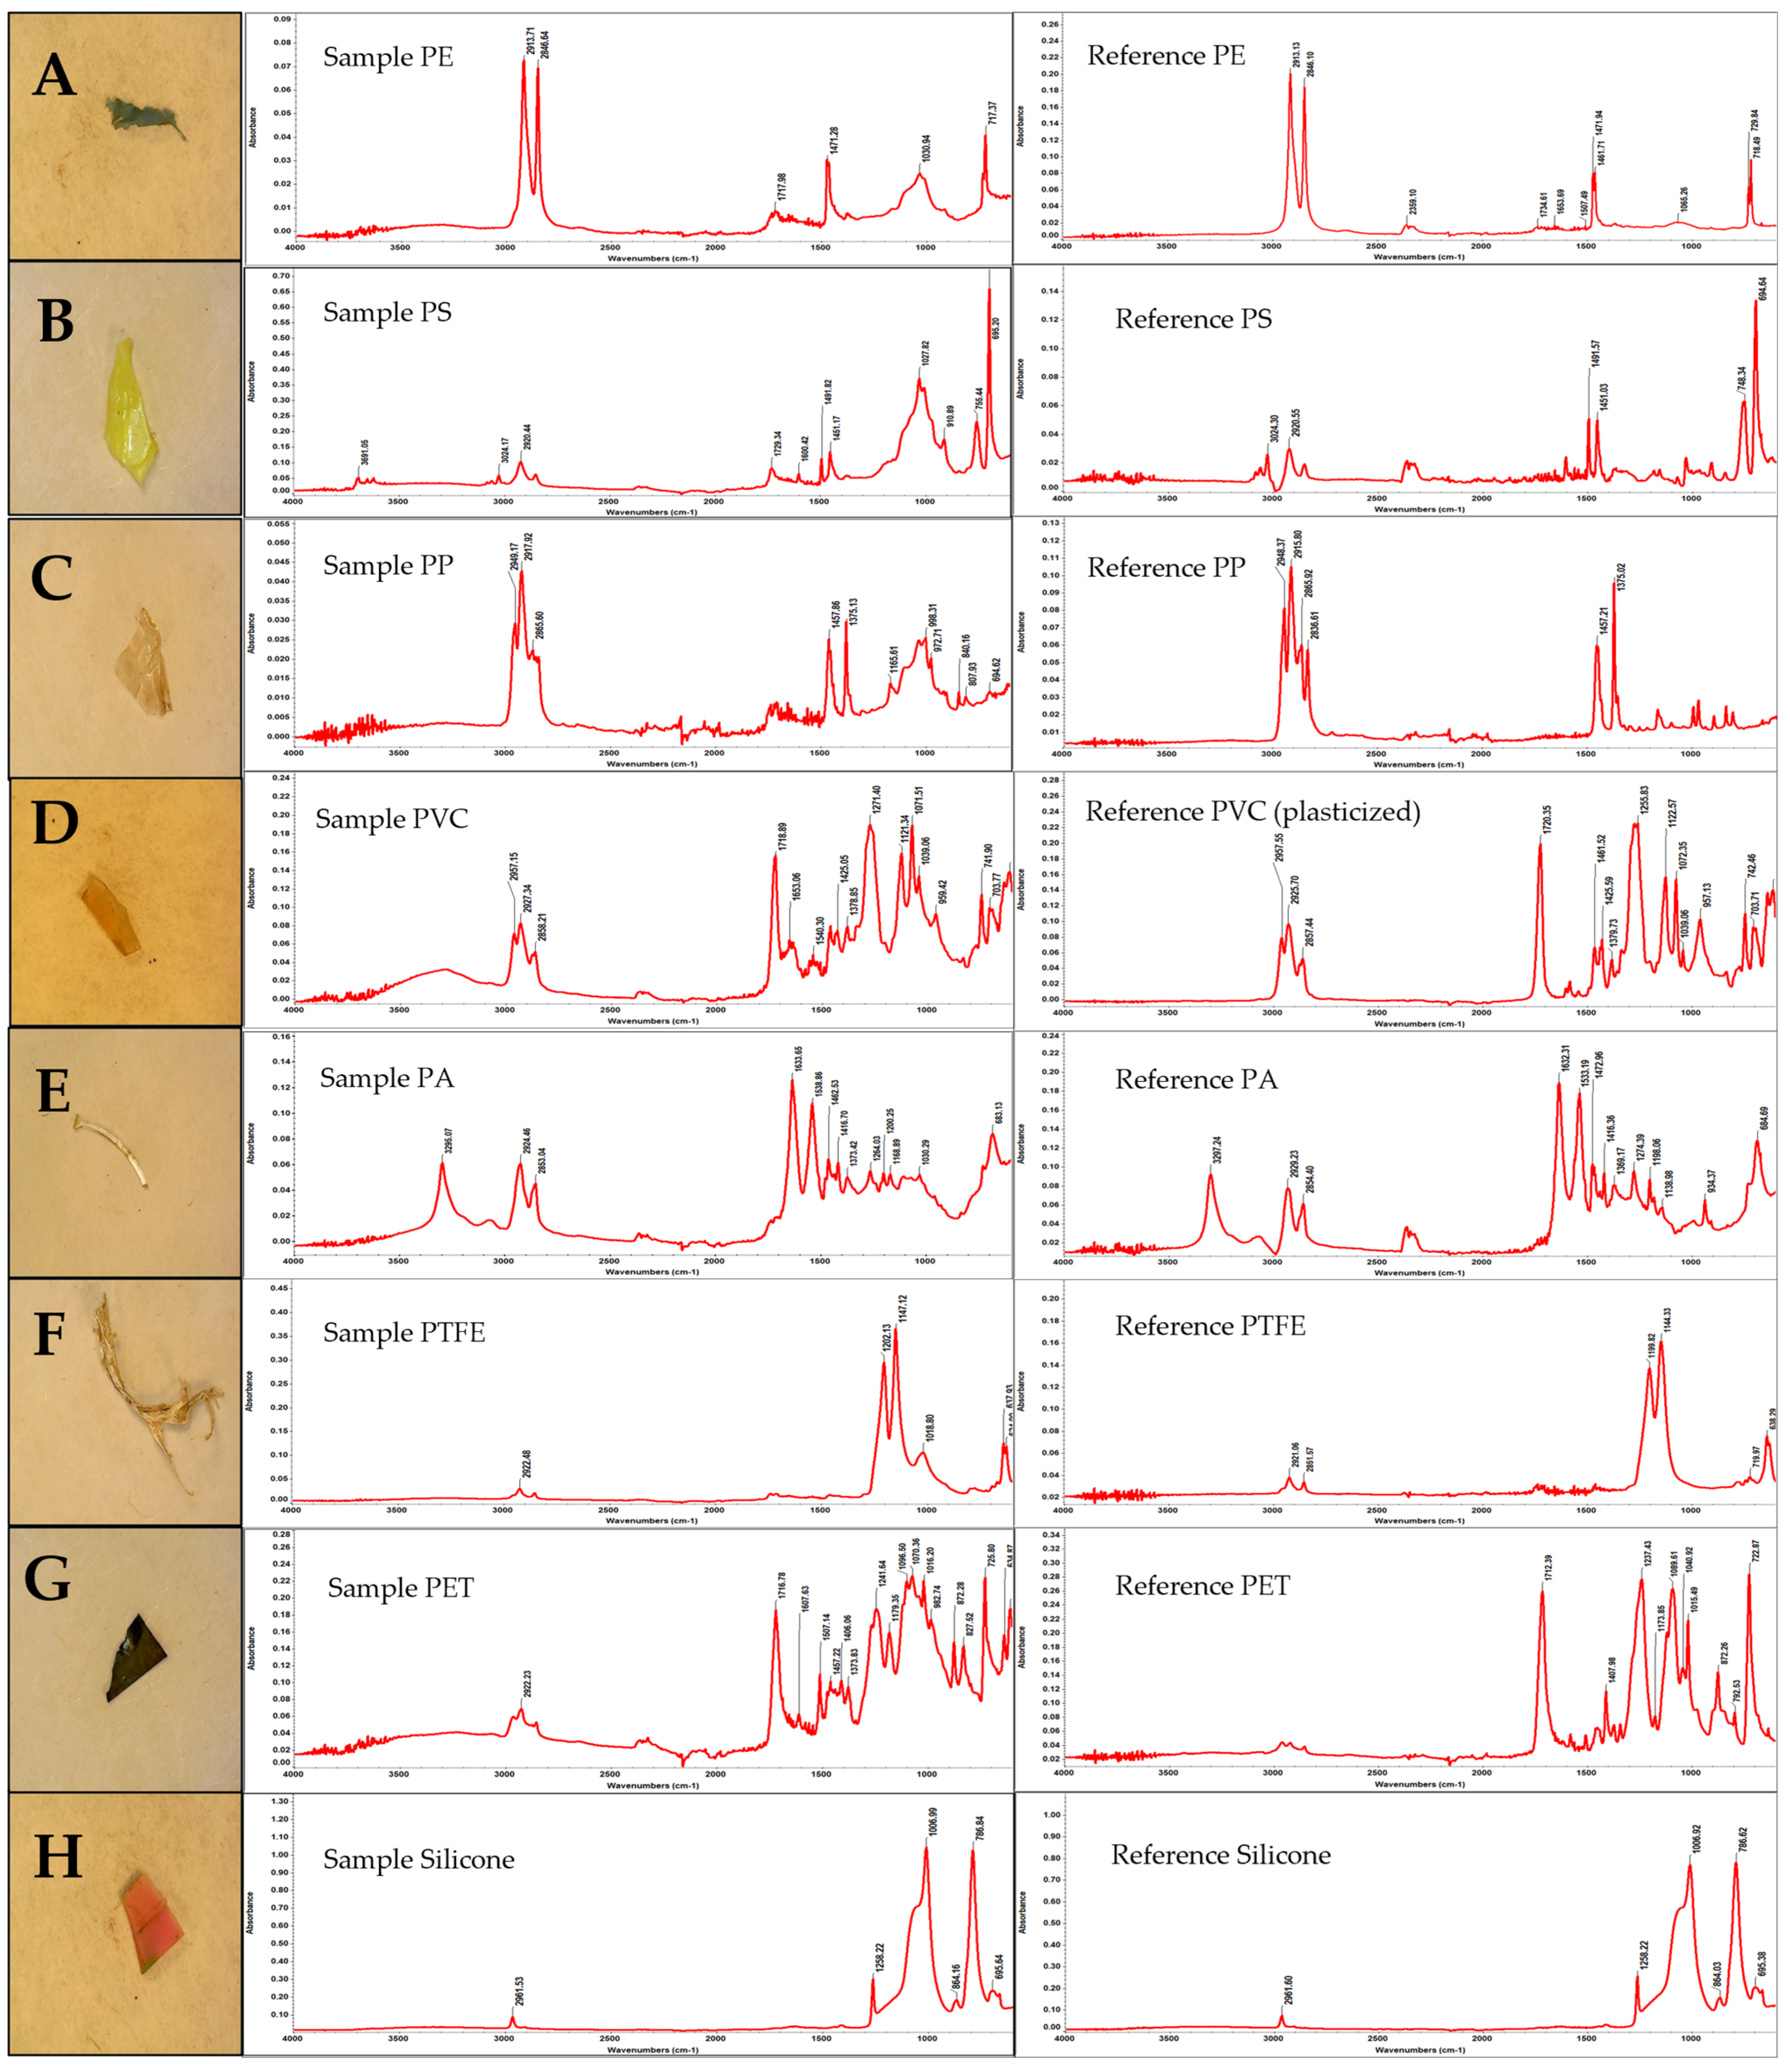
Analysis of microplastics recovered from the Black and White Cart Water sediments revealed the presence of a variety of polymers including PE, polystyrene (PS), PP, poly(vinylchloride) (PVC), polyamide (PA), poly(tetrafluoroethylene) (PTFE), poly(ethylene terephthalate) (PET) and silicone (Figure 3) (detailed images and spectra of most of the identified microplastics are presented in Supplementary Figure S1). Some of the microplastics were easily identified (see for example Figure 3F,H) with spectra that closely matched those of the corresponding pure polymers and showed sharp, well-defined peaks with minimal background interference. However, many of the microplastics produced spectra that contained additional peaks (not present in spectra of the pure polymers) and broad, sometimes weak, bands.
This highlights a key challenge in the identification of microplastic polymer type. Plastics recovered from the environment are usually derived from manufactured goods, which typically contain additives such as colourants, fillers, plasticisers and stabilizers as well as the base polymer. These substances can be present at high concentrations—for example PVC typically contains up to 50 wt% plasticizer [69]—which can shift peak positions, introduce new peaks, or mask characteristic ones [70]. Once in the environment, weathering processes cause the composition—and hence the FTIR spectra—of microplastics to deviate further from those of pure polymers. For example, oxidative degradation and moisture uptake will enhance carbonyl (C = O) and hydroxyl (O–H) stretching peaks [71], as seen near 3300 cm−1 in Figure 3A,D. Finally, even after samples have undergone density separation and digestion, some residual organic matter or biofilm may remain. The broad feature observed in several of the sample spectra in Figure 3 around 1000–1030 cm−1 is consistent with biofilm, which typically shows broad peaks in the 950–1200 cm−1 region [72].
A consequence of the above is that the polymer identifications suggested by in-built or online FTIR spectral libraries may be misleading. This is illustrated in Figure 4 which shows the image and spectrum of a particle recovered in the current study. This was identified by the instrument as cellophane (i.e., this was the polymer with the highest match probability). However, the material is a rigid plastic fragment, whereas cellophane forms flexible films. Also, the spectrum (Figure 4A) does not resemble that of a known sample of cellophane (Figure 4B).
This underscores the importance of complementing the outputs of automated spectral matching algorithms with manual interpretation, where relevant expertise is available, to ensure accurate identification of microplastics. In the current study, characteristic peaks were selected and used as a benchmark for the presence of a specific polymer. The CH2 asymmetric and symmetric stretching peaks at ~2915 and ~2849 cm−1, respectively, were used to confirm PE; aromatic C-H bending at ~695 cm−1 and ~755 cm−1 for PS; the quartet of CH2 and CH3 peaks between 2950 cm−1−2870 cm−1 and CH3 bending at ~1375 cm−1 for PP; the C–Cl stretching at ~610 cm−1 for PVC; the N–H stretching at ~3300 cm−1 and ~1540 cm−1 for PA; and the ~1717 cm−1 C=O stretching and substituted aromatic C–H stretch at ~721 cm−1 for PET. These remain distinguishable despite spectral interferences and thus serve as a molecular fingerprint. Also, reference spectra of pure polymers were run on the ATR-FTIR spectrometer to further confirm the identified polymers. This is important because many spectral databases contain transmission spectra, which can differ markedly from those obtained by ATR (specifically, ATR instruments enhance peaks at lower wavenumbers relative to transmission instruments) [73].

3.2.3. Characteristics of Isolated Microplastics

The microplastics isolated from the Black Cart Water and White Cart Water sediments ranged from 0.1 to 5 mm in size, with most in the ≤1 mm fraction. Similar studies [11,27] have reported that particles ≤ 1 mm are the most common in freshwater sediments. Three major shapes were identified—fragments, films and fibres—with many particles showing signs of abrasions and markings consistent with weathering. All of the above suggest that environmental degradation of plastic debris is a major contributor to the material found [43]. Details of the microplastics recovered from each water system are discussed below.
Black Cart Water
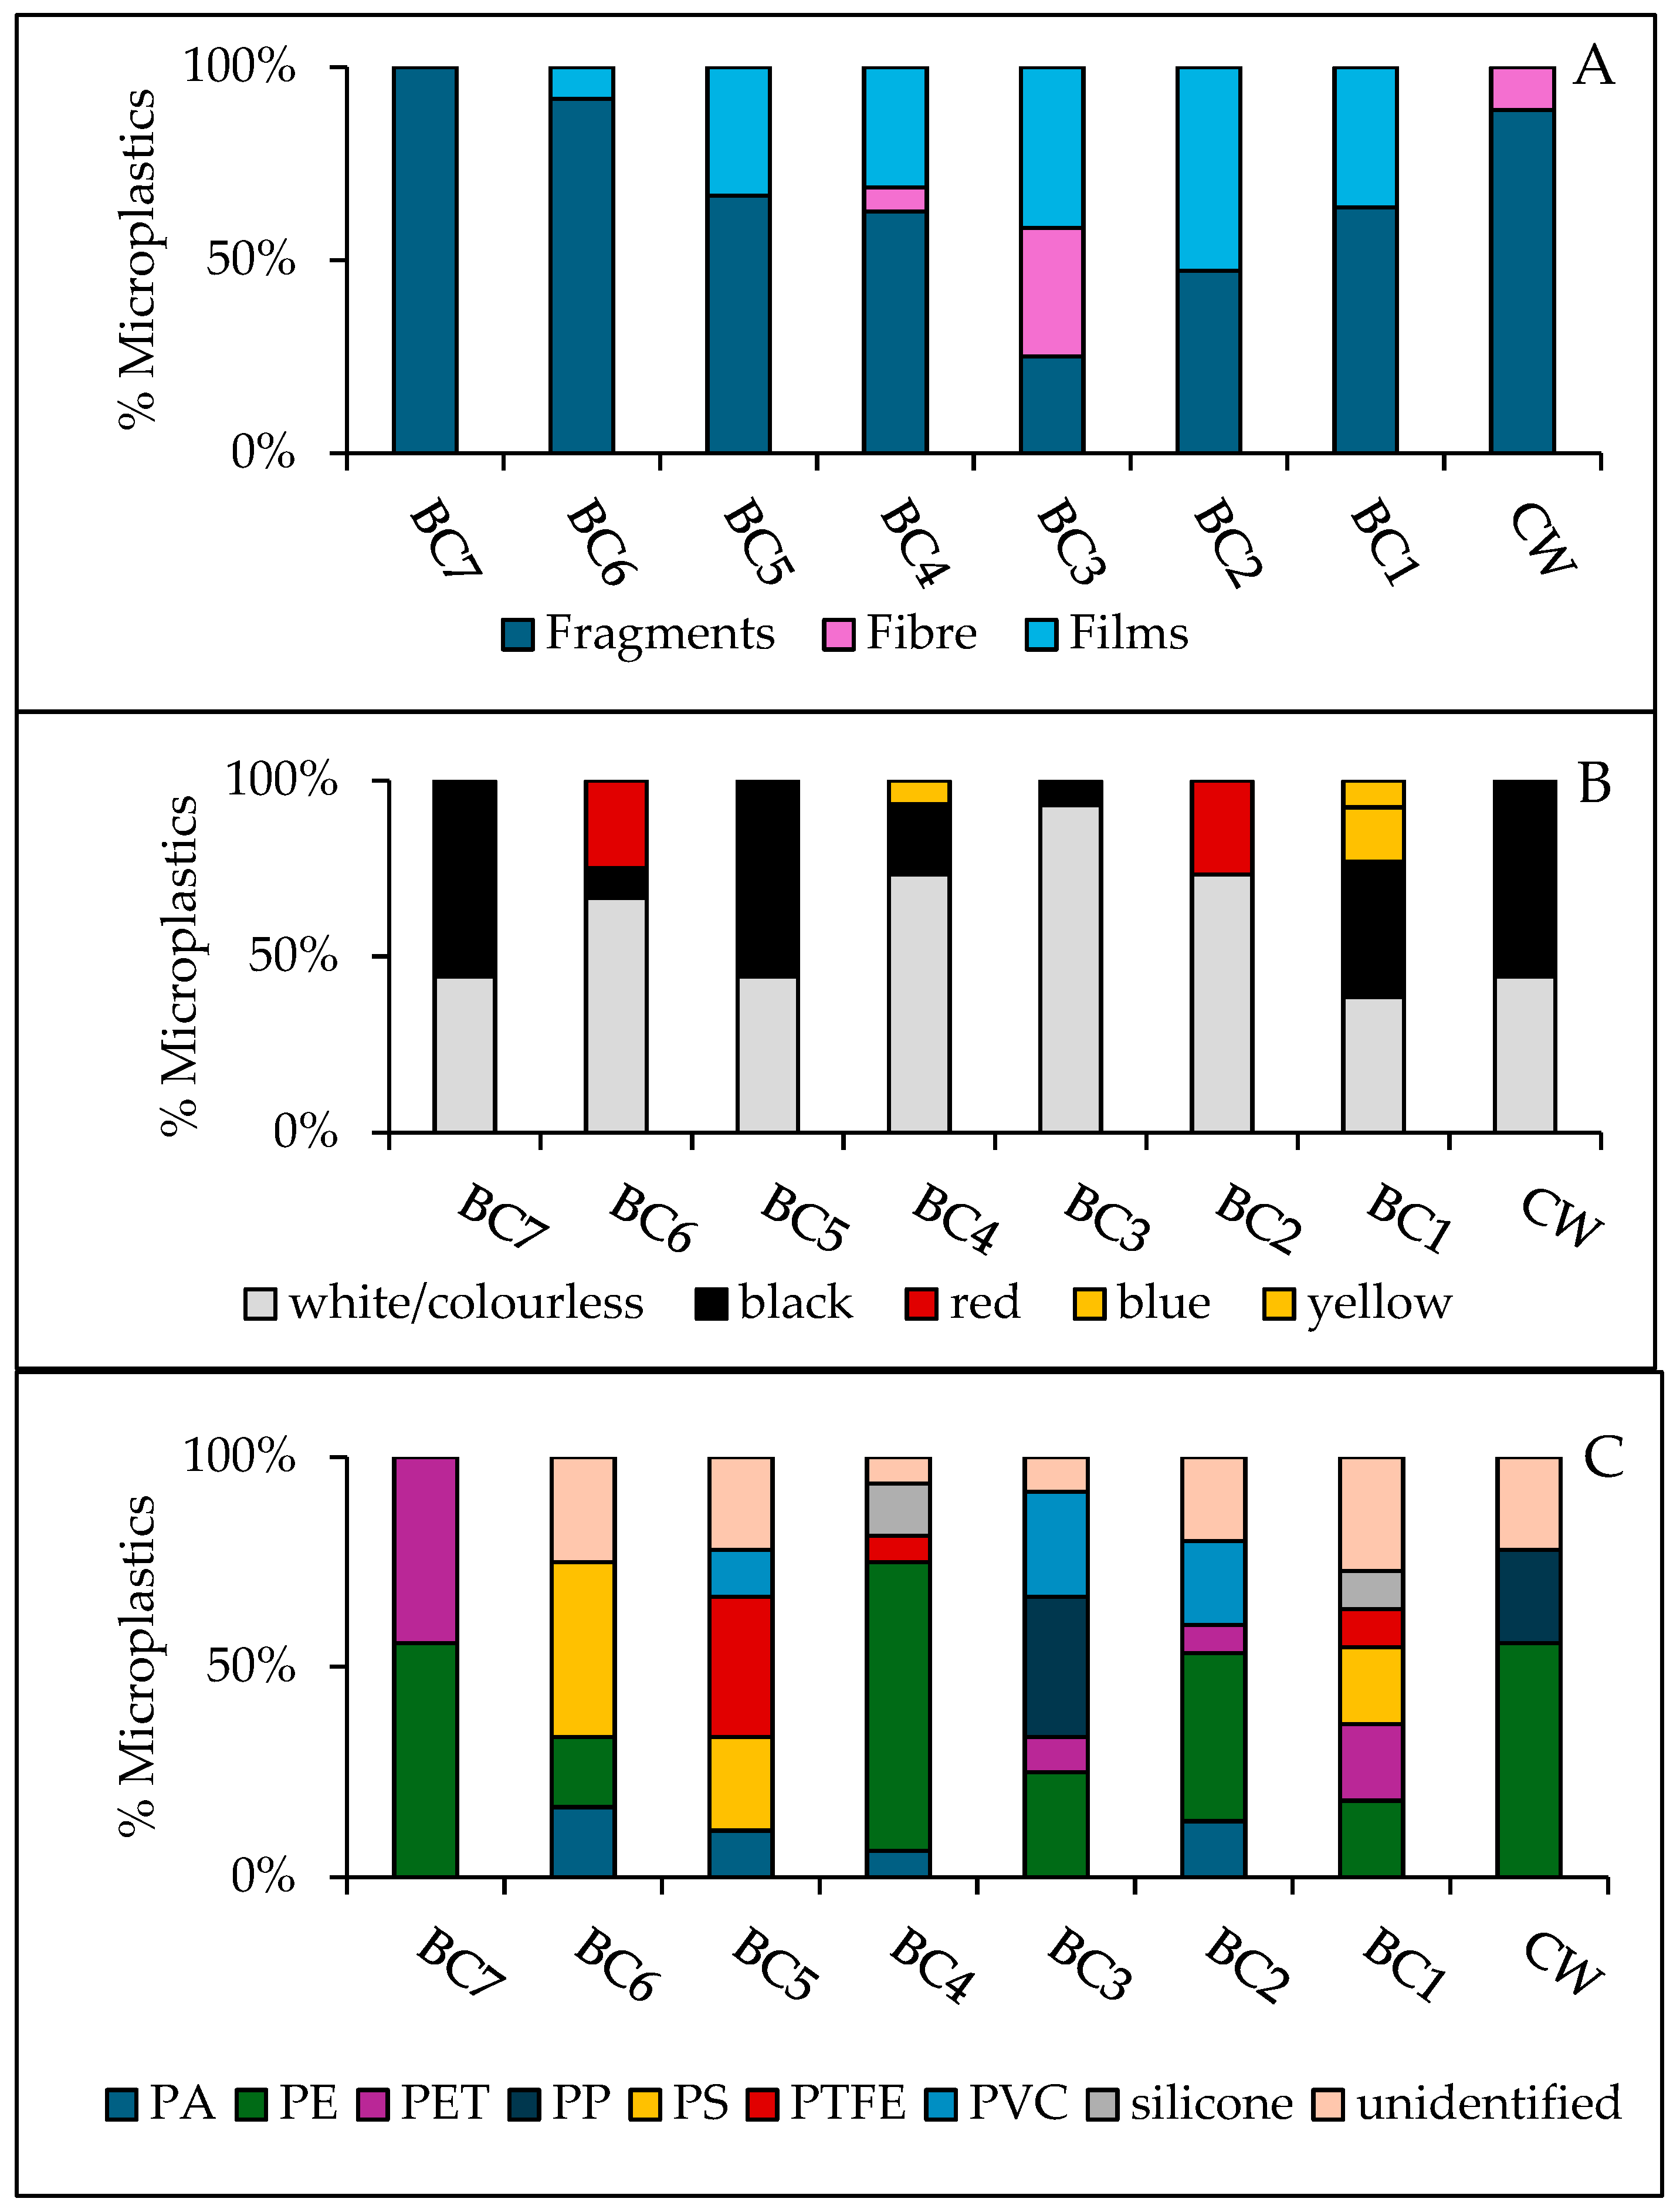
Figure 5 shows the characteristics of microplastics found in Black Cart Water sediments. Fragments were the most common shapes (63% of items found), followed by films (31%) and then fibres (6.0%). Films were mainly recovered from the middle and lower reaches of the river. Fibres were only present at BC3 and BC4, both of which are downstream of a combined sewer overflow, which may be intermittent point sources of domestic wastewater. Washing of synthetic textiles is a common source of microplastic fibres [26]. Five colours were identified: white/colourless (56%); black (23%); red (16%); blue (3.5%); and yellow (1.2%). White microplastics have previously been reported as the most dominant colour in freshwaters [5,74]. They may also indicate recent inputs, while black particles suggest older, more weathered plastics [68].
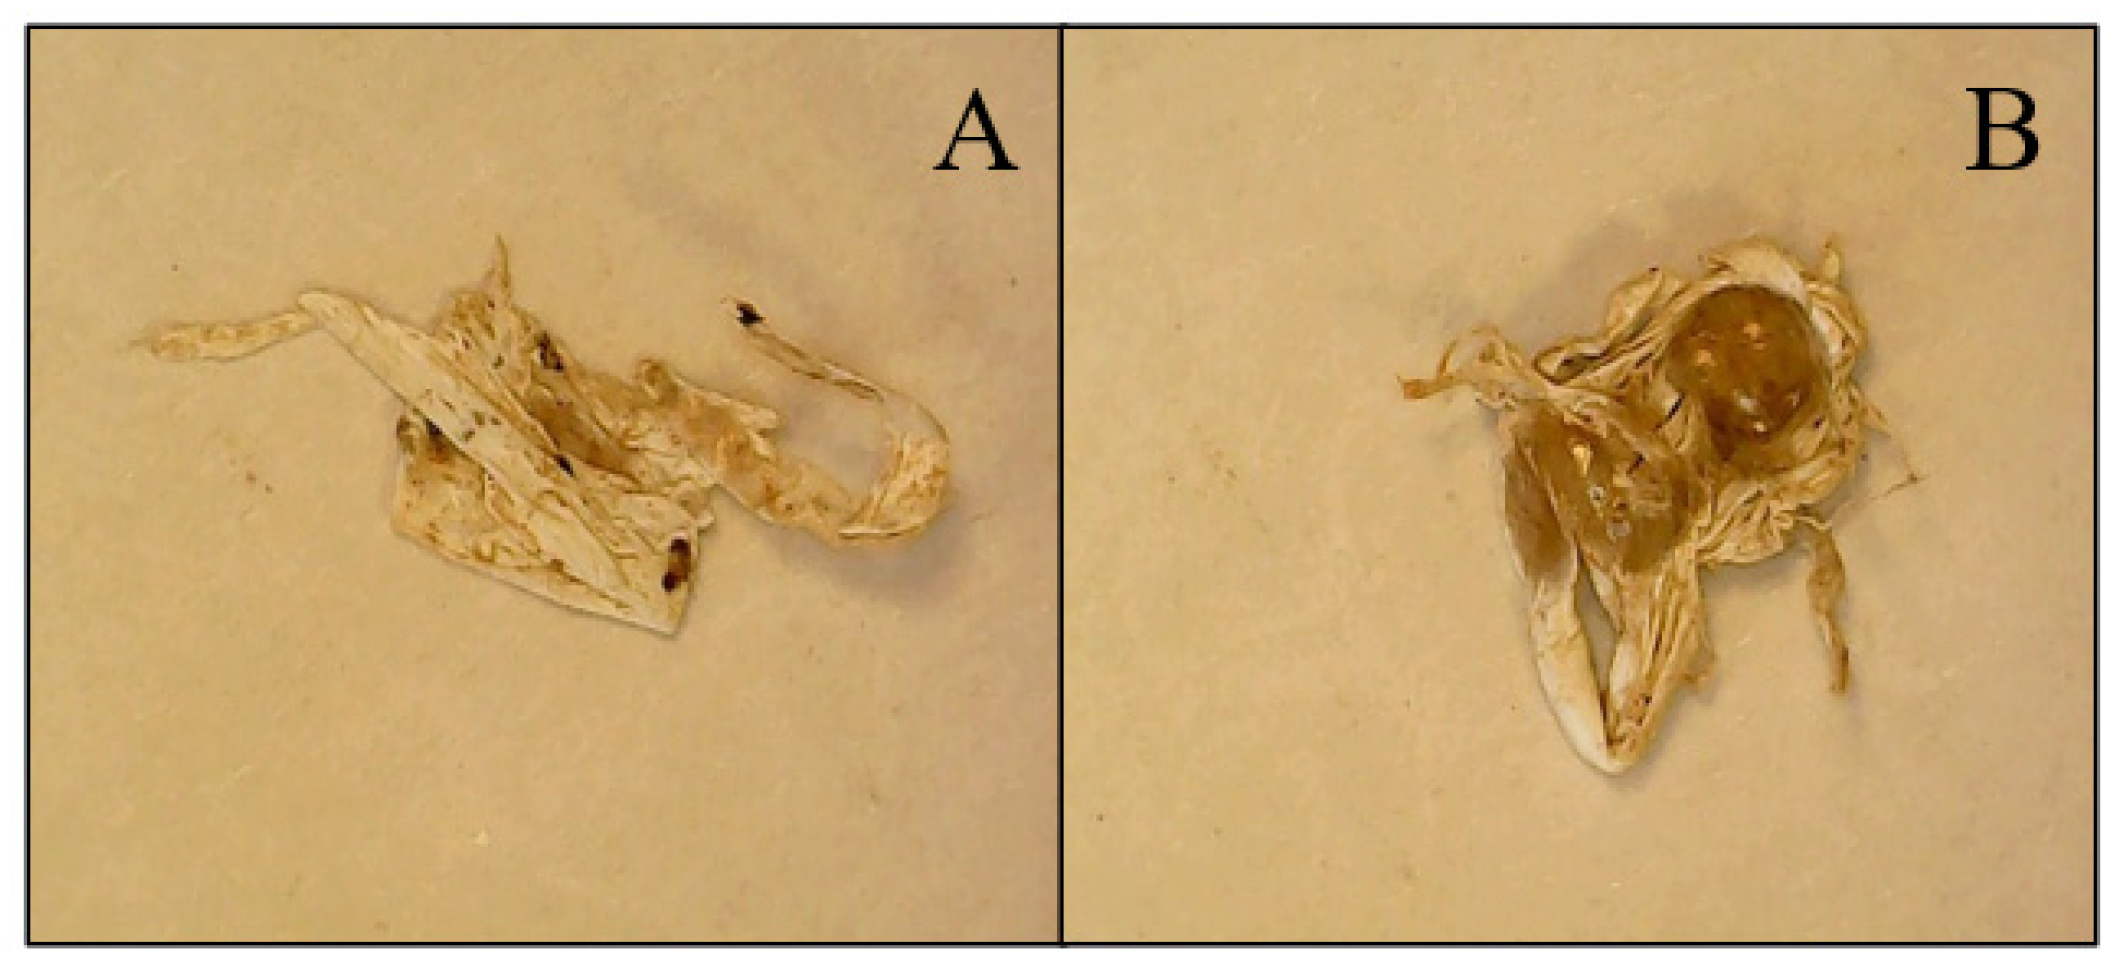
Of the polymers identified, PE was the most abundant overall (38%) followed by PET (14%), PS (13%), PVC (9.5%) and PTFE (8.3%). The highest proportions of PE were found at sites BC2 (40%), BC4 (69%) and BC7 (56%). Site BC6 was rich in PS (42%) while PTFE and PP were abundant at BC5 (33%) and BC3 (33%), respectively. Although there are settlements along the river, and so some urban input is likely, the Black Cart Water is mainly surrounded by agricultural land. Farming may therefore be an important source of secondary microplastics. Mulch films (used to suppress weeds and retain soil moisture), flexible greenhouse covers, silage wraps, and lightweight irrigation tubing are all made from PE. Some of these items may also be made from PS and PP, polymers that are also used to make twines and ropes, woven sacks for storing seeds and fertilisers, reusable nursery pots and trays, crop covers and shade nets for plant protection, and various storage containers [75]. The PTFE found at sites BC4 and BC5 appeared to be plumbing tape (Figure 6).
White Cart Water
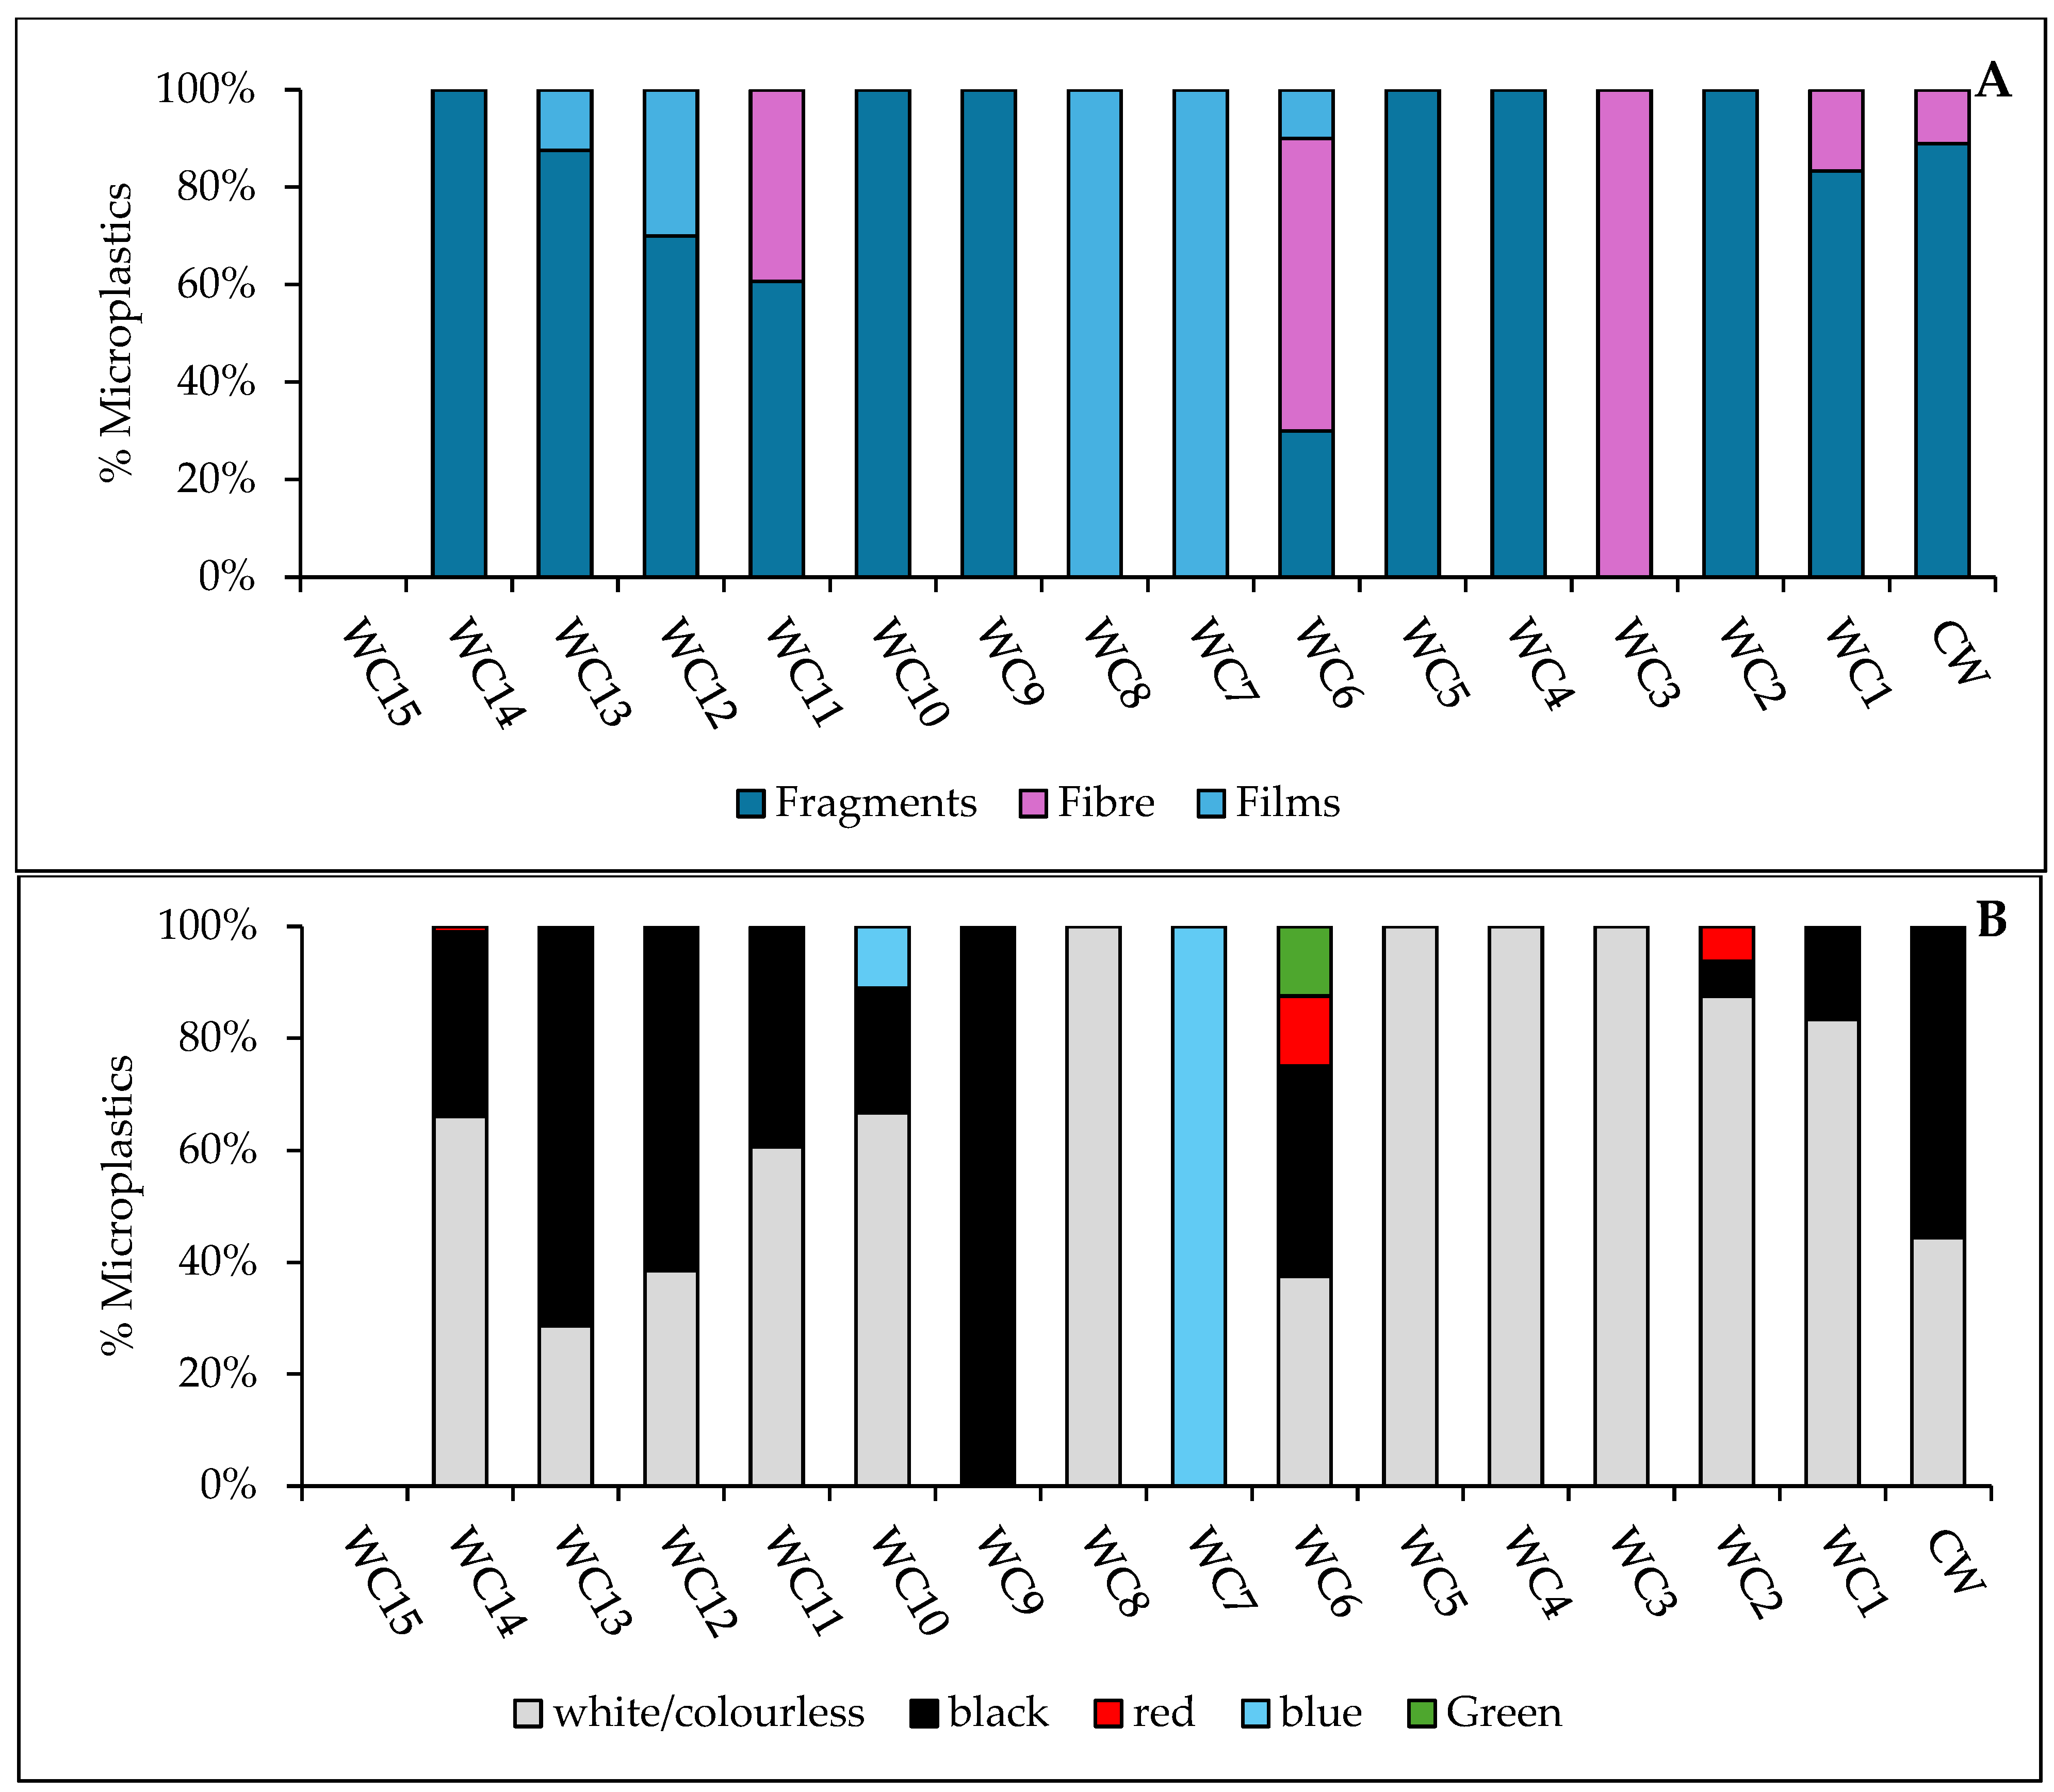
Figure 7 shows the characteristics of microplastics found in White Cart Water sediments. Fragments were the most common (75% of items found), followed by films (17%) and fibres (7.8%); indeed, fragments were the only shape found at sites WC2, WC4, WC5, WC9, WC10, and WC14. The White Cart is the more urban of the two rivers studied and so this aligns with previous findings that fragments are common in urban areas [76,77]. Similar to the Black Cart, white/colourless particles were most common (64%), followed by black (29%), with lower amounts of blue (3.7%), and red (2.8%).
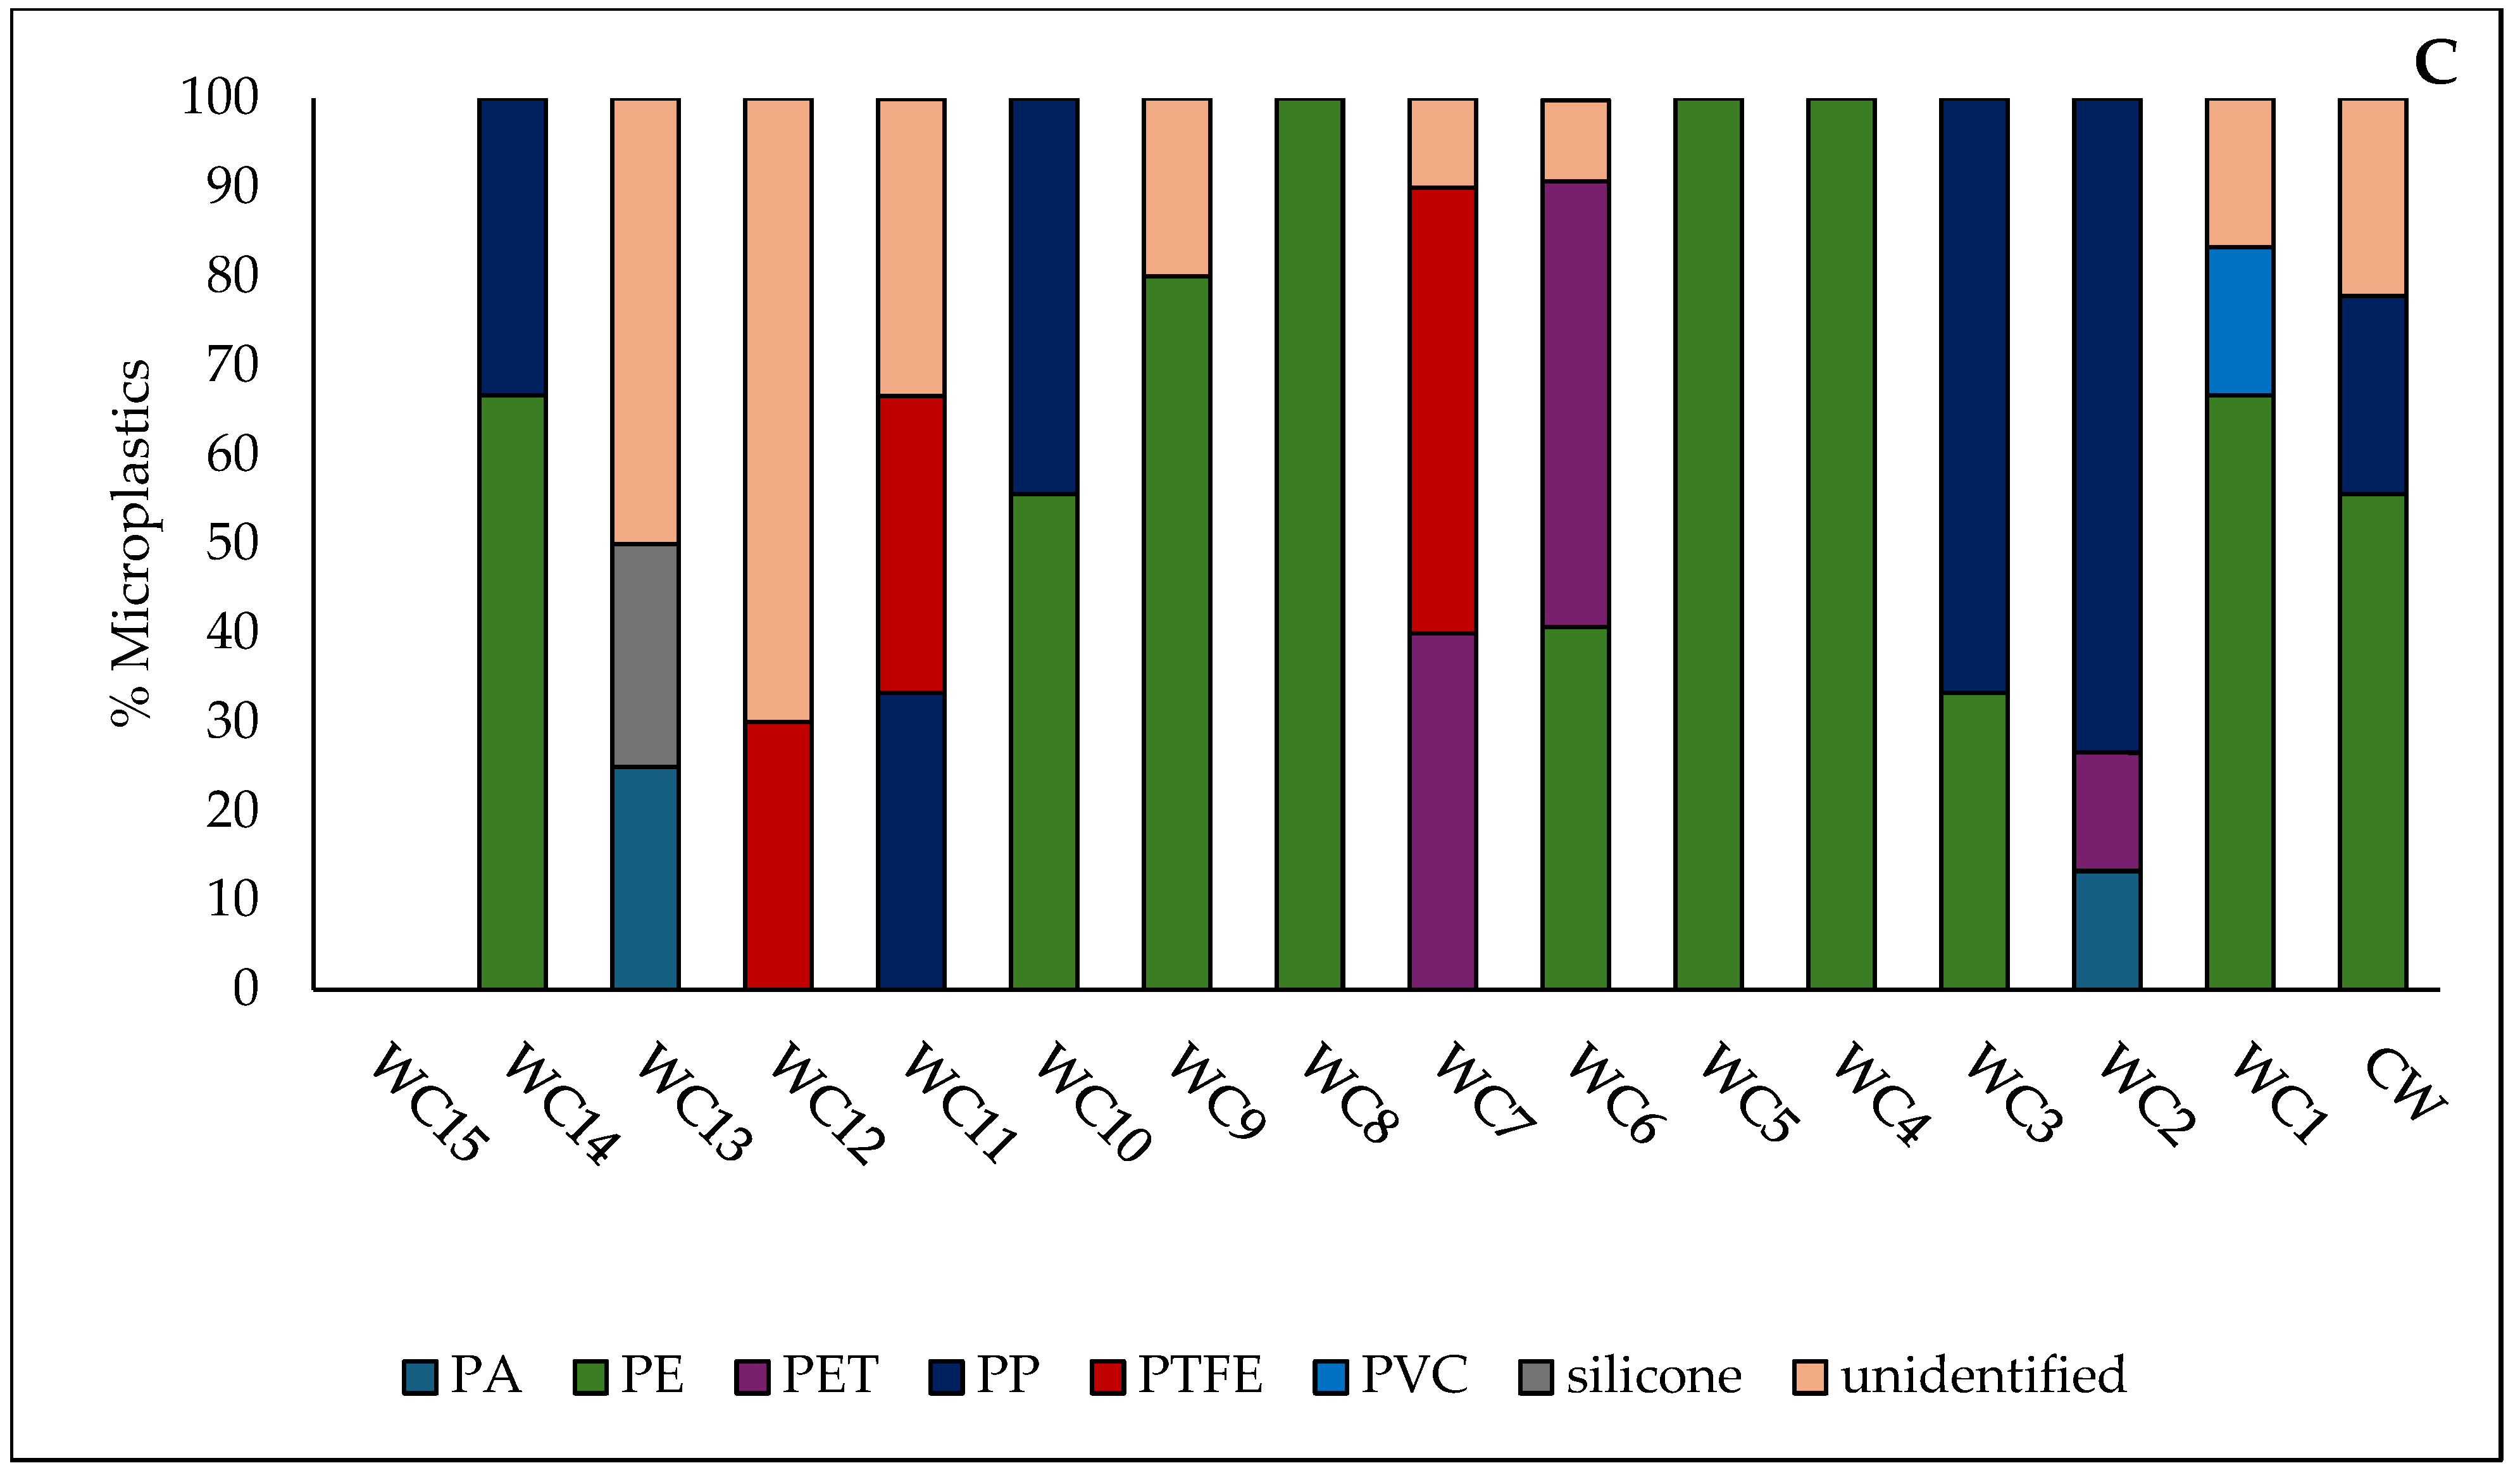
Low-density polymers were abundant—PE (54%) and PP (21%)—followed by PTFE (9.5%), PET (9.0%) and PA (3.2%). Polyethylene was dominant at multiple sites, including WC1 (67%), WC4 (100%), WC5 (100%), WC8 (100%), WC9 (80%), WC10 (56%), and WC14 (67), while PP was most abundant at WC2 (73%) and WC3 (67%). Their prevalence is typical in urban and industrial areas due to widespread use in consumer products and their ability to travel easily before settling [5]. Similar microplastic compositions have been reported in the River Kelvin [11], another Clyde tributary, as well as other recent studies [78,79] (although it should be noted that these studies used NaCl-based density separation and so may have under-estimated the amounts of denser plastics present) [27]. Other notable polymers observed included PA at WC13 (25%), commonly used for fishing lines and toothbrush bristles; PET at WC6 (50%), found in clothing and home furnishings; and PTFE at WC7 (50%), WC11 (33%), and WC12 (30%), widely used in plumbing, non-stick cookware, and electrical insulation.

3.3. Contamination and Risk Indices

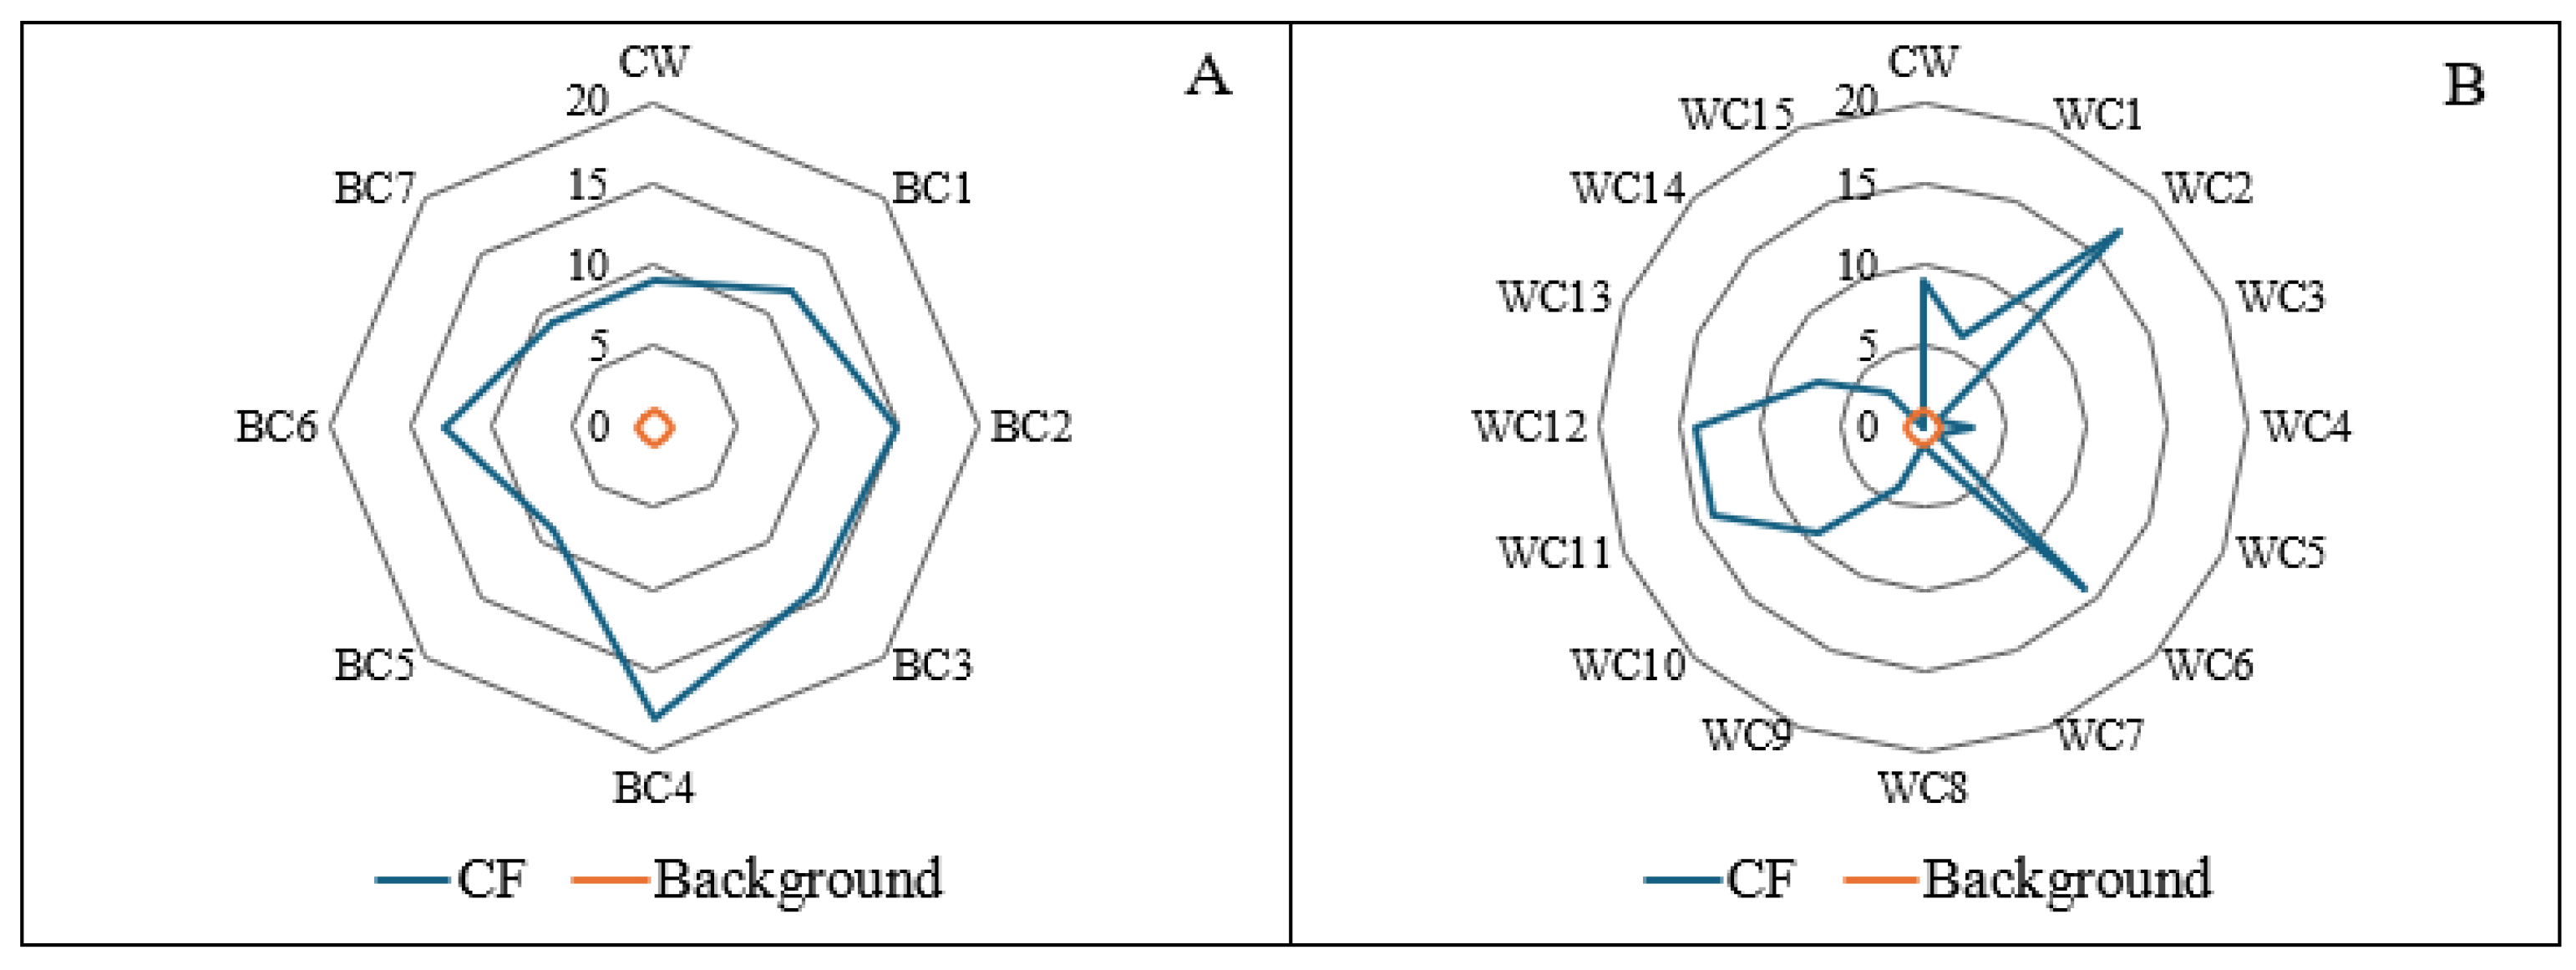
The microplastic CFs for the sediments of the Black and White Cart Waters are given in Figure 8.
The CF values for microplastics in the Black Cart Water sediments ranged from 9 to 18, placing all sampling sites within the very-highly contaminated category. A wider range of CF values was calculated for the White Cart Water (0 to 17) with only 40% of points in the very-highly contaminated category. The points with the highest CF values on the Black Cart Water (BC4) and White Cart Water (WC2) were both downstream of likely point sources of domestic microplastics, i.e., combined sewer overflows and, in the case of the White Cart, the Laighpark Wastewater Treatment Works. The PLIzone values were 12.0 for the Black Cart Water and 5.29 for the White Cart Water, confirming that both are contaminated with microplastics.
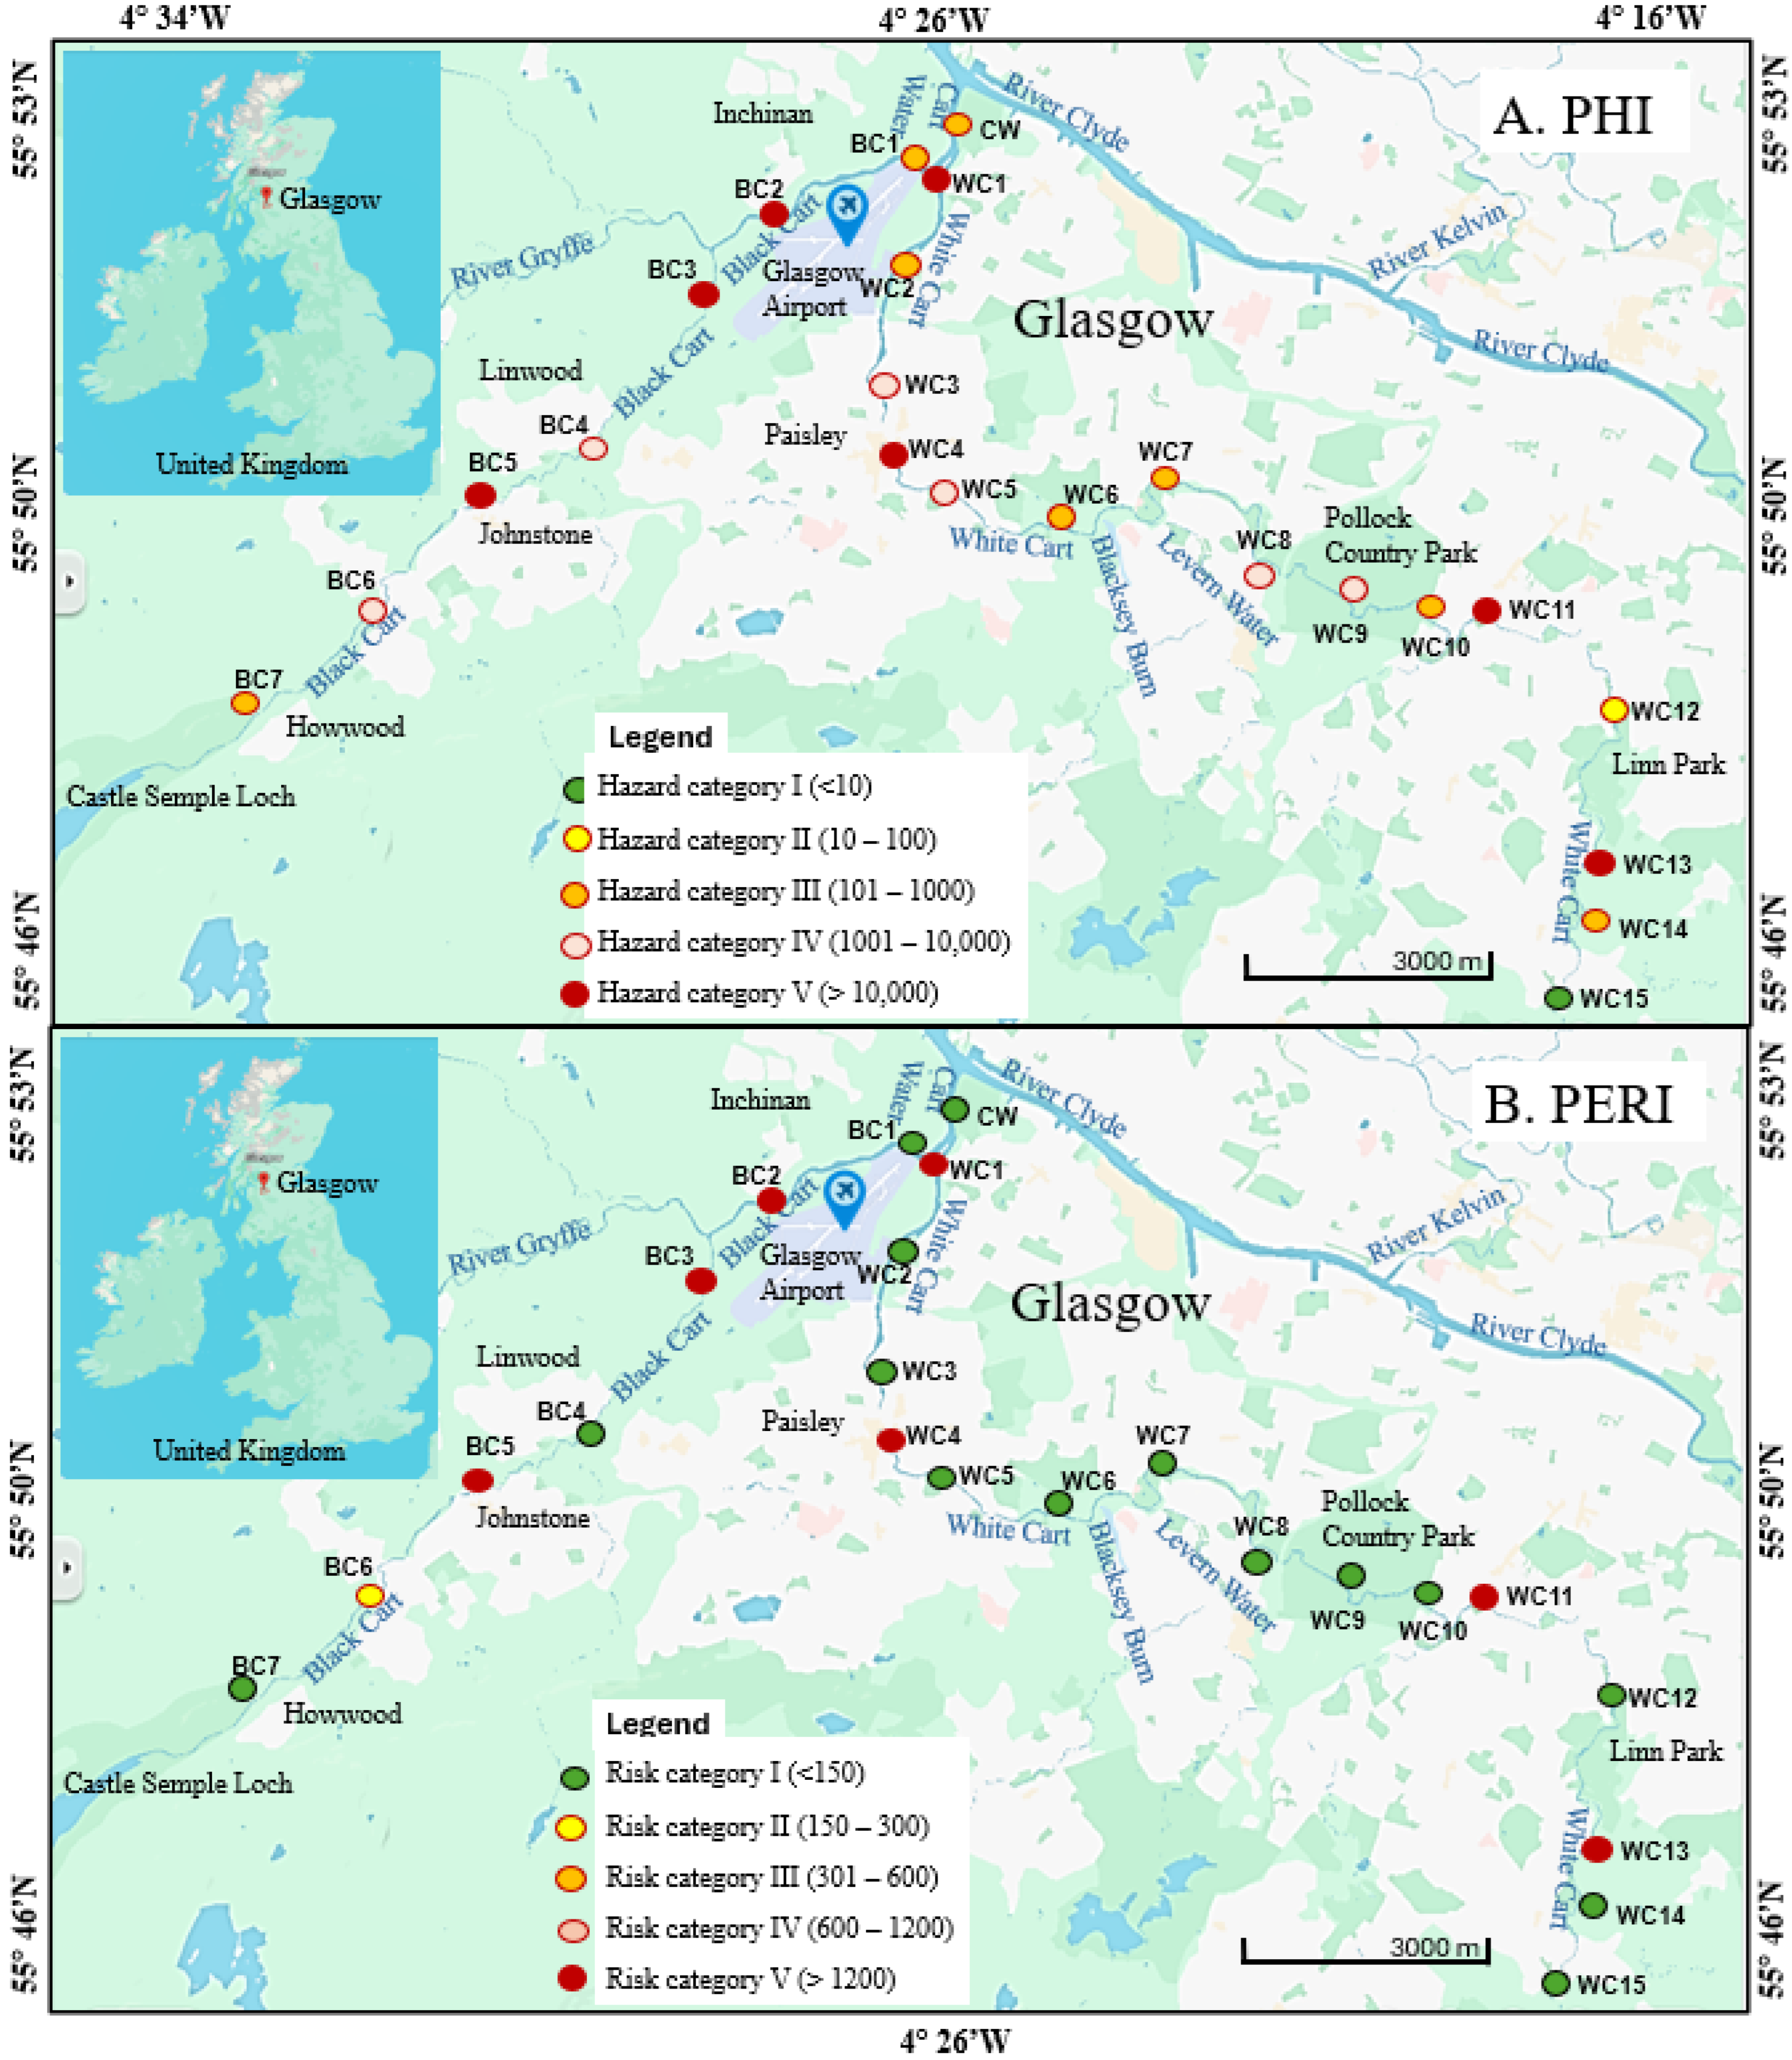
Figure 9 shows the PHI and PERI scores for the Black and White Cart Waters(detailed scores are presented in Supplementary Table S1). The PHI values for the Black Cart Water ranged from 789 to 125,000, placing the sites within hazard categories III to V. The particularly high PHI values at certain locations were due to the presence of specific polymers—PVC at BC2, BC3 and BC5 and PA at BC2 and BC5—whose monomers are either carcinogenic (PVC) or acutely toxic (PA). It must be emphasised that the PHI was developed as a tool for ranking the environmental and health hazards associated with different polymers and that a high hazard score does not necessarily imply any immediate threat to the local ecosystem [44]. The PHI values in the White Cart Water ranged from 0 to 1100, spanning hazard categories II to IV.
The PERI scores in the Black Cart Water ranged from 18.9 to 6370 but only two sites—BC2 and BC3 (those where PVC was found)—fell within the highest risk category (category V). One further site was in category II, and the remainder were all in category I. In the White Cart, all sites bar one had PERI values (range 0–37.5) in the lowest risk category [45]. The exceptionally high PERI value at WC2 (42,000) arises from a combination of high microplastic abundance and the fact that some of the particles were identified as PVC. Overall, the PERI assessment indicates that, with the exception of a few specific sites, ecological risk from microplastics in the Cart rivers system is low.
The PHI and PERI assessments together show that, even when lower concentrations of microplastics are present, there is still potential for human and ecological risks, whilst high microplastic concentrations do not necessarily translate to significant threat to the environment. It is therefore extremely important to consider not just particle abundance, but the chemical characteristics of the polymers found, when investigating microplastics in sediments.

4. Conclusions

This study presents a comprehensive assessment of microplastics in two linked tributaries of the River Clyde, West Central Scotland, examples of rivers that have both rural and urban land use along their courses. Few particles were found in surface waters but the sediment samples from both rivers—except for one site close to the source of the White Cart Water—all contained microplastics. Surprisingly, the predominantly rural Black Cart Water was more consistently contaminated with microplastics than the predominantly urban White Cart Water, suggesting that agricultural practices may be a more significant source of microplastics than previously reported. Fragments were the most common particle shape, white/transparent the most common particle colour, and PE the most common polymer in both rivers. Pollution indices confirmed that the sediments should be considered contaminated, and several sites had PHI values in hazard categories III, IV or even V due to the types of polymer present. However, the overall potential ecological risk was low except for three locations where PVC was present. This highlights the challenges of applying metrics that were originally developed for pollutants such as heavy metals, which occur naturally and so have established background concentrations, to microplastics, which are wholly synthetic. Not only does the baseline value selected have a marked influence on the outcome, but also the interpretation of the indices must be performed with care since the overall impacts of microplastics on freshwater ecosystems are much less well understood.
The work confirmed the importance of wastewater utilities as sources of microplastics but illustrated the need for further research to understand the complex factors influencing the input, distribution and fate of microplastics in freshwater systems. Many more studies are required—featuring different rivers, sampled in different seasons, and under different hydrological conditions, e.g., following long dry periods vs. after heavy rainfall—to provide a holistic understanding of the behaviour of microplastics in river systems. This will facilitate the development of appropriate management strategies and policies, as well as improving the understanding of microplastic transport to Earth’s oceans. The importance of considering polymer types as well as abundances when assessing risk was underlined, together with challenges encountered when identifying polymer particles recovered from the environment by ATR-FTIR spectroscopy. The creation of a dedicated spectral library database for use in microplastic research, containing spectra of common manufactured plastic goods and examples of weathered polymers, would be highly beneficial.

Supplementary Materials

The following supporting information can be downloaded at https://www.mdpi.com/article/10.3390/environments12100342/s1: Figure S1: Images and FT-IR spectra of microplastics isolated from sediments of the Black and White Cart Waters; Table S1: Contamination and risk indices for the Black and White Cart Waters.

Author Contributions

Conceptualization, C.M.D. and D.E.E.; methodology, D.E.E. and W.B.O.; formal analysis, D.E.E. and W.B.O.; investigation, D.E.E. and W.B.O.; resources, C.M.D. and J.J.L.; data curation, D.E.E.; writing—original draft preparation, D.E.E.; writing—review and editing, C.M.D. and J.J.L.; supervision, C.M.D. and J.J.L.; project administration, C.M.D.; funding acquisition, D.E.E. All authors have read and agreed to the published version of the manuscript.

Funding

This research was partially supported by a Petroleum and Technological Development Fund, Nigeria, PhD scholarship awarded to DEE (Reference PTDF/ED/OSS/PHD/DEE/2071/22) and by a Tertiary Education Trust Fund overseas PhD scholarship awarded to WBO (Reference TETF/ES/UNIV/ONDO/TSAS/2021).

Acknowledgments

Special thanks to Michael Davidson for helping with sample and data collection and for giving valuable insight into the land use and history of the sampling locations.

Conflicts of Interest

The authors declare no conflicts of interest. All authors have read and agreed to the published version of the manuscript. The funders had no role in the design of the study; in the collection, analyses, or interpretation of data; in the writing of the manuscript; or in the decision to publish the results.

References

  1. Karak, P.; Parveen, A.; Modak, A.; Adhikari, A.; Chakrabortty, S. Microplastic Pollution: A Global Environmental Crisis Impacting Marine Life, Human Health, and Potential Innovative Sustainable Solutions. Int. J. Environ. Res. Public Health 2025, 22, 889. [Google Scholar] [CrossRef]
  2. Lebreton, L.; Andrady, A. Future scenarios of global plastic waste generation and disposal. Palgrave Commun. 2019, 5, 6. [Google Scholar] [CrossRef]
  3. Handbook of Microplastics in the Environment; Corcoran, P.L., Rios-Mendoza, L.M., Costa, M.F., Rocha-Santos, T., Mouneyrac, C., Eds.; Springer: Cham, Switzerland, 2022. [Google Scholar] [CrossRef]
  4. Thompson, R.C.; Olsen, Y.; Mitchell, R.P.; Davis, A.; Rowland, S.J.; John, A.W.G.; McGonigle, D.; Russell, A.E. Lost at sea: Where is all the plastic? Science 2004, 304, 838. [Google Scholar] [CrossRef]
  5. He, B.; Liu, A.; Ayoko, G.; Egodawatta, P.; Wijesiri, B.; Goonetilleke, A. Environmental Risks Posed by Microplastics in Urban Waterways; Springer: Singapore, 2023. [Google Scholar]
  6. Kataria, N.; Yadav, S.; Garg, V.K.; Rene, E.R.; Jiang, J.-J.; Rose, P.K.; Kumar, M.; Khoo, K.S. Occurrence, transport, and toxicity of microplastics in tropical food chains: Perspectives view and way forward. Environ. Geochem. Health 2024, 46, 98. [Google Scholar] [CrossRef]
  7. Zheng, H.; Vidili, G.; Casu, G.; Navarese, E.P.; Sechi, L.A.; Chen, Y. Microplastics and nanoplastics in cardiovascular disease—A narrative review with worrying links. Front. Toxicol. 2024, 6, 1479292. [Google Scholar] [CrossRef]
  8. Tang, K.H.D. Effects of Microplastics on Bioavailability, Persistence and Toxicity of Plant Pesticides: An Agricultural Perspective. Agriculture 2025, 15, 356. [Google Scholar] [CrossRef]
  9. Bank, M.S. The Microplastic Cycle: An Introduction to a Complex Issue; Springer International Publishing: Cham, Switzerland, 2021. [Google Scholar]
  10. Lee, J.-Y.; Chia, R.W.; Veerasingam, S.; Uddin, S.; Jeon, W.-H.; Moon, H.S.; Cha, J.; Lee, J. A comprehensive review of urban microplastic pollution sources, environment and human health impacts, and regulatory efforts. Sci. Total Environ. 2024, 946, 174297. [Google Scholar] [CrossRef]
  11. Shokunbi, O.S.; Idowu, G.A.; Aiyesanmi, A.F.; Davidson, C.M. Assessment of Microplastics and Potentially Toxic Elements in Surface Sediments of the River Kelvin, Central Scotland, United Kingdom. Environ. Manag. 2024, 73, 932–945. [Google Scholar] [CrossRef] [PubMed]
  12. Pham, D.T.; Choi, S.-H.; Kwon, J.-H. Year-round spatial and temporal distribution of microplastics in water and sediments of an urban freshwater system (Jungnang Stream, Korea). Environ. Pollut. 2024, 357, 124362. [Google Scholar] [CrossRef] [PubMed]
  13. Kiss, T.; Fórián, S.; Szatmári, G.; Sipos, G. Spatial distribution of microplastics in the fluvial sediments of a transboundary river—A case study of the Tisza River in Central Europe. Sci. Total Environ. 2021, 785, 147306. [Google Scholar] [CrossRef] [PubMed]
  14. Zhao, K.; Zhou, S.; Wang, K.; Li, D.; Liu, H.; Li, F. Distribution characteristics and pollution risk assessment of microplastics in urban rivers: A case study in Yitong River, China. J. Water Process Eng. 2024, 61, 105277. [Google Scholar] [CrossRef]
  15. Kapukotuwa, G.K.; Jayasena, N.; Weerakoon, K.C.; Abayasekara, C.L.; Rajakaruna, R.S. Microplastic Pollution of Stream Water and Sediment in a Tributary of a Major Drinking Water Supplying River in Sri Lanka. ACS EST Water 2025, 5, 2155. [Google Scholar] [CrossRef]
  16. Singh, N.; Mondal, A.; Bagri, A.; Tiwari, E.; Khandelwal, N.; Monikh, F.A.; Darbha, G.K. Characteristics and spatial distribution of microplastics in the lower Ganga River water and sediment. Mar. Pollut. Bull. 2021, 163, 111960. [Google Scholar] [CrossRef] [PubMed]
  17. Zhang, L.; Li, X.; Li, Q.; Xia, X.; Zhang, H. The effects of land use types on microplastics in river water: A case study on the mainstream of the Wei River, China. Environ. Monit. Assess. 2024, 196, 349. [Google Scholar] [CrossRef] [PubMed]
  18. Patidar, K.; Ambade, B.; Verma, S.K.; Mohammad, F. Microplastic contamination in water and sediments of Mahanadi River, India: An assessment of ecological risk along rural-urban area. J. Environ. Manag. 2023, 348, 119363. [Google Scholar] [CrossRef]
  19. Matjašič, T.; Mori, N.; Hostnik, I.; Bajt, O.; Kovač Viršek, M. Microplastic pollution in small rivers along rural–urban gradients: Variations across catchments and between water column and sediments. Sci. Total Environ. 2023, 858, 160043. [Google Scholar] [CrossRef]
  20. Grillo, J.F.; López-Ordaz, A.; Hernández, A.J.; Gómez, F.B.; Sabino, M.A.; Ramos, R. Rural village as a source of microplastic pollution in a riverine and marine ecosystem of the southern Venezuelan Caribbean. J. Contam. Hydrol. 2025, 269, 104511. [Google Scholar] [CrossRef]
  21. Peng, M.; Wu, Q.; Gao, S.; Liu, Y.; Zeng, J.; Ruan, Y. Distribution and characteristics of microplastics in an urban river: The response to urban waste management. Sci. Total Environ. 2023, 905, 166638. [Google Scholar] [CrossRef] [PubMed]
  22. Kabir, A.H.M.E.; Sekine, M.; Imai, T.; Yamamoto, K.; Kanno, A.; Higuchi, T. Microplastics in the sediments of small-scale Japanese rivers: Abundance and distribution, characterization, sources-to-sink, and ecological risks. Sci. Total Environ. 2022, 812, 152590. [Google Scholar] [CrossRef]
  23. Larrea Murrell, J.A.; Gálvez-Blanca, V.; Petre, A.L.; Alvarez, B.R.; Moya, D.L.; Rojas Badía, M.M.; Perdigón-Melón, J.A.; Boltes, K.; Rosal, R. Microplastics in Cuban freshwaters: Diversity, temporal changes, and effects on extracellular enzymatic activity. Environ. Pollut. 2025, 368, 125764. [Google Scholar] [CrossRef]
  24. Rodrigues, M.O.; Abrantes, N.; Goncalves, F.J.M.; Nogueira, H.; Marques, J.C.; Goncalves, A.M.M. Spatial and temporal distribution of microplastics in water and sediments of a freshwater system (Antua River, Portugal). Sci. Total Environ. 2018, 633, 1549. [Google Scholar] [CrossRef]
  25. Zaki, M.R.M.; Sukatis, F.F.; Roslan, M.Q.J.; Isa, N.M.; Yusoff, F.M.; Aris, A.Z. Microplastic Pollution in Freshwater Sediments: Abundance and Distribution in Selangor River Basin, Malaysia. Water Air Soil Pollut. 2023, 234, 474. [Google Scholar] [CrossRef]
  26. Woodward, J.; Li, J.; Rothwell, J.; Hurley, R. Acute riverine microplastic contamination due to avoidable releases of untreated wastewater. Nat. Sustain. 2021, 4, 793. [Google Scholar] [CrossRef]
  27. Enenche, D.E.; Davidson, C.M.; Liggat, J.J. Towards a Consensus Method for the Isolation of Microplastics from Freshwater Sediments. Environments 2024, 11, 146. [Google Scholar] [CrossRef]
  28. Zhang, X.; Leng, Y.; Liu, X.; Huang, K.; Wang, J. Microplastics’ Pollution and Risk Assessment in an Urban River: A Case Study in the Yongjiang River, Nanning City, South China. Expo. Health 2020, 12, 141. [Google Scholar] [CrossRef]
  29. Duong, T.T.; Le, P.T.; Nguyen, T.N.H.; Hoang, T.Q.; Ngo, H.M.; Doan, T.O.; Le, T.P.Q.; Bui, H.T.; Bui, M.H.; Trinh, V.T.; et al. Selection of a density separation solution to study microplastics in tropical riverine sediment. Environ. Monit. Assess. 2022, 194, 65. [Google Scholar] [CrossRef]
  30. Alam, M.J.; Shammi, M.; Tareq, S.M. Distribution of microplastics in shoreline water and sediment of the Ganges River Basin to Meghna Estuary in Bangladesh. Ecotoxicol. Environ. Safe 2023, 266, 115537. [Google Scholar] [CrossRef]
  31. Xia, F.; Tan, Q.; Qin, H.; Wang, D.; Cai, Y.; Zhang, J. Sequestration and export of microplastics in urban river sediments. Environ. Int. 2023, 181, 108265. [Google Scholar] [CrossRef]
  32. Ye, L.; Zhao, Q.; Jin, J.; Lang, J.; Li, L.; Huang, L.; Long, L.; Xu, M.; Chen, C.; Yang, G. Microplastics in Sediments of the Urban River Jinjiang: Sources, Distribution, and Risk Assessment. Water Air Soil Pollut. 2024, 235, 628. [Google Scholar] [CrossRef]
  33. Zhou, J.; Liu, X.; Li, W.; Cao, Y. Characteristics, sources, and distribution of microplastics in sediments and their potential ecological risks: A case study in a typical urban river of China. J. Environ. Chem. Eng. 2024, 12, 114575. [Google Scholar] [CrossRef]
  34. Zhao, W.; Li, J.; Liu, M.; Wang, R.; Zhang, B.; Meng, X.-Z.; Zhang, S. Seasonal variations of microplastics in surface water and sediment in an inland river drinking water source in southern China. Sci. Total Environ. 2024, 908, 168241. [Google Scholar] [CrossRef]
  35. Renfrewshire Local History Forum. 2017. Available online: https://rlhf.info/ (accessed on 27 November 2024).
  36. The National Library of Scotland. The Fresh-Water Lochs of Scotland. 2024, Volume 2024. Available online: https://maps.nls.uk/dcn6/7443/74433404.6.pdf (accessed on 27 November 2024).
  37. Douglas, B.M.; McGowan, A. River & Coastal Flood Alleviation; UK Water Projects: Glasgow, Scotland, 2014; Available online: https://waterprojectsonline.com/wp-content/uploads/case_studies/2013/White-Cart-Flood-Prevention-Scheme-2013.pdf (accessed on 18 November 2024).
  38. Water Overflow Maps, Scottish Water: Glasgow, Scotland. Available online: https://www.scottishwater.co.uk/Your-Home/Your-Waste-Water/Overflows/Live-Overflow-Map (accessed on 2 April 2025).
  39. Omnic Library Spectral Indexes; Thermo Fisher Scientific: Loughborough, UK, 2025.
  40. Enyoh, C.E.; Verla, A.W.; Rakib, M.R.J. Application of index models for assessing freshwater microplastics pollution. World News Nat. Sci. 2021, 38, 37. [Google Scholar]
  41. Wang, G.; Lu, J.; Li, W.; Ning, J.; Zhou, L.; Tong, Y.; Liu, Z.; Zhou, H.; Xiayihazi, N. Seasonal variation and risk assessment of microplastics in surface water of the Manas River Basin, China. Ecotoxicol. Environ. Safe 2021, 208, 111477. [Google Scholar] [CrossRef]
  42. Rakib, M.R.J.; Hossain, M.B.; Kumar, R.; Ullah, M.A.; Al Nahian, S.; Rima, N.N.; Choudhury, T.R.; Liba, S.I.; Yu, J.; Khandaker, M.U.; et al. Spatial distribution and risk assessments due to the microplastics pollution in sediments of Karnaphuli River Estuary, Bangladesh. Sci. Rep. 2022, 12, 8581. [Google Scholar] [CrossRef]
  43. Manik, M.; Hossain, M.T.; Pastorino, P. Characterization and risk assessment of microplastics pollution in Mohamaya Lake, Bangladesh. J. Contam. Hydrol. 2025, 269, 104487. [Google Scholar] [CrossRef]
  44. Lithner, D.; Larsson, Å.; Dave, G. Environmental and health hazard ranking and assessment of plastic polymers based on chemical composition. Sci. Total Environ. 2011, 409, 3309. [Google Scholar] [CrossRef]
  45. Ranjani, M.; Veerasingam, S.; Venkatachalapathy, R.; Mugilarasan, M.; Bagaev, A.; Mukhanov, V.; Vethamony, P. Assessment of potential ecological risk of microplastics in the coastal sediments of India: A meta-analysis. Mar. Pollut. Bull. 2021, 163, 111969. [Google Scholar] [CrossRef]
  46. Fordyce, F.; O Dochartaigh, B.; Lister, T.; Cooper, R.; Kim, A.; Harrison, I.; Vane, C.; Brown, S. Clyde Tributaries: Report of Urban Stream Sediment and Surface Water Geochemistry for Glasgow; British Geological Survey: Nottingham, UK, 2004. [Google Scholar]
  47. Vane, C.H.; Lopes dos Santos, R.A.; Kim, A.W.; Moss-Hayes, V.; Fordyce, F.M.; Bearcock, J.M. Persistent organic pollutants (PAH, PCB, TPH) in freshwater, urban tributary and estuarine surface sediments of the River Clyde, Scotland, UK. Earth Environ. Sci. Trans. R. Soc. Edinb. 2019, 108, 299. [Google Scholar] [CrossRef]
  48. Jia, Y.; Wang, Z.; Zheng, X.; Li, Y. A study on limit velocity and its mechanism and implications for alluvial rivers. Int. J. Sediment Res. 2016, 31, 205. [Google Scholar] [CrossRef]
  49. Hough, I.; Moggridge, H.; Warren, P.; Shucksmith, J. Regional flow–ecology relationships in small, temperate rivers. Water Environ. J. 2022, 36, 142. [Google Scholar] [CrossRef]
  50. Contaminants of the Great Lakes; Helm, P.A., Crossman, J., Weisener, C., Eds.; Springer: Cham, Switzerland, 2020. [Google Scholar] [CrossRef]
  51. Kunz, A.; Schneider, F.; Anthony, N.; Lin, H.-T. Microplastics in rivers along an urban-rural gradient in an urban agglomeration: Correlation with land use, potential sources and pathways. Environ. Pollut. 2023, 321, 121096. [Google Scholar] [CrossRef]
  52. Schrank, I.; Löder, M.G.J.; Imhof, H.K.; Moses, S.R.; Heß, M.; Schwaiger, J.; Laforsch, C. Riverine microplastic contamination in southwest Germany: A large-scale survey. Front. Earth Sci. 2022, 10, 794250. [Google Scholar] [CrossRef]
  53. Zhao, S.; Zhu, L.; Wang, T.; Li, D. Suspended microplastics in the surface water of the Yangtze Estuary System, China: First observations on occurrence, distribution. Mar. Pollut. Bull. 2014, 86, 562. [Google Scholar] [CrossRef]
  54. Stovall, J.K.; Bratton, S.P. Microplastic Pollution in Surface Waters of Urban Watersheds in Central Texas, United States: A Comparison of Sites With and Without Treated Wastewater Effluent. Front. Anal. Sci. 2022, 2, 857694. [Google Scholar] [CrossRef]
  55. Lindeque, P.K.; Cole, M.; Coppock, R.L.; Lewis, C.N.; Miller, R.Z.; Watts, A.J.R.; Wilson-McNeal, A.; Wright, S.L.; Galloway, T.S. Are we underestimating microplastic abundance in the marine environment? A comparison of microplastic capture with nets of different mesh-size. Environ. Pollut. 2020, 265, 114721. [Google Scholar] [CrossRef]
  56. Kovač Viršek, M.; Palatinus, A.; Koren, Š.; Peterlin, M.; Horvat, P.; Kržan, A. Protocol for Microplastics Sampling on the Sea Surface and Sample Analysis. J. Vis. Exp. 2016, 118, 55161. [Google Scholar] [CrossRef]
  57. Devereux, R.; Ayati, B.; Westhead, E.K.; Jayaratne, R.; Newport, D. “The great source” microplastic abundance and characteristics along the river Thames. Mar. Pollut. Bull. 2023, 191, 114965. [Google Scholar] [CrossRef]
  58. Rowley, K.H.; Cucknell, A.-C.; Smith, B.D.; Clark, P.F.; Morritt, D. London’s river of plastic: High levels of microplastics in the Thames water column. Sci. Total Environ. 2020, 740, 140018. [Google Scholar] [CrossRef]
  59. Dikareva, N.; Simon, K.S. Microplastic pollution in streams spanning an urbanisation gradient. Environ. Pollut. 2019, 250, 292. [Google Scholar] [CrossRef]
  60. Horton, A.A.; Svendsen, C.; Williams, R.J.; Spurgeon, D.J.; Lahive, E. Large microplastic particles in sediments of tributaries of the River Thames, UK—Abundance, sources and methods for effective quantification. Mar. Pollut. Bull. 2017, 114, 218. [Google Scholar] [CrossRef]
  61. Horton, A.A.; Dixon, S.J. Microplastics: An introduction to environmental transport processes. WIREs Water 2018, 5, e1268. [Google Scholar] [CrossRef]
  62. Zhou, G.; Wang, Q.; Zhang, J.; Li, Q.; Wang, Y.; Wang, M.; Huang, X. Distribution and characteristics of microplastics in urban waters of seven cities in the Tuojiang River basin, China. Environ. Res. 2020, 189, 109893. [Google Scholar] [CrossRef]
  63. Blair, R.M.; Waldron, S.; Phoenix, V.R.; Gauchotte-Lindsay, C. Microscopy and elemental analysis characterisation of microplastics in sediment of a freshwater urban river in Scotland, UK. Environ. Sci. Pollut. Res. 2019, 26, 12491–12504. [Google Scholar] [CrossRef]
  64. Rendell-Bhatti, F.; Bull, C.; Cross, R.; Cox, R.; Adediran, G.A.; Lahive, E. From the environment into the biomass: Microplastic uptake in a protected lamprey species. Environ. Pollut. 2023, 323, 121267. [Google Scholar] [CrossRef]
  65. Tibbetts, J.; Krause, S.; Lynch, I.; Smith, G.H.S. Abundance, distribution, and drivers of microplastic contamination in urban river environments. Water 2018, 10, 1597. [Google Scholar] [CrossRef]
  66. Nel, H.A.; Dalu, T.; Wasserman, R.J. Sinks and sources: Assessing microplastic abundance in river sediment and deposit feeders in an Austral temperate urban river system. Sci. Total Environ. 2018, 612, 950. [Google Scholar] [CrossRef]
  67. Wang, Z.; Su, B.; Xu, X.; Di, D.; Huang, H.; Mei, K.; Dahlgren, R.A.; Zhang, M.; Shang, X. Preferential accumulation of small (<300 μm) microplastics in the sediments of a coastal plain river network in eastern China. Water Res. 2018, 144, 393. [Google Scholar] [CrossRef]
  68. Doherty, V.F.; Aneyo, I.A.; Fatunsin, O.T.; Enyoh, C.E.; Yahaya, T.O.; Emeronye, I.G.; Amolegbe, O.A.; Amaeze, N.H.; Anyiam, F.E.; Oloidi, A.A.; et al. Assessment of fishes, sediment and water from some inland rivers across the six geopolitical zones in Nigeria for microplastics. Environ. Anal. Health Toxicol. 2024, 39, e2024018. [Google Scholar] [CrossRef]
  69. Park, M.; Choi, I.; Lee, S.; Hong, S.-j.; Kim, A.; Shin, J.; Kang, H.-C.; Kim, Y.-W. Renewable malic acid-based plasticizers for both PVC and PLA polymers. J. Ind. Eng. Chem. 2020, 88, 148. [Google Scholar] [CrossRef]
  70. Hsiao, K.Y.; Chung, R.J.; Chang, P.P.; Tsai, T.H. Identification of Hydroxyl and Polysiloxane Compounds via Infrared Absorption Spectroscopy with Targeted Noise Analysis. Polymers 2025, 17, 1533. [Google Scholar] [CrossRef]
  71. Anshari, R.; Tsuboi, M.; Sato, H.; Tashiro, K.; Ozaki, Y. Raman and ATR-FTIR unmask crystallinity changes and carboxylate group and vinyl group accumulation in natural weathering polypropylene microplastics. Sci. Rep. 2025, 15, 2518. [Google Scholar] [CrossRef]
  72. Cheeseman, S.; Shaw, Z.L.; Vongsvivut, J.; Crawford, R.J.; Dupont, M.F.; Boyce, K.J.; Gangadoo, S.; Bryant, S.J.; Bryant, G.; Cozzolino, D.; et al. Analysis of Pathogenic Bacterial and Yeast Biofilms Using the Combination of Synchrotron ATR-FTIR Microspectroscopy and Chemometric Approaches. Molecules 2021, 26, 3890. [Google Scholar] [CrossRef]
  73. Workman, J. Innovative New Method Speeds Up Correction of ATR Infrared Spectra. 2024. Available online: https://www.spectroscopyonline.com/view/innovative-new-method-speeds-up-correction-of-atr-infrared-spectra (accessed on 18 August 2025).
  74. Jitkaew, P.; Pradit, S.; Noppradit, P.; Sengloyluan, K.; Yucharoen, M.; Suwanno, S.; Tanrattanakul, V.; Sornplang, K.; Nitiratsuwan, T. Occurrence of microplastics in freshwater gastropods from a tropical river U-Taphao, southern Thailand. PeerJ 2023, 11, e14861. [Google Scholar] [CrossRef]
  75. Lewicka, K.; Szymanek, I.; Rogacz, D.; Wrzalik, M.; Łagiewka, J.; Nowik-Zając, A.; Zawierucha, I.; Coseri, S.; Puiu, I.; Falfushynska, H.; et al. Current Trends of Polymer Materials’ Application in Agriculture. Sustainability 2024, 16, 8439. [Google Scholar] [CrossRef]
  76. Ding, L.; Mao, R.f.; Guo, X.; Yang, X.; Zhang, Q.; Yang, C. Microplastics in surface waters and sediments of the Wei River, in the northwest of China. Sci. Total Environ. 2019, 667, 427. [Google Scholar] [CrossRef]
  77. Jiang, C.B.; Yin, L.S.; Wen, X.F.; Du, C.Y.; Wu, L.X.; Long, Y.N.; Liu, Y.Z.; Ma, Y.; Yin, Q.D.; Zhou, Z.Y.; et al. Microplastics in Sediment and Surface Water of West Dongting Lake and South Dongting Lake: Abundance, Source and Composition. Int. J. Environ. Res. Public Health 2018, 15, 2164. [Google Scholar] [CrossRef]
  78. Jones, K.L.; Hartl, M.G.J.; Bell, M.C.; Capper, A. Microplastic accumulation in a Zostera marina L. bed at Deerness Sound, Orkney, Scotland. Mar. Pollut. Bull. 2020, 152, 110883. [Google Scholar] [CrossRef]
  79. Blumenroeder, J.; Sechet, P.; Kakkonen, J.E.; Hartl, M.G.J. Microplastic contamination of intertidal sediments of Scapa Flow, Orkney a first assessment. Mar. Pollut. Bull. 2017, 124, 112. [Google Scholar] [CrossRef]
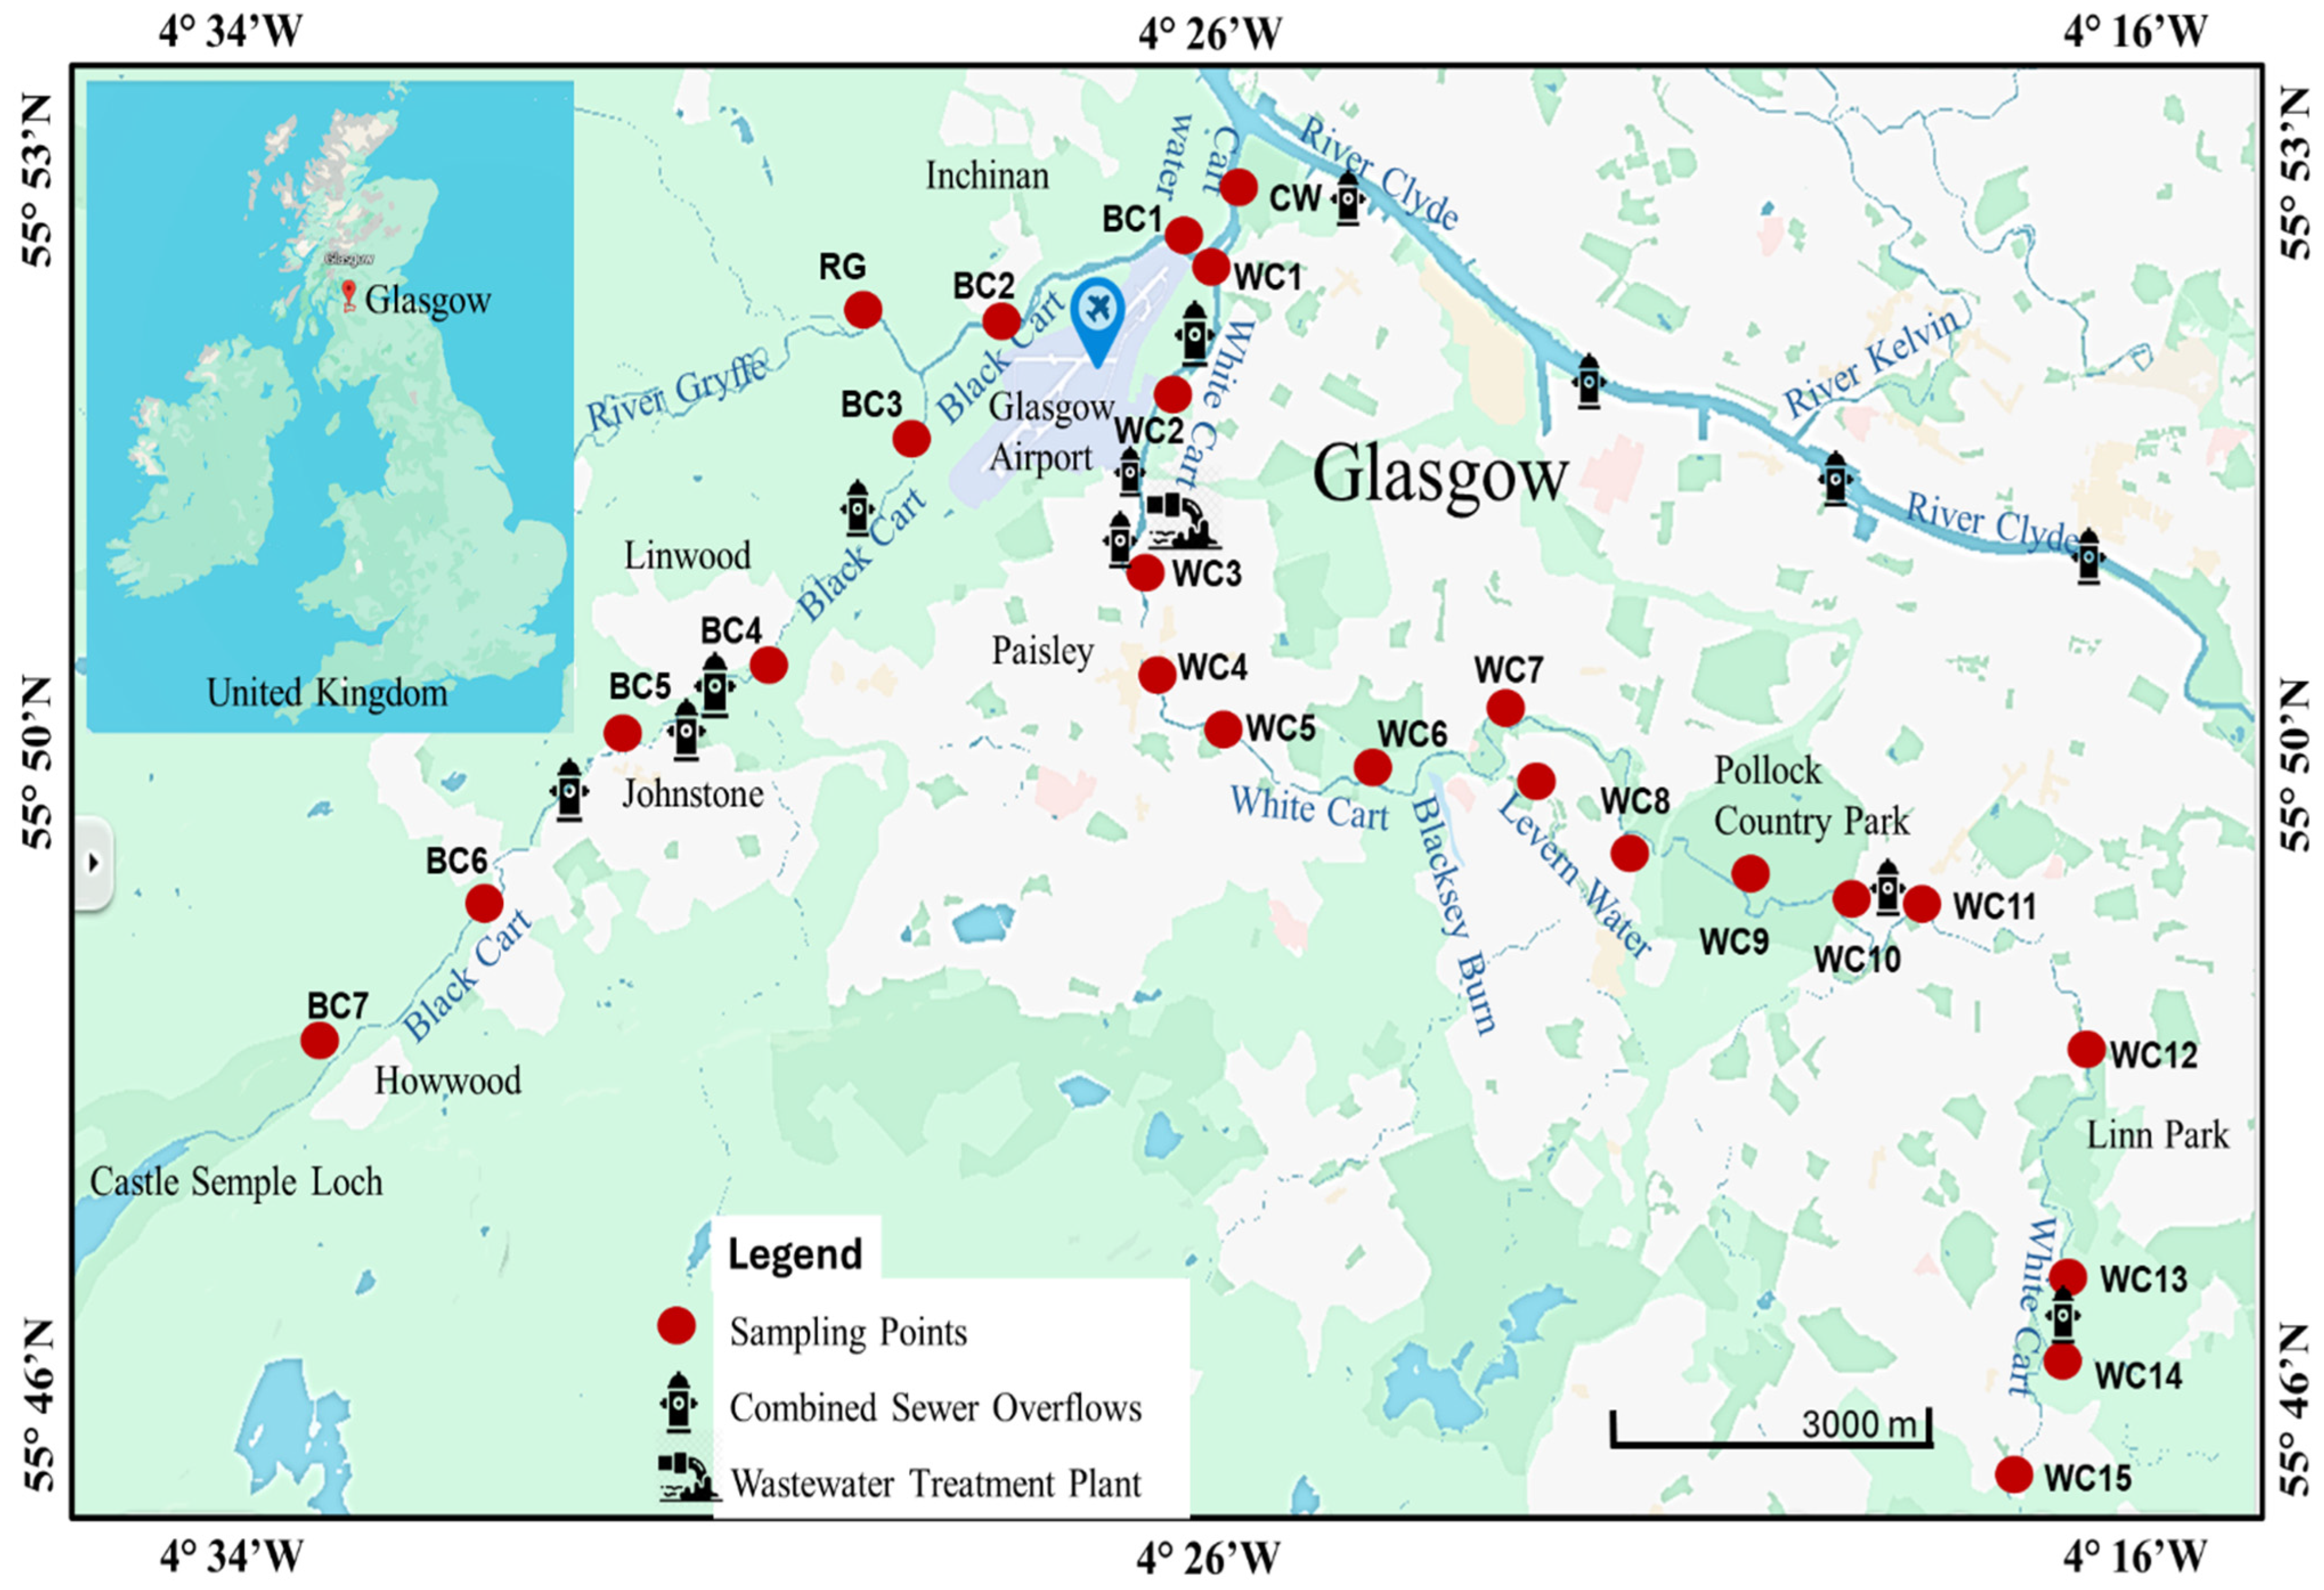
Figure 1. Map of the study area showing sampling locations.
Environments 12 00342 g001
Figure 2. Concentration of microplastics in sediments of the Black Cart (A) and White Cart (B) Waters. Values are mean ± SD (n = 3). Letters indicate groups of sites with statistically similar concentrations (p < 0.05).
Environments 12 00342 g002
Figure 3. Images and FTIR spectra of some microplastics isolated from sediments of the Black and White Cart Waters compared to reference spectra obtained for pure polymers on the same instrument. (A) is PE, (B) is PS, (C) is PP, (D) is PVC, (E) is PA, (F) is PTFE, (G) is PET and (H) is silicone.
Environments 12 00342 g003
Figure 4. Spectra of a microplastic particle identified as cellophane by the FITR matching software (version 9.9.509) (A) and of an actual sample of cellophane (B).
Environments 12 00342 g004
Figure 5. The shapes (A), colours (B), and compositions (C) of microplastics found in the sediments of the Black Cart Water.
Environments 12 00342 g005
Figure 6. Examples of PTFE microplastics identified from sites BC4 (A) and site BC5 (B) of the Black Cart Water.
Environments 12 00342 g006
Figure 7. The shapes (A), colours (B), and composition (C) of microplastics found in the sediments of the White Cart Water.
Environments 12 00342 g007aEnvironments 12 00342 g007b
Figure 8. The CFs of microplastics in sediments of the Black Cart (A) and White Cart (B) Waters.
Environments 12 00342 g008
Figure 9. The PLI (A) and PERI (B) of the Black and White Cart Waters.
Environments 12 00342 g009
Table 2. Land-use features in the vicinity of sampling locations.
Site NameSite CoordinatesCurrent Land Use Within 500 m
CW55°53′00″ N, 4°24′54″ W Agricultural land, boat club, hotel
BC155°52′51″ N, 4°24′45″ WAgricultural land, airport runway
BC255°52′30″ N, 4°26′34″ W Agricultural land, airport runway, residential buildings
BC355°51′43″ N, 4°27′42″ WAgricultural land with few buildings
BC455°50′41″ N, 4°29′11″ WPark playground, car parks and major motorway
BC555°50′16″ N, 4°30′45″ WShopping complex and museum
BC655°49′35″ N, 4°32′05″ WAgricultural land with few buildings, parks and shopping complex
BC755°48′38″ N, 4°33′52″ WAgricultural land, railway station, residential buildings
RG55°52′30″ N, 4°28′03″ W Agricultural land with few buildings
WC155°52′41″ N, 4°24′34″ W Residential buildings with large green areas
WC255°52′15″ N, 4°24′54″ WIndustrial estates with wastewater treatment plant
WC355°51′05″ N, 4°25′19″ WIndustrial estate, old shipping yard, shopping complex
WC455°50′34″ N, 4°25′08″ WShopping complex, hotel, major road bridge
WC555°50′19″ N, 4°24′11″ W Residential buildings, green areas and ongoing building projects
WC655°50′06″ N, 4°22′45″ WAgricultural land, residential buildings
WC755°50′30″ N, 4°21′39″ WSchool, sparse residential buildings and park playgrounds
WC855°49′53″ N, 4°20′09″ WDeveloped and ongoing residential building projects, sports park
WC955°49′35″ N, 4°19′03″ W Country Park
WC1055°49′25″ N, 4°17′57″ WResidential buildings with green areas.
WC1155°49′28″ N, 4°17′06″ WDensely populated residential areas
WC1255°48′47″ N, 4°15′29″ WDensely populated residential areas, park playground
WC1355°47′28″ N, 4°16′04″ WDensely populated residential area, park playgrounds
WC1455°46′52″ N, 4°15′57″WResidential settlement, major road bridge, shopping complex
WC1555°46′14″ N, 4°16′39″ W Agricultural land with few buildings
LW55°50′11″ N, 4°21′30″ WSparse settlements, major motorway, park playground
Table 3. Abundance and characteristics of microplastics found in surface waters of the White Cart.
SiteAbundance (Items/m3)ShapesColoursPolymer
WC6200* Fragments (75%)
Films (25%)
Black, green, white* PE (75%)
PP (25%)
WC9100 Fibres (50%)
* Fragments (50%)
Black, white Cellulose (50%)
* PP (50%)
WC12150* Fragments (100%)Red, white* LDPE (33%)
* PP (67%)
WC13100 Fibres (50%)
* Fragments (50%)
Blue, white Cellulose (50%) * PP (50%)
Where * is fragment, † is film, and ‡ is fibre.
Disclaimer/Publisher’s Note: The statements, opinions and data contained in all publications are solely those of the individual author(s) and contributor(s) and not of MDPI and/or the editor(s). MDPI and/or the editor(s) disclaim responsibility for any injury to people or property resulting from any ideas, methods, instructions or products referred to in the content.