Article

Identifying Circular City Indicators Based on Advanced Text Analytics: A Multi-Algorithmic Approach

1
ArDiTec Research Group, Department of Architectural Constructions II, Higher Technical School of Building Engineering, Universidad de Sevilla, Av. Reina Mercedes 4-a, 41012 Seville, Spain
2
Faculty of Computer and Data Sciences (CDS), Case Western Reserve University (CWRU), 10900 Euclid Ave, Cleveland, OH 44106, USA
*
Author to whom correspondence should be addressed.
Environments 2025, 12(1), 1; https://doi.org/10.3390/environments12010001
Submission received: 21 November 2024 / Revised: 19 December 2024 / Accepted: 23 December 2024 / Published: 25 December 2024

Abstract

:
Circular Economy (CE) and circular cities are recognized as essential approaches for achieving sustainability and fostering sustainable urban development. Given the diverse definitions and principles, multidimensional complexities, and lack of a comprehensive list of CE indicators, this study aims to propose an innovative method for identifying macro-level indicators to assess urban circularity. This methodology combines a systematic literature review (SLR) with advanced machine learning (ML) and natural language processing (NLP) techniques. A multi-algorithmic approach, incorporating BERT, TF-IDF, Word2Vec, graph-based and clustering models, is employed to extract a comprehensive set of indicators from reputable scientific articles and reports to compare frequency and similarly based on each model. The overlap and accuracy of results from these five methods are analyzed to produce a refined list of indicators with high precision and alignment with core CE principles. This curated collection serves as a valuable tool for policymakers, urban planners, and designers, enabling the prediction of future trends in urban circularity. Additionally, it provides guidance for research and practical projects at various scales, from buildings and neighborhoods to entire cities, facilitating a more precise assessment of sustainability and circularity in modern urban environments.

1. Introduction

The rapid growth of the global population and increasing demand for resources have intensified the limitations of linear economic models based on the “take-make-dispose” paradigm, leading to severe environmental crises and the depletion of natural resources [1,2]. In response, the circular economy (CE) has emerged as a novel, globally adopted development model that promotes responsible and cyclical use (closed-loop usage) of resources [3], aiming to minimize environmental impacts and enhance socio-economic well-being [4,5]. This approach encompasses three primary levels: the micro level (products and consumers), the meso level (industrial parks), and the macro level (cities and larger regions) [6,7].
Today, cities and other urban settlements host more than half of the global population and generate approximately 70% of the global GDP, despite occupying only 2% of the total land area [8,9]. Cities are not only major drivers of global environmental change but are also particularly vulnerable to its consequences [10,11]. Additionally, cities face various socio-economic issues, such as increasing inequalities, unemployment, poverty, and social exclusion [12].
The CE model is increasingly recognized not only in the context of industrial transformations but also as a promising pathway toward achieving sustainable urban development [13,14,15,16,17]. However, despite the growing interest in CE, there remains a lack of a unified framework or definition to assess and evaluate the circularity of cities—key symbols of sustainable urban development—particularly at the macro level [18,19]. Existing indicators and frameworks predominantly focus on the micro and meso levels, while the macro level, due to its complexity and varied evaluation dimensions, requires specific frameworks and indicators tailored to cities and large urban regions [20,21,22].
The core principles of the CE, which are mentioned in Table 1, provide a foundational framework for developing CE-based urban economic models. These principles, often referred to as the “R” principles, are designed to retain the value of materials within consumption cycles, promoting extended use and durability [23,24].
Scholars have explored how CE principles can be adapted at the city level, conceptualizing circular cities from various perspectives (e.g., [8,37,43,44,45]). This framework empowers cities with the capacity and determination to drive the shift toward a more sustainable and resilient future [23]. However, CE principles are interpreted and applied differently across regions and stakeholders, often influenced by specific local interests and priorities [6,14,26,36,39].
At the policy level, CE frameworks are essential for achieving Sustainable Development Goals (SDGs), as they provide effective tools for urban-scale challenges, such as pollution reduction, resource conservation, and socio-economic improvements. For example, the European Union, China, and countries such as Australia, have developed comprehensive CE policies and roadmaps aimed at fostering sustainable and resilient urban development. Notably, China was among the first countries to adopt a formal strategy for CE through its Circular Economy Promotion Law (2009), which serves as a legislative framework for implementing CE principles at multiple levels [46,47,48,49]. Despite these efforts, the approach remains far from a comprehensive, unified framework. Different countries are exploring these principles in various ways, each adapting CE frameworks to meet local needs, limitations, and ambitions. This important issue emphasizes the need for frameworks based on integrated and comprehensive indicators, which, with a focus on innovation and advanced technologies, not only reduce pollution, alleviate environmental pressures, and improve resource management, but also contribute to sustainability and enhance the quality of urban life [5,25,50]. A circular city is defined as an urban environment that systematically integrates CE principles to create sustainable, closed-loop systems. These cities aim to retain materials and resources within the urban cycle, minimizing waste and reducing environmental impacts [10,51,52]. Fundamentally, a circular city supports regenerative and self-sustaining operations, emphasizing local resources, stakeholder collaboration, and resilience—collectively reducing environmental harm and promoting sustainability. Circular cities actively engage stakeholders, including citizens, businesses, and municipal bodies, in building resilient urban systems that prioritize resource longevity and circular design. According to Prendeville et al. [37], key strategies in circular cities include the adaptive reuse of buildings, retrofitting, and redeveloping degraded areas, which align with CE principles of reuse, refurbishment, and repurposing. Circular cities aim to separate economic growth from raw material consumption by reducing resource inputs, maximizing utility, and minimizing waste [53].
Core elements of circular cities include urban bio-economy practices, material recovery, and local production systems emphasizing value loops and industrial symbiosis [32]. Numerous cities worldwide have adopted circular initiatives focused on sustainable procurement, urban refurbishment, and efficient public utilities management [8,37,54,55]. However, these cities face challenges, such as the complexity of tracking circular practices across sectors and adapting regulatory frameworks to align CE goals with existing infrastructure [55,56]. Furthermore, circular cities prioritize socio-cultural and environmental sustainability by creating networks that enhance social equity, urban resilience, and resource efficiency [57,58,59,60]. Modular and adaptable building and infrastructure designs promote extended use, shared utilization, and easy disassembly, contributing to resource conservation [32,47]. This model also fosters high-tech innovation, job creation, and community empowerment, ultimately enhancing quality of life [61,62].
Given that establishing a single universal definition for CE is nearly impossible due to its dynamic and evolving nature [30] and recognizing that CE operates across three levels—micro, meso, and macro—with the aim of achieving sustainable development encompassing environmental quality, economic prosperity, and social equity [21,63], it is crucial to develop new approaches to identify CE indicators across various scales.
Cities, although smaller in scale compared to regions or nations, operate as complex systems that integrate multiple socio-economic and environmental factors, characteristics typically associated with macro-level systems. These factors include urban planning, policy implementation, economic activities, and large-scale resource management [64,65]. Cities play a critical role in driving systemic change in relation to sustainability and CE principles. As hubs for innovation, economic activity, and governance, they are uniquely positioned to implement large-scale policy frameworks that affect not only urban environments but also surrounding regions. Moreover, cities possess the infrastructure, resources, and governance frameworks necessary to adopt and enforce CE practices, contributing significantly to both economic and environmental outcomes [66,67]. For these reasons, cities are classified at the macro level due to their critical role in shaping sustainability outcomes and implementing systemic changes that align with regional, national, and global sustainability goals. Their ability to integrate CE practices and influence the three dimensions of sustainability—economic, environmental, and social—reinforces their placement at the macro level [19,61,68].
In essence, circular cities incorporate CE principles into all urban functions, leveraging digital technologies, local partnerships, and sustainable practices to establish regenerative, future-proof urban systems [3,29]. This holistic approach not only supports sustainable urban development but also decouples economic growth from natural resource consumption, ensuring long-term resilience and prosperity for urban communities. Additionally, circular cities play a critical role in addressing socio-economic challenges, reducing carbon emissions, and fostering resilience to environmental pressures [69].
In Table 2, the state-of-the-art regarding the main principles and concepts related to CE, circularity at the macro level, and the focus on circular cities is explained. The macro level includes broader systems such as regions, nations, and global frameworks. While circular cities are a significant component of this level, they represent only a part of the larger system, which is crucial for defining the Circular City Indicators (CCIs) in the methodology and results sections.
CE indicators play a pivotal role in knowledge transfer and creating alignment among diverse stakeholders, especially when frameworks and a shared language are established. These efforts support ongoing, comprehensive evaluations of circularity status and progress, ultimately contributing to the effective realization of CE objectives in urban contexts. Indicators serve as essential tools in assessing and measuring progress toward achieving CE goals and determining the level of circularity in cities. Comprising both quantitative and qualitative variables, indicators provide precise insights into the current state and developments toward a circular system. They are utilized through indicator-based frameworks to offer a comprehensive and holistic view of urban circularity [76,77,78]. Indicators are not merely facilitators in the assessment process; they play a fundamental role in realizing and optimizing CE practices [16]. Quantitative and qualitative metrics, along with diverse frameworks, provide a structured approach to measuring the effectiveness and progress of CE initiatives. These tools create a common understanding among stakeholders, facilitating discussions and the implementation of CE across various levels [39,79].
In general, CE indicators are defined across three levels: the micro-level (products and consumers), the meso-level (industrial parks), and the macro-level (regions and cities). At the macro level, due to the inherent complexities and multidimensional aspects of urban areas, specific indicators are needed to effectively measure and monitor circularity on an urban scale. These indicators should address core principles of the CE, such as reducing natural resource consumption, increasing the share of renewable resources, minimizing waste production, and enhancing product durability [14,15,52]. Given the diverse nature of cities, macro-level indicators may have different priorities in each urban context. However, for a comprehensive evaluation of circularity at this scale, it is essential to consider all CE principles. While some principles may take precedence over others depending on the urban context, none should be entirely overlooked, as focusing on these principles facilitates the creation of more sustainable cities with improved resource management.
Indicators, as variables that provide quantitative and qualitative information, are crucial in improving decision-making and evaluating performance in alignment with CE and circularity goals. Although some aspects of urban circularity may not be entirely quantifiable, both quantitative and qualitative indicators are essential for a well-rounded assessment. This combination, particularly within frameworks that establish shared understanding and tangible goals, is invaluable [16,39].
Efforts to standardize circularity measurement continue, particularly at national or European scales. The Ellen MacArthur Foundation introduced a Circularity Baseline with indicators based on resource productivity, circular activities, waste generation, and energy and greenhouse gas emissions, demonstrated through a case study in Denmark [3]. The European Union recently published a framework for monitoring the CE with ten indicators, covering areas such as production and consumption, waste management, secondary raw materials, competitiveness, and innovation [47]. The EU also developed the Eco-Innovation Index, which evaluates eco-innovation performance across member states through 16 indicators in five dimensions: eco-innovation inputs, activities, outputs, resource efficiency, and socio-economic outcomes [32]. Similarly, the Chinese government has worked on CE indicators, primarily focused on resource efficiency [19].
Also, in recent years, significant research efforts have been dedicated to identifying and categorizing CE indicators across various levels. For instance, Linder and Williander [43] reviewed micro-level indicators focused on assessing product circularity by evaluating criteria that enhance circularity at the product level. Moving to broader levels, Pauliuk [40] proposed indicators that span all three system levels, along with a dashboard of key metrics for evaluating CE strategies at organizational and product levels. Saidani et al. [16] further categorized CE indicators into three levels and identified 19 macro-level indicators, although only three specifically addressed urban circularity. Similarly, Elia et al. [15] identified 16 CE-related indicators across three system levels, assessing them against five essential CE requirements (reducing input and use of natural resources, reducing emission levels, reducing valuable material losses, increasing the share of renewable and recyclable resources and increasing the value durability of products). Corona et al. [14], while not categorizing indicators explicitly by system level, examined indicators based on criteria such as resource consumption reduction and product durability. Parchomenko et al. [39] used multiple correspondence analysis to evaluate 63 indicators, clustering them into three primary categories: resource efficiency, material flow, and product-focused indicators.
While recent studies have made progress in identifying and categorizing CE indicators, but they have primarily focused on the micro and meso levels, with limited attention given to macro-level or urban-scale indicators. Studies by Fusco Girard and Nocca [80] and Gravagnuolo et al. [81] have considered urban-level indicators, but their focus has often been on individual indicators rather than comprehensive frameworks to evaluate CE at the urban scale.
One notable gap in prior research is the limited use of advanced methods, such as ML, for systematically identifying and categorizing comprehensive CE indicators at the urban level in order to achieve circular cities. Consequently, a unified, systematic list of urban-focused CE indicators has yet to be established. To address these gaps, this study presents an innovative approach for identifying CE indicators specifically for urban contexts. By leveraging ML algorithms and text analysis, this approach aims to systematically extract and categorize CE indicators at the macro level, introducing a methodology that has not been previously applied in this field. In total, CE indicators—spanning multiple system levels—are instrumental in guiding cities toward circularity. They enhance decision-making, improve resource management, and help achieve sustainable development by offering a well-rounded assessment. This approach of integrating both quantitative and qualitative indicators within shared frameworks is vital for realizing tangible CE goals, fostering alignment among stakeholders, and enabling effective monitoring and evaluation of CE progress across urban environments. In the evolving field of circular cities, identifying robust and comprehensive indicators is essential for assessing urban circularity at the macro level. This research introduces an innovative, data-driven approach, laying the foundation for future studies and enabling cities to better evaluate their progress within the context of the CE at the macro scale. Despite significant progress in identifying and categorizing CE indicators at various levels, most studies have primarily focused on micro and meso levels. This research aims to fill the existing gaps in urban circularity studies by developing a data-driven methodology for evaluating urban-level CE indicators. These indicators are critical for enhancing resource management, improving decision-making, and achieving sustainable urban development. By leveraging advanced analytical techniques, this study contributes to the ongoing efforts to standardize circularity measurement at the urban scale.
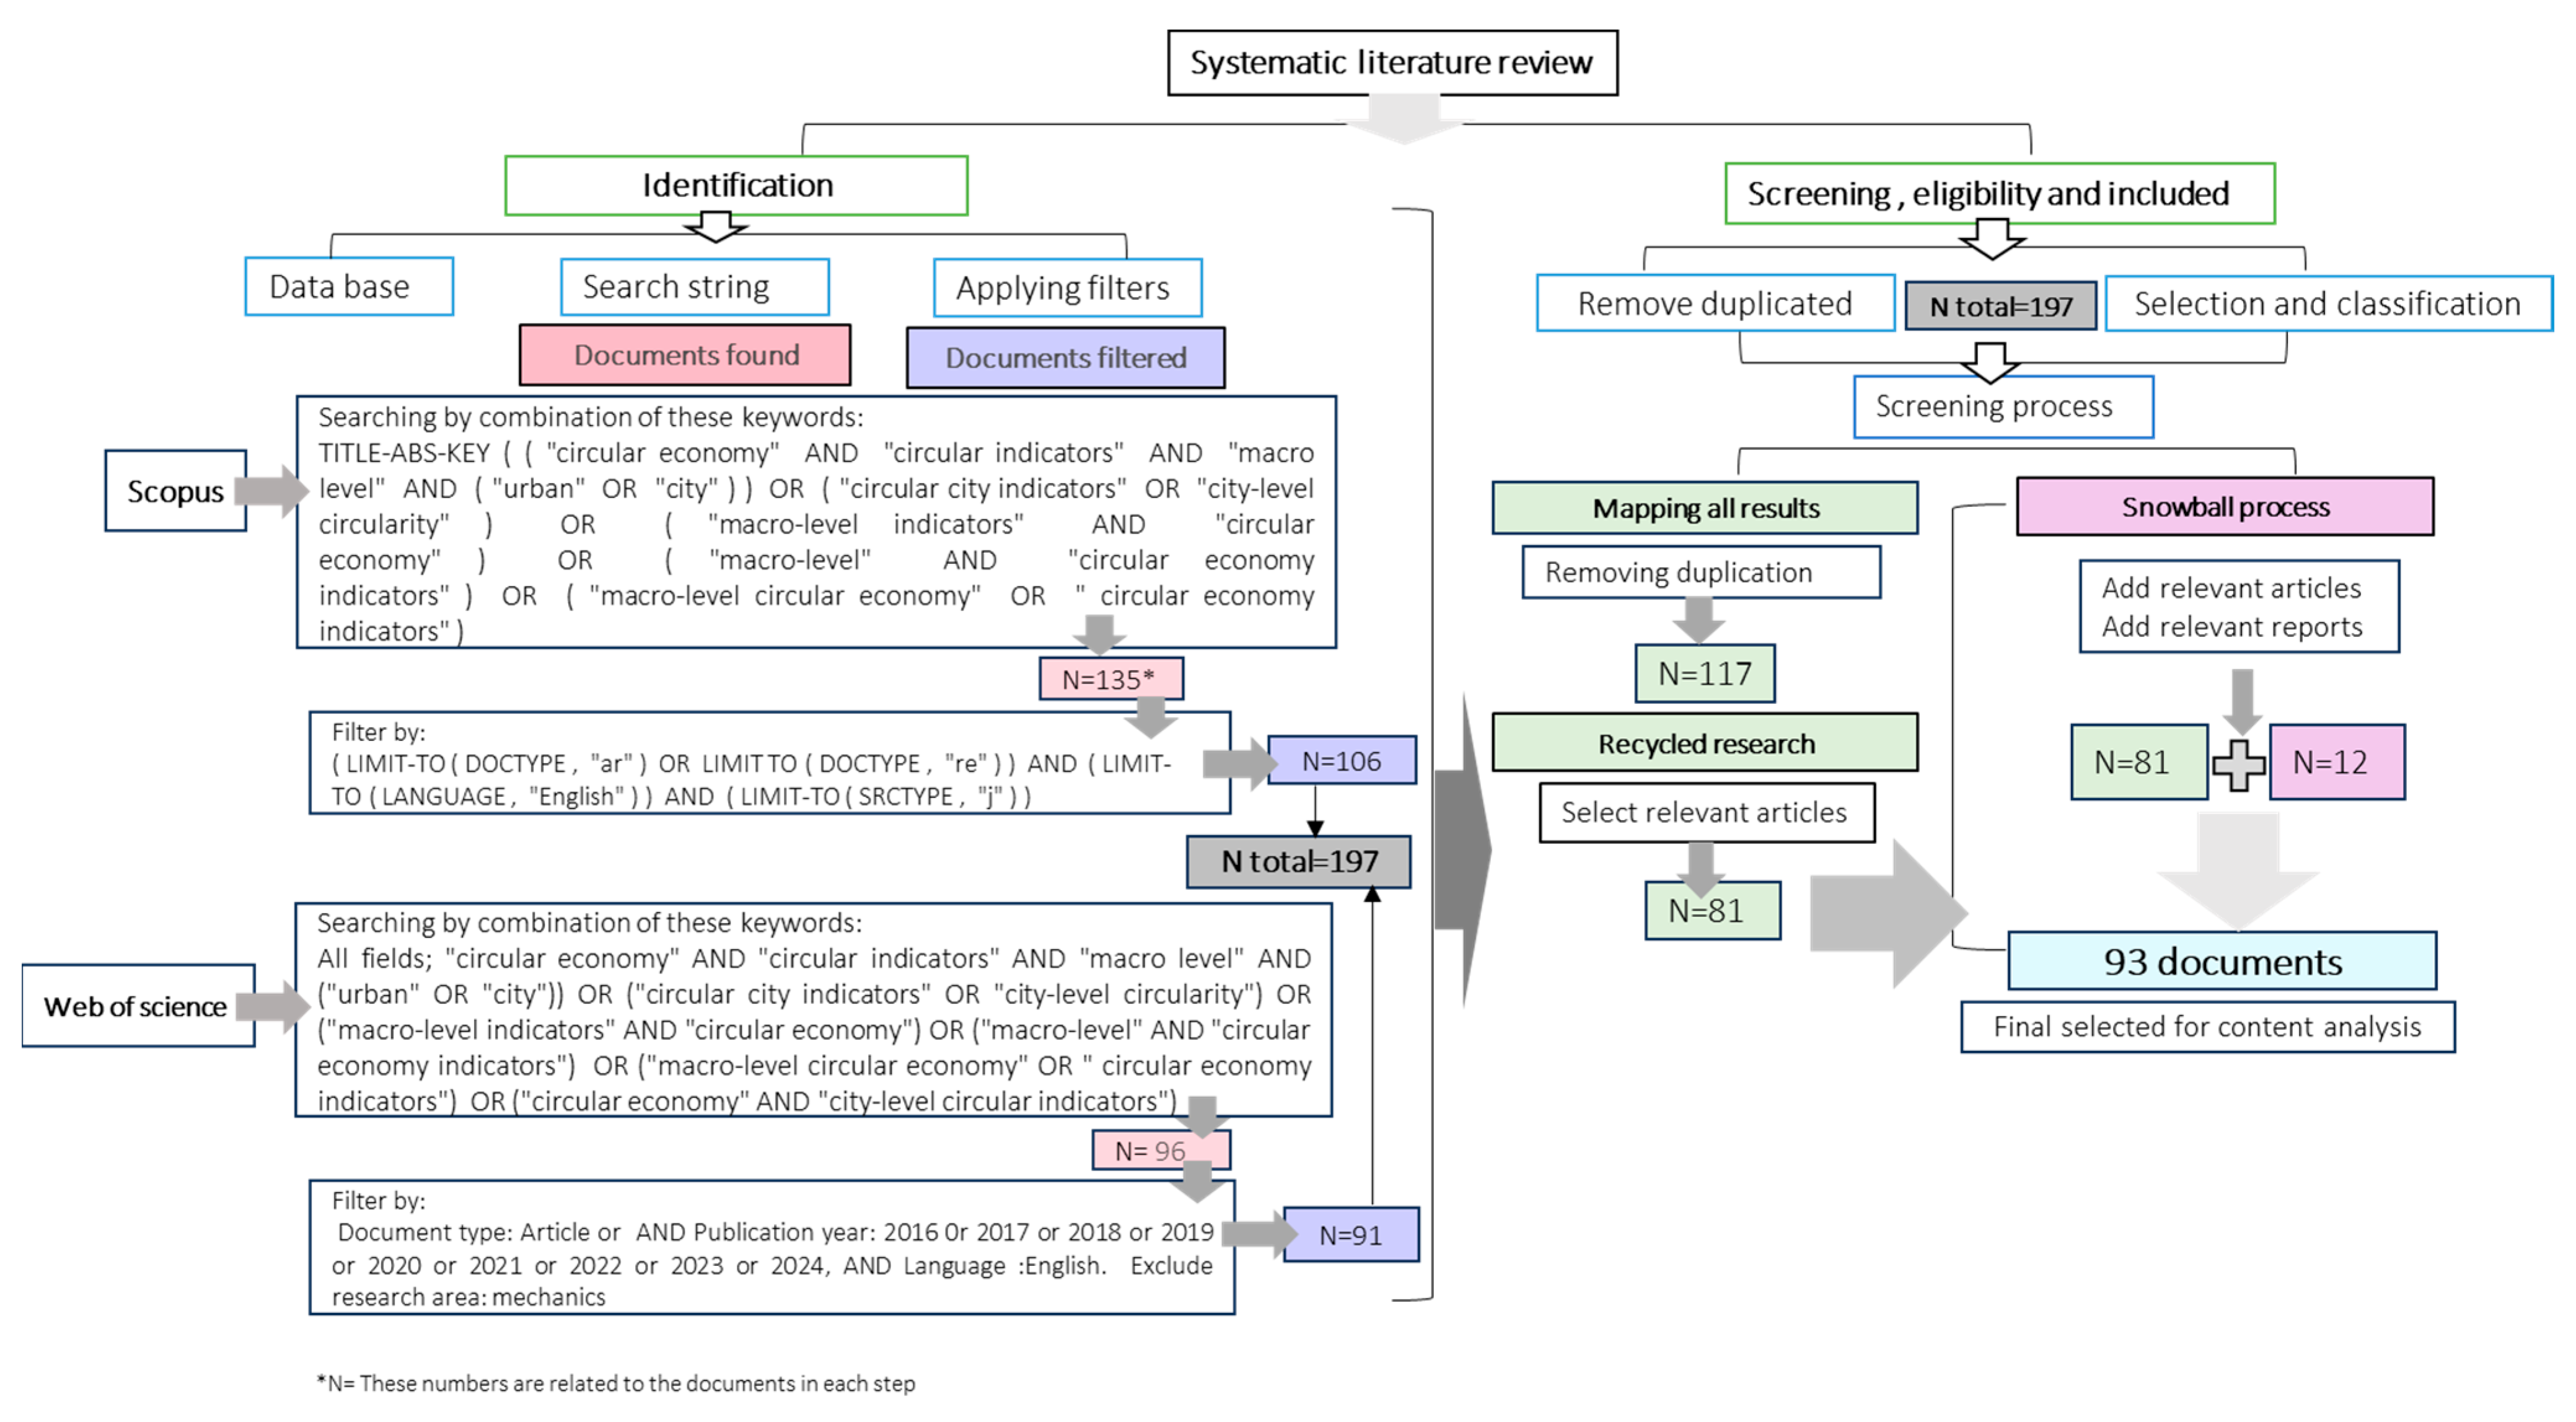
This study employs a combination of systematic literature review and advanced machine learning techniques to extract comprehensive and reliable indicators for evaluating urban circularity. By utilizing advanced algorithms, this approach analyzes relevant scientific literature and reports to create an extensive list of CE indicators that align with circularity principles and macro-level urban needs [21,23,82]. Due to the structure and performance of these methods and the minimal human intervention required, this list can serve as a foundation for developing strategies and evaluating CE indicators in future research.
The methodology and stages of this approach are comprehensively detailed in the following sections of this paper, presenting a novel framework for assessing circularity at the macro-urban level.

2. Materials and Methods

This research employs a mixed deductive and inductive methodology, utilizing systematic literature review and text analyzing/text semantic techniques to recognize CCIs at the macro level and city scale to collect and create a comprehensive list through multi-algorithmic approaches and systematic analysis of existing articles.

2.1. Systematic Literature Review

To create a comprehensive dataset of indicators related to the CE at the city level and the macro level, a systematic literature review of the databases Scopus and Web of Science is conducted. This search utilizes keywords such as “circular economy”, “circular economy indicators”, “city-level circularity”, “macro-level CE indicators”, and “circular city indicators”, with the timeframe set from January 2016 to September 2024. The process of literature review is explained in Figure 1.
After applying filters based on document types, language, and research areas, a total of 106 articles are retrieved from Scopus and 91 articles from Web of Science. The selected articles are required to explicitly measure circularity at the city level and address CE principles at the macro level. A total of 197 articles are examined, and after considering overlapping articles between the two academic literature databases, those that are not relevant to the research objectives are excluded, resulting in a final count of 81 articles.
Subsequently, using the “snowball sampling” method, additional relevant articles are identified by reviewing the references in the selected papers, which involved scanning articles, authors, and organizations from the initially identified documents. The process identified 12 documents (four articles and eight reports), which were added to the collection. The inclusion criteria specified that the indicator sets of documents must clearly measure city circularity. Ultimately, the total number of articles reached 93. These articles serve as the foundation for the ML process and the continuation of the methodology in this research.

2.2. Process of Data Preparation and Text Analysis

The methodology process for data preparation and text analysis in ML is represented in Figure 2.

2.2.1. Preparation of Text Data

In this step, text data are converted from PDF files to text format to enable processing and analysis using NLP [82,83,84,85]. All individual text files are then combined into a single text file to ensure efficient and uniform processing.

2.2.2. Initialization and Regular Expressions

This step involves loading the SpaCy natural language model and defining regular expression patterns for text cleaning [63,86]. Various patterns are created to remove URLs, email addresses, and other unnecessary characters, preparing the text for analysis.
Text cleaning functions are designed for normalization, expansion of contractions, and removal of entities to ensure the text is uniform and coherent for analysis [63]. These functions help guarantee data quality and allow for more accurate analyses [83,84,86].
Comprehensive text preprocessing functions are applied comprehensively to prepare the text fully [63,85]. This includes converting text to lowercase, normalizing characters, and removing extra spaces to optimally ready the data for subsequent analyses.
This main function orchestrates the application of the above methods, accepting a string of text and optional parameters to control preprocessing steps. The output result is shown in Table 3.

2.2.3. Resource Initialization and Setup

  • This step includes loading necessary resources from the NLTK (a comprehensive Python library for NLP) library) and SpaCy (a powerful, efficient Python library for advanced NLP tasks) models for text processing [63,86,87]. Additionally, the model’s setup is prepared to accelerate data processing, enhancing efficiency and accuracy. A dictionary of circularity-related keywords is initialized, assigning a baseline importance score to each. See Appendix A Table A1 and Table A2. This is formed by functions, theme identification, evaluation, and output.
Functions refer to key functions for recognizing CCIs; they are designed in this section to aid in the analysis and identification of relevant criteria. These functions utilize normalization and phrase-matching capabilities to facilitate more precise criteria identification.
  • Evaluate indicator: This function assesses whether a piece of text meets specific criteria to be considered a relevant circular indicator. It employs lemmatization to simplify words to their base forms and uses SpaCy’s phrase-matching capabilities to check for the presence of quantifiable and principle-linking keywords (Table A1).
  • Precompute keyword embeddings: Pre-computes BERT embeddings for predefined circularity keywords to facilitate quick and efficient similarity calculations during analysis.
  • Batch encode phrases: Encodes phrases in batches using BERT to optimize memory usage and computational speed, which are particularly useful when processing large volumes of text data [82,85,90,91].
These steps are based on Table 1 and Table 2. The process of criteria selection for the keywords selection is summarized in Table A1 and Table A2. All keywords are assigned equal importance and weight in the calculations, meaning each keyword equally influences the scoring of indicators without any additional weighting adjustments. This ensures that all aspects of circular cities and CE are considered uniformly in the analysis.
The theme identification with advanced algorithms is the stage where various algorithms are employed for extracting key phrases and analyzing data [84,92]. These algorithms include the use of BERT, TF-IDF, Word2Vec, cluster and graph models, which assist in identifying themes related to CE. The structure of each algorithm is defined in Table 4.
These five models are selected for their distinctive features, which include high semantic accuracy (through BERT-based Phrase Extraction and Word2Vec Phrase Analysis), multidimensional analysis (by combining Enhanced TF-IDF Analysis, Graph-based Analysis, and Clustering-based Topic Identification models), and compatibility with extensive text data (in the BERT and Enhanced TF-IDF models) [82,85,90,91,94]. Additionally, these models focus on frequency and term importance, which aids in identifying key indicators, and they provide a more comprehensive view of core CE topics through topic-based clustering structures [63,82,87,90,91]. The Graph-based Analysis model, using centrality measures like PageRank, analyzes semantic relationships and identifies meaningful indicators. This combination creates a precise and comprehensive framework for extracting CCIs.
Finally, in the evaluation and output stage, the results from all algorithms are compiled and analyzed to assess their effectiveness and overlap. This step contributes to ensuring reliable and useful data for the research, leading to improved accuracy in future analyses [85,87,90]. Each algorithm produces a list of indicators with the highest scores and frequencies, reflecting their emphasis and relevance in the text; as it was mentioned, this scoring is based on Table 1 and Table 2 and Appendix A Table A1 and Table A2.
These lists are reviewed and validated in the Results section, where statistical measures are calculated, and the coverage of CE keywords across the extracted phrases is determined.

3. Results

The initial set of the proposed indicators across the evaluated algorithms is extensive. Through a content-based review, Indicators with scores below 0.40 are excluded due to insufficient accuracy, ensuring the reliability and relevance of the remaining data. This refinement allowed for a focused selection on higher-scoring indicators, yielding a more cohesive and relevant list Table 5. Consequently, Table 5 presents only those indicators with the strongest relevance and scores; weaker entries from the preliminary list are systematically excluded. The final list of the indicators is in Table A3.
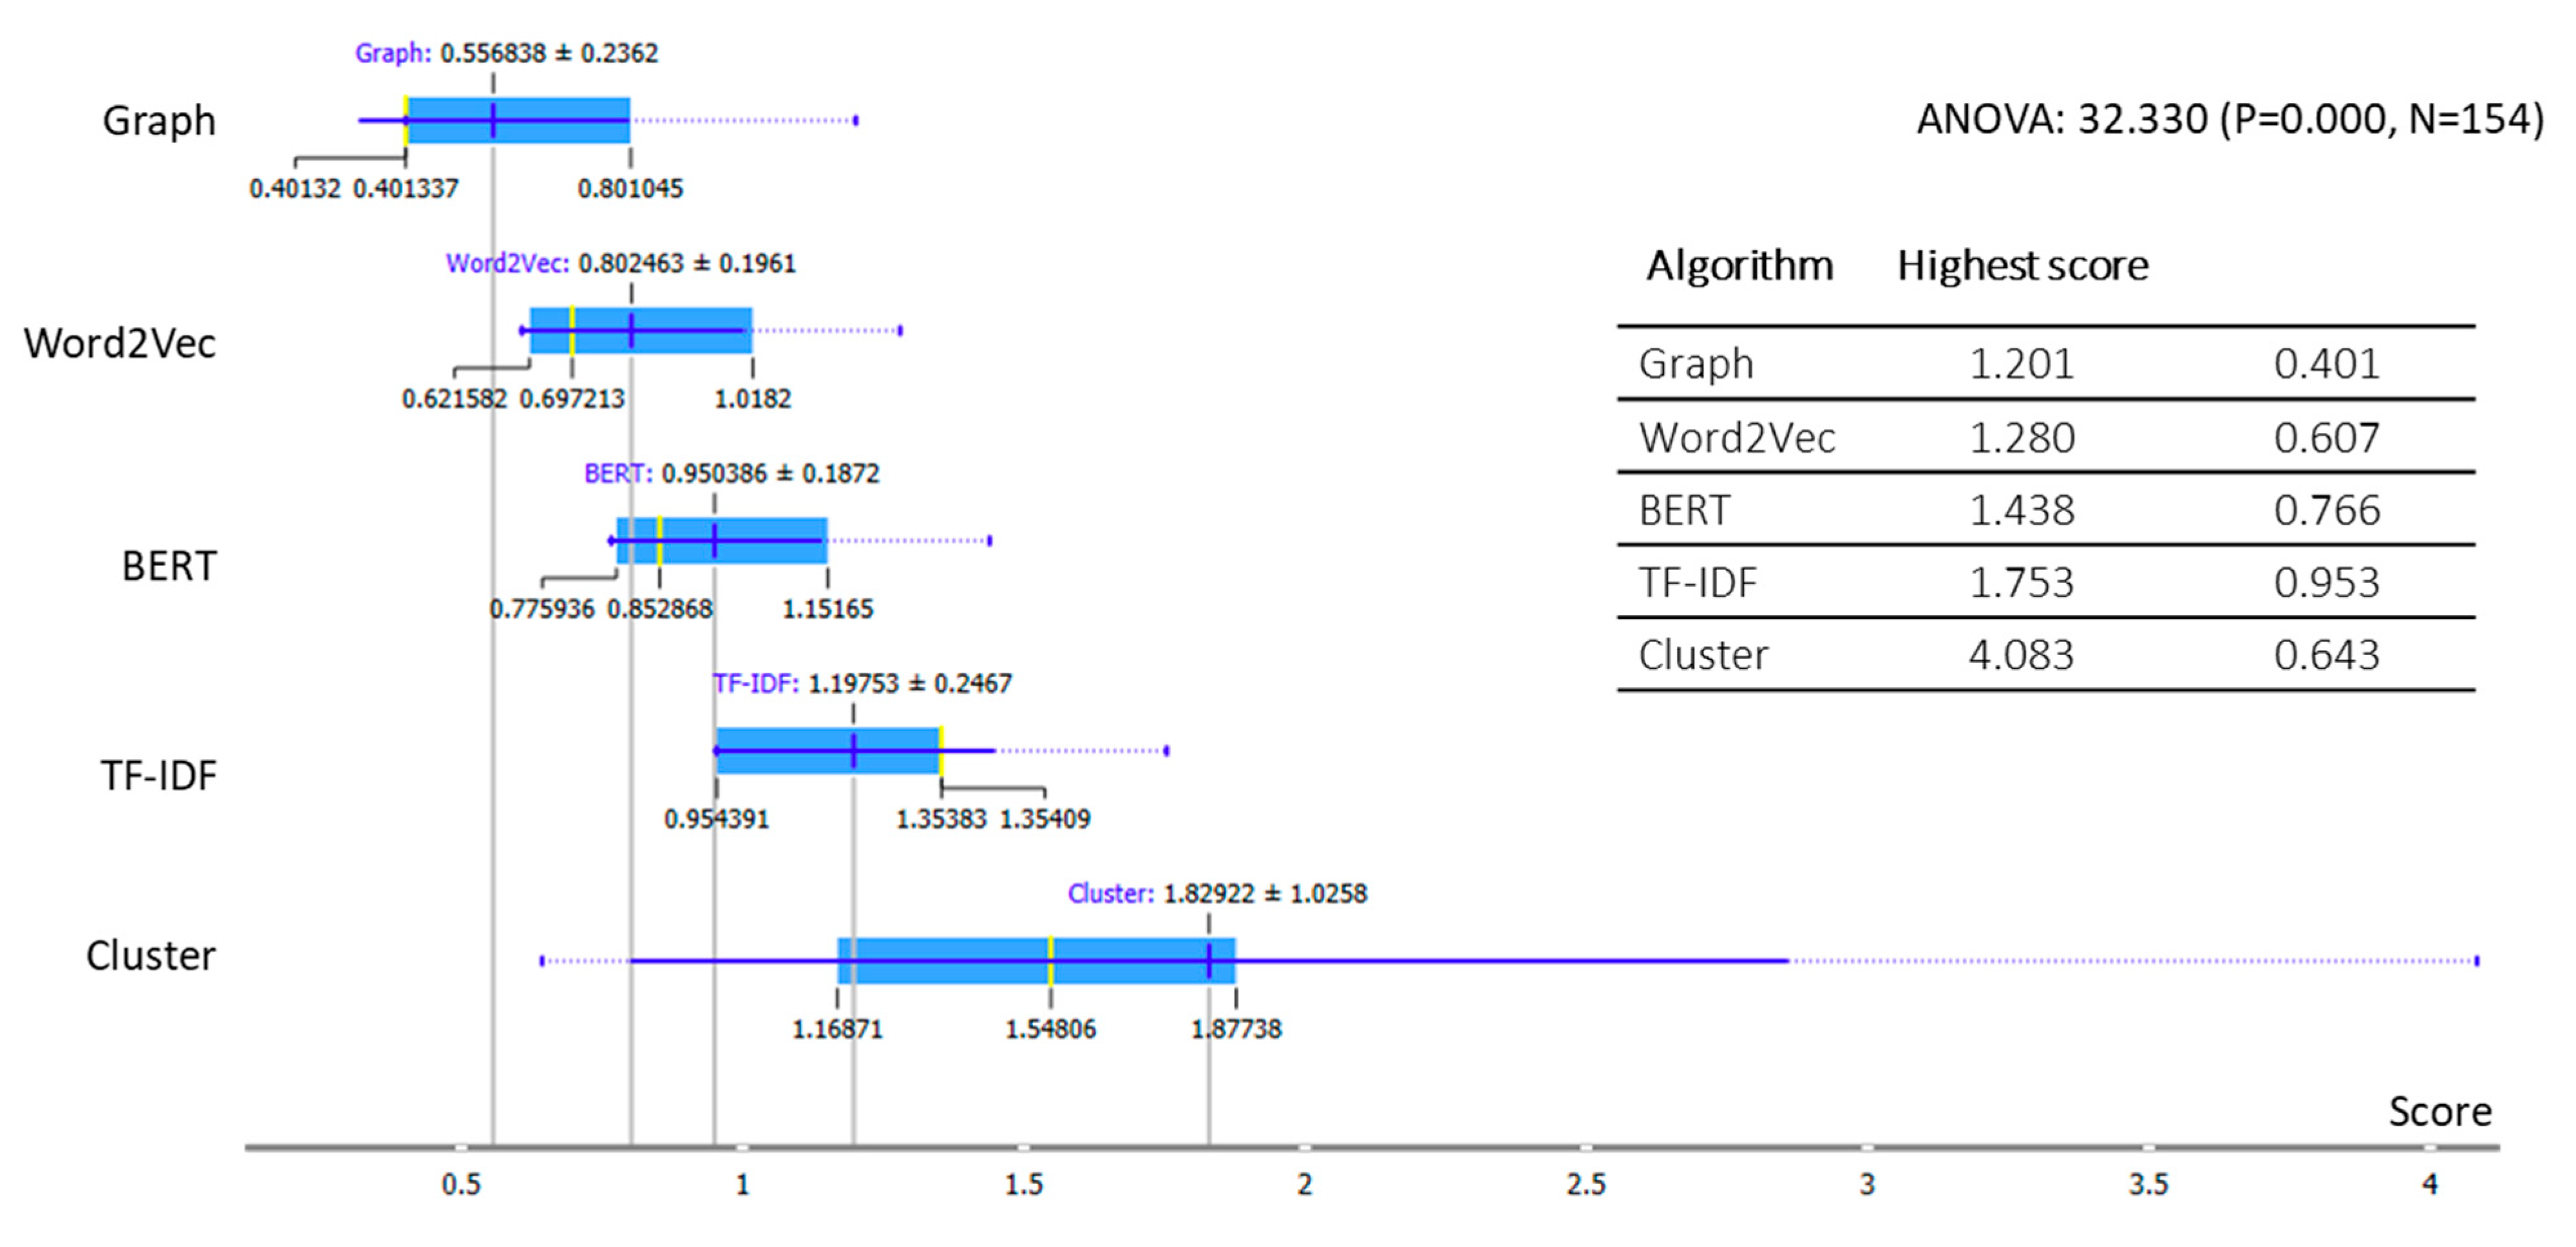
Figure 3 presents the results of an ANOVA analysis to compare different text representation methods and clustering techniques, illustrating the performance differences among them [84,86,87]. This analysis compares the performance of different algorithms in evaluating key metrics, highlighting the strengths and weaknesses of each based on their highest and lowest scores. The ANOVA test shows a significant difference among methods with F = 33.330 and p = 0.000, indicating statistically significant variance in performance across the methods (p < 0.05).
The Cluster method has the highest mean value (1.82922), followed by TF-IDF and other representation methods. The Graph method shows the lowest performance, highlighting that different text representation techniques can significantly impact model performance. These differences underline that each algorithm has varying effectiveness depending on the type of phrase it evaluates, with Cluster performing the best in terms of high scores and Graph showing lower scores in some case, as mentioned in Figure 3.
  • Highest score: The Cluster algorithm has the highest score of 4.083 for the phrase “water resource quality”, indicating its strong performance in evaluating this specific metric.
  • Lowest score: The Graph algorithm has the lowest score of 0.401 for the phrase “resource wastage amount”, suggesting it might be less effective in assessing this metric.

3.1. Distribution and Variability Analysis of Algorithm Performance

Figure 4 provides insights into the performance distribution and variability of different algorithms. The spread of individual scores highlights each algorithm’s tendencies, while the density visualization reveals consistency levels and outliers, enabling a clear comparison of stability and range across the methods.
The scatter plot shows the spread of scores for each algorithm. Cluster has the widest spread, with scores ranging up to a maximum of 4.083, and the largest bubbles, indicating higher scores and greater variability. In comparison, BERT, Graph, and Word2Vec have closely clustered scores around the lower range, with maximum values of 1.439, 1.201, and 1.28, respectively, showing limited variability. TF-IDF is more dispersed, with scores reaching 1.754, but still does not reach Cluster’s highest values. The violin plot highlights the distribution and density of scores. Cluster’s elongated shape, with scores spanning from 0.644 to 4.083, indicates high variance and the presence of outliers. In contrast, BERT, Word2Vec, Graph, and TF-IDF have narrower shapes, with maximum scores of 1.439, 1.28, 1.201, and 1.754, respectively, suggesting more consistent, lower-range performance with less variability.
Cluster has a broader range and more variability in its performance scores, achieving higher scores but with less consistency. In contrast, BERT, Word2Vec, and Graph display more stable performance with lower scores, while TF-IDF stands in between, showing moderate spread and scores. This suggests that, depending on the need for consistency versus high performance, Cluster might be suitable for scenarios where higher scores are desired, albeit with more variability.
Also, the comparison illustrates the clustering quality of different algorithms (BERT, Cluster, Graph, TF-IDF, and Word2Vec) by using Silhouette scores, which measure how distinctly each algorithm defines clusters. Higher scores indicate better separation between clusters, which can be summarized as follows:
  • BERT stands out with high Silhouette scores around 0.8, indicating excellent cluster definition.
  • Cluster displays mixed results, with scores ranging from 0.3 to 0.7, highlighting inconsistent clustering quality.
  • Graph and TF-IDF maintain stable, mid-level scores near 0.5, providing moderate clustering capabilities.
  • Word2Vec has the weakest performance, with scores between 0.2 and 0.4, reflecting poor clustering quality.
This analysis emphasizes BERT’s strength in creating distinct clusters, while Word2Vec’s lower Silhouette scores suggest limitations in clustering effectiveness. The figure related to the result of Silhouette scores is shown in Appendix A Figure A1.

3.2. Evaluation of Clustering Quality and Algorithm Performance Using Silhouette Scores

This heatmap provides two important points. First, it shows an overview of the Silhouette scores for each indicator, highlighting how well clusters are defined for different metrics. It helps readers understand the clustering quality across indicators, showcasing the complexity and clarity of clusters. Secondly, it shows the algorithm associations for each indicator, making it easy to see which algorithms perform well for specific indicators. It also highlights algorithm dominance and is useful for understanding the strengths and coverage of each algorithm, as shown in Figure 5.
  • Cluster consistently appears in the highest Silhouette score regions (bright yellow areas), indicating it is the top performer with high clustering quality across various indicators.
  • BERT shows frequent occurrences with stable, moderate Silhouette scores (pink and purple regions), indicating it provides reliable, general-purpose clustering quality.
  • Graph, TF-IDF, and Word2Vec appear primarily in the lower Silhouette score regions (dark blue and purple areas), suggesting that they have limited effectiveness in clustering and struggle to achieve well-defined clusters.
Figure 5 provides a comprehensive view of both clustering quality and algorithm applicability and coverage, making the analysis both detailed and insightful.
The analysis of various visualizations reveals distinct performance patterns across clustering algorithms. Cluster consistently achieves the highest clustering quality, while BERT provides reliable, moderate clustering performance. Graph, TF-IDF, and Word2Vec are generally less effective, showing lower clustering precision across indicators.

4. Discussion

In this section, all indicators listed in Table A3, have been analyzed for their alignment with each of the ten principles of the CE as identified by the algorithms and Table 1. This analysis reveals which principles have received the most attention in prior research and helps identify research gaps within the indicators. These indicators, supporting circularity at the city level and within the broader macro-level CE framework, have been examined based on their alignment with specific CE principles [17,33,34,52,75]. Some indicators span multiple principles, addressing two or even three dimensions simultaneously. This versatility highlights the interconnected role of these principles in advancing CE goals and strengthening sustainable, resilient urban systems.
Also, the overlap between algorithm methods and indicators is analyzed, along with the extent to which these overlaps align with other algorithms. This assessment will determine the degree to which indicators produced by one algorithm are also identified by other methods. Additionally, it will clarify relationships among clustering methods and the coverage of CE-focused indicators, demonstrating how different approaches contribute to achieving the broader objectives of the CE.

4.1. Distribution of Indicators Aligned with CE Principles

The distribution across CE principles shows a strong emphasis on “Reduction” (33%) and “Rethink” (24%), indicating a clear focus on minimizing resource use and re-evaluating consumption models, see Figure 6. In comparison, “Recovery” (11%) and “Recycling” (10%) are moderately represented, suggesting that while material recapture and resource cycling are considered, they are not as prioritized as reduction and innovation strategies. Principles like “Repair” (4%) and “Repurpose” (3%) are less prominent, highlighting potential gaps where further emphasis could support a more holistic CE approach, balancing both resource minimization and the extension of product life.
The lower representation of some principles, like “Repurpose” and “Refusal”, may be due to the inherently multi-dimensional nature of certain indicators that align more closely with other principles and, because, at this level of CE, the macro focus is on policy and long-term goals, and the large scale of case studies. Indicators often focus on primary aspects like “Reduction” and “Rethink”, due to their foundational role in sustainability and circularity in cities. Additionally, a margin of error should be considered, as some indicators might contribute indirectly to multiple principles, making precise categorization challenging. This distribution suggests that while certain areas are well-covered, there are nuances and potential overlaps that might account for the lower emphasis on some principles, highlighting areas for further exploration and refinement.

4.2. Common Themes and Shared Indicators Across All Five Algorithms

In the second part of the discussion, an in-depth analysis is conducted to explore the relationships between various algorithms and the types of indicators they identify. Using systematic similarity models, semantic alignment analysis, and clustering-based and content-based assessment, this analysis examines the extent of overlap among indicators suggested by different algorithms, as outlined in Table A3. The analysis shows a few recurring themes that appear in indicators identified by each of the five algorithms, indicating their central importance to the CE framework:
  • Waste management: Indicators such as “waste generation rate”, “waste recycling rate”, and “solid waste generation”, appear frequently across algorithms. This emphasis reflects the fundamental role of waste reduction and recycling in CE practices.
  • Renewable energy and efficiency: Concepts like “renewable energy production”, “renewable energy consumption”, and “energy efficiency” are present across multiple algorithms, highlighting the importance of energy sustainability within the CE.
  • Circular material use: Many algorithms include indicators related to “circular material use rate” and “reuse material resources”, underscoring the focus on resource loops and material reuse in circular systems.
  • Resource efficiency: Indicators related to “resource efficiency” and “reduce resource consumption” are consistent across algorithms, showing a shared emphasis on optimizing resource use to minimize waste and maximize sustainability.
These themes collectively suggest a strong alignment in the focus areas of the algorithms. This overlap indicates a shared recognition of these aspects as foundational elements of CE practices. The results provide insights into coverage areas and identifying potential gaps for further research and refinement.
Table 6 presents the total number of similar indicators identified between each pair of algorithms. Table 6 highlights the degree of alignment in the indicators each algorithm identifies, providing insight into common themes within the CE framework. For example, BERT and TF-IDF share 19 indicators, indicating a considerable overlap in their approach to identifying critical themes. This alignment suggests that these algorithms are likely capturing similar aspects of the CE.
An overlap percentage was determined based on Formula (1):
P e r c e n t a g e   o f   s h a r e d   i n d i c a t o r s   b e t w e e n   t w o   a l g o r i t h m s   ( A & B ) = N u m b e r   o f   s h a r e d   i n d i c a t o r s   ( A   & B ) T o t a l   n u m b e r   o f   u n i q u e   i n d i c a t o r s   ( A & B ) × 100
where the total number of unique indicators is equal to the number of indicators in algorithm A plus the number of indicators in algorithm B minus the number of shared indicators.
Among the various algorithm combinations, BERT and TF-IDF, with 44.19%, and BERT and Word2Vec, with 44.00%, showed the highest overlap, indicating the significant impact of these combinations in identifying key indicators. In contrast, combinations like BERT and Graph (20.69%) and TF-IDF and Cluster (35.29%) exhibited lower performance, which may be attributed to the limitations of these algorithms in clustering or simulating indicators related to the CE and circular cities. Based on the formula provided, the calculated overlap percentages between each pair of algorithms are in following Figure 7.
The analysis of algorithm overlap reveals that BERT and TF-IDF yield the best results in identifying similar CE indicators. These findings underscore the importance of selecting the right algorithm depending on the research needs and aims. Combinations with better performance can more effectively simulate key indicators for cities and macro-level analyses, while algorithms with lower accuracy require further analysis and improvement. Also, all algorithms have successfully identified the principles of circularity, providing a comprehensive mapping of the key areas that contribute to CE practices. This highlights the consistency of the algorithms in recognizing critical circularity principles and their role in shaping circular cities.
The findings of this study emphasize the importance of aligning CE indicators with core CE principles, particularly “Reduction” and “Rethink”, which were identified as the most prominent principles in urban circularity strategies, and they demonstrate the distribution of these principles across identified indicators, also highlights the overlap between different algorithm combinations, such as BERT and TF-IDF or BERT and Word2Vec, which show higher reliability in capturing shared indicators.

5. Conclusions

In summary, this study demonstrates the effectiveness of combining text analyzing/text semantic techniques, which use some machine learning techniques and an SLR to identify and assess indicators for urban circularity at the macro level. By employing advanced algorithms, such as BERT, TF-IDF, Word2Vec, and graph-based clustering models, the research successfully extracts a comprehensive set of high-frequency indicators that align with key CE principles and aims. The overlap between these algorithms reveals common themes, such as waste management, renewable energy, resource efficiency, and circular material use, all of which play a central role in advancing urban sustainability and circularity; based on Table 2, there are less attention to education and public awareness and smart infrastructure and digital innovation and collaboration and policy support.
The results also highlight the strengths and limitations of each algorithm. Cluster-based models show a broader variability in performance scores, making them suitable for scenarios where higher scores are desired, despite their less consistent results. On the other hand, BERT provides stable and accurate clustering, making it a strong candidate for generating distinct clusters, while Word2Vec’s weaker performance suggests limitations in clustering effectiveness. These differences emphasize the importance of choosing the right methodology depending on the desired outcome—whether consistency or the potential for high scores.
Moreover, the analysis of indicator overlap among the algorithms reveals both common ground and gaps. Indicators that span multiple CE principles are consistently identified across algorithms (reduction, rethink, and recovery), offering strong thematic consistency. However, there are areas where the algorithms diverge (repurpose, refusal, and remanufacturing), highlighting research gaps that warrant further exploration; this gap is based on focuses in previous research.
This study underscores the value of innovation methodology to refine indicator identification based on the level of analysis (micro, meso, or macro) and the specific goals of research in different contexts with different concepts. Future studies could benefit from using one or a mix of these algorithms, depending on the focus of the analysis, whether assessing urban circularity at the city level or for broader regional sustainability efforts. The proposed methodology offers a scalable framework for cities to evaluate their circularity progress using a combination of shared indicators across different algorithms. Also, future research could expand on these findings by incorporating a validation phase, where the identified indicators are tested in real-world scenarios or through expert feedback. This would enhance the reliability of the results and provide more robust insights into the effectiveness of the indicators in different urban contexts. Furthermore, investigating less-represented principles, such as “Repair” and “Repurpose”, could provide a more balanced approach to circularity. These directions will help refine the methodology and contribute to broader advancements in urban sustainability research, and the extracted indicators can be categorized based on the DPSIR model (Drivers, Pressure, Impacts, State, and Response). This approach could help better understand the role of each indicator in CE and urban sustainability.
Furthermore, a longitudinal approach could be adopted in future studies to track the effectiveness of the identified indicators over time, helping to evaluate their sustainability and long-term impact on urban circularity.
The results of this study are not only relevant for academic research but also have significant implications for urban planning and policymaking. The identified indicators can guide policy development by aligning with CE principles, such as waste reduction, resource efficiency, and sustainable urbanization. They can support decision-making by helping policymakers prioritize areas, such as “Reduction” and “Rethink”, thus promoting interventions that maximize circularity and sustainability at the urban scale. These indicators can also be integrated into urban planning frameworks, supporting long-term goals such as climate resilience, economic growth, and social equity.

Author Contributions

Conceptualization, N.F. (Nadia Falah), N.F. (Navid Falah) and J.S.-G.; methodology, N.F. (Nadia Falah) and N.F. (Navid Falah); software, N.F. (Navid Falah); validation, N.F. (Nadia Falah), J.S.-G. and M.M.; formal analysis, N.F. (Nadia Falah) and N.F. (Navid Falah); investigation, N.F. (Nadia Falah) and N.F. (Navid Falah); resources, N.F. (Nadia Falah), N.F. (Navid Falah), J.S.-G. and M.M.; data curation, N.F. (Nadia Falah) and N.F. (Navid Falah); writing—original draft preparation N.F. (Nadia Falah) and N.F. (Navid Falah); writing—review and editing, N.F. (Nadia Falah), J.S.-G. and M.M.; visualization, N.F. (Nadia Falah), N.F. (Navid Falah) and J.S.-G.; supervision, J.S.-G. and M.M. All authors have read and agreed to the published version of the manuscript.

Funding

This research received no external funding.

Data Availability Statement

The original contributions presented in the study are included in the article, further inquiries can be directed to the corresponding author.

Conflicts of Interest

The authors declare no conflicts of interest.

Abbreviations

CECircular Economy
CCICircular City Indicator
SDGsSustainable Development Goals
DLDeep Learning
MLMachine Learning
NLPNatural Language Processing
SLRSystematic Literature Review
GDPGross Domestic Product
IoTInternet of Things
TF-IDFTerm Frequency-Inverse Document Frequency
BERTBidirectional Encoder Representations from Transformers
NLTKNatural Language Toolkit
RRefusal, Rethink, Reduce, Reuse, Repair, Refurbishment, Remanufacturing, Repurpose, Recycling, Recovery (principles of Circular Economy)
Eco-innovationEcological Innovation
PageRankA Graph Centrality Algorithm for Scoring Nodes

Appendix A

Table A1. Criteria for text analysis and identifying indicators.
Criteria for IndicatorsDescription
Quantifiable keywordsIndicators should contain measurable elements (e.g., ‘amount’, ‘rate’, ‘size’, ‘percentage’, ‘number’, ‘average’, ‘quantity’, ‘level’, ‘usage’, ‘proportion’, ‘volume’, ‘consumption’, ‘production’, ‘generation’, ‘efficiency’, ‘intensity’, ‘density’, and ‘frequency’). Examples include metrics like resource efficiency, waste reduction, and emissions levels.
ComparabilityIndicators should be defined in a way that allows them to be benchmarked or compared across different contexts, especially across cities and regions in the macro-level context.
Principle-linking keywordsIndicators should reflect at least one key principle or objective related to circularity, circular economy, or circular city concepts, as outlined in Table 1 and Table 2 in the Introduction. Key areas include resilience, innovation, sustainability, and urban resource cycles. Specific keywords include ‘circular economy’, ‘CE principle’, ‘strategy’, ‘refuse’, ‘rethink’, ‘reduce’, ‘reuse’, ‘repair’, ‘refurbish’, ‘remanufacture’, ‘repurpose’, ‘recycle’, ‘renewable’, ‘material consumption’, ‘energy demand’, ‘waste generation’, ‘climate mitigation’, ‘job creation’, and ‘waste reduction’.
Include specific objectives and goals of CEIndicators should cover objectives like reducing material consumption, managing urban resource cycles, supporting renewable energy/materials, promoting resilience, innovation, waste minimization, and stakeholder engagement, as highlighted in Table 1 and Table 2 in the Introduction.
Exclusion of broad and non-quantifiable termsExclude non-indicators that denote broad concepts or general goals without measurable criteria. This includes general terms and phrases like ‘Sustainable City’, ‘Circular City’, ‘Green City’, ‘eco-friendly’, ‘decarbonization’, and ‘smart city’ if they lack specific, measurable elements. Broad terms like ‘circular’, ‘sustainable’, ‘green’ should only be included if clearly defined with metrics.
Enhanced stop words for filteringCommon non-specific words and research terminology (e.g., ‘also’, ‘used’, ‘one’, ‘two’, ‘first’, ‘second’, ‘however’, ‘may’, ‘therefore’, ‘thus’, ‘et’, ‘al’, ‘paper’, ‘research’, ‘study’, ‘studies’, ‘based’, ‘data’, ‘method’, ‘figure’, ‘table’, ‘results’, ‘discussion’) are excluded to improve relevance.
CE keywordsKey terms related to CE concepts include:
self.stops = set(stopwords.words(‘english’)).union(self.custom_stops) self.sustainability_keywords = {‘sustainable’: 1, ‘circular’: 1, ‘green’: 1, ‘environmental’: 1, ‘renewable’: 1, ‘waste’: 1, ‘energy’: 1, ‘water’: 1, ‘climate’: 1, ‘social’: 1, ‘economic’: 1, ‘urban’: 1, ‘city’: 1, ‘community’: 1, ‘resource’: 1, ‘biodiversity’: 1, ‘ecosystem’: 1, ‘carbon’: 1, ‘pollution’: 1, ‘conservation’: 1, ‘equity’: 1, ‘innovation’: 1, ‘entrepreneurship’: 1, ‘social capital’: 1, ‘safety’: 1}
Table A2. Scoring metrics and weighting schemes for evaluated algorithms.
AlgorithmCE ScoreSemantic/TF-IDF/PageRank/Cluster ScoreFrequency AdjustmentTotal Formula
Algorithm 1 (BERT-based Semantic Scoring)40% of the total score, based on CE keyword matches in each phrase.40% (Semantic Similarity, based on cosine similarity between phrase embeddings and CE keyword embeddings)20%, calculated as np.log1p(phrase_counts[phrase])0.4 ∗ ce_score + 0.4 ∗ semantic_score + 0.2 ∗ frequency_score
Algorithm 2 (Enhanced TF-IDF with Context Awareness)40% of the total score, based on CE keyword matches in each phrase.30% (TF-IDF, measuring keyword co-occurrence within sentence contexts)30%, based on keyword co-occurrence0.3 ∗ tfidf_score + 0.3 ∗ context_score + 0.4 ∗ ce_score
Algorithm 3 (Word2Vec-based Semantic Analysis)40% of the total score, based on CE keyword matches in each phrase.40% (Semantic Similarity, computed through cosine similarity between phrase vectors and CE keyword vectors)20%, calculated as np.log1p(frequency_score)0.4 ∗ semantic_score + 0.4 ∗ ce_score + 0.2 ∗ frequency_score
Algorithm 4 (Graph-based Keyword Extraction)40% of the total score, based on CE keyword matches in each phrase.60% (PageRank, derived from PageRank centrality within the graph)0.6 ∗ pagerank_score + 0.4 ∗ ce_score
Algorithm 5 (Clustering-based Topic Identification)70% of the total score, weighted by the presence of CE keywords within each cluster.30%, using np.log1p(frequency_score) to scale cluster frequency0.7 ∗ ce_score + 0.3 ∗ frequency_score
Table A3. List of indicators and scoring for each algorithm.
BERTScoreTF-IDFScoreWord2VecScoreGraphScoreClusterScore
Waste generation rate1.43898Renewable energy production1.753941Waste generation rate1.280096Resource environmental footprints1.201366Water resource quality4.08322
Renewable energy production1.185118Waste generation rate1.753866Energy waste generation1.116557Urban circular economy activities1.201365Waste materials3.895068
Renewable energy consumption1.180426Recycling rate municipal waste1.357614Resource efficiency 1.034747Green spaces rate0.801321Quantitative indicators3.885429
Renewable local energy production1.172324Circular material use rate1.356414Circular material use rate1.031858Urban energy efficiency systems0.801303Natural capital resource2.224177
Biodiversity circular percentage1.169714Consumption renewable material1.354391Renewable local energy production1.031032Sustainable social practices0.801293Circular business models 1.918335
Renewable freshwater consumption1.166062Municipal waste generation1.354316Decentralized renewable energy production1.030997Resource conservation0.801271Secondary materials usage1.836417
Circular policy implementation rate1.166013Circular production1.354091Renewable energy production1.030007Emissions water energy flows0.801239Local resource availability1.777776
Circular urban production1.161396Consumption waste generation1.354091Energy water material consumption1.023029Green infrastructure rate0.801216Energy consumption1.62598
Resource efficiency 1.153333Reduce resource consumption1.354091Circular urban production rate1.020586Renewable energy sources0.80111Biodiversity range1.617221
Waste recycling rate1.149974Efficiency circular material1.354016 Energy recovery rate 1.019015 Water pollution0.80098Living quality standards1.47889
Energy recovery1.143192Consumption circular production1.353941Resource depletion amount1.017385Ecosystem conservation policies0.800936Industrial symbiosis level1.422139
Decentralized renewable energy production1.109827Rate circular activities1.353941Renewable energy consumption1.016406Non—renewable energy consumption0.800919Recycled materials used1.271222
Circular material use rate1.051828Circular product efficiency1.353866 Freshwater consumption1.013012Economic city constraints0.401384Waste recovery rate1.254198
Recycling municipal waste generation0.97318Reuse waste generation1.353866Biodiversity percentage0.985575 Local resources usage0.401351Product durability1.08322
Circular production rate0.870079Solid waste generation1.353791Municipal waste generation0.818433Identified circular material opportunities0.401345Manufacturing resource efficiency 0.993963
Circular business models number0.865144Material consumption0.958663Circular production rate0.754266Social equality level0.401342Recycling rate of energy0.993963
Energy material consumption0.863039Recycling rate municipal0.957763Resource consumption 0.72083Resource usage cost 0.401339Resource recovery rate0.921034
Solid waste generation0.842696Recycling efficiency rates0.95604Reuse resources0.709508Environmental technology rate0.401338Product life cycle score0.643775
Resource consumption0.841637Domestic material consumption0.954915Circular business models number0.697339Community well-being level0.401337
Reuse material resources0.841235Product circularity rate0.95454Recycling resource rates0.697086Integrated resource flows0.40133
Circular consumption patterns0.840865Reduce energy consumption0.954465Energy consumption0.696083Social quality rate0.401329
Recycling resource efficiency0.840517Amount material recycled0.954316Material consumption0.691015Green patent application0.401327
Circularity projects number0.786397Raw material consumption0.954166Circular economy performance 0.69074Local resource availability0.401326
Resource recovery efficiency 0.779042Energy efficiency 0.954091Solid waste generation0.678918Social cultural dimensions0.401325
Consumption waste generation0.776139Recycling rate plastic0.954016Circular material uses rate0.677903Waste management rate0.401322
Waste intensity extraction0.775733Life recycling input rates0.953866Circular economy’s development activities0.62632Circular business models product0.401322
Organic waste generation0.775202Recycling input material rates0.953866Recycling material efficiency0.624952Social justice implications0.401321
Circular jobs percentage0.774335Reducing material consumption0.953866Circular material consumption level 0.622372Waste discharge regulation0.401319
Material consumption0.773912 Circular production amount0.620791Urban living quality0.401317
Waste reduction foster efficiency0.77108 Renewable energy efficiency 0.620476Systematic resource conservation attempts0.401316
Sustainable resource allocation rate0.770363 Virtualization renewable resources efficiency0.617655Waste generation level0.401315
Recycled waste quantities0.769692 Recycling waste generation0.615966Resources energy 0.401312
Renewable resources efficiency0.767758 Circular production efficiency0.614012Waste management extension0.401311
Material consumption system0.766893 Cleaner production amount0.61212Built environment energy0.401306
Waste minimization strategies0.611101Local community governance0.401303
Circular energy consumption0.609167Resource wastage amount0.401303
Reduced resource consumption0.608297
Waste reduction foster efficiency0.607946
Figure A1. The result of Silhouette scores.
Environments 12 00001 g0a1

References

  1. Harris, S.; Martin, M.; Diener, D. Circularity for Circularity’s Sake? Scoping Review of Assessment Methods for Environmental Performance in the Circular Economy. Sustain. Prod. Consum. 2021, 26, 172–186. [Google Scholar] [CrossRef]
  2. D’Amico, G.; Arbolino, R.; Shi, L.; Yigitcanlar, T.; Ioppolo, G. Digitalisation Driven Urban Metabolism Circularity: A Review and Analysis of Circular City Initiatives. Land Use Policy 2022, 112, 105819. [Google Scholar] [CrossRef]
  3. Ellen MacArthur Foundation. Cities and Circular Economy for Food—A Transformation for People, Planet, and Prosperity; Ellen MacArthur Foundation: Isle of Wight, UK, 2019. [Google Scholar]
  4. Ellen MacArthur Foundation. Circular Economy Towards the Economic and Business Rationale for an Accelerated Transition; Ellen MacArthur Foundation: Isle of Wight, UK, 2013. [Google Scholar]
  5. Geissdoerfer, M.; Savaget, P.; Bocken, N.M.P.; Hultink, E.J. The Circular Economy—A New Sustainability Paradigm? J. Clean. Prod. 2017, 143, 757–768. [Google Scholar] [CrossRef]
  6. Kirchherr, J.; Yang, N.H.N.; Schulze-Spüntrup, F.; Heerink, M.J.; Hartley, K. Conceptualizing the Circular Economy (Revisited): An Analysis of 221 Definitions. Resour. Conserv. Recycl. 2023, 194, 107001. [Google Scholar] [CrossRef]
  7. Rejeb, A.; Rejeb, K.; Zailani, S.; Kayikci, Y.; Keogh, J.G. Examining Knowledge Diffusion in the Circular Economy Domain: A Main Path Analysis. Circ. Econ. Sustain. 2023, 3, 125–166. [Google Scholar] [CrossRef]
  8. Paiho, S.; Mäki, E.; Wessberg, N.; Paavola, M.; Tuominen, P.; Antikainen, M.; Heikkilä, J.; Rozado, C.A.; Jung, N. Towards Circular Cities—Conceptualizing Core Aspects. Sustain. Cities Soc. 2020, 59, 102143. [Google Scholar] [CrossRef]
  9. Falah, N.; Solis-Guzman, J.; Falah, N. Thermal Footprint of the Urbanization Process: Analyzing the Heat Effects of the Urbanization Index (UI) on the Local Climate Zone (LCZ) and Land Surface Temperature (LST) over Two Decades in Seville. Land 2024, 13, 1877. [Google Scholar] [CrossRef]
  10. Rockström, J.; Gupta, J.; Lenton, T.M.; Qin, D.; Lade, S.J.; Abrams, J.F.; Jacobson, L.; Rocha, J.C.; Zimm, C.; Bai, X.; et al. Identifying a Safe and Just Corridor for People and the Planet. Earth’s Future 2021, 9, e2020EF001866. [Google Scholar] [CrossRef]
  11. United Nations Environment Programme (UNEP). Annual Report 2020; UNEP: Nairobi, Kenya, 2021. [Google Scholar]
  12. Ekins, P.; Domenech, T.; Drummond, P.; Bleischwitz, R.; Hughes, N.; Lotti, L. Managing Environmental and Energy Transitions for Regions and Cities How and Where Background Information Managing Environmental and Energy Transitions for Regions and Cities The OECD Centre for Entrepreneurship, SMEs, Regions and Cities on Twitter: @OECD_local Citation. 2019. [Google Scholar]
  13. Chen, C.W. Clarifying Rebound Effects of the Circular Economy in the Context of Sustainable Cities. Sustain. Cities Soc. 2021, 66, 102622. [Google Scholar] [CrossRef]
  14. Corona, B.; Shen, L.; Reike, D.; Rosales Carreón, J.; Worrell, E. Towards Sustainable Development through the Circular Economy—A Review and Critical Assessment on Current Circularity Metrics. Resour. Conserv. Recycl. 2019, 151, 104498. [Google Scholar] [CrossRef]
  15. Elia, V.; Gnoni, M.G.; Tornese, F. Measuring Circular Economy Strategies through Index Methods: A Critical Analysis. J. Clean. Prod. 2017, 142, 2741–2751. [Google Scholar] [CrossRef]
  16. Saidani, M.; Yannou, B.; Leroy, Y.; Cluzel, F.; Kendall, A. A Taxonomy of Circular Economy Indicators. J. Clean. Prod. 2019, 207, 542–559. [Google Scholar] [CrossRef]
  17. Suárez-Eiroa, B.; Fernández, E.; Méndez-Martínez, G.; Soto-Oñate, D. Operational Principles of Circular Economy for Sustainable Development: Linking Theory and Practice. J. Clean. Prod. 2019, 214, 952–961. [Google Scholar] [CrossRef]
  18. Reichel, A.; De Schoenmakere, M.; Gillabel, J. European Environment Agency. Circular Economy in Europe: Developing the Knowledge Base; Publications Office: Luxembourg, 2016; ISBN 9789292137199. [Google Scholar]
  19. Lakatos, E.S.; Yong, G.; Szilagyi, A.; Clinci, D.S.; Georgescu, L.; Iticescu, C.; Cioca, L.I. Conceptualizing Core Aspects on Circular Economy in Cities. Sustainability 2021, 13, 7549. [Google Scholar] [CrossRef]
  20. Nadia Falah, J.S.-G. Application of Circularity Tools for Evaluation the Sustainability of Urbanization Process (Case Study; City of Seville). In Proceedings of the Sustainable Energy, Transport, Mobility for Smart Cities, Helsinki, Finland, 4–5 October 2023; Available online: https://julkaisut.haaga-helia.fi/en/compass-conference-2023-introduction/ (accessed on 20 November 2023).
  21. Pegorin, M.C.; Caldeira-Pires, A.; Faria, E. Interactions between a Circular City and Other Sustainable Urban Typologies: A Review. Discov. Sustain. 2024, 5, 14. [Google Scholar] [CrossRef]
  22. Nikolaou, I.E.; Jones, N.; Stefanakis, A. Circular Economy and Sustainability: The Past, the Present and the Future Directions. Circ. Econ. Sustain. 2021, 1, 1–20. [Google Scholar] [CrossRef]
  23. Dräger, P.; Letmathe, P.; Reinhart, L.; Robineck, F. Measuring Circularity: Evaluation of the Circularity of Construction Products Using the ÖKOBAUDAT Database. Environ. Sci. Eur. 2022, 34, 13. [Google Scholar] [CrossRef]
  24. Feiferytė-Skirienė, A.; Stasiškienė, Ž. Seeking Circularity: Circular Urban Metabolism in the Context of Industrial Symbiosis. Sustainability 2021, 13, 9094. [Google Scholar] [CrossRef]
  25. Geissdoerfer, M.; Morioka, S.N.; de Carvalho, M.M.; Evans, S. Business Models and Supply Chains for the Circular Economy. J. Clean. Prod. 2018, 190, 712–721. [Google Scholar] [CrossRef]
  26. Kirchherr, J.; Reike, D.; Hekkert, M. Conceptualizing the Circular Economy: An Analysis of 114 Definitions. Resour. Conserv. Recycl. 2017, 127, 221–232. [Google Scholar] [CrossRef]
  27. Ghisellini, P.; Cialani, C.; Ulgiati, S. A Review on Circular Economy: The Expected Transition to a Balanced Interplay of Environmental and Economic Systems. J. Clean. Prod. 2016, 114, 11–32. [Google Scholar] [CrossRef]
  28. Ghisellini, P.; Passaro, R.; Ulgiati, S. Perspectives on Socially and Environmentally Just Circular Cities: The Case of Naples (Italy). In Smart Technologies in Urban Engineering, Proceedings of the International Conference on Smart Technologies in Urban Engineering (STUE 2022), Kharkiv, Ukraine, 9–11 June 2022; Lecture Notes in Networks and Systems; Springer: Cham, Switzerland, 2023; Volume 536, pp. 621–631. [Google Scholar] [CrossRef]
  29. Ellen MacArthur Foundation. The Circular Economy in Detail. Available online: https://www.ellenmacarthurfoundation.org/the-circular-economy-in-detail-deep-dive (accessed on 20 November 2023).
  30. Korhonen, J.; Nuur, C.; Feldmann, A.; Birkie, S.E. Circular Economy as an Essentially Contested Concept. J. Clean. Prod. 2018, 175, 544–552. [Google Scholar] [CrossRef]
  31. Pintossi, N.; Ikiz Kaya, D.; Pereira Roders, A. Assessing Cultural Heritage Adaptive Reuse Practices: Multi-Scale Challenges and Solutions in Rijeka. Sustainability 2021, 13, 3603. [Google Scholar] [CrossRef]
  32. European Commission. Categorisation System for the Circular Economy a Sector-Agnostic Approach for Activities Contributing to the Circular Economy Independent Expert Report; European Commission: Brussels, Belgium; Luxembourg, Luxembourg, 2020. [Google Scholar] [CrossRef]
  33. Velenturf, A.P.M.; Purnell, P. Principles for a Sustainable Circular Economy. Sustain. Prod. Consum. 2021, 27, 1437–1457. [Google Scholar] [CrossRef]
  34. de Oliveira, C.T.; Oliveira, G.G.A. What Circular Economy Indicators Really Measure? An Overview of Circular Economy Principles and Sustainable Development Goals. Resour. Conserv. Recycl. 2023, 190, 106850. [Google Scholar] [CrossRef]
  35. Ramirez, A.H.; Sulieman, L.; Schlueter, D.J.; Halvorson, A.; Qian, J.; Ratsimbazafy, F.; Loperena, R.; Mayo, K.; Basford, M.; Deflaux, N.; et al. The All of Us Research Program: Data Quality, Utility, and Diversity. Patterns 2022, 3, 100570. [Google Scholar] [CrossRef]
  36. Henry, M.; Schraven, D.; Bocken, N.; Frenken, K.; Hekkert, M.; Kirchherr, J. The Battle of the Buzzwords: A Comparative Review of the Circular Economy and the Sharing Economy Concepts. Environ. Innov. Soc. Transit. 2021, 38, 1–21. [Google Scholar] [CrossRef]
  37. Prendeville, S.; Cherim, E.; Bocken, N. Circular Cities: Mapping Six Cities in Transition. Environ. Innov. Soc. Transit. 2018, 26, 171–194. [Google Scholar] [CrossRef]
  38. Ogunmakinde, O.E.; Egbelakin, T.; Sher, W. Contributions of the Circular Economy to the UN Sustainable Development Goals through Sustainable Construction. Resour. Conserv. Recycl. 2022, 178, 106023. [Google Scholar] [CrossRef]
  39. Parchomenko, A.; Nelen, D.; Gillabel, J.; Rechberger, H. Measuring the Circular Economy—A Multiple Correspondence Analysis of 63 Metrics. J. Clean. Prod. 2019, 210, 200–216. [Google Scholar] [CrossRef]
  40. Pauliuk, S. Critical Appraisal of the Circular Economy Standard BS 8001:2017 and a Dashboard of Quantitative System Indicators for Its Implementation in Organizations. Resour. Conserv. Recycl. 2018, 129, 81–92. [Google Scholar] [CrossRef]
  41. Alba-Rodríguez, M.D.; Solís-Guzmán, J.; Marrero, M. Evaluation Model of the Economic-Environmental Impact on Housing Recovery. Application in the City of Seville, Spain. Sustain. Cities Soc. 2022, 83, 103940. [Google Scholar] [CrossRef]
  42. Kisser, J.; Wirth, M.; De Gusseme, B.; Van Eekert, M.; Zeeman, G.; Schoenborn, A.; Vinnerås, B.; Finger, D.C.; Repinc, S.K.; Bulc, T.G.; et al. A Review of Nature-Based Solutions for Resource Recovery in Cities. In Towards Circular Cities: Nature Based Solutions for Creating a Resourceful Circular City; IWA Publishing: London, UK, 2024. [Google Scholar] [CrossRef]
  43. Linder, M.; Williander, M. Circular Business Model Innovation: Inherent Uncertainties. Bus. Strategy Environ. 2015, 26, 182–196. [Google Scholar] [CrossRef]
  44. Bolger, K.; Doyon, A. Circular Cities: Exploring Local Government Strategies to Facilitate a Circular Economy. Eur. Plan. Stud. 2019, 27, 2184–2205. [Google Scholar] [CrossRef]
  45. Sánchez Levoso, A.; Gasol, C.M.; Martínez-Blanco, J.; Durany, X.G.; Lehmann, M.; Gaya, R.F. Methodological Framework for the Implementation of Circular Economy in Urban Systems. J. Clean. Prod. 2020, 248, 119227. [Google Scholar] [CrossRef]
  46. Murray, A.; Skene, K.; Haynes, K. The Circular Economy: An Interdisciplinary Exploration of the Concept and Application in a Global Context. J. Bus. Ethics 2017, 140, 369–380. [Google Scholar] [CrossRef]
  47. European Commission. A New Circular Economy Action Plan, For a Cleaner and More Competitive Europe. Available online: https://eur-lex.europa.eu/legal-content/EN/TXT/?uri=CELEX:52020DC0098 (accessed on 20 November 2023).
  48. Shang, Y.; Song, M.; Zhao, X. The Development of China’s Circular Economy: From the Perspective of Environmental Regulation. Waste Manag. 2022, 149, 186–198. [Google Scholar] [CrossRef]
  49. Wu, K.J.; Hou, W.; Wang, Q.; Yu, R.; Tseng, M.L. Assessing City’s Performance-Resource Improvement in China: A Sustainable Circular Economy Framework Approach. Environ. Impact Assess. Rev. 2022, 96, 106833. [Google Scholar] [CrossRef]
  50. Shmelev, S.E.; Lefievre, N.; Saadi, N.; Shmeleva, I.A. Interdisciplinary Linkages among Sustainability Dimensions in the Context of European Cities and Regions Research. Sustainability 2023, 15, 14738. [Google Scholar] [CrossRef]
  51. Trovato, M.R.; Anttiroiko, A.-V. Smart Circular Cities: Governing the Relationality, Spatiality, and Digitality in the Promotion of Circular Economy in an Urban Region. Sustainability 2023, 15, 12680. [Google Scholar] [CrossRef]
  52. Musyarofah, S.A.; Tontowi, A.E.; Masruroh, N.A.; Wibowo, B.S.; Warmadewanthi, I.D.A.A.; Nasution, A.H.; Bhawika, G.W.; Handiwibowo, G.A.; Rusydi, M.K. Developing a Circular Economy Index to Measure the Macro Level of Circular Economy Implementation in Indonesia. Manag. Syst. Prod. Eng. 2023, 31, 208–215. [Google Scholar] [CrossRef]
  53. Kristensen, H.S.; Mosgaard, M.A. A Review of Micro Level Indicators for a Circular Econom—Moving Away from the Three Dimensions of Sustainability? J. Clean. Prod. 2020, 243, 118531. [Google Scholar] [CrossRef]
  54. Dincă, G.; Milan, A.A.; Andronic, M.L.; Pasztori, A.M.; Dincă, D. Does Circular Economy Contribute to Smart Cities’ Sustainable Development? Int. J. Environ. Res. Public Health 2022, 19, 7627. [Google Scholar] [CrossRef]
  55. Williams, J. Circular Cities: Planning for Circular Development in European Cities. Eur. Plan. Stud. 2023, 31, 14–35. [Google Scholar] [CrossRef]
  56. Williams, J. Circular Cities: What Are the Benefits of Circular Development? Sustainability 2021, 13, 5725. [Google Scholar] [CrossRef]
  57. Schroder, I.; Elwakil, R.; Steemers, K. Hybrid Makerspaces and Networks for the Circular City: A Case Study of Leuven, Belgium. Buildings 2024, 14, 137. [Google Scholar] [CrossRef]
  58. Elwakil, R.; Schroder, I.; Steemers, K. Circular Maker Cities: Maker Space Typologies and Circular Urban Design. Buildings 2023, 13, 2894. [Google Scholar] [CrossRef]
  59. Carrière, S.; Weigend Rodríguez, R.; Pey, P.; Pomponi, F.; Ramakrishna, S. Circular Cities: The Case of Singapore. Built Environ. Proj. Asset Manag. 2020, 10, 491–507. [Google Scholar] [CrossRef]
  60. Shmelev, S.E.; Shmeleva, I.A. Smart and Sustainable Benchmarking of Cities and Regions in Europe: The Application of Multicriteria Assessment. Cities 2025, 156, 105533. [Google Scholar] [CrossRef]
  61. Rosa, L.A.B.D.; Cohen, M.; Campos, W.Y.Y.Z.; Ávila, L.V.; Rodrigues, M.C.M. Circular Economy and Sustainable Development Goals: Main Research Trends. Rev. De Adm. Da UFSM 2023, 16, e9. [Google Scholar] [CrossRef]
  62. Gao, H.; Tian, X.; Zhang, Y.; Shi, L.; Shi, F. Evaluating Circular Economy Performance Based on Ecological Network Analysis: A Framework and Application at City Level. Resour. Conserv. Recycl. 2021, 168, 105257. [Google Scholar] [CrossRef]
  63. Mishra, M.K.; Sharma, C.; Sharma, S.; Kumar, S.; Srivastav, A.L. Exploring Antecedents, Consequences, Research Constituents and Future Directions of Circular Economy: A Predictive Analysis in the Preview of Text Mining. J. Knowl. Econ. 2024, 4, 1–35. [Google Scholar] [CrossRef]
  64. García-Barragán, J.F.; Eyckmans, J.; Rousseau, S. Defining and Measuring the Circular Economy: A Mathematical Approach. Ecol. Econ. 2019, 157, 369–372. [Google Scholar] [CrossRef]
  65. Valls-Val, K.; Ibáñez-Forés, V.; Bovea, M.D. How Can Organisations Measure Their Level of Circularity? A Review of Available Tools. J. Clean. Prod. 2022, 354, 131679. [Google Scholar] [CrossRef]
  66. Vanhuyse, F.; Rezaie, S.; Englund, M.; Jokiaho, J.; Henrysson, M.; André, K. Including the Social in the Circular: A Mapping of the Consequences of a Circular Economy Transition in the City of Umeå, Sweden. J. Clean. Prod. 2022, 380, 134893. [Google Scholar] [CrossRef]
  67. Schöggl, J.P.; Stumpf, L.; Baumgartner, R.J. The Narrative of Sustainability and Circular Economy—A Longitudinal Review of Two Decades of Research. Resour. Conserv. Recycl. 2020, 163, 105073. [Google Scholar] [CrossRef]
  68. Geng, S.; Law, K.M.Y.; Niu, B. Investigating Self-Directed Learning and Technology Readiness in Blending Learning Environment. Int. J. Educ. Technol. High. Educ. 2019, 16, 17. [Google Scholar] [CrossRef]
  69. Bote Alonso, I.; Sánchez-Rivero, M.V.; Montalbán Pozas, B. Mapping Sustainability and Circular Economy in Cities: Methodological Framework from Europe to the Spanish Case. J. Clean. Prod. 2022, 357, 131870. [Google Scholar] [CrossRef]
  70. Mancini, E.; Raggi, A. A Review of Circularity and Sustainability in Anaerobic Digestion Processes. J. Environ. Manag. 2021, 291, 112695. [Google Scholar] [CrossRef]
  71. Albayrak, F.; Poyrazoğlu, O. A Systematic Literature Review on Lean, Industry 4.0, and Digital Factory. J. Knowl. Econ. 2023, 15, 13486–13508. [Google Scholar] [CrossRef]
  72. Meilinger, V.; Monstadt, J. Articles-From the Sanitary City to the Circular City? Technopolitics of Wastewater Restructuring in Los Angeles, California. Int. J. Urban. Reg. Res. 2021, 46, 182–201. [Google Scholar] [CrossRef]
  73. Lucertini, G.; Musco, F. Circular City: Urban and Territorial Perspectives. GeoJournal Libr. 2022, 128, 123–134. [Google Scholar] [CrossRef]
  74. Raimo, N.; Vitolla, F.; Malandrino, O.; Esposito, B.; Paoli, F.; Pirlone, F.; Spadaro, I. Indicators for the Circular City: A Review and a Proposal. Sustainability 2022, 14, 11848. [Google Scholar] [CrossRef]
  75. German Environment Agency. 9 Principles for a Circular Economy; UBA: Dessau-Roßlau, Germany, 2020. [Google Scholar]
  76. Tapia, C.; Randall, L.; Wang, S.; Aguiar Borges, L. Monitoring the Contribution of Urban Agriculture to Urban Sustainability: An Indicator-Based Framework. Sustain. Cities Soc. 2021, 74, 103130. [Google Scholar] [CrossRef]
  77. Loredana Bîrgovan, A.; Lakatos, E.S.; Szilagyi, A.; Cioca, L.I.; Pacurariu, R.L.; Ciobanu, G.; Rada, E.C. How Should We Measure? A Review of Circular Cities Indicators. Public Health 2022, 19, 5177. [Google Scholar] [CrossRef]
  78. Papageorgiou, A.; Henrysson, M.; Nuur, C.; Sinha, R.; Sundberg, C.; Vanhuyse, F. Mapping and Assessing Indicator-Based Frameworks for Monitoring Circular Economy Development at the City-Level. Sustain. Cities Soc. 2021, 75, 103378. [Google Scholar] [CrossRef]
  79. De Pascale, A.; Arbolino, R.; Szopik-Depczyńska, K.; Limosani, M.; Ioppolo, G. A Systematic Review for Measuring Circular Economy: The 61 Indicators. J. Clean. Prod. 2021, 281, 124942. [Google Scholar] [CrossRef]
  80. Girard, L.F.; Nocca, F. Moving Towards the Circular Economy/City Model: Which Tools for Operationalizing This Model? Sustainability 2019, 11, 6253. [Google Scholar] [CrossRef]
  81. Gravagnuolo, A.; Angrisano, M.; Girard, L.F. Circular Economy Strategies in Eight Historic Port Cities: Criteria and Indicators Towards a Circular City Assessment Framework. Sustainability 2019, 11, 3512. [Google Scholar] [CrossRef]
  82. Subakti, A.; Murfi, H.; Hariadi, N. The Performance of BERT as Data Representation of Text Clustering. J. Big Data 2022, 9, 15. [Google Scholar] [CrossRef]
  83. McKinney, W. Python for Data Analysis: Data Wrangling with Pandas, NumPy, and IPython; O’Reilly Media, Inc.: Sebastopol, CA, USA, 2012. [Google Scholar]
  84. Alwidian, S.A.; Bani-Salameh, H.A.; Alslaity, A.N. Text Data Mining: A Proposed Framework and Future Perspectives. Int. J. Bus. Inf. Syst. 2015, 18, 127–140. [Google Scholar] [CrossRef]
  85. Marcí nczuk, M.; Gniewkowski, M.; Walkowiak, T. Text Document Clustering: Wordnet vs. TF-IDF vs. Word Embeddings. In Proceedings of the 11th Global Wordnet Conference, Pretoria, South Africa, 18–21 January 2021. [Google Scholar]
  86. Sufyan Gbolo, S.; Nagriwum, T.M.; Dapilah, C.A.; Yunus, A. Text Mining Analysis of Patent in Innovation Studies: Trends, Issues and Future Research Agenda. Am. J. Econ. Bus. Innov. 2023, 2, 77–88. [Google Scholar] [CrossRef]
  87. Antons, D.; Grünwald, E.; Cichy, P.; Salge, T.O. The Application of Text Mining Methods in Innovation Research: Current State, Evolution Patterns, and Development Priorities. R D Manag. 2020, 50, 329–351. [Google Scholar] [CrossRef]
  88. Upadhyay, A.; Laing, T.; Kumar, V.; Dora, M. Exploring Barriers and Drivers to the Implementation of Circular Economy Practices in the Mining Industry. Resour. Policy 2021, 72, 102037. [Google Scholar] [CrossRef]
  89. Reddy, A. Data Clustering Data Clustering Algorithms and Applications; Chapman & Hall/CRC Press: Boca Raton, FL, USA, 2014. [Google Scholar]
  90. Wang, K.; Ding, Y.; Han, S.C. Graph Neural Networks for Text Classification: A Survey. Artif. Intell. Rev. 2024, 57, 190. [Google Scholar] [CrossRef]
  91. Asudani, D.S.; Nagwani, N.K.; Singh, P. Impact of Word Embedding Models on Text Analytics in Deep Learning Environment: A Review. Artif. Intell. Rev. 2023, 56, 10345–10425. [Google Scholar] [CrossRef]
  92. Daglis, T.; Tsironis, G.; Tsagarakis, K.P. Data Mining Techniques for the Investigation of the Circular Economy and Sustainability Relationship. Resour. Conserv. Recycl. Adv. 2023, 19, 200151. [Google Scholar] [CrossRef]
  93. Zheng, M.; Li, T.; Ye, J. The Confluence of AI and Big Data Analytics in Industry 4.0: Fostering Sustainable Strategic Development. J. Knowl. Econ. 2024, 4, 1–37. [Google Scholar] [CrossRef]
  94. George, L.; Sumathy, P. An Integrated Clustering and BERT Framework for Improved Topic Modeling. Int. J. Inf. Technol. 2023, 15, 2187–2195. [Google Scholar] [CrossRef]
Figure 1. Systematic literature review process.
Environments 12 00001 g001
Figure 2. The process of methodology for data preparation and text analysis [63,82,83,84,85,86,87,88,89,90,91,92].
Environments 12 00001 g002
Figure 3. Comparison of text representation and clustering methods using ANOVA analysis.
Environments 12 00001 g003
Figure 4. Scatter and violin plot analysis of algorithm performance.
Environments 12 00001 g004
Figure 5. Evaluation of indicator clustering quality with algorithm-specific Silhouette scores, ordered based on score and the frequency of indicators in each color.
Environments 12 00001 g005
Figure 6. Distribution of indicators aligned with CE principles.
Environments 12 00001 g006
Figure 7. Overlap percentages of indicators between each pair of algorithms.
Environments 12 00001 g007
Table 1. R principles of the CE.
PrincipleDescriptionReferences
RefusalAvoiding unnecessary products to reduce resource consumption.[25,26]
RethinkRe-evaluating product design and lifecycle for efficiency and sustainability.[27,28]
ReductionMinimizing resource use and waste generation at every stage.[5,29]
ReuseUsing products multiple times to extend their lifecycle.[30,31]
RepairFixing broken items instead of discarding them.[17,32,33,34]
RefurbishmentRefreshing used products to improve functionality.[17,33,34]
RemanufacturingRebuilding products to original specifications.[17,34,35,36,37]
RepurposeFinding new uses for products outside their intended purpose.[21,22,38]
RecyclingProcessing materials to make new products.[16,39]
RecoveryExtracting usable resources from waste.[14,40,41,42]
Table 2. Main principles and concepts related to CE.
PrincipleDescriptionScaleReferences
Resource management and efficiencyFocuses on sustainable resource use, reducing natural resource consumption, optimizing resource efficiency, and minimizing waste.Macro-Level CE[11,15,52,70]
Design and production for circularityEmphasizes designing products and infrastructure with recyclability, repairability, and longevity in mind, and using both new and recycled materials.Circular City[3,27,28,29,37]
Collaboration and policy supportEncourages collaboration between stakeholders (citizens, businesses, and government) and policy incentives to promote sustainable practices in urban contexts.Circular City[32,55,56,57]
Renewable and local energy systemsPrioritizes renewable energy sources and local energy generation to reduce emissions and enhance resilience.Circular City[29,32]
Digital innovation and smart infrastructureIntegrates digital tools and smart technologies (e.g., IoT) for better resource management, recycling, and infrastructure optimization.Circular City[2,51,71]
Education and public awareness Aims to raise public awareness and knowledge about CE practices and benefits through education.Circular City[53,72,73,74]
Material recovery and reuseFocuses on recovering and reusing materials, components, and products to enhance economic and environmental value.Macro-Level CE[6,10]
10 R’s FrameworkImplements practices like Refuse, Rethink, Reduce, Reuse, Repair, Refurbish, Remanufacture, Repurpose, Recycle, and Recover for resource efficiency.Circular City[17,33,34,75]
Table 3. The output result of text processing.
Processing FileArticles.txt
Original file size4,232,591 characters
Processed file size3,710,773 characters
Reduction521,818 characters (12.3%)
Processing time2.34 s
Table 4. The structure of the algorithms [63,82,83,85,86,90,91,93,94].
AlgorithmMain ObjectiveKey StepsScoring CriteriaEvaluation Method
Algorithm 1: BERT-based Phrase Extraction (algorithm1_bert_embeddings)Extract relevant phrases using BERT. This algorithm extracts and scores phrases based on their semantic relevance to CE using BERT embeddings combined with frequency and predefined keyword importance.
  • Phrase Extraction: Uses SpaCy to parse the input text and extract noun phrases.
  • Batch Processing: Converting text into numerical embeddings that capture linguistic features.
  • Scoring Phrases: Combines the BERT embeddings with CE keyword importance to compute a score for each phrase.
  • Evaluation: Each phrase is evaluated to determine if it meets the criteria to be considered a valid indicator based on CE.
-
CE Score: Based on the presence of CE keywords within the phrase.
-
Semantic Score: Calculated using cosine similarity between the phrase’s embedding and pre-computed keyword embeddings.
-
Frequency Adjustment: Uses logarithmic scaling of phrase frequency to balance the influence of rare versus common phrases.
Evaluates whether a phrase meets the CE and quantifiability criteria.
Algorithm 2: Enhanced TF-IDF Analysis(algorithm2_enhanced_tfidf)Identify significant phrases using TF-IDF. Utilizes modified TF-IDF scores with context coherence and relevance to CE themes to identify significant phrases.
  • Sentence Tokenization: Splits the text into sentences using NLTK’s sentence tokenizer.
  • TF-IDF Vectorization: Converts these sentences into a TF-IDF matrix, emphasizing important but less frequent terms within the text.
  • Scoring Phrases: Iterates over each phrase derived from the TF-IDF vectorization.
  • Phrase Evaluation: Filters out phrases that do not meet the CE and quantifiability criteria.
-
TF-IDF Score: Reflects the term’s importance within the text.
-
Context Coherence Score: Assesses how often the phrase appears in context with CE keywords.
-
CE Relevance: Increases the score for phrases containing CE keywords.
Filters out phrases that do not meet the CE and quantifiability criteria.
Algorithm 3: Word2Vec Phrase Analysis(algorithm3_word2vec_phrases)Analyze phrases based on word embeddings. Applies a Word2Vec model to find phrases semantically related to CE topics through vector similarity measures.
  • Sentence and Word Tokenization: Prepares the text for Word2Vec training by tokenizing into sentences and words, removing stopwords.
  • Word2Vec Training: Trains a Word2Vec model on the tokenized sentences to generate word embeddings.
  • Phrase Extraction and Scoring: Extracts phrases using SpaCy, then calculates a vector for each phrase by averaging its word vectors.
  • Evaluation: Uses the CE and quantifiability criteria to determine the validity of each phrase.
-
Semantic Similarity: Measures similarity to the predefined CE keywords.
-
CE Score: Based on the presence of CE-related words.
-
Frequency Score: Accounts for how often each phrase appears in the text.
Uses CE and quantifiability criteria to determine the validity of each phrase.
Algorithm 4: Efficient Graph-based Analysis (algorithm4_efficient_graph)Assess phrase relationships using a graph model. Constructs a graph based on phrase similarity and uses graph centrality measures to identify key phrases.
  • Phrase Extraction: Similarly to previous algorithms, extracts phrases using SpaCy.
  • Embedding Computation: Uses BERT to compute embeddings for each phrase.
  • Graph Construction: Builds a graph where nodes are phrases and edges represent cosine similarity between phrase embeddings.
  • Graph Analysis: PageRank calculation determines the centrality of each phrase within the graph.
  • Evaluation: Identifies top phrases based on their graph scores and evaluates them against CE and quantifiability criteria.
-
PageRank Calculation: Determines the centrality of each phrase within the graph.
-
Combined Score: Integrates the PageRank score with CE keyword importance.
Identifies top phrases based on their graph scores and evaluates them against CE criteria.
Algorithm 5: Efficient Clustering-based Topic Identification (algorithm5_efficient_clustering)Group phrases into clusters for theme identification. Groups phrases into clusters to identify prevalent themes, scoring clusters based on the frequency and relevance of their phrases to CE.
  • Phrase Extraction and Preprocessing: Identifies and preprocesses phrases from the text.
  • Embedding and Clustering: Uses BERT to generate phrase embeddings and applies MiniBatchKMeans algorithm to cluster phrases based on their embeddings.
  • Cluster Analysis: Ranks phrases within each cluster by frequency.
  • Evaluation: Selects and evaluates top phrases from each cluster based on overall scores and relevance to CE criteria.
-
Frequency Score: Accounts for how often each phrase appears in the text.
-
CE Score: Evaluates phrases based on their relevance to CE.
Selects and evaluates top phrases from each cluster based on overall scores and relevance to CE criteria.
Table 5. Main data export from indicators of each algorithm.
AlgorithmMean ScoreMedian ScoreMode ScoreStandard DeviationCount
BERT0.950.8530.7670.1934
TF-IDF1.1981.3540.9540.25128
Word2Vec0.8020.6970.6080.19938
Graph0.5570.4010.4010.2436
Cluster1.8291.5480.9941.05618
Total0.1940.8530.7450.186154
Table 6. Comparison the number of shared indicators across different algorithms.
Algorithm
(Total Number)
BERT (34)TF-IDF (28)Word2Vec (38)Graph (36)Cluster (18)
BERT (34) 19221210
TF-IDF (28)19 181312
Word2Vec (38)2218 1612
Graph (36)121316 10
Cluster (18)10121210
Disclaimer/Publisher’s Note: The statements, opinions and data contained in all publications are solely those of the individual author(s) and contributor(s) and not of MDPI and/or the editor(s). MDPI and/or the editor(s) disclaim responsibility for any injury to people or property resulting from any ideas, methods, instructions or products referred to in the content.

