Article

Seasonal and Spatial Discrimination of Sandy Beaches Using Energy-Dispersive X-Ray Fluorescence Spectroscopy Analysis: A Comparative Study of Maltese Bays

1
Department of Chemistry, Faculty of Science, University of Malta, MSD 2080 Msida, Malta
2
Institute of Applied Sciences, Malta College of Arts, Science and Technology, PLA 9032 Paola, Malta
*
Author to whom correspondence should be addressed.
Environments 2024, 11(12), 299; https://doi.org/10.3390/environments11120299
Submission received: 27 November 2024 / Revised: 19 December 2024 / Accepted: 20 December 2024 / Published: 22 December 2024

Abstract

:
The general increase in awareness of environmental pollutants and typical sources reflects the application of sustainability and development goals. Energy-Dispersive X-Ray Fluorescence spectroscopy analysis has been used to analyse sand samples collected from five different beaches located on the east and north-eastern coasts of Malta and Gozo during two summers and two winters. Samples were collected along linear transects perpendicular to the shoreline at three different depths. Chemometrics were used to discriminate between four latent variables, including season, location, depth, and distance from shoreline. The highest concentrations were attributed to Fe2O3, Al2O3, SrO, and SnO2. Principal Components Analysis and Factor Analysis classified distributions of Fe2O3, CoO, As2O3, MnO, SrO, SeO2, and CaCO3 under Principal Component 1. However, since no loading value dominance was observed, such distributions most likely represent a combination of lithogenic and anthropogenic natures. Discrimination using Stepwise Linear Canonical Discriminant Analysis (SLC-DA) and Partial Least Squares Discriminant Analysis (PLS-DA) using Leave-One-Out-Cross-Validation with Variance Importance Plots proved highly effective in classifying data by location, followed by seasonal variability. It follows that concentrations are not affected by depth and distance from shoreline variability, proving that accumulation and anthropogenic effects from land are not concentrated in specific zones but are spatially spread out along the bays and do not increase with depth.

1. Introduction

Awareness of pollution sources and their key effects is increasing as a proactive target in guarding the natural environment and human health. Water analysis is very popular in Malta due to its scarcity, which is directly connected to the important need for preservation. Sediment quality is strongly associated with the estimation of the risks originating from man-made pollution in aquatic and marine systems. The goal of this study was to obtain deeper knowledge of the effects of anthropogenic activity along the Maltese coastline.
Although Malta is a small island in the Mediterranean Sea, it has a long coastline totalling approximately 272 Km, of which 90.5% is rocky, 2.4% is sandy and shingle shores, and the remaining 7% is built environment [1]. Geological aspects found on beaches in Malta and Gozo include a variety of golden sand, red sand, lagoons, rocks, and inland seas. Larger beaches are located in the northern parts of Malta and Gozo, namely Għadira Bay and Ramla Bay, respectively. These are popular tourist attractions, especially for water sports.
Sand is formed by the erosion of rocks from valleys in the vicinity of the beaches. As outlined by Lang in 1960, most of the exposed rocks are made up of a combination of Globigerina Limestone, Blue Clay, and Greensand formations [2], with Greensand being the most common type. Sand formation depends on the composition of the geological strata available in the zone and the content of crustacean shells present in such rock. Unfortunately, although touristic activity has supported the islands’ economy for a good span of years, it has impeded the natural regeneration of sand, leading to the loss of geomorphological activity in most local sand beaches [1,3].
Pollution from toxic elements in Mediterranean Sea sediments presents serious environmental and health risks. Multiple studies have reported elevated levels of mercury, nickel, copper, and cadmium in coastal regions [4,5]. In research by Ardila et al., high concentrations of these metals were confirmed, while moderate levels were observed for chromium, zinc, cadmium, barium, and vanadium. The study found that heavy metal concentrations decreased when moving from the coast to the open sea, suggesting that wastewater discharges in coastal areas were a primary source of contamination [4]. Statistical analyses further indicated that Cu, Zn, Ba, and Cr play significant roles in sediment chemistry, suggesting a common anthropogenic origin for these metals [4]. In studies along the Egyptian coast, El-Amier et al. reported high levels of contamination in cities like Gamasa and Ras El-Bar, with iron, manganese, and chromium being the most prevalent metals. Notably, 18.18% of the samples contained cadmium at levels above the threshold for adverse effects on marine life [5]. Soliman et al. also studied ecological risks due to potentially toxic elements (PTE) along the Egyptian–Mediterranean coast, finding that lithogenic factors primarily influenced the distribution of most metals. Analysis through digestion and Atomic Absorption Spectroscopy (AAS) revealed the highest mean concentrations for Fe and Mn, with Co and Cd at lower levels. Using cluster and factor analysis, Soliman et al. identified dominant lithogenic factors in metal distribution, results that aligned with El-Amier et al.’s findings [5,6]. Similarly, Ahdy and Khaled found that variations in PTE concentrations along the Egyptian–Mediterranean coast could be attributed to both natural and anthropogenic sources [7].
On the Mediterranean coast of Morocco, Saddik et al. investigated the origins and degree of PTE contamination in surface sediments, focusing on metals like Cd, Cu, Cr, Ni, Pb, Zn, Hg, Fe, and Mn across ten stations sampled over three periods [8]. They observed significant concentration variations between sampling periods due to pH changes and redox potential, which affect metal mobilisation and concentration [8,9,10]. It was also found that factors like organic matter and grain size impact heavy metal levels [8,9,11,12,13]. Multivariate analysis confirmed that Cd, Cu, Hg, Pb, and Zn primarily originated from human activities, while Fe, Mn, Cr, and Ni were from natural sources [8]. Thus, PTE contamination along the Moroccan Mediterranean coast stems from both anthropogenic and natural factors [8]. Research in Spain on sediments from Portman Bay and from Barcelona to Besós highlights significant contamination from long-term mine tailings and sewer discharge, severely affecting benthic ecosystems [14,15]. While some studies report moderate or negligible PTE pollution in Mediterranean sediments [16,17], certain areas exceed safe thresholds, posing risks to marine life and humans. In Northern Cyprus, Kontaş et al. reviewed heavy metal sources and ecological risks, finding high levels of Cu, Zn, Cr, and Ni in surface sediments, exceeding background levels for the region. The sediments were classified as heavily polluted by Cu and Cr and moderately polluted by Zn and Ni [18]. In a separate study, Duman et al. found varying contamination levels across Cyprus. While some areas showed no significant pollution with Pb, Zn, Co, Cr, and Al, others were contaminated with As, Ni, Mn, Cu, and Fe, indicating a mix of natural and human sources for heavy metal content [19]. These findings emphasise the need for management strategies to control heavy metal pollution in Mediterranean coastal regions. Health risk assessments should be employed as screening tools to determine the urgency of sediment remediation actions.
In order to assess the detrimental effects of heavy metal oxide concentrations found in sediments, quantification of these oxides is required using reliable, precise, accurate and sensitive techniques. Inductively Coupled Plasma Optical Emission Spectroscopy (ICP-OES) is highlighted as a reliable method for assessing multiple elements, offering precision and reproducibility when coupled with proper quality control measures which include the use of duplicate analyses, and certified reference materials [20]. Barreto et al. presented Energy-Dispersive X-Ray Fluorescence spectroscopy (ED-XRF) as a practical alternative to ICP-OES, providing comparable seasonal variation profiles for metals contained in sediments [21]. Tawfik et al. emphasised that the choice of method depends on the specific analytical requirements [22]. Recent developments and future prospects associated with these techniques, as well as the potential advantages of using them in combination with other analytical methods to enhance precision and speed in heavy metal analysis, are highly important to increase accuracy and optimal selection of spectroscopical methods for the required application [21,22]. The choice of analytical technique should be carefully considered based also on factors such as sample type, target metals, and laboratory capabilities, keeping in mind that existing protocols may need to be adapted for the specific sample being analysed [23].
Energy-Dispersive X-ray Fluorescence spectrometry offers several advantages for sediment analysis, including non-destructive testing, simple sample preparation, and the ability to detect multiple elements simultaneously [24]. This technique has shown good precision, stability over time, and satisfactory detection limits for various elements in soil and sediment [25]. Studies have confirmed that ED-XRF can accurately measure concentrations of elements such as K, Ca, Ti, Mn, Fe, Cu, Zn, and Pb in marine sediments [4,26,27,28]. Comparisons of ED-XRF with ICP-MS data for PTE concentrations in soil samples have validated its suitability for quantification, with the added benefit of being faster than traditional analysis methods [29]. However, some studies have found statistically significant differences between ED-XRF and Flame Atomic Absorption Spectroscopy (FAAS) for certain metals in sediment samples [20,21,30]. Goldstein et al. noted that ED-XRF results may not align directly with standard EPA digestion methods but generally provide reliable and accurate results, with few spectral interferences and low detection limits for most elements [31]. Enzweiler and Vendemiatto further supported this by showing that the ED-XRF results closely matched certified values when using matrix corrections for H₂O and C [32]. Beyond environmental analysis, ED-XRF has successfully distinguished geological sources of obsidian artefacts based on the elemental composition of Fe, Rb, Sr, Y, Zr, and Nb [33,34]. Advances in monochromatic ED-XRF (MED-XRF) have further enhanced detection limits for trace elements, including PTE, making the technique especially valuable for environmental monitoring and soil conservation [35]. The combined non-destructive nature and multi-element capability of ED-XRF make it a highly effective tool for sediment analysis in the Mediterranean region [24,35].
Chemometric techniques are crucial for examining PTE concentrations in environmental samples, providing insights into pollution sources and interactions. Principal Component Analysis (PCA) is widely used for dimensionality reduction and source identification of contaminants when large datasets are available [36,37,38,39]. PCA together with Cluster Analysis can reveal correlations between different pollutants and their potential sources, such as mining, shipping, and vehicular emissions [14,38,40]. Multivariate statistical methods including correlation tests are used to classify, identify, and group prevalent pollutants [36,41]. Multiple regression on principal component scores can identify latent factors responsible for heavy metal pollution in various matrices [42,43]. Other statistical methods, including discriminant analysis, Analysis of Variance (ANOVA), and correlation analysis, can help determine PTE accumulation patterns and controlling factors in environmental samples. These techniques enable researchers to classify samples based on pollution levels, land-use types, and spatial variations [37,44]. Chemometric analysis is valuable for comprehensive ecological evaluation, providing a scientific basis for monitoring heavy metal accumulation and controlling future environmental contamination [36,44].
Health risk assessment and potential ecological risk assessments are carried out to evaluate both carcinogenic and non-carcinogenic risks associated with heavy metals present in various regions. Research has shown that children are generally more vulnerable to heavy metal risks than adults [45,46]. Additionally, studies have highlighted the importance of considering the bioavailable fractions of heavy metals, rather than total concentrations, for more accurate risk assessments [47]. Monte Carlo simulation techniques have been widely used in health risk assessments of PTE pollution [46,47,48]. The probabilistic approach of Monte Carlo simulations allows for a more comprehensive assessment of uncertainties in risk calculations compared to deterministic methods [49]. These findings emphasize the need for targeted risk alleviation measures, particularly for vulnerable populations, and suggest that conventional deterministic risk assessments may overestimate health risks associated with PTE pollution in the surrounding environment [45,47].
This study aims to deepen our understanding of toxic pollutants commonly found on the sandy beaches of the Maltese Islands. It will analyse how both human activities and natural processes contribute to toxic pollution, examine the impact of seasonal changes, and track long-term trends to reveal any progressive or regressive patterns over the years. The study will also investigate how PTE accumulate in beach sands over time, assess potential health risks linked to PTE contamination, and evaluate the environmental threats posed by these metals on local beaches. To achieve a comprehensive analysis, chemometric methods will be applied to interpret complex data patterns and identify the primary sources and distribution trends of PTE. Techniques such as Principal Component Analysis (PCA) and Cluster Analysis will be employed to classify pollution sources, reveal correlations between pollutants, and determine spatial and seasonal variability across different beaches. The ultimate goal is to drive meaningful changes in human behaviour and activities on Maltese beaches, helping to protect natural ecosystems, minimize health risks, and reduce environmental impacts that could jeopardize the wellbeing of the islands and their people.

2. Materials and Methods

2.1. Collection of Samples

Sand samples were collected from five different beaches located in Malta and Gozo. Sampling points are positioned along linear transects drawn orthogonally from the waterline spread evenly along most of the beach length. Three samples at different depths—at the top surface, a depth of 10 cm, and a depth of 20 cm—were collected from each sampling point. A total of eighteen samples were collected from Għadira Bay, eight samples from Ballut Reserve Bay in Marsaxlokk, and five samples from Rinella Bay, while seven samples were collected from Marsalforn Bay and sixteen samples from Ramla Bay in Gozo. Figure 1 illustrates a plan of the positioning of sampling points in each of the beaches studied. Table S1 gives coordinates for the sampling points for each beach studied. Permits from the Environment Resources Authority (ERA) were applied for to obtain permission for sand collection from Natura 2000-protected beaches, namely Ballut Reserve Bay and Għadira Bay in Malta, and Ramla Bay in Gozo. Permission for sample collection from Rinella Bay was sought from the Cleansing and Maintenance Division, and permission for collection from Marsalforn Bay was sought from EcoGozo. All permits were approved in time.
A total of 162 samples were thus gathered during each collection period, which includes September 2022, March 2023, September 2023, and March 2024. The months of March and September were chosen to study temporal effects on PTE variability between summer and winter, to understand the effects of changes and frequency of human activity on beaches due to seasonal differences. Approximately 300 g of sand was collected using a plastic shovel and stored in sealed labelled plastic bags from each sampling point at each depth.

2.2. Physical Parameters

Acidity readings were initially recorded by measuring the pH of 20 g of the sample in 40 mL of de-ionised water. This test was carried out on a set of randomly chosen samples. Samples were dried at 70 °C for at least 24 h until a constant sample mass was achieved to ensure no water content was present. Sample masses were recorded before drying and after drying to determine the water content present. Samples were sieved, retaining particles of a maximum 2 mm grit size, and then stored in vacuumed plastic bags.

2.3. Potentially Toxic Elemental Concentrations

Samples collected were qualitatively analysed using the Bruker S2 Ranger ED-XRF spectrometer, with 25 ± 0.050 g of sample placed in transparent plastic cups lined with Mylar film. Samples were analysed for metal oxides using calcium carbonate as a matrix, which ensured good data fitting with R/Ro ≤ 20.0. The instrument was operated using a helium environment and analysis was carried out under application of 20 keV, 40 keV, and 50 keV, respectively. Calibration of instrument readings was carried out after every 24 samples measured, with the instrument calibrated using a copper disc and a quality check disc to calibrate its reading parameters, as established by the supplier. Readings were repeated in triplicate and percentage concentrations including interferograms for each sample were saved. The sand used for analysis using ED-XRF was conserved as this method is a non-destructive technique which allows for simultaneous multi-element analysis, provides easy sample preparation, and rapid attainment of results [24,25,29].

2.4. Chemometrics

Diverse statistical methods were applied to analyse data obtained through ED-XRF assessment. Non-parametric tests like normality tests and correlation analyses were used to assess data distribution and relationships between variables [44]. Together with chemometric techniques, these are particularly valuable for multivariate datasets common in clinical, epidemiological, food science and environmental research [50,51]. Multivariate techniques including Principal Component Analysis (PCA), Factor Analysis (FA), Linear Discriminant Analysis (LDA), and Partial Least Squares Discriminant Analysis (PLS-DA) are widely used for exploratory data analysis and pattern recognition [52]. These methods helped reveal underlying structures, classify samples, and identify important variables which may be linked to the common sourcing of specific elemental concentrations [37,53]. These were carried out to discover underlying data structures, distinguish between polluted and unpolluted soils, and identify anthropogenic and natural sources of contamination [37]; however, their proper application required careful consideration of assumptions, sample sizes, and validation techniques to avoid overfitting and ensure reliable results [52]. Chemometric methods like PCA and PLS regression were employed since these are able to handle high-dimensional data and multicollinearity [54]. Supervised chemometric techniques like PLS-DA further enhance such classification capabilities [53]. The application of these statistical methods provided an adequate scientific basis for monitoring heavy metal accumulation, assessing environmental quality, and guiding future pollution control efforts [44,55].

3. Results and Discussion

Results were collected and analysed statistically using Microsoft Excel, IBM SPSS Statistics, and JMP Pro 17.

3.1. Physical Parameters Study

Water content and pH readings were recorded, as shown in Table 1. Water content results reflect the weather conditions at the time of sampling and the sampling location on the beach, as in some seasons incoming waves are stronger and thus reach towards the sampling points. pH results show stable readings throughout sampling seasons with an average sand pH of 7.468 and a standard deviation of 0.410.

3.2. Descriptive Statistics

Descriptive statistics produced using data from all samples collected throughout the four sampling seasons show that the highest PTE present is iron (II) oxide, as shown in Table 2. This correlates with Bianco’s work, which focused on geochemical studies of Lower Globigerina Limestone (LGL) in Malta using XRF spectroscopy [56]. The highest content of iron (II) oxide reported by Bianco (2021) was 1.038% in one particular sample from a total of 16 samples, for which the average iron (II) oxide content was calculated to be 0.646% [56]. Thus, sand samples collected have double the iron (II) oxide content reported for LGL obtained from inland quarries. This might show that part of the iron content found in sand may be attributed to sources other than strictly lithogenic. Common elements studied include Al2O3 and MnO, the content of which is far lower in sand than in LGL [56].
Potentially toxic elemental concentrations in Maltese sand samples exhibit various similarities and contrasts when compared to samples taken from other Mediterranean regions. In Malta, higher concentrations of Sr, Fe, Pb, Zn, and Cu are observed in Table 2. Such observations align with findings from Mallorca, southern Italy, and Greece, where Cu, Zn, Pb, and Ni were observed as prominent metals in marine sediments [4]. These similarities suggest shared pollution sources, including anthropogenic activities like wastewater discharge, agricultural run-off, and tourism, all significant contributors to PTE accumulation in coastal areas. The concentration obtained for Cd contrasts with concentrations from Mallorca and Greek beaches [4,28], whereby these could reflect differences in industrial activities or environmental management practices between regions. In Greece, agricultural activities, including fertiliser and pesticide use, were a significant contributor to the PTE content [4].

3.3. Non-Parametric Analysis

Normality tests carried out, including Kolmogorov–Smirnov and Shapiro–Wilk tests (Table S2), show that the data is not normal as the hypothesis tested is rejected against p < 0.05. Such results could also be verified by observation of skewness and kurtosis values describing each elemental concentration, proving the distribution effect of non-point sources for such PTE.
Non-parametric tests analysing a total of 17 hypotheses outlined that concentrations of most PTE studied are the same across all seasons but vary by bay analysed, as shown in Table 3. Hypotheses focusing on the distributions by sampling depth show that concentrations do not change by depth for all locations for all seasons, whereby results for H8, H9, and H10, analysing concentrations of samples collected at the three depths chosen, prove that all hypotheses are rejected for all bays for most elements.
Elements whose concentrations differed by depth include Al2O3, BaO, La2O3, MgO, Na2O, Nb2O5, TeO2, and V2O5. Such highly industrial oxides are utilised as alloying elements in the cement industry; as waste treatment and tar industry by-products; in the medical and fireproofing industries; and for the production of glass. Hypotheses H11-H17 analyse if elemental distributions are the same for distance from the shoreline. The distance from the sea was subdivided into five groups of 10 m ranges. The last group with 40 m < L < 50 m was not computed as the amount of data available for that set is insufficient for statistical computation. The results summarised in Table 3 demonstrate that most distributions vary by distance from the shoreline, and thus elemental concentrations may vary depending on their source—sea or land.
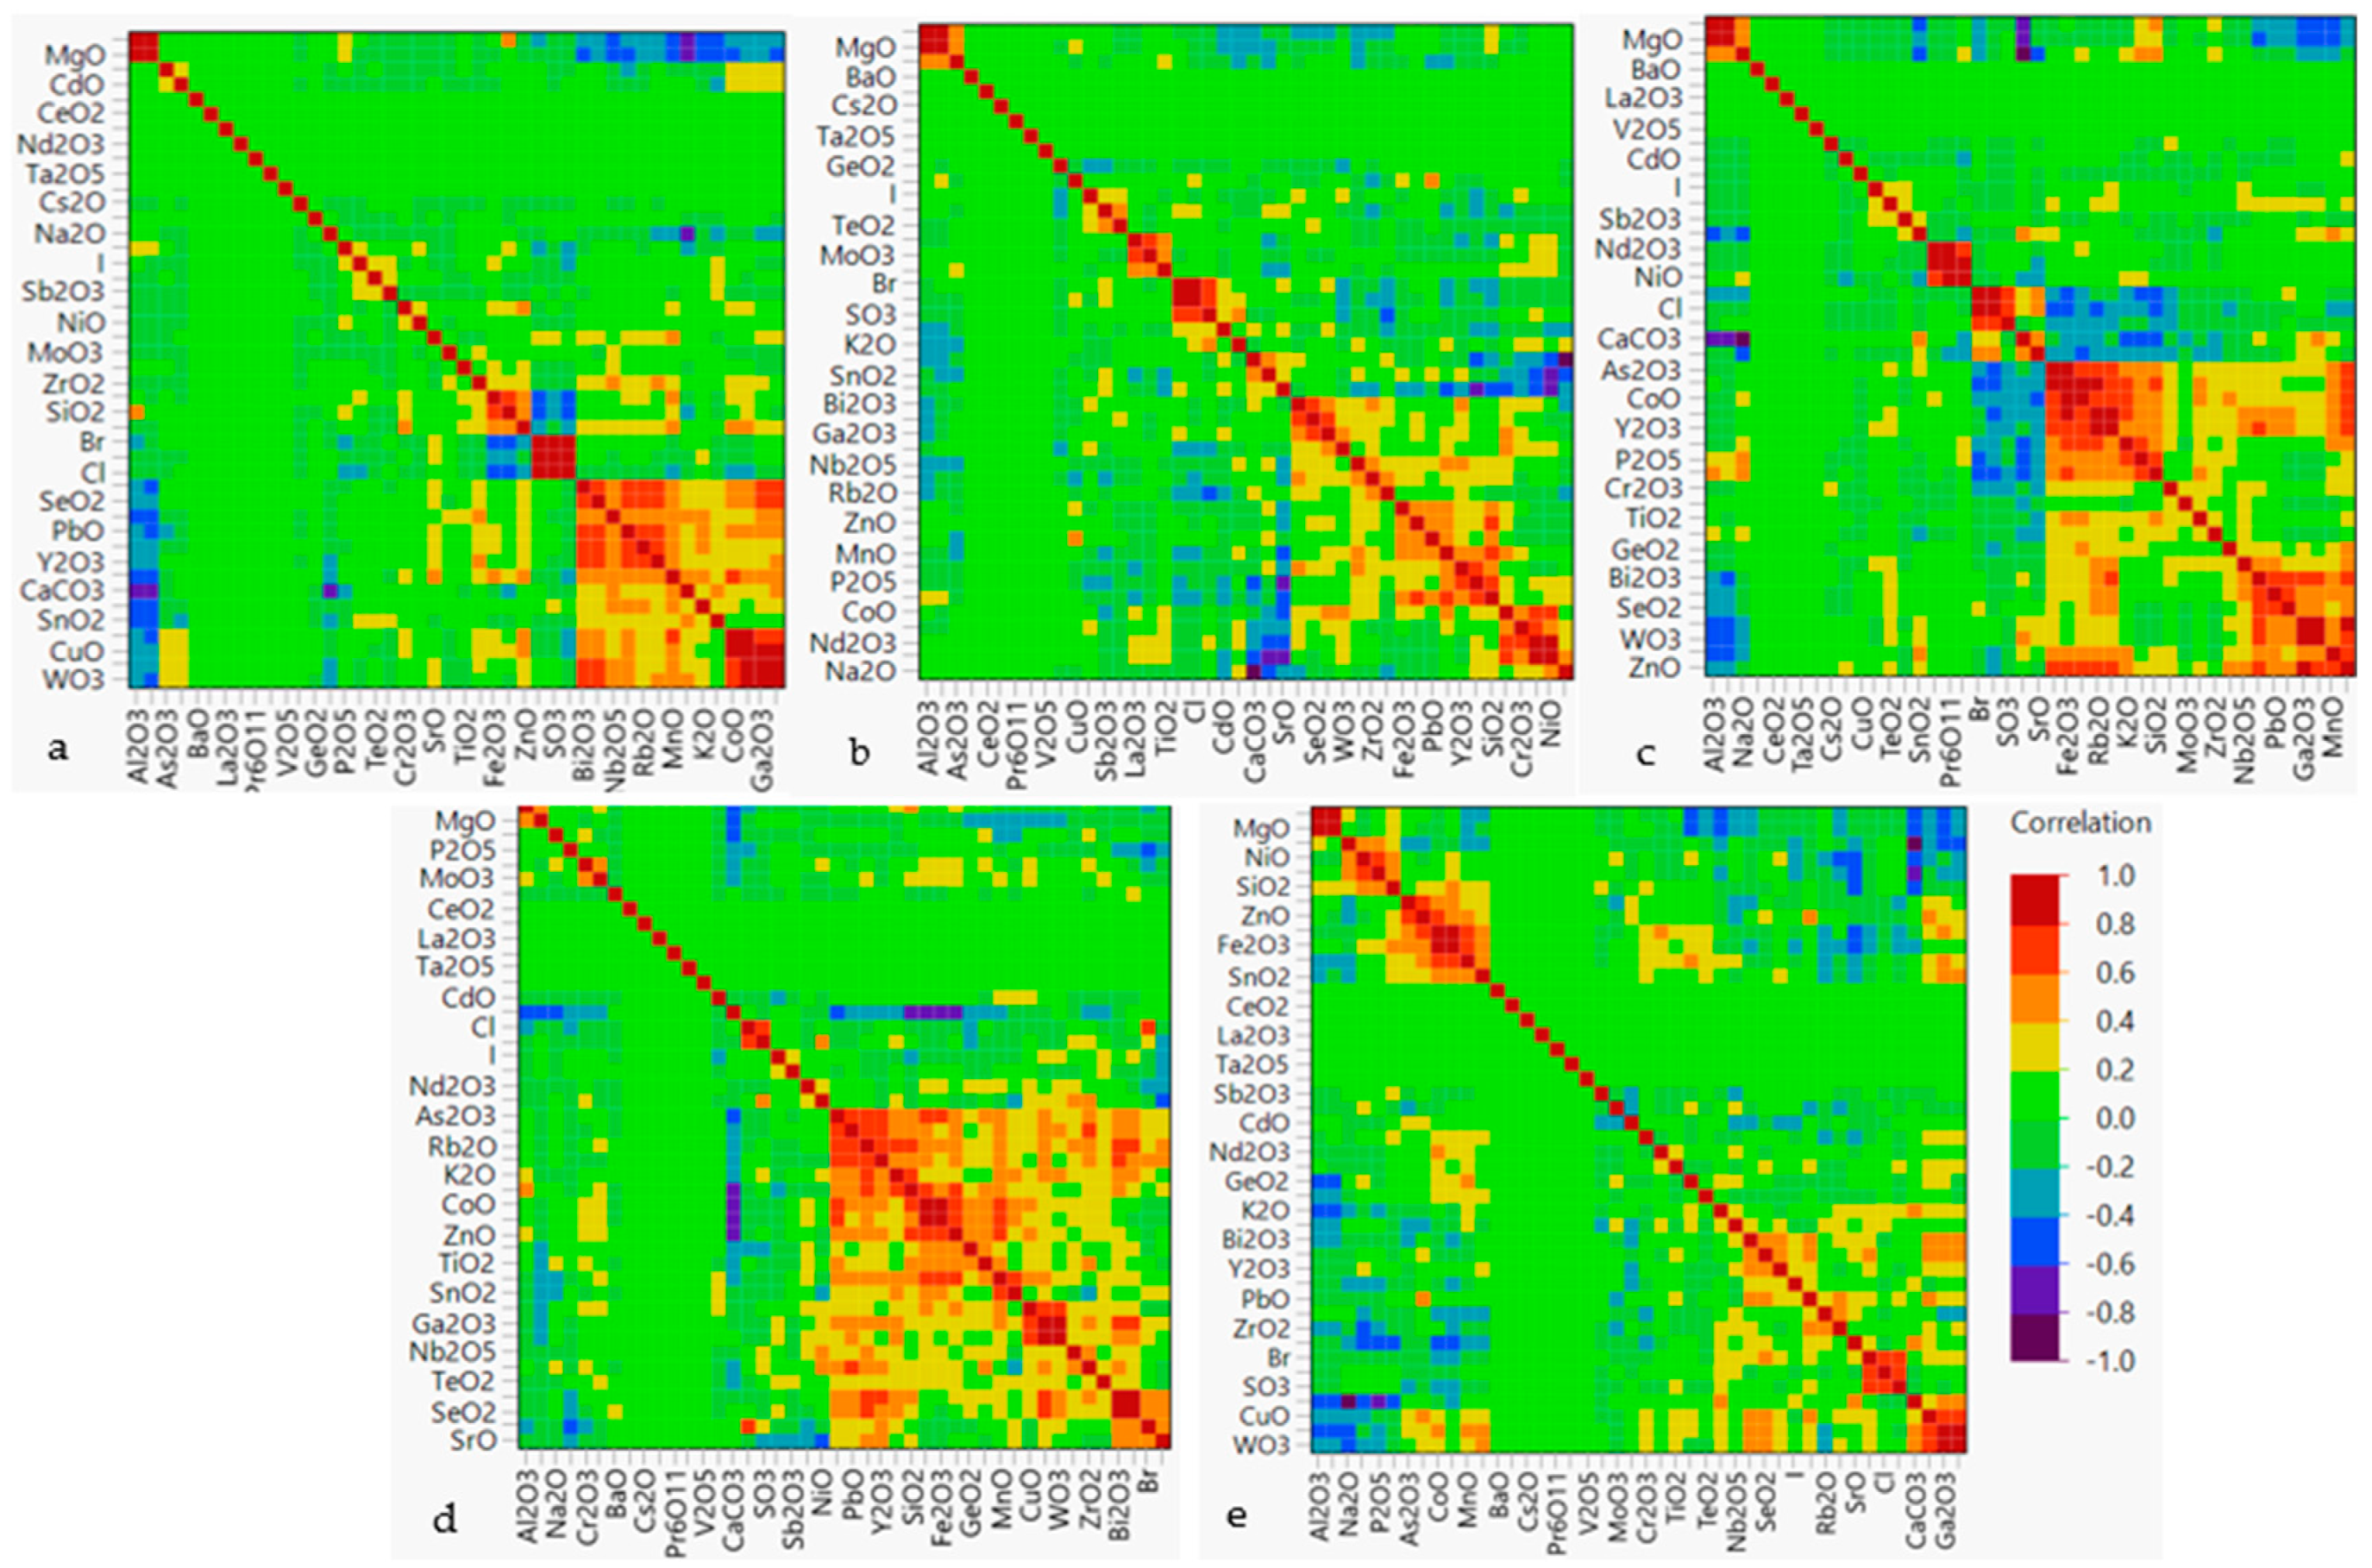
Multivariate analysis for pairwise correlations carried out on the data for all bays together proved strong positive correlations for As2O3 with CoO, MnO, and Fe2O3, Nd2O3 with NiO, Cl with SO3 and Br, and Al2O3 with MgO for 0.7 ≤ p ≤ 0.8. Higher correlations resulted in relationships between CoO and MnO (p = 0.855), CoO and Fe2O3 (p = 0.971), Fe2O3 and MnO (p = 0.838), PbO and ZnO (p = 0.929), WO3 and Ga2O3 (p = 0.875), and Bi2O3 and SeO2 (p = 0.808). Gallium (III) oxide (Ga2O3) had a lower correlation with Bi2O3 (p = 0.681), and a much lower correlation with Br and CaCO3, proving a lower dependency of the latter two metallic oxides. The strongest negative correlation resulted between CaCO3 and Na2O with p = −0.829, proving that as the matrix concentration increases, the Na content present in the sample decreases. Moderately strong correlations were observed for SrO with As2O3 (p = −0.677), Fe2O3 with SeO2 (p = −0.454), CaCO3 with Al2O3 (p = −0.526), SrO with CoO (p = −0.470), and with MnO (p = −0.519). These correlations are studied in more detail per bay as illustrated in Figure 2, which includes colour maps on pairwise clustered correlations for the respective bays studied. It can be observed that many strong correlations resulted for samples collected from Ramla Bay and Marsalforn Bay for data from all four sampling sets. This conclusion shall be further investigated.

3.4. Unsupervised Chemometric Techniques—PCA and FA

Principal Components Analysis (PCA) and Factor Analysis (FA) have been used to minimise variations within distributions without losing important relationships among elemental concentrations obtained. This variable reduction procedure enables the visualisation of data in a decreased amount of principal components, accounting for most of the variance in the observed dataset, without separation into groups. This avoids redundancy in the original variables which is present due to the natural correlations among elemental concentrations. Thus, PCA offers the visualisation of possible clustering within the concentrations obtained.
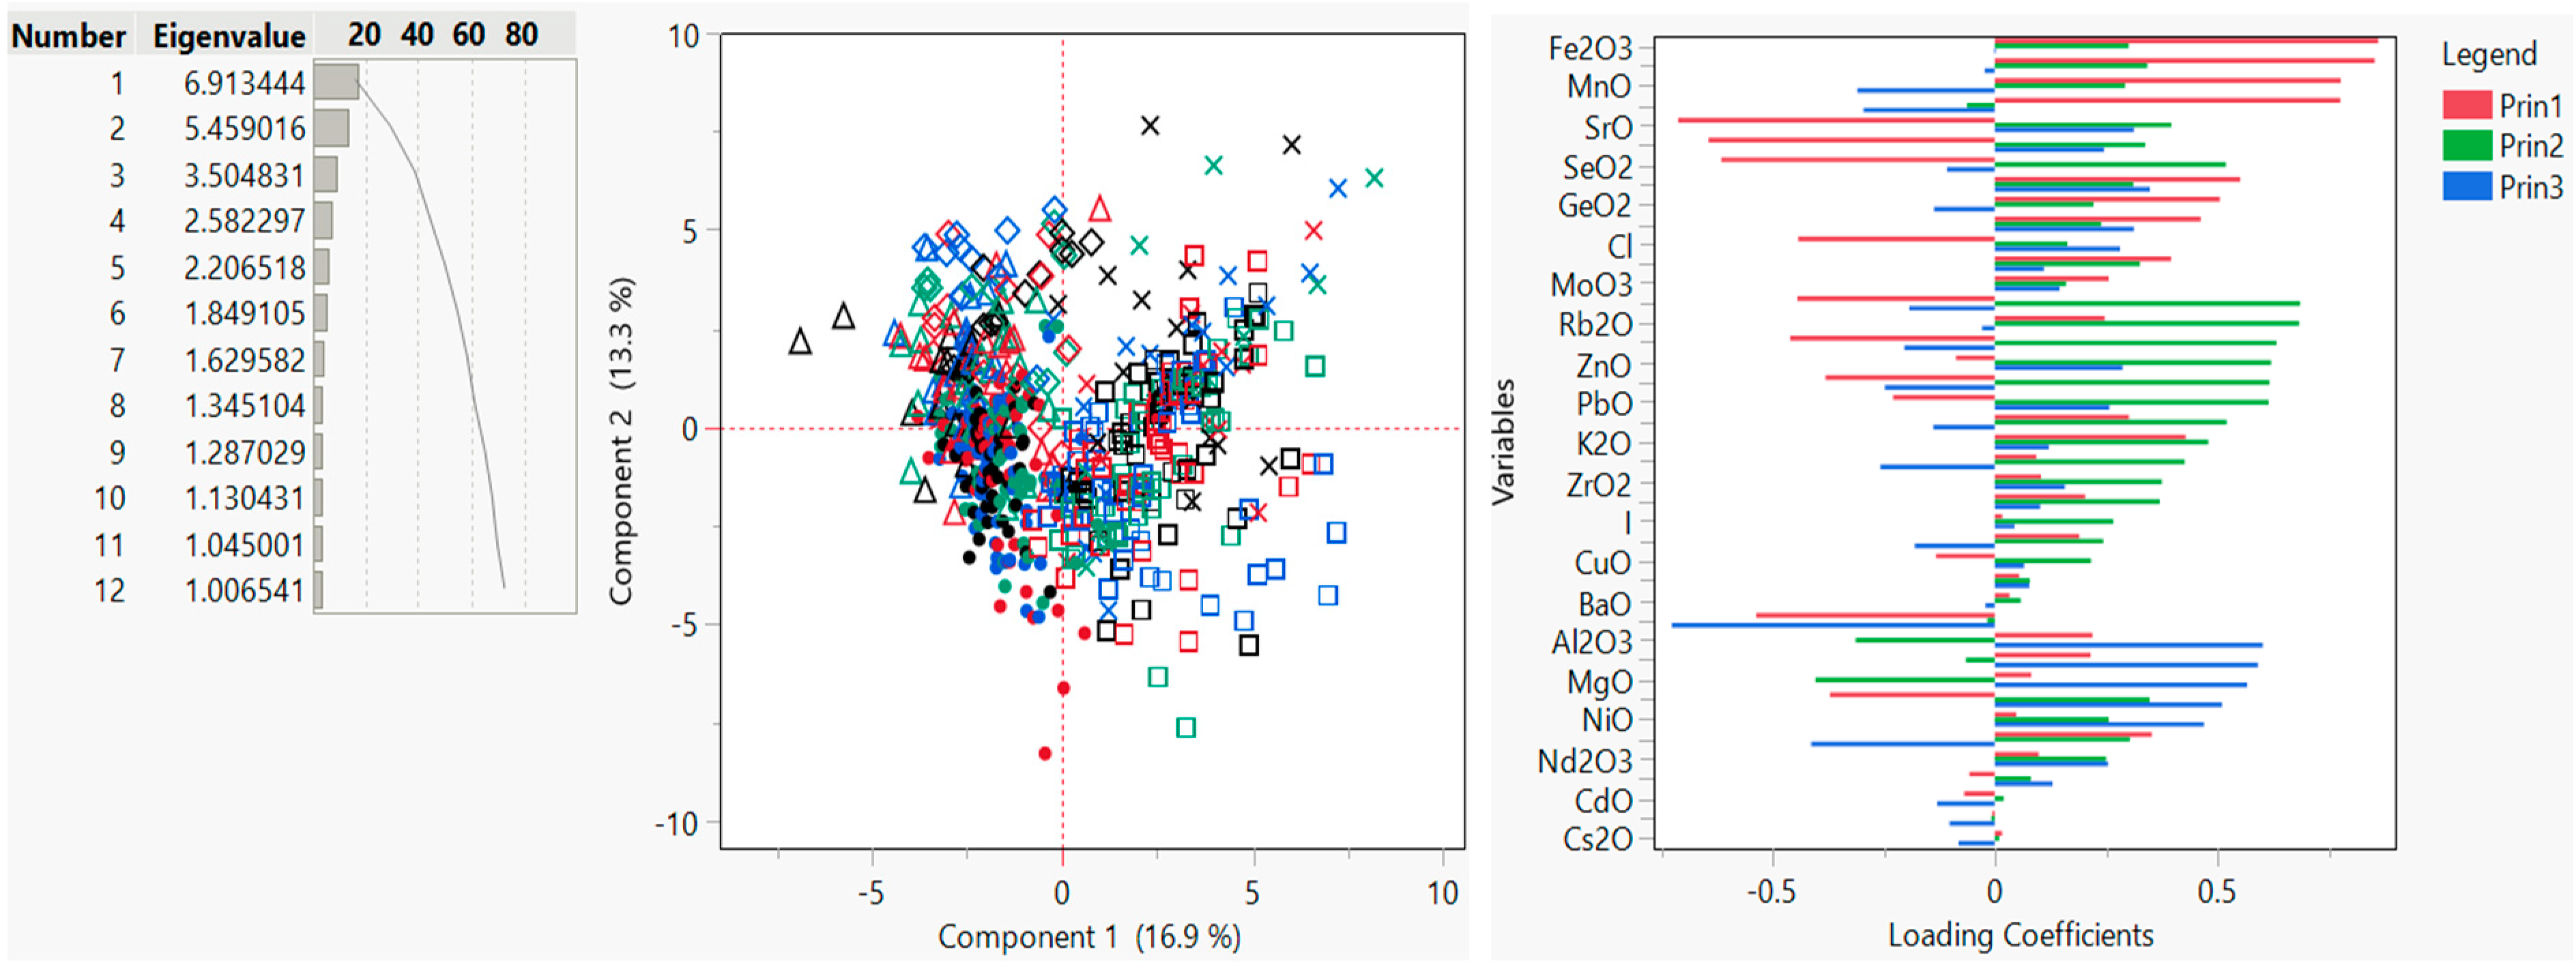
An eigenvalue of 6.913 with 16.862% and a cumulative percentage of 16.862% for PC1 was obtained, an eigenvalue of 5.459 with 13.315% and a cumulative percentage of 30.177% for PC2, and an eigenvalue of 3.505 with 8.548% and a cumulative percentage of 38.725% for PC3 were achieved. Upon applying factor analysis, thirteen factors were retained by the number of factor criterion using the Maximum Likelihood/Varimax rotations. A variance of 5.264 with 11.963% and a cumulative percentage of 11.963% was obtained for Factor 1, a variance of 3.013 with 6.847% and a cumulative percentage of 18.810% was achieved for Factor 2, and a variance of 0.1972 with 0.448% and a cumulative percentage explaining 57.735% of the data was obtained for Factor 13, as documented in Figure 3 and Figure 4.
Score plots extracted for PC1 and PC2 showed a low percentage variability explained. This is due to a high degree of redundancy in the dataset analysed, together with a lot of mixing of the elemental distributions (variables) creating very weak correlations. This makes it difficult for any principal component to map the variability in the distributions, as illustrated below.
With reference to Figure 4, no strong effects can be attributed to the elements under study as the highest loading under PC1 was that of 0.328 for Fe2O3. Similar loading values were obtained for CoO, As2O3, and MnO, but no exceptional dominance was shown by the loadings assigned. The highest negative loading values under PC1 were allocated for SrO, SeO2, and CaCO3. This could possibly indicate that the elements with the highest loadings in PC1 are prevalently of lithogenic origin. The lack of dominance could prove that the source of the elements is not only lithogenic, but these have an anthropogenic effect on them as well. Thus, each elemental concentration obtained is most likely the combination of a concentration which originates from a natural source, and another fraction which arises from the effects of human activities. The highest factor loading in PC2 is for Ga2O3 with an eigenvector value of 0.294. The highly influencing oxides classified under PC2 include Bi2O3, Rb2O3, WO3, ZnO, PbO, and Y2O3; which are elements highly used in industry, especially in the glass-ceramic industry.
Factor Analysis (FA) confirms these results by assigning Fe2O3, CoO, MnO, As2O3, and SnO2 the highest positive loading values in F1, while allocating the lowest negative loading value to SrO. Within F2, the elemental distribution given the most dominant loading values included Rb2O, Y2O3, Bi2O3, SeO2, Nb2O5, and ZrO2. These results match those observed in PC2, with the exception of ZnO and PbO which were assigned factor loading values exceeding 0.9 in F3 instead.
Such results were represented graphically on a scatterplot, as shown in Figure 4, but the vectors obtained were highly overlapping, and grouping them into clusters by bay, season, depth, or distance from the shoreline was not possible. It could be observed that the most dispersed vectors plotted were those for Rinella Bay and Marsalforn Bay. One should note that both bays are located within operational ports of the local marine industry, and are located in enclosed zones. Thus, any contamination resulting from human activity tends to linger longer in the area, with an increased effect on the surrounding environment due to the lack of sea currents.

3.5. Supervised Chemometric Techniques—LDA

Discriminant Analysis using a linear method and canonical plots was used to emphasise and highlight any patterns in the elemental distribution by finding linear combinations that optimally separate the data in groups. This focuses on dimensionality reduction by maximising the between-group variance and minimising the within-group variance.
Groups for which dataset was analysed included season—summer and winter, location—Għadira Bay, Ballut Reserve Bay, Ramla Bay, Marsalforn Bay, and Rinella Bay— depth—top layer, 10 cm depth, and 20 cm depth—and distance from shoreline—L = 0 m, L < 10 m, 10 m < L < 20 m, 20 m < L < 30 m, 30 m < L < 40 m, and 40 m < L < 50 m.
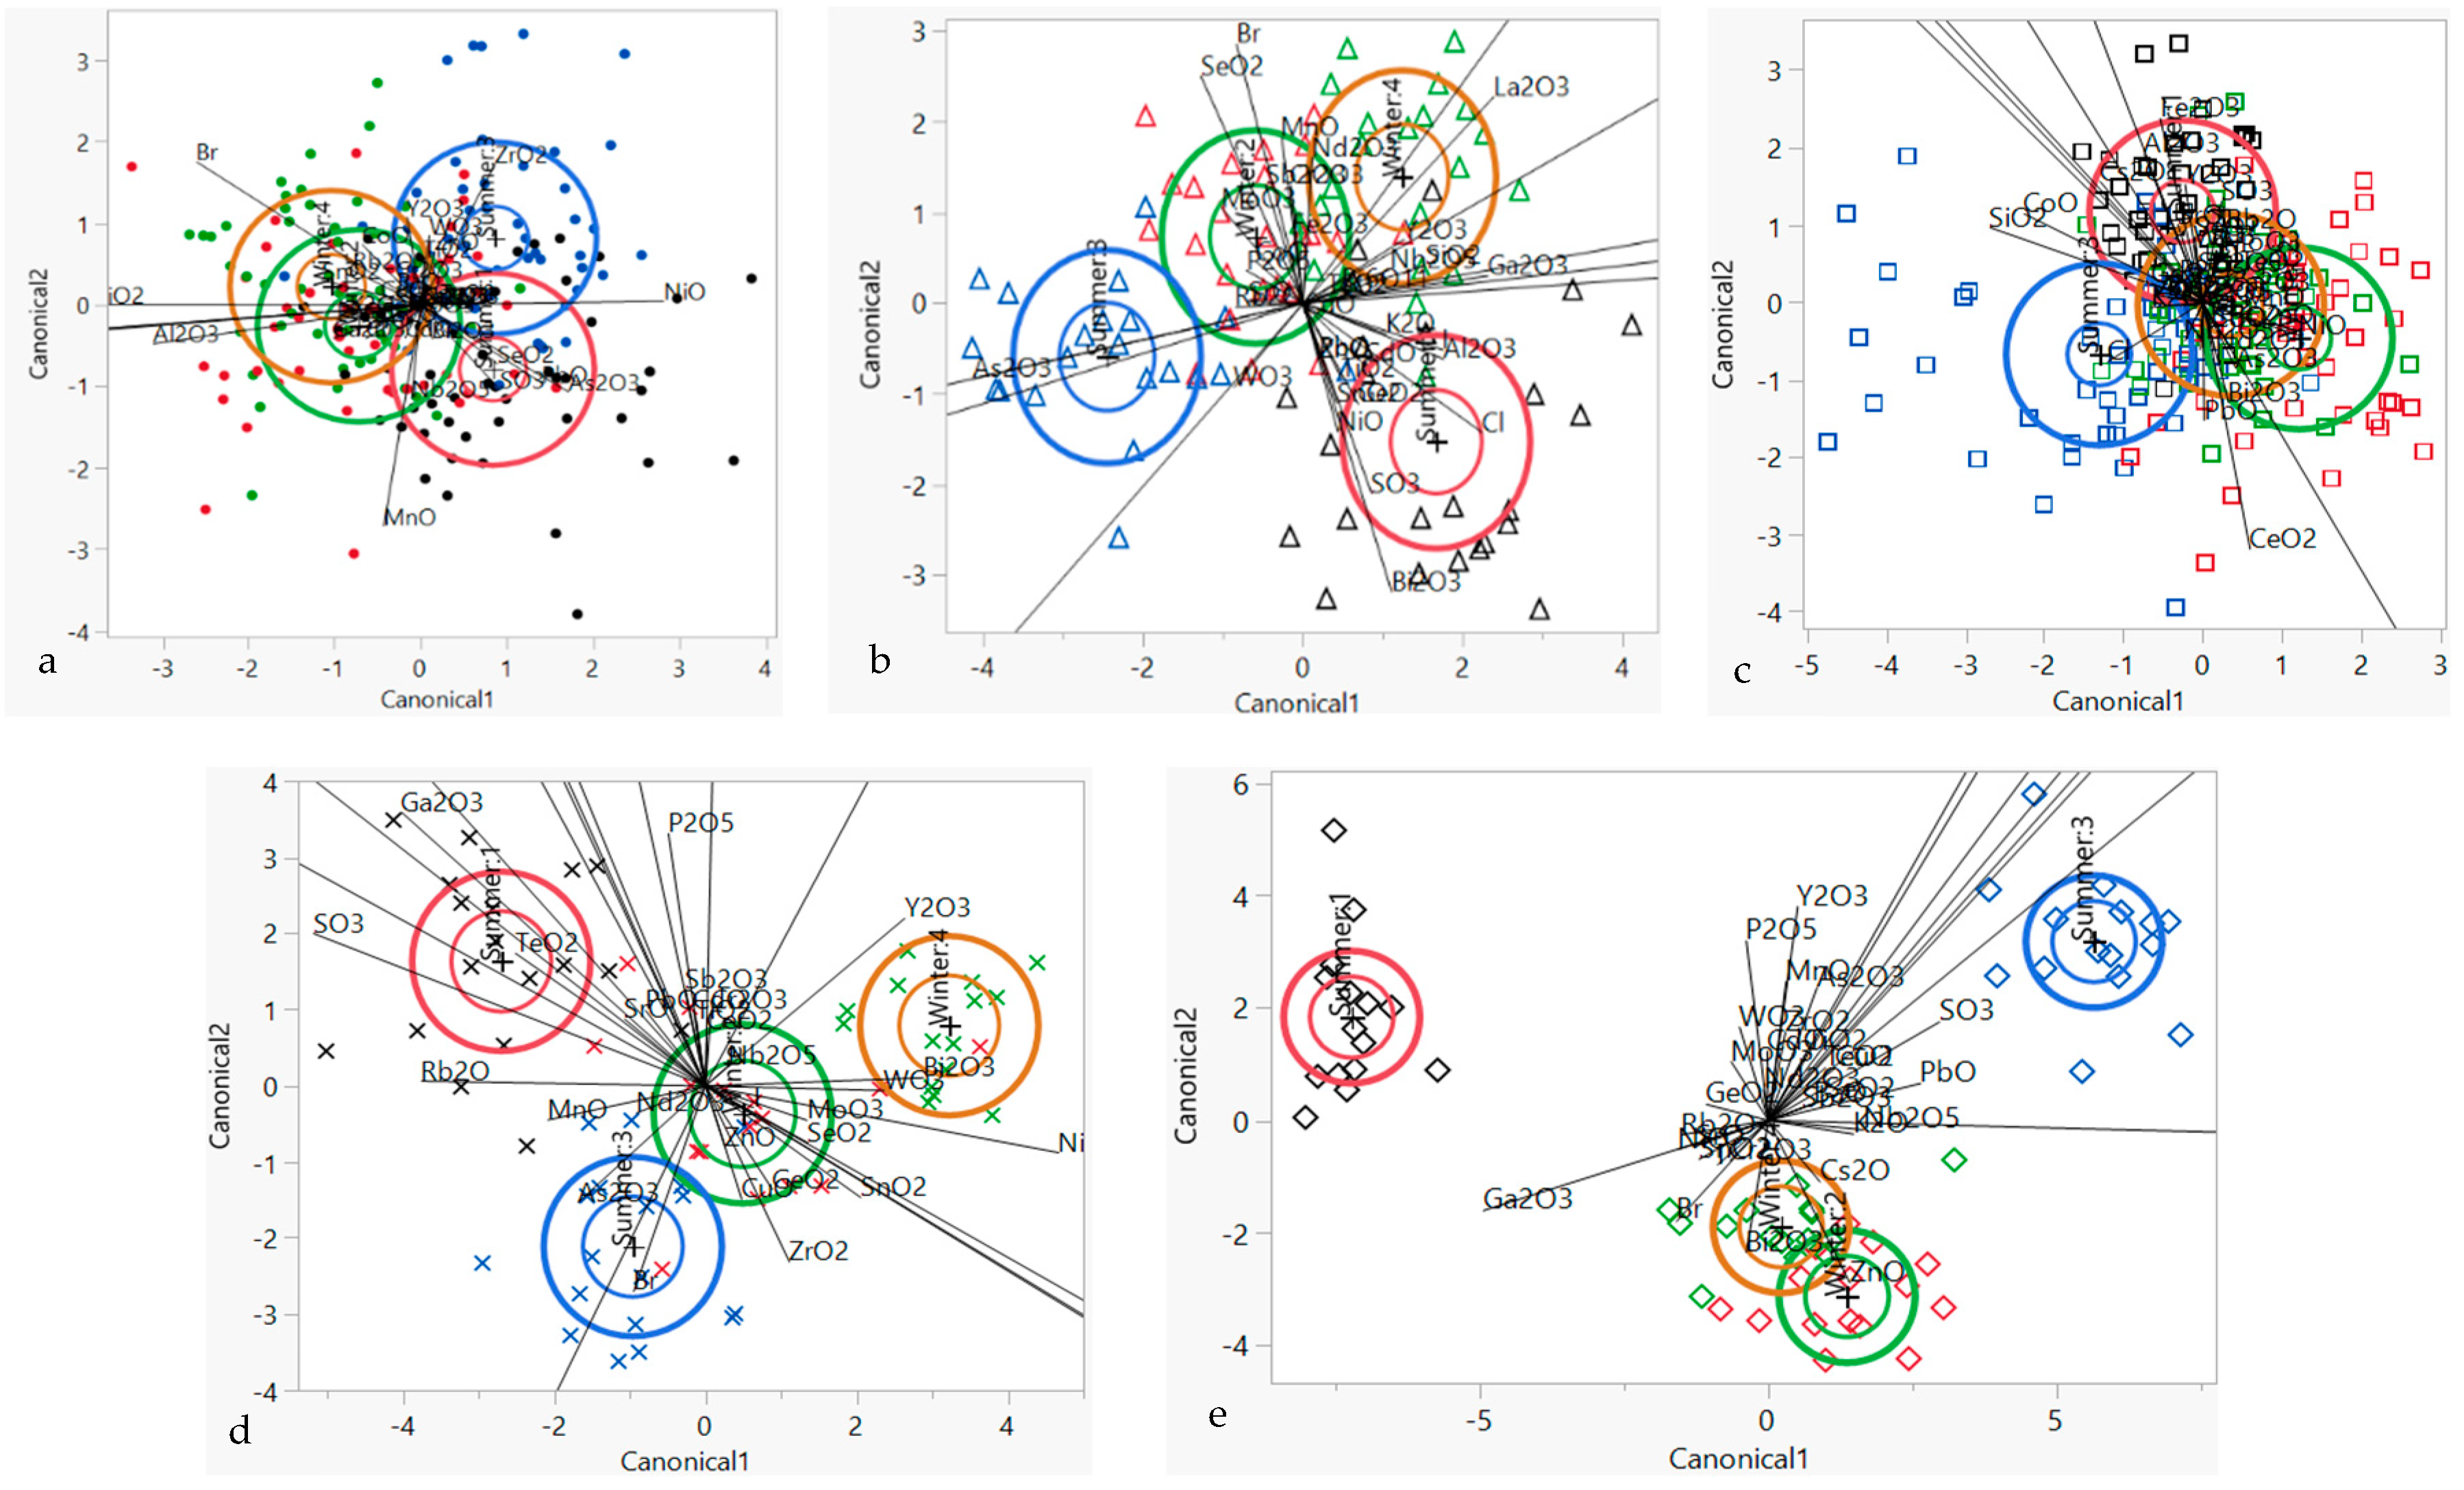
Linear Discriminant Analysis (LDA) was first carried out on the whole dataset available for each of the groups listed above. The best outcome worth recording is shown in Figure 5 below, which outlines the discrimination of the elemental distributions per bay for all four sampling seasons (two in summer—summer 2022 and summer 2023—and two in winter—winter 2023 and winter 2024). Discrimination analysis by season, depth, and distance from the shoreline showed a lack of possible discrimination for the distributions, and thus the method used was not appropriate to distinguish variabilities and patterns in the data.
As illustrated in Figure 5, plots for Marsalforn Bay and Rinella Bay show that data obtained for heavy metal concentrations for all four sampling sets differ substantially. It should be noted that Marsalforn Bay is located on the north-eastern coast of Gozo while Rinella Bay is on the eastern coast of Malta, so no physical link can be attributed to such results. The results presented for Marsalforn Bay prove general clustering for Winter 2 (March 2023) and Summer 3 (September 2023) readings. It is worth noting that during the winter months, Marsalforn Bay has a lot of algae washed in onto the sand, so much so that the beach has to be cleaned before the summer months, and the sand is replenished at the beginning of every summer. The sand used is from a nearby beach which is located within a few hundred meters. Although both beaches are of a similar nature and are located on the same coastline, the variation in results obtained could be attributed to this. With regards to the variation in results obtained for Rinella Bay, it must be mentioned that this bay is located extremely close to the harbour where marine activity and maritime traffic are prominent. The marine industry for cleansing vessels is present within the local dockyards in such zones. Hence, variation in human industrial activity and possible industrial effluent draining to sea may be the cause of such variation in the data obtained. The canonical plot obtained for data representing Ballut Reserve Bay shows dispersed results as well. Ballut Reserve Bay is located on the south-eastern Maltese coast, and is positioned close to the local power station and freeport. The area is thus highly industrialised. Apart from this, this bay forms part of a fishing village with fishing boats docked close by, and human activity is highly notorious. Canonical plots for Għadira Bay and Ramla Bay show clustering of results for the sampled seasons. Such overlap in groupings obtained for Winter 2 (March 2023) and Winter 4 (March 2024) is controversial, as during the winter months of 2024 extensive road works were being carried out, highly affecting the natural beach environment. The results obtained for Ramla Bay are optimal, coinciding with the realistic activities taking place on this beach. Ramla Bay has become a favourite nesting destination for turtles during the past few years, and thus its natural ecosystems are being protected by ERA and Nature Trust Malta every summer. This is helping the preservation of the natural environment, reducing human trespassing and invasive activities.

3.6. Supervised Chemometric Techniques—Stepwise Linear Canonical Discriminant Analysis (SLC-DA)

Stepwise Linear Canonical Discriminant Analysis (SLC-DA) was used to obtain a solid method of classification using fewer variables to be able to extract a smaller amount of variables which can be highly discriminated to explain the variability of heavy metal distributions in the sand. Using JMP Pro 17.0, a forward stepwise variable selection algorithm was used using Wilks’ Lambda criterion and an F-statistic factor to determine the significance of changes in λ to assess the effect of the variable included in the analysis. Table 4 shows the statistical computational results used for the SLC-DA carried out on each group.
Stepwise Linear Canonical Discriminant Analysis (SLC-DA) helped by performing feature selection, discriminating the dataset better than the conventional LDA method used. The Wilks’ Lambda (λ = 0.768) and Approximate F-statistic (F = 5.068) values obtained for SLC-DA by season indicate that discriminant functions can differentiate between groups by season, although the strength is moderate since the value of λ is not as low. The eigenvalues, together with canonical correlations and percentage explanations for the grouping by season analysis, suggest a moderate explanatory power of the first function of seasonal variability. Wilks’ Lambda value obtained for DA by location resulted in a very low value (λ = 0.0000586), indicating a very high discrimination power for this grouping variable. The Approximate F-statistic (F = 230.269) obtained is very high, reflecting strong group differences. Canonical values obtained show that the first canonical function explains a large amount of the variance, as this has a very high correlation with the location variable. This consolidates that location has a very strong impact on the distribution of PTE in sand, as observed by the high canonical correlations and the significant reduction in Wilks’ Lambda. The results obtained for SLC-DA by depth and distance from shoreline show moderate to weak discriminatory power for these variables (λDepth = 0.970; Approx. FDepth = 4.653; and λDFS = 0.614; Approx. FDFS = 5.639); whereby distance from shoreline has slightly better discrimination than depth on the elemental distributions studied. For both variables, it can be noted that the first few canonical functions explain most of the variability at moderate levels of correlation.
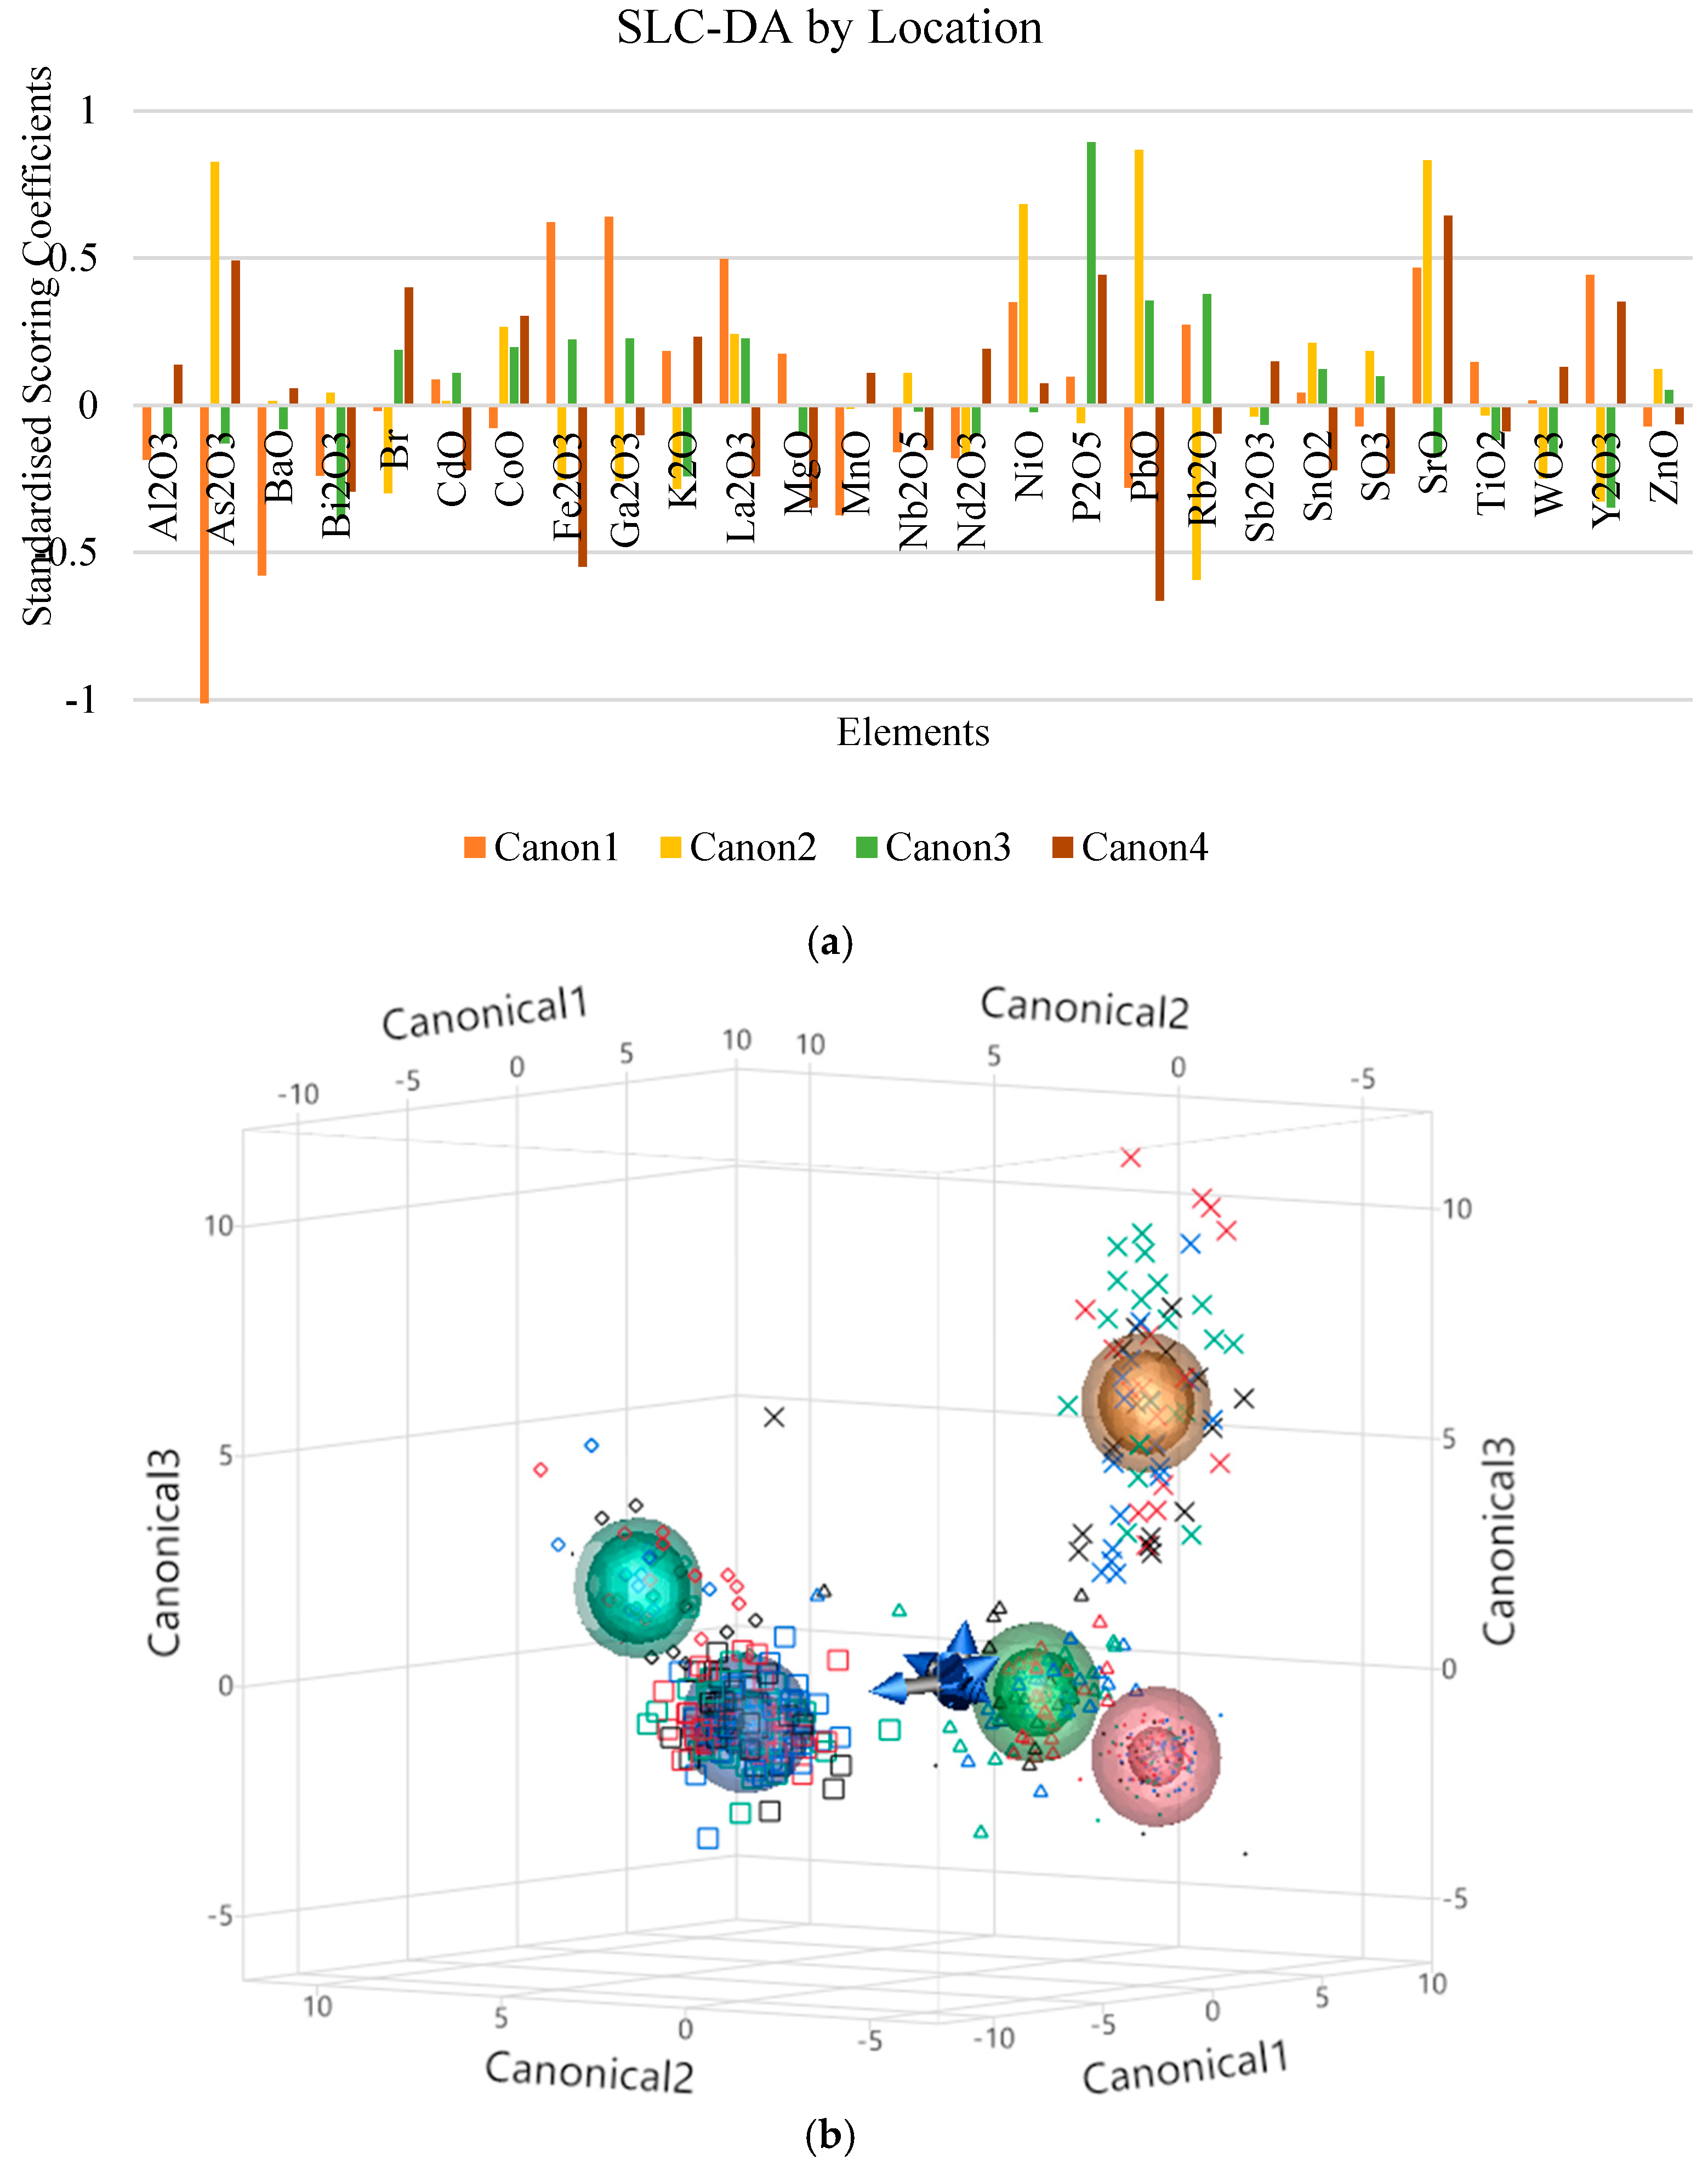
The results in Figure 6a,b illustrate the most significant retained variables for the group ‘By Location’ assessed, showing canonical scoring coefficients to aid understanding of the weighting of each variable in the canonical discriminant functions.
The 3D canonical plots provide a visual representation of how well the different groups are separated in the canonical space. These highlight the most discriminative variables that SLC-DA has identified for the classification of PTE in the opportunity to understand which specific factors drive heavy metal variability. Standardised scoring coefficients for discrimination by season show that CoO and Fe2O3 are highly discriminating, particularly in Canonical 1. Their effect in Canonical 2 and Canonical 3 provides additional discrimination but smaller, based on different elements. Elements including As2O3, P2O5, Fe2O3, and CoO are the key variables for separating the data by location. Canonical 1 and Canonical 2 provide most of the discriminatory power between locations, with the elements As2O3 and P2O5 being particularly influential. Canonical 3 and Canonical 4 explain additional variation but at a smaller magnitude, focusing on other elements including CoO, TiO2, and MgO. Elements P2O5 and Sb2O3 appear consistently significant across multiple canonical functions, suggesting they are also critical for differentiating by location. Elements As2O3 and Fe2O3 show strong opposing effects in the canonical functions, signifying their essential roles in the differentiation based on location. Stepwise Linear Canonical Discriminant Analysis (SLC-DA) results for depth suggest that depth plays a significant role in the distribution of SO3 and TeO2, with TeO2 increasing with depth (as Canonical 1 is positive) and SO3 having a complex relationship (since Canonical 1 is negative, and Canonical 2 is positive). The negative Canonical 1 value attributed to SO3 (−0.776) implies that deeper samples are likely associated with lower levels of this element. The positive scoring coefficient attributed to TeO2 (0.789) indicates that TeO2 concentrations also increase with depth. Distance from the shoreline is strongly influenced by Fe2O3 and CoO, with Canon1 and Canon2 explaining most of the variability. Canonical functions 3 to 5 also contribute but with less impact, suggesting more nuanced discrimination between distances based on other elements like SrO and P2O5.

3.7. Supervised Chemometric Techniques—Partial Least Squares Discriminant Analysis (PLS-DA)

Partial Least Squares Discriminant Analysis (PLS-DA) was used for its benefits in handling multicollinearity and its ability to reduce high-dimensional datasets focusing on the most significant variables and simplifying datasets into groups while retaining important information for classification [57,58,59]. Partial Least Squares Discriminant Analysis (PLS-DA) was used to maximise the covariance between the independent variables (PTE concentrations) and the dependent categorical variable (groups). Once the chosen matrix used for the PLS-DA model was trained, prediction values for the new observations based on their predictor variables were obtained. To ensure the reliability of the prediction model, a binary cross-validation method was used, where the dataset is split into training and test sets to evaluate the model’s predictive performance [58].
The dataset, comprising 619 observations in total, was first subdivided into two sets of data—every 1 in 5 observations, i.e., i = 5 n where n = 1 ,   2 ,   3 , ,   619 was excluded to form part of the testing dataset representing 20% of the entire dataset. The same was done to the dataset in MS Excel where the dependent variable to be analysed by Partial Least Squares (PLS) was substituted by a combination binary matrix of n 1 , where n is the amount of possible labels attributed to the variable. This matrix was transferred to the remaining training set representing 80% of the data on JMP Pro 17.0 for assessment using the PLS regression algorithm together with the leave-one-out cross-validation (LOOCV) method in-built in the software. The prediction formula built through PLS regression analysis on the training set was converted to binary form (score ≥ 0.5 is unity) and applied to the training set in MS Excel. The IF function was used to check if the predicted set from JMP Pro 17.0 matches the outcome of the actual set of data on MS Excel, whereby 0 was assigned if the prediction outcome matched the original binary matrix value set for the variable label and a 1 was given if the prediction outcome mismatched the original matrix value. The % misclassified accuracy, % sensitivity, % specificity and % precision were calculated using the below equations:
%   M i s c l a s s i f i e d   a c c u r a c y = N u m b e r   o f   m i s c l a s s i f i e d   o b s e r v a t i o n s T o t a l   n u m b e r   o f   o b s e r v a t i o n s
%   S e n s i t i v i t y = T P T P + F N
%   S p e c i f i c i t y = T N T N + F P
%   P r e c i s i o n = T P T P + F P
where TP—True Positives, Actual 0 Predicted 0; FP—False Positives, Actual 1 Predicted 0; TN—True Negative, Actual 1 Predicted 1; FN—False Negative, Actual 0 Predicted 1; Misclassified accuracy—proportion of incorrect predictions; Sensitivity—proportion of actual positives correctly identified; Specificity—proportion of actual negatives correctly identified; and Precision—proportion of predicted correct positives [60,61,62].
Similarly, the % misclassified observations for the training and testing sets were calculated. These values were matched with the ones obtained statistically after completing the PLS-DA with LOOCV (Table S2). It can be observed that PLS-DA could only predict the model for the distribution analysed for location. Values for Root Mean PRESS, van der Voet T2 test, and probability > T2 could not be computed for the season, depth, and distance from the shoreline groups.
The van der Voet T2 test determines whether the PLS model extracted with a specific number of factors differs from the proposed original model, and checks whether both models have the same predictability. From Table S2, the location group shows p > T2 > 0.1 (for a 90% confidence interval), showing that there is no significant difference between the model obtained and the original. Percentage Cumulative variation values for X and Y tabulated show that location is the most predictable group, thus indicating that the PLS-DA model used is highly effective in capturing variability in both the predictor variables and the testing sets. For the group depth, a high % X variance and a low % Y variance suggest that the predictors are able to explain a portion of the variance, but the model is not effective at distinguishing between classes. For season and distance from shoreline, a low cumulative variance was obtained, suggesting that the models are not strong enough to predict concentrations. Percentage Misclassification accuracy consolidates these outcomes as the lowest misclassification rate obtained is for location (3.231%, with a Sensitivity of 99.686% and Specificity of 98.387%), showing that the model is very accurate at distinguishing between classes for this group. Season and distance from shoreline show higher misclassification rates, showing that these models perform poorly at distinguishing their respective classes. Depth also gave a high misclassification accuracy (64.782%), with a Sensitivity of 95.488% but a very low Specificity of 12.919%. This shows that the model can detect true positives but is weak at identifying true negatives. Such imbalance suggests that this model overpredicts a particular class of values. Cross-validation performance is described using R2 Accuracy. The R-squared Accuracy value for location shows high predictive accuracy, suggesting that the predictors are well-suited to distinguish between the different locations based on sand composition. The R-squared Accuracy values for season, depth, and distance from shoreline were not computed using LOOCV with NIPALS with Fast SVD, as the extraction of variables and factors from the given dataset proved difficult due to possible collinearity.
More insights into these PLS-DA models were obtained using the VIP scores with threshold value > 0.8 (significant contribution to discrimination) to determine which predictors are influencing the latent variables obtained. The Variable Importance Plots for the latent variable location for the original dataset used for PLS-DA modelling (Figure 7a) and the cross-validated dataset using the VIP scores of the original PLS-DA model to re-run the model (Figure 7b) are illustrated in Figure 7. As shown in Figure 7a, the VIP scores > 0.8 identified relevant elements which have also been proven as significant in other statistical outcomes such as PCA and SLC-DA, namely As2O3, P2O5, and SrO. However, it must be noted that some data not attributed to a high VIP score were also selected.
Thus, a second cross-validation was carried out by building another PLS-DA model using the variables which were assigned a VIP score > 0.8 in the first PLS-DA model. Some variable selection has managed to reduce the collinearity within the data, improving the PLS-DA model obtained. These results are tabulated in Table 5.
Location shows the highest % cumulative variance explained (96.773% for X and 86.487% for Y), indicating a high degree of model fit, and adequacy of model to distinguish between location-based samples. Distance from shoreline produced a high % Cumulative X variance but a low % Cumulative Y variance, thus showing that the overall variance can be predicted but the separation between distance gaps is lacking. The same behaviour has been modelled for the season variable, while depth has portrayed the lowest % Cumulative variances for both X and Y, indicating that the model used is not influenced by the predictor variables chosen. The relatively high number of VIPs extracted for all groups reflects the complexity of the relationships between predictor variables and the classifications. However, the strong performance in certain groups (location, distance) suggests that a smaller, targeted subset of predictors could lead to more efficient models with similar predictive accuracy. Overall, the PLS-DA model performs very well for predicting location, with high cumulative variance explained, a high number of important predictors, and excellent accuracy metrics. However, the model struggles with season and depth, where low cumulative explained variance and high misclassification rates suggest that the predictors or the modelling approach might not be fully mapping the interactions present. Distance from shoreline performs moderately well but still requires improvements, particularly in specificity and misclassification accuracy.

4. Conclusions

The work carried out proves the high mineralogical content available in Maltese sand. Although the method of analysis used is of a semi-quantitative nature, patterns in the elemental distributions obtained proved that PTE oxide content is particularly present and indicated the potential for further assessment. This study has shown that ED-XRF is an effective tool to assess PTE oxide content in sand without the need for extensive preparatory work. Plenty of statistical analysis tests have been utilised to investigate the interactions and effects of the PTE concentrations studied. The datasets obtained can be classified into location, season, depth, and distance from shoreline. Statistical analysis identified that the highest discriminatory effect is by location, followed by season, with depth and distance from shoreline being much less significant. Such results were proven by PCA, SLC-DA, and PLS-DA using LOOCV with VIP scores. This proves that location is the most influential parameter for the classification of heavy metal concentrations, with little effect from seasonal changes. Concentrations are almost completely unaffected by depth and distance from shoreline variability, which shows that bioaccumulation effects and anthropogenic effects from land are not concentrated in particular zones but are spread out spatially along the bay and do not increase with depth. Elements including As2O3, P2O5, SrO, Fe2O3, CoO, MnO, SO3, ZnO, PbO, TiO2, and SnO2 are the most effective elements in describing PTE distributions in sand from Maltese beaches. The origin of PTE concentrations is attributed to a mix of anthropogenic and lithogenic factors which pollute our beaches through multiple activities which may be affected by environmental, chemical, and human activity.
Through the work carried out so far, it was observed that distributions of certain PTE and other oxides vary due to yet-undescribed effects originating from possible anthropogenic and bacterial activity. Extraction using set protocols and analyses of analytes using 3D fluorescence produces a distribution of fluorescent compounds which, when linked statistically to concentrations and the statistical results already obtained, would group distributions according to their source and origin. Sand samples may also be analysed for bacterial presence. Anaerobic bacteria could be detected and quantified using predefined standard methods, giving a full profile showing the variation of biological presence which may be triggered by the bioaccumulation of both metallic and non-metallic elements in the sand over time originating from anthropogenic sources. This offers a full profile of environmental hazards present in sand, quantifying and finding logical patterns in the variability of different concentrations of compounds. Thus, it contributes to understanding the wider scenario of pollutants in conjunction with fluorescent compounds and bacterial growth.

Supplementary Materials

The following supporting information can be downloaded at: https://www.mdpi.com/article/10.3390/environments11120299/s1, Table S1: Coordinates for sampling points in all beaches under study; Table S2: Normality test results for elements studied; Table S3: PLS-DA analysis using LOOCV on the training group chosen from the entire dataset (top table) and cross-validation results on the corresponding testing dataset (bottom table).

Author Contributions

Conceptualisation, C.C., F.L. and E.S.; methodology, C.C., F.L. and E.S.; software, C.C. and F.L.; validation, C.C., F.L. and E.S.; formal analysis, C.C. and F.L.; investigation, C.C. and F.L.; data curation, C.C.; writing—original draft preparation, C.C.; writing—review and editing, C.C., F.L. and E.S.; supervision, F.L. and E.S.; funding acquisition, C.C and E.S. All authors have read and agreed to the published version of the manuscript.

Funding

This research was funded by the Tertiary Education Scholarship Scheme (TESS). The APC was funded by the University of Malta.

Data Availability Statement

No new data were created or analyzed in this study. Data sharing is not applicable to this article.

Acknowledgments

The research work disclosed in this publication is funded by the Tertiary Education Scholarship Scheme (TESS) for 2023. Special thanks go to Joseph Grech (Senior Laboratory Officer at the UOM Faculty of Science, Department of Chemistry) for his support and maintenance of the instrumentation.

Conflicts of Interest

The authors declare no conflicts of interest.

References

  1. Gauci, M.; Deidun, A.; Schembri, P. Faunistic diversity of Maltese pocket sandy and shingle beaches: Are these of conservation value? Oceanologia 2005, 47, 219–241. [Google Scholar]
  2. Schembri, P.J. Physical geography and ecology of the Maltese Islands: A brief overview. In Malta: Food, Agriculture, Fisheries and the Environment; Busuttil, S., Lerin, F., Mizzi, L., Eds.; Options Méditerranéennes ser.B: Etudes et Recherches No7; CIHEAM: Paris, France, 1993; pp. 27–39. [Google Scholar]
  3. Cassar, L.F.; Stevens, D.T. Coastal sand Dunes Under Siege: A Guide to Conservation for Environmental Managers. University of Malta. International Environment Institute. Available online: https://www.um.edu.mt/library/oar/handle/123456789/45793 (accessed on 16 October 2024).
  4. Robledo Ardila, P.A.; Álvarez-Alonso, R.; Árcega-Cabrera, F.; Durán Valsero, J.J.; Morales García, R.; Lamas-Cosío, E.; Oceguera-Vargas, I.; DelValls, A. Assessment and Review of Heavy Metals Pollution in Sediments of the Mediterranean Sea. Appl. Sci. 2024, 14, 1435. [Google Scholar] [CrossRef]
  5. El-Amier, Y.A.; Bonanomi, G.; Abd-ElGawad, A.M. Assessment of heavy metals contamination and ecological risks in coastal sediments of the Mediterranean seashore. Reg. Stud. Mar. Sci. 2023, 63, 103017. [Google Scholar] [CrossRef]
  6. Soliman, N.F.; Nasr, S.M.; Okbah, M.A. Potential ecological risk of heavy metals in sediments from the Mediterranean coast. Egypt. J. Environ. Health Sci. Eng. 2015, 13, 70. [Google Scholar] [CrossRef]
  7. Ahdy, H.; Khaled, A. Heavy Metals Contamination in Sediments of the Western Part of Egyptian Mediterranean Sea. Aust. J. Basic Appl. Sci. 2009, 3, 3330–3336. [Google Scholar]
  8. Saddik, M.; Fadili, A.; Makan, A. Assessment of heavy metal contamination in surface sediments along the Mediterranean coast of Morocco. Environ. Monit. Assess. 2019, 191, 197. [Google Scholar] [CrossRef] [PubMed]
  9. Kalantzi, I.; Shimmield, T.M.; Pergantis, S.A.; Papageorgiou, N.; Black, K.D.; Karakassis, I. Heavy metals, trace elements and sediment geochemistry at four Mediterranean fish farms. Sci. Total Environ. 2013, 444, 128–137. [Google Scholar] [CrossRef] [PubMed]
  10. Duodu, G.O.; Goonetilleke, A.; Ayoko, G.A. Potential bioavailability assessment, source apportionment and ecological risk of heavy metals in the sediment of Brisbane River estuary, Australia. Mar. Pollut. Bull. 2017, 117, 523–531. [Google Scholar] [CrossRef]
  11. El Bilali, L.; Rasmussen, P.E.; Hall, G.E.M.; Fortin, D. Role of sediment composition in trace metal distribution in lake sediments. Appl. Geochem. 2002, 17, 1171–1181. [Google Scholar] [CrossRef]
  12. Fujita, M.; Ide, Y.; Sato, D.; Kench, P.S.; Kuwahara, Y.; Yokoki, H.; Kayanne, H. Heavy metal contamination of coastal lagoon sediments: Fongafale Islet, Funafuti Atoll, Tuvalu. Chemosphere 2014, 95, 628–634. [Google Scholar] [CrossRef] [PubMed]
  13. Li, H.; Kang, X.; Li, X.; Li, Q.; Song, J.; Jiao, N.; Zhang, Y. Heavy metals in surface sediments along the Weihai coast, China: Distribution, sources and contamination assessment. Mar. Pollut. Bull. 2017, 115, 551–558. [Google Scholar] [CrossRef]
  14. Cesar, A. Análisis Ecotoxicológico Integrado de la Contaminación Marina en los Sedimentos de la Costa De Murcia: El Caso de Portmán, Sudeste–España. Ph.D. Thesis, Universidad de Murcia, Murcia, Spain, January 2003. [Google Scholar]
  15. Palanques, A.; Diaz, J.I. Anthropogenic heavy metal pollution in the sediments of the Barcelona continental shelf (Northwestern Mediterranean). Mar. Environ. Res. 1994, 38, 17–31. [Google Scholar] [CrossRef]
  16. Azzopardi, I.; Lia, F.; Costa, C. Assessment of Heavy Metal Distributions in Sand Beaches in the Maltese Islands. Appl. Sci. 2022, 12, 7192. [Google Scholar] [CrossRef]
  17. El-Sikaily, A. Health risk assessment in relation to heavy metals pollution of western Mediterranean Sea. Egypt. Egypt J Aquat Biol Fish 2003, 7, 47–66. [Google Scholar] [CrossRef]
  18. Kontas, A.; Uluturhan, E.; Akcali, I.; Darilmaz, E.; Altay, O. Spatial Distribution Patterns, Sources of Heavy Metals, and Relation to Ecological Risk of Surface Sediments of the Cyprus Northern Shelf (Eastern Mediterranean). Environ. Forensics 2015, 16, 264–274. [Google Scholar] [CrossRef]
  19. Duman, M.; Kucuksezgin, F.; Atalar, M.; Akcali, B. Geochemistry of the northern Cyprus (NE Mediterranean) shelf sediments: Implications for anthropogenic and lithogenic impact. Mar. Pollut. Bull. 2012, 64, 2245–2250. [Google Scholar] [CrossRef] [PubMed]
  20. Asare, E.A.; Iya, N.I.D.; Kwabena, D.E. Eurasian Journal of Analytical Chemistry. Eurasian J. Anal. Chem. 2020, 14, 9–20. [Google Scholar]
  21. Barreto, S.R.G.; Nozaki, J.; De Oliveira, E.; Do Nascimento Filho, V.F.; Aragão, P.H.A.; Scarminio, I.S.; Barreto, W.J. Comparison of metal analysis in sediments using EDXRF and ICP-OES with the HCl and Tessie extraction methods. Talanta 2004, 64, 345–354. [Google Scholar] [CrossRef] [PubMed]
  22. Tawfik, W.; El-Saeed, M.; Khalil, A.; Fikry, M. Detection of heavy metal elements by using advanced optical techniques. J. Egypt. Soc. Basic Sci.-Phys. 2024, 1, 99–127. [Google Scholar] [CrossRef]
  23. Scaeteanu, G.; Maria, R.; Mot, A. An overview of methods used for quantification of heavy metal contents in vegetal samples. Romanian J. Ecol. Environ. Chem. 2021, 3, 7–15. [Google Scholar] [CrossRef]
  24. Saini, N.K.; Mukherjee, P.K.; Rathi, M.S.; Khanna, P.P.; Purohit, K.K. Trace Element Estimation in Soils: An Appraisal of Ed-Xrf Technique Using Group Analysis Scheme. J. Trace Microprobe Tech. 2002, 20, 539–551. [Google Scholar] [CrossRef]
  25. Oreščanin, V.; Mikelić, I.L.; Mikelić, L.; Lulić, S. Applicability of MiniPal 4 compact EDXRF spectrometer for soil and sediment analysis. X-ray Spectrom. 2008, 37, 508–511. [Google Scholar] [CrossRef]
  26. Arado, O.D.; Rizo, O.D.; López-Pino, N.; D’Alessandro, K.; Olivares, S.; Gelen, A.; Casanova, O.A.; Padilla, F.; Corrales, Y.; Maidana, N.L. Evaluation of the InSTEC’s EDXRF assembly for Marine Sediment Pollution Studies. AIP Conf. Proc. 2009, 1139, 158–159. [Google Scholar] [CrossRef]
  27. Rodríguez-Barroso, M.; García-Morales, J.L.; Coello, M.D.; Quiroga, J. An assessment of heavy metal contamination in surface sediment using statistical analysis. Environ. Monit. Assess. 2009, 163, 489–501. [Google Scholar] [CrossRef]
  28. Ardila, P.A.R.; Alonso, R.Á.; Valsero, J.J.D.; García, R.M.; Cabrera, F.Á.; Cosío, E.L.; Laforet, S.D. Assessment of heavy metal pollution in marine sediments from southwest of Mallorca island, Spain. Environ. Sci. Pollut. Res. 2023, 30, 16852–16866. [Google Scholar] [CrossRef] [PubMed]
  29. Briffa, J.; Blundell, R.; Sinagra, E.; Grech, J. Validation of X-ray Fluorescence Spectrometer Technique to Determine Heavy Metal Concentrations in Soil Samples. Glob. J. Sci. Front. Res. 2022, 22, 43–48. [Google Scholar] [CrossRef]
  30. da Silva, P.R.B.; Makara, C.N.; Munaro, A.P.; Schnitzler, D.C.; Wastowski, A.D.; Poleto, C. Comparison of the analytical performance of EDXRF and FAAS techniques in the determination of metal species concentrations using protocol 3050B (USEPA). Int. J. River Basin Manag. 2016, 14, 401–406. [Google Scholar] [CrossRef]
  31. Goldstein, S.J.; Slemmons, A.K.; Canavan, H.E. Energy-Dispersive X-ray Fluorescence Methods for Environmental Characterization of Soils. Environ. Sci. Technol. 1996, 30, 2318–2321. [Google Scholar] [CrossRef]
  32. Enzweiler, J.; Vendemiatto, M.A. Analysis of Sediments and Soils by X-ray Fluorescence Spectrometry Using Matrix Corrections Based on Fundamental Parameters. Geostand. Geoanalytical Res. 2004, 28, 103–112. [Google Scholar] [CrossRef]
  33. Tykot, R.H. A Decade of Portable (Hand-Held) X-ray Fluorescence Spectrometer Analysis of Obsidian in the Mediterranean: Many Advantages and Few Limitations. MRS Adv. 2017, 2, 1769–1784. [Google Scholar] [CrossRef]
  34. Bonizzoni, L.; Kulchytska, O.; Ruschioni, G. XRF Semi-Quantitative Analysis and Multivariate Statistics for the Classification of Obsidian Flows in the Mediterranean Area. Appl. Sci. 2023, 13, 3495. [Google Scholar] [CrossRef]
  35. Xing, Y.; Zhang, H.; Yang, Z.; Song, W.; Long, W.; Zhu, R.; Chang, R.; Zhang, L. Evaluation of 20 Elements in Soils and Sediments by ED-XRF of Monochromatic Excitation. Metals. 2022, 12, 1798. [Google Scholar] [CrossRef]
  36. Olawoyin, R.; Heidrich, B.; Oyewole, S.; Okareh, O.T.; McGlothlin, C.W. Chemometric analysis of ecological toxicants in petrochemical and industrial environments. Chemosphere 2014, 112, 114–119. [Google Scholar] [CrossRef] [PubMed]
  37. Škrbić, B.; Đurišić-Mladenović, N. Chemometric interpretation of heavy metal patterns in soils worldwide. Chemosphere 2010, 80, 1360–1369. [Google Scholar] [CrossRef]
  38. Ismail, A.; Toriman, M.E.; Juahir, H.; Zain, S.M.; Habir, N.L.A.; Retnam, A.; Kamaruddin, M.K.A.; Umar, R.; Azid, A. Spatial assessment and source identification of heavy metals pollution in surface water using several chemometric techniques. Mar. Pollut. Bull. 2016, 106, 292–300. [Google Scholar] [CrossRef]
  39. Tauler, R.; Peré-Trepat, E.; Lacorte, S.; Barceló, D. Chemometrics Modelling of Environmental Data. June 2004. [Google Scholar]
  40. Hanć, A.; Komorowicz, I.; Sek, K.; Baralkiewicz, D. Test of the relationships between the content of heavy metals in sewage sludge and source of their pollution by chemometric methods. J. Environ. Sci. Health Part A 2009, 44, 1441–1448. [Google Scholar] [CrossRef] [PubMed]
  41. Hou, D.; O’Connor, D.; Nathanail, P.; Tian, L.; Ma, Y. Integrated GIS and multivariate statistical analysis for regional scale assessment of heavy metal soil contamination: A critical review. Environ. Pollut. 2017, 231, 1188–1200. [Google Scholar] [CrossRef]
  42. Yalcin, M.G.; Ilhan, S. Multivariate Analyses to Determine the Origin of Potentially Harmful Heavy Metals in Beach and Dune Sediments from Kizkalesi Coast (Mersin). Turkey. Bull. Environ. Contam. Toxicol. 2008, 81, 57–68. [Google Scholar] [CrossRef] [PubMed]
  43. Simeonov, V.; Einax, J.; Tsakovski, S.; Kraft, J. Multivariate statistical assessment of polluted soils. Open Chem. 2005, 3, 1–9. [Google Scholar] [CrossRef]
  44. Qishlaqi, A.; Moore, F. Statistical Analysis of Accumulation and Sources of Heavy Metals Occurrence in Agricultural Soils of Khoshk River Banks, Shiraz, Iran. Am.-Eurasian J. Agric. Environ. Sci. 2007, 2, 565–573. [Google Scholar]
  45. Liu, Z.; Du, Q.; Guan, Q.; Luo, H.; Shan, Y.; Shao, W. A Monte Carlo simulation-based health risk assessment of heavy metals in soils of an oasis agricultural region in northwest China. Sci. Total Environ. 2023, 857 Pt 3, 159543. [Google Scholar] [CrossRef]
  46. Qu, C.; Sun, K.; Wang, S.; Huang, L.; Bi, J. Monte Carlo Simulation-Based Health Risk Assessment of Heavy Metal Soil Pollution —A Case Study in the Qixia Mining Area, China. Hum. Ecol. Risk Assess. Int. J. 2012, 18, 733–750. [Google Scholar] [CrossRef]
  47. Yang, Q.; Zhang, L.; Wang, H.; Martín, J.D. Bioavailability and health risk of toxic heavy metals (As, Hg, Pb and Cd) in urban soils: A Monte Carlo simulation approach. Environ. Res. 2022, 214 Pt 1, 113772. [Google Scholar] [CrossRef] [PubMed]
  48. Liu, Q.; Yang, P.; Hu, Z.; Shu, Q.; Chen, Y. Identification of the sources and influencing factors of the spatial variation of heavy metals in surface sediments along the northern Jiangsu coast. Ecol. Indic. 2022, 137, 108716. [Google Scholar] [CrossRef]
  49. Biesiada, M. Simulations in health risk assessment. Int. J. Occup. Med. Environ. Health 2001, 14, 397–402. [Google Scholar] [PubMed]
  50. Cova, T.F.; Pereira, J.L.; Pais, A.A. Is standard multivariate analysis sufficient in clinical and epidemiological studies? J. Biomed. Inform. 2013, 46, 75–86. [Google Scholar] [CrossRef]
  51. Zielinski, A.A.F.; Haminiuk, C.W.I.; Nunes, C.A.; Schnitzler, E.; van Ruth, S.M.; Granato, D. Chemical Composition, Sensory Properties, Provenance, and Bioactivity of Fruit Juices as Assessed by Chemometrics: A Critical Review and Guideline. Compr. Rev. Food Sci. Food Saf. 2014, 13, 300–316. [Google Scholar] [CrossRef]
  52. Grootveld, M. Introduction to the Applications of Chemometric Techniques in “Omics” Research: Common Pitfalls, Misconceptions and “Rights and Wrongs”; The Royal Society of Chemistry: London, UK, 2014. [Google Scholar] [CrossRef]
  53. Sde Vallejuelo, F.-O.; Arana, G.; de Diego, A.; Madariaga, J.M. Pattern recognition and classification of sediments according to their metal content using chemometric tools. A case study: The estuary of Nerbioi-Ibaizabal River (Bilbao, Basque Country). Chemosphere 2011, 85, 1347–1352. [Google Scholar] [CrossRef] [PubMed]
  54. Frank, E.; Friedman, J.H. A Statistical View of Some Chemometrics Regression Tools. Technometrics 1993, 35, 109–135. [Google Scholar] [CrossRef]
  55. Szefer, P. Chapter 18 Application of Chemometric Techniques in Analytical Evaluation of Biological and Environmental Samples. 2003. Available online: https://www.semanticscholar.org/paper/CHAPTER-18-APPLICATION-OF-CHEMOMETRIC-TECHNIQUES-IN-Szefer/fc4bb2391b95d30f5f6e66154a9842f9e2909c69 (accessed on 12 November 2024).
  56. Bianco, L. Geochemistry, mineralogy and textural properties of the lower globigerina limestone used in the built heritage. Minerals 2021, 11, 740. [Google Scholar] [CrossRef]
  57. Panchuk, V.; Yaroshenko, I.; Legin, A.; Semenov, V.; Kirsanov, D. Application of chemometric methods to XRF-data—A tutorial review. Anal. Chim. Acta 2018, 1040, 19–32. [Google Scholar] [CrossRef] [PubMed]
  58. Lia, F.; Mangion, M.Z.; Farrugia, C. Application of Fourier Transform Mid-Infra-Red Attenuated Total Reflectance (FT-MIR-ATR) for the authentication of Maltese extra virgin olive oil. Riv. Ital. Delle Sostanze Grasse May 2021, 98, 15–26. [Google Scholar]
  59. Lee, L.C.; Liong, C.-Y.; Jemain, A.A. Partial least squares-discriminant analysis (PLS-DA) for classification of high-dimensional (HD) data: A review of contemporary practice strategies and knowledge gaps. Analyst 2018, 143, 3526–3539. [Google Scholar] [CrossRef]
  60. Gupta, N.G.N. Accuracy, Sensitivity and Specificity Measurement of Various Classification Techniques on Healthcare Data. IOSR J. Comput. Eng. 2013, 11, 70–73. [Google Scholar] [CrossRef]
  61. Singh, P.; Singh, N.; Singh, K.K.; Singh, A. Chapter 5—Diagnosing of disease using machine learning. In Machine Learning and the Internet of Medical Things in Healthcare; Singh, K.K., Elhoseny, M., Singh, A., Elngar, A.A., Eds.; Academic Press: New York, NY, USA, 2021; pp. 89–111. [Google Scholar] [CrossRef]
  62. Fearn, T. Sensitivity and Specificity. NIR News 2009, 20, 16. [Google Scholar] [CrossRef]
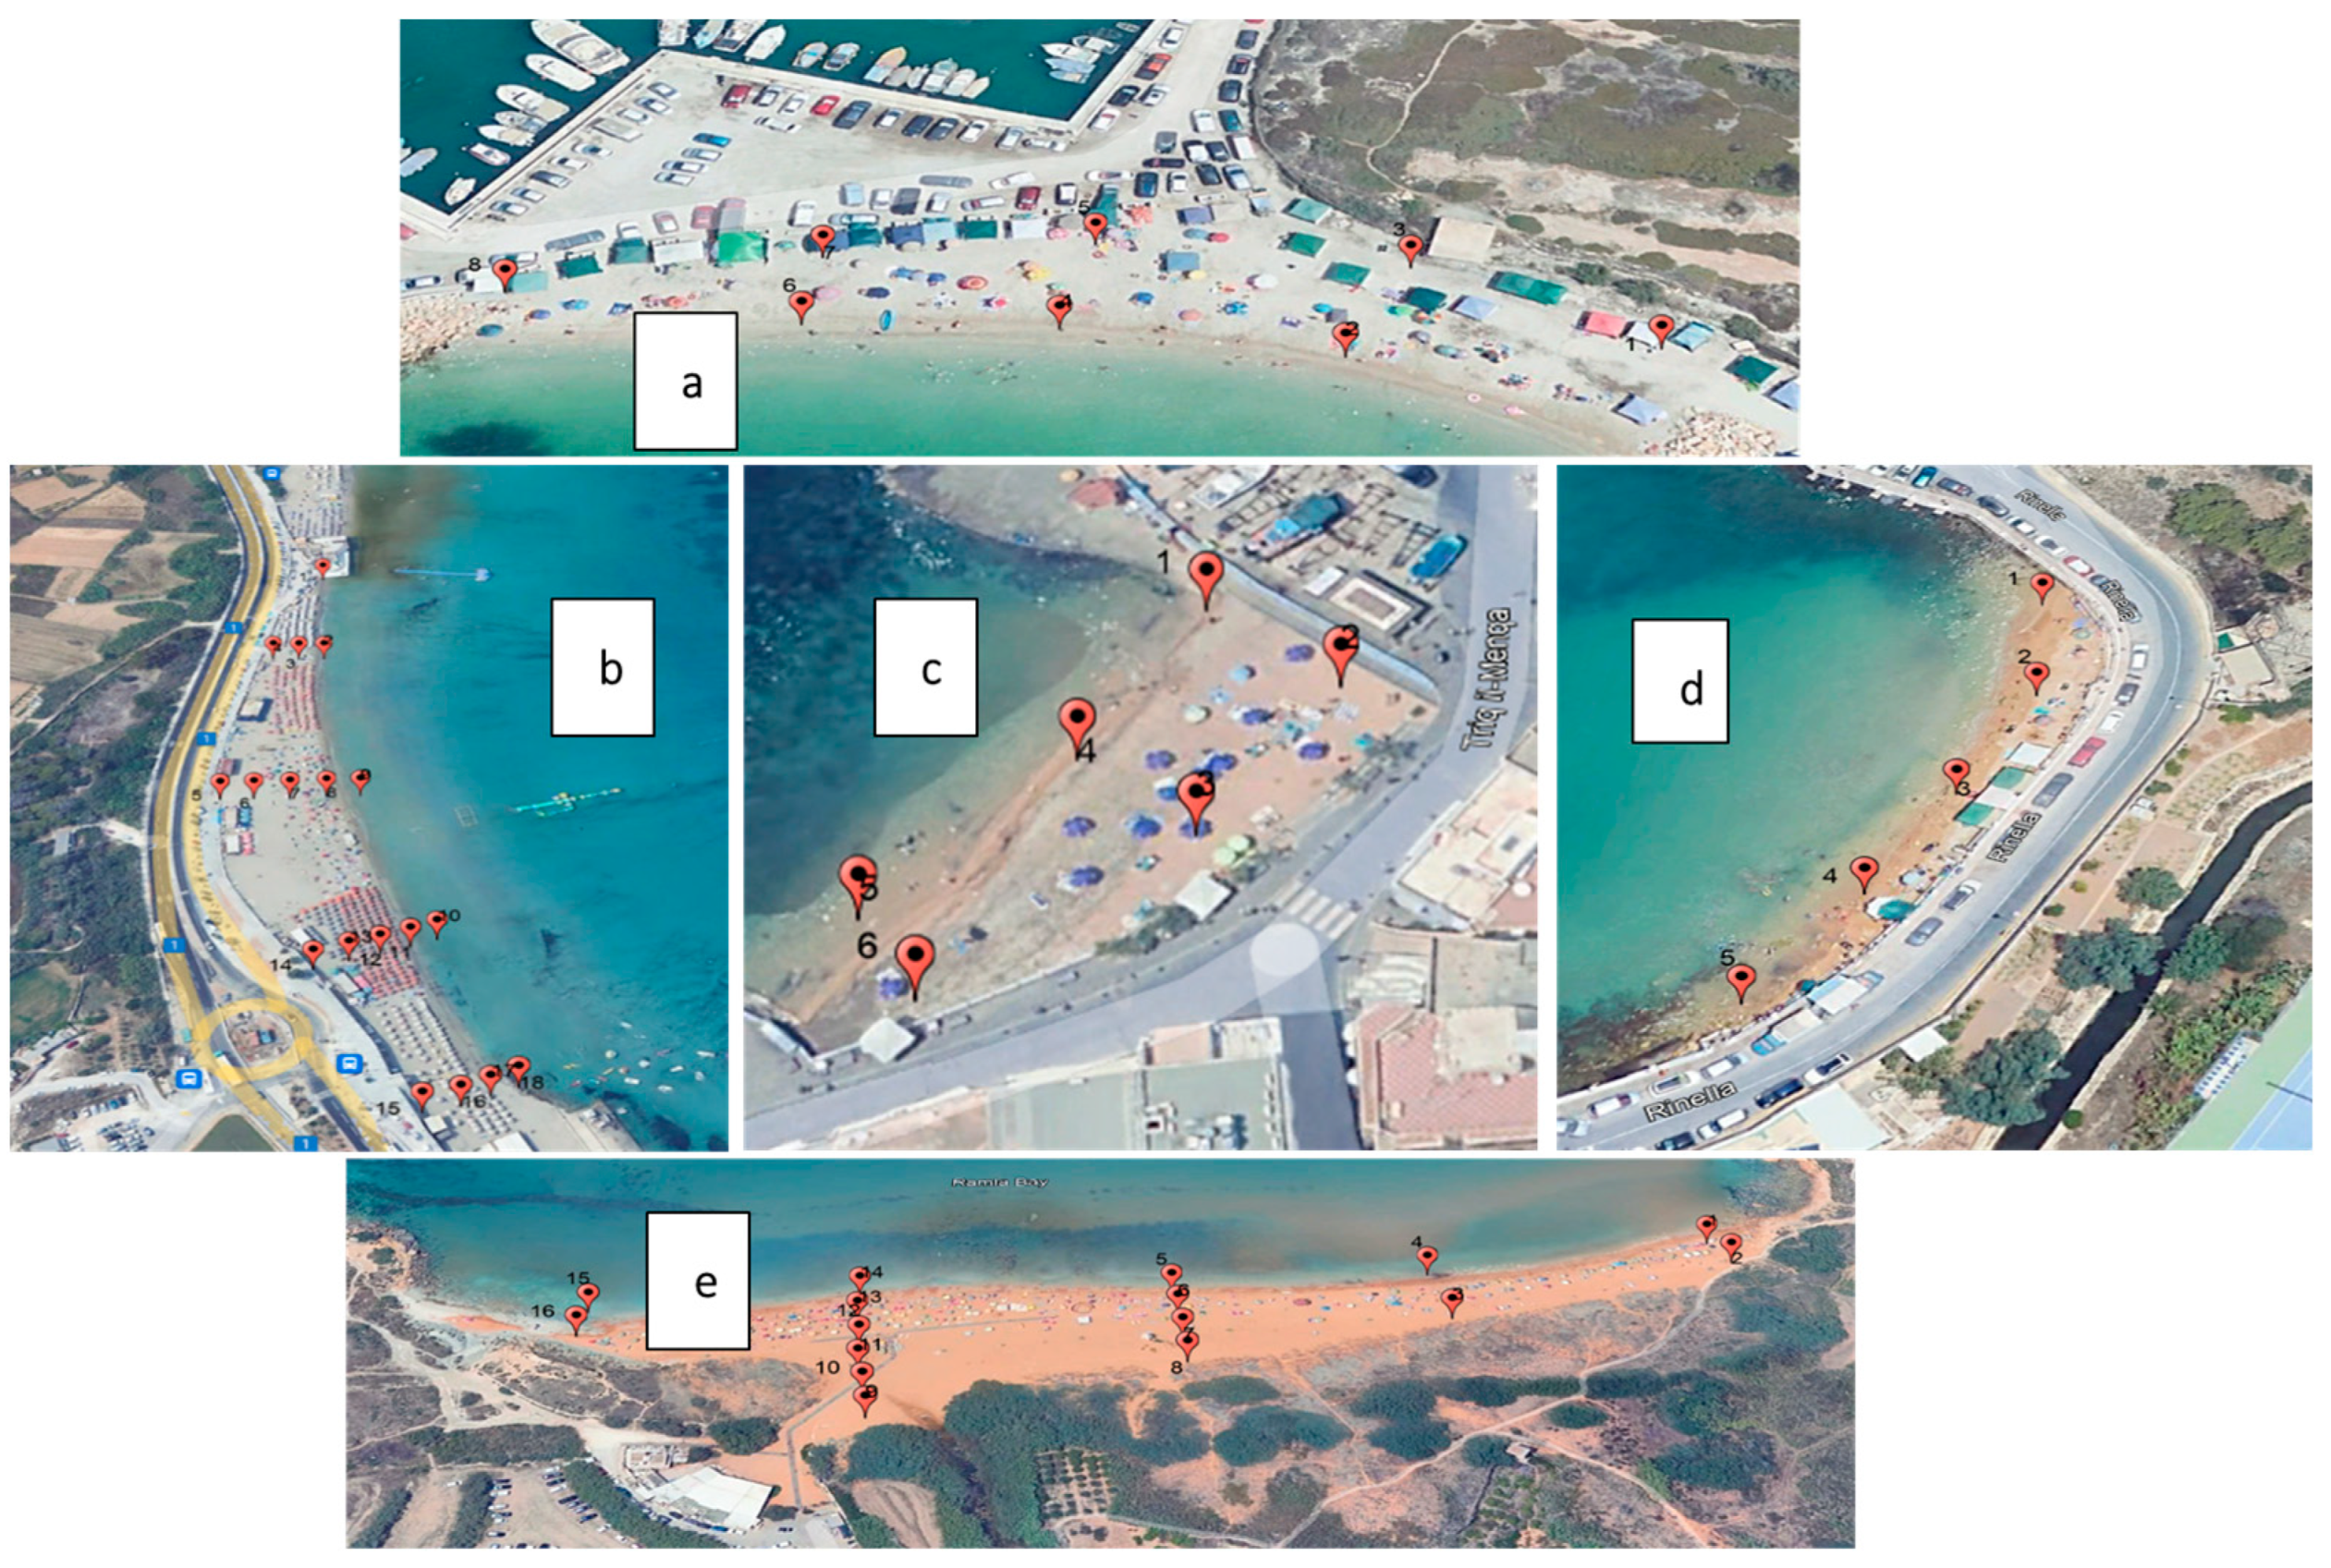
Figure 1. Sampling points for (a) Marsalforn Bay, (b) Għadira Bay, (c) Marsalforn Bay, (d) Rinella Bay, and (e) Ramla Bay.
Environments 11 00299 g001
Figure 2. Colour map on pairwise correlations by location. (a) Għadira Bay, (b) Ballut Reserve Bay, (c) Ramla Bay, (d) Marsalforn Bay, (e) Rinella Bay.
Environments 11 00299 g002
Figure 3. Three-dimensional scatterplot for Principal Components Analysis on Correlations.
Environments 11 00299 g003
Figure 4. Summary plots showing eigenvalues for Component 1 and Component 2 and loading plot for PCA.
Environments 11 00299 g004
Figure 5. Canonical plots for all sampling seasons for each bay studied, where (a) Għadira Bay, (b) Ballut Reserve Bay, (c) Ramla Bay, (d) Marsalforn Bay, (e) Rinella Bay.
Environments 11 00299 g005
Figure 6. (a) Selected variables including scoring coefficients for SLC-DA for the group ‘By Location’; (b) 3D canonical plots for SLC-DA for the group ‘By Location’.
Environments 11 00299 g006
Figure 7. Variable Importance Plots for elemental distributions for location, (a) entire dataset using PLS_DA with LOOCV, (b) cross-validation dataset using VIPs of original PLS-DA with LOOCV (red dashed line signifies the VIP threshold of 0.8).
Environments 11 00299 g007
Table 1. Percentage water content and pH readings.
Bay % Water ContentpH
Għadira BayAverage17.8048.013
Standard Deviation8.6620.350
Ballut Reserve BayAverage16.5067.495
Standard Deviation2.9520.280
Marsalforn BayAverage7.8666.885
Standard Deviation3.9960.255
Ramla BayAverage11.1527.604
Standard Deviation6.0820.556
Rinella BayAverage15.8777.344
Standard Deviation8.2550.208
Table 2. Heavy metal percentage concentrations obtained from ED-XRF analysis.
ElementGhadira BayBallut Reserve BayRamla BayMarsalforn BayRinella Bay
% Conc.Std. Error% Conc.Std. Error% Conc.Std. Error% Conc.Std. Error% Conc.Std. Error
Al2O30.183440.020810.160220.028320.161090.021610.384610.059020.149270.02758
As2O30.000290.000030.000230.000070.005550.000060.001800.000080.000990.00005
Bi2O30.002330.000040.002520.000070.002000.000040.001780.000080.002360.00008
CdO0.001260.000030.001320.000080.001220.000030.001250.000070.001240.00005
CeO20.000020.000020.000360.000180.000040.000040.000080.000080.000000.00000
CoO0.001740.000040.002230.000080.009760.000220.012590.000800.007370.00051
Cr2O30.000400.000100.002110.000370.001520.000230.002120.000500.001940.00047
Cs2O0.000030.000030.000400.000290.000080.000060.000410.000300.000010.00001
CuO0.002660.000040.004230.000310.002640.000350.002990.000190.004580.00021
Fe2O30.282170.004250.294540.007832.141770.044143.142410.212971.852770.12152
Ga2O30.001330.000020.001530.000050.001170.000020.001210.000060.001320.00006
GeO20.000130.000020.000290.000060.000500.000030.000470.000050.000270.00005
La2O30.000300.000300.006630.003040.000460.000460.005050.002450.000000.00000
MgO0.643040.068870.437480.092220.528850.072130.618540.146030.725770.13309
MnO0.007900.000200.007380.000360.018530.000310.016970.000920.013580.00097
MoO30.000020.000000.000030.000010.000040.000010.000110.000030.000040.00001
Nb2O50.000280.000020.000190.000020.000260.000010.000300.000040.000230.00002
Nd2O30.000050.000050.002180.000730.000820.000300.003120.000950.000230.00016
NiO0.000110.000060.001100.000250.000320.000090.000810.000260.000280.00006
P2O50.262290.004610.491110.015650.374490.008131.207010.039050.286450.00531
PbO0.002450.000040.003740.000140.002470.000050.003130.000170.009530.00014
Pr6O110.000000.000000.000130.000130.000150.000110.000270.000270.000000.00000
Rb2O0.001090.000020.001260.000030.001130.000020.001440.000060.001120.00004
Sb2O30.002490.000110.002900.000260.002670.000140.002670.000300.002170.00025
SeO20.001310.000020.001440.000050.001020.000020.001000.000050.001240.00004
SnO20.015820.000040.015500.000100.016480.000060.016620.000090.017020.00018
SrO0.087310.000600.150000.001310.047530.000640.056710.001240.160480.00192
TeO20.002000.000090.002440.000220.002350.000090.002720.000190.002130.00011
TiO20.007200.000840.007310.001600.012740.000870.024790.003070.016800.00279
V2O50.000000.000000.000620.000310.000060.000040.000680.000350.000000.00000
WO30.002330.000040.002560.000080.002060.000050.001960.000100.002430.00013
Y2O30.001720.000020.001930.000060.001810.000030.002180.000090.001410.00004
ZnO0.002270.000060.003720.000070.002600.000050.004520.000740.008890.00022
ZrO20.001390.000180.002170.000390.001180.000120.002950.000710.001310.00016
Table 3. Kruskall–Wallis tests results for hypotheses tested, where: H1: Same across locations for summer and winter; H2: Elemental distribution is the same at all depths for Location 1 (Għadira Bay) for all seasons; H3: Elemental distribution is the same at all depths for Location 2 (Ballut Reserve Bay) for all seasons; H4: Elemental distribution is the same at all depths for Location 3 (Ramla Bay) for all seasons; H5: Elemental distribution is the same at all depths for Location 4 (Marsalforn Bay) for all seasons; H6: Elemental distribution is the same at all depths for Location 5 (Rinella Bay) for all seasons; H7: Elemental distribution is the same across all categories of depth for all locations for all seasons; H8: Elemental distribution is the same across category of location for the samples collected from Depth 0 (Top surface layer) for all seasons; H9: Elemental distribution is the same across category of location for the samples collected from Depth 1 (layer 10 cm below the surface) for all seasons; H10: Elemental distribution is the same across category of location for the samples collected from Depth 2 (layer 20 cm below the surface) for all seasons; H11: Elemental distribution is the same across categories of distance from the shoreline for all seasons; H12: Elemental distribution is the same across L = 0 m for all seasons; H13: Elemental distribution is the same across L < 10 m for all seasons; H14: Elemental distribution is the same across 10 m < L < 20 m for all seasons; H15: Elemental distribution is the same across 20 m < L < 30 m for all seasons; H16: Elemental distribution is the same across 30 m < L < 40 m for all seasons; H17: Elemental distribution is the same across 40 m < L < 50 m for all seasons.
ElementH1H2H3H4H5H6H7H8H9H10H11H12H13H14H15H16H17
Al2O3 Not computed
As2O3
BaO
Bi2O3
Br
CaCO3
CdO
CeO2
Cl
CoO
Cr2O3
Cs2O3
CuO
Fe2O3
Ga2O3
GeO2
I
K2O
La2O3
MgO
MnO
MoO3
Na2O
Nb2O5
Nd2O3
NiO
P2O5
PbO
Pr6O11
Rb2O
Sb2O3
SeO2
SiO2
SnO2
SO3
SrO
TeO2
TiO2
V2O5
WO3
Y2O3
ZnO
ZrO2
Environments 11 00299 i001 Retained Environments 11 00299 i002 Rejected.
Table 4. Eigenvalues, canonical correlations, Wilks’ Lambda, and F-values for SLC-DA computed.
GroupEigenvaluesPercentageCanonical CorrelationWilks’ LambdaApprox. F
SEASON 0.7685.068
CANONICAL 10.18966.9670.399
CANONICAL 20.06723.7060.251
CANONICAL 30.0269.3270.160
LOCATION 0.0000586230.269
CANONICAL 137.45359.1290.987
CANONICAL 217.71227.9630.973
CANONICAL 35.5698.7920.921
CANONICAL 42.6074.1160.850
DEPTH 0.9704.653
CANONICAL 10.03097.2060.170
CANONICAL 20.0012.7940.029
DISTANCE FROM SHORELINE 0.6145.639
CANONICAL 10.25848.6140.453
CANONICAL 20.17232.3620.383
CANONICAL 30.06311.8260.243
CANONICAL 40.0234.3460.150
CANONICAL 50.0152.8510.122
Table 5. (a) PLS-DA analysis using LOOCV on the training dataset modelled with VIP scores > 0.8; (b) PLS-DA analysis cross-validation results on the corresponding testing dataset.
a
GroupsSeasonLocationDepthDistance from Shoreline
Factors314112
VIP > 0.818151716
% Cumulative X55.61996.77332.46592.012
% Cumulative Y9.24586.4871.54411.204
PRESS*0.391**
T2*1.428**
p > T2*0.870**
% Accuracy (R2)*86.067%**
No. of Included Misclassified Observations.18313333425
b
No. of Excluded. Misclassified Observations46783107
% Included Misclassified Observations36.895%2.621%67.137%85.685%
% Excluded Misclassified Observations37.398%5.691%67.480%86.992%
% Misclassified Accuracy36.995%3.231%67.205%85.945%
% Sensitivity60.968%99.739%99.390%97.507%
% Specificity61.564%98.208%1.675%22.848%
% Prediction61.564%99.479%66.476%83.881%
* No value obtained for these tests.
Disclaimer/Publisher’s Note: The statements, opinions and data contained in all publications are solely those of the individual author(s) and contributor(s) and not of MDPI and/or the editor(s). MDPI and/or the editor(s) disclaim responsibility for any injury to people or property resulting from any ideas, methods, instructions or products referred to in the content.