
Using Species Distribution Models to Assess the Status of the Declining Western Bumble Bee (Hymenoptera: Apidae: Bombus occidentalis) in Wyoming, USA


Abstract
1. Introduction
2. Materials and Methods
2.1. Study Area
2.2. Species Distribution Models
2.3. Field Sampling
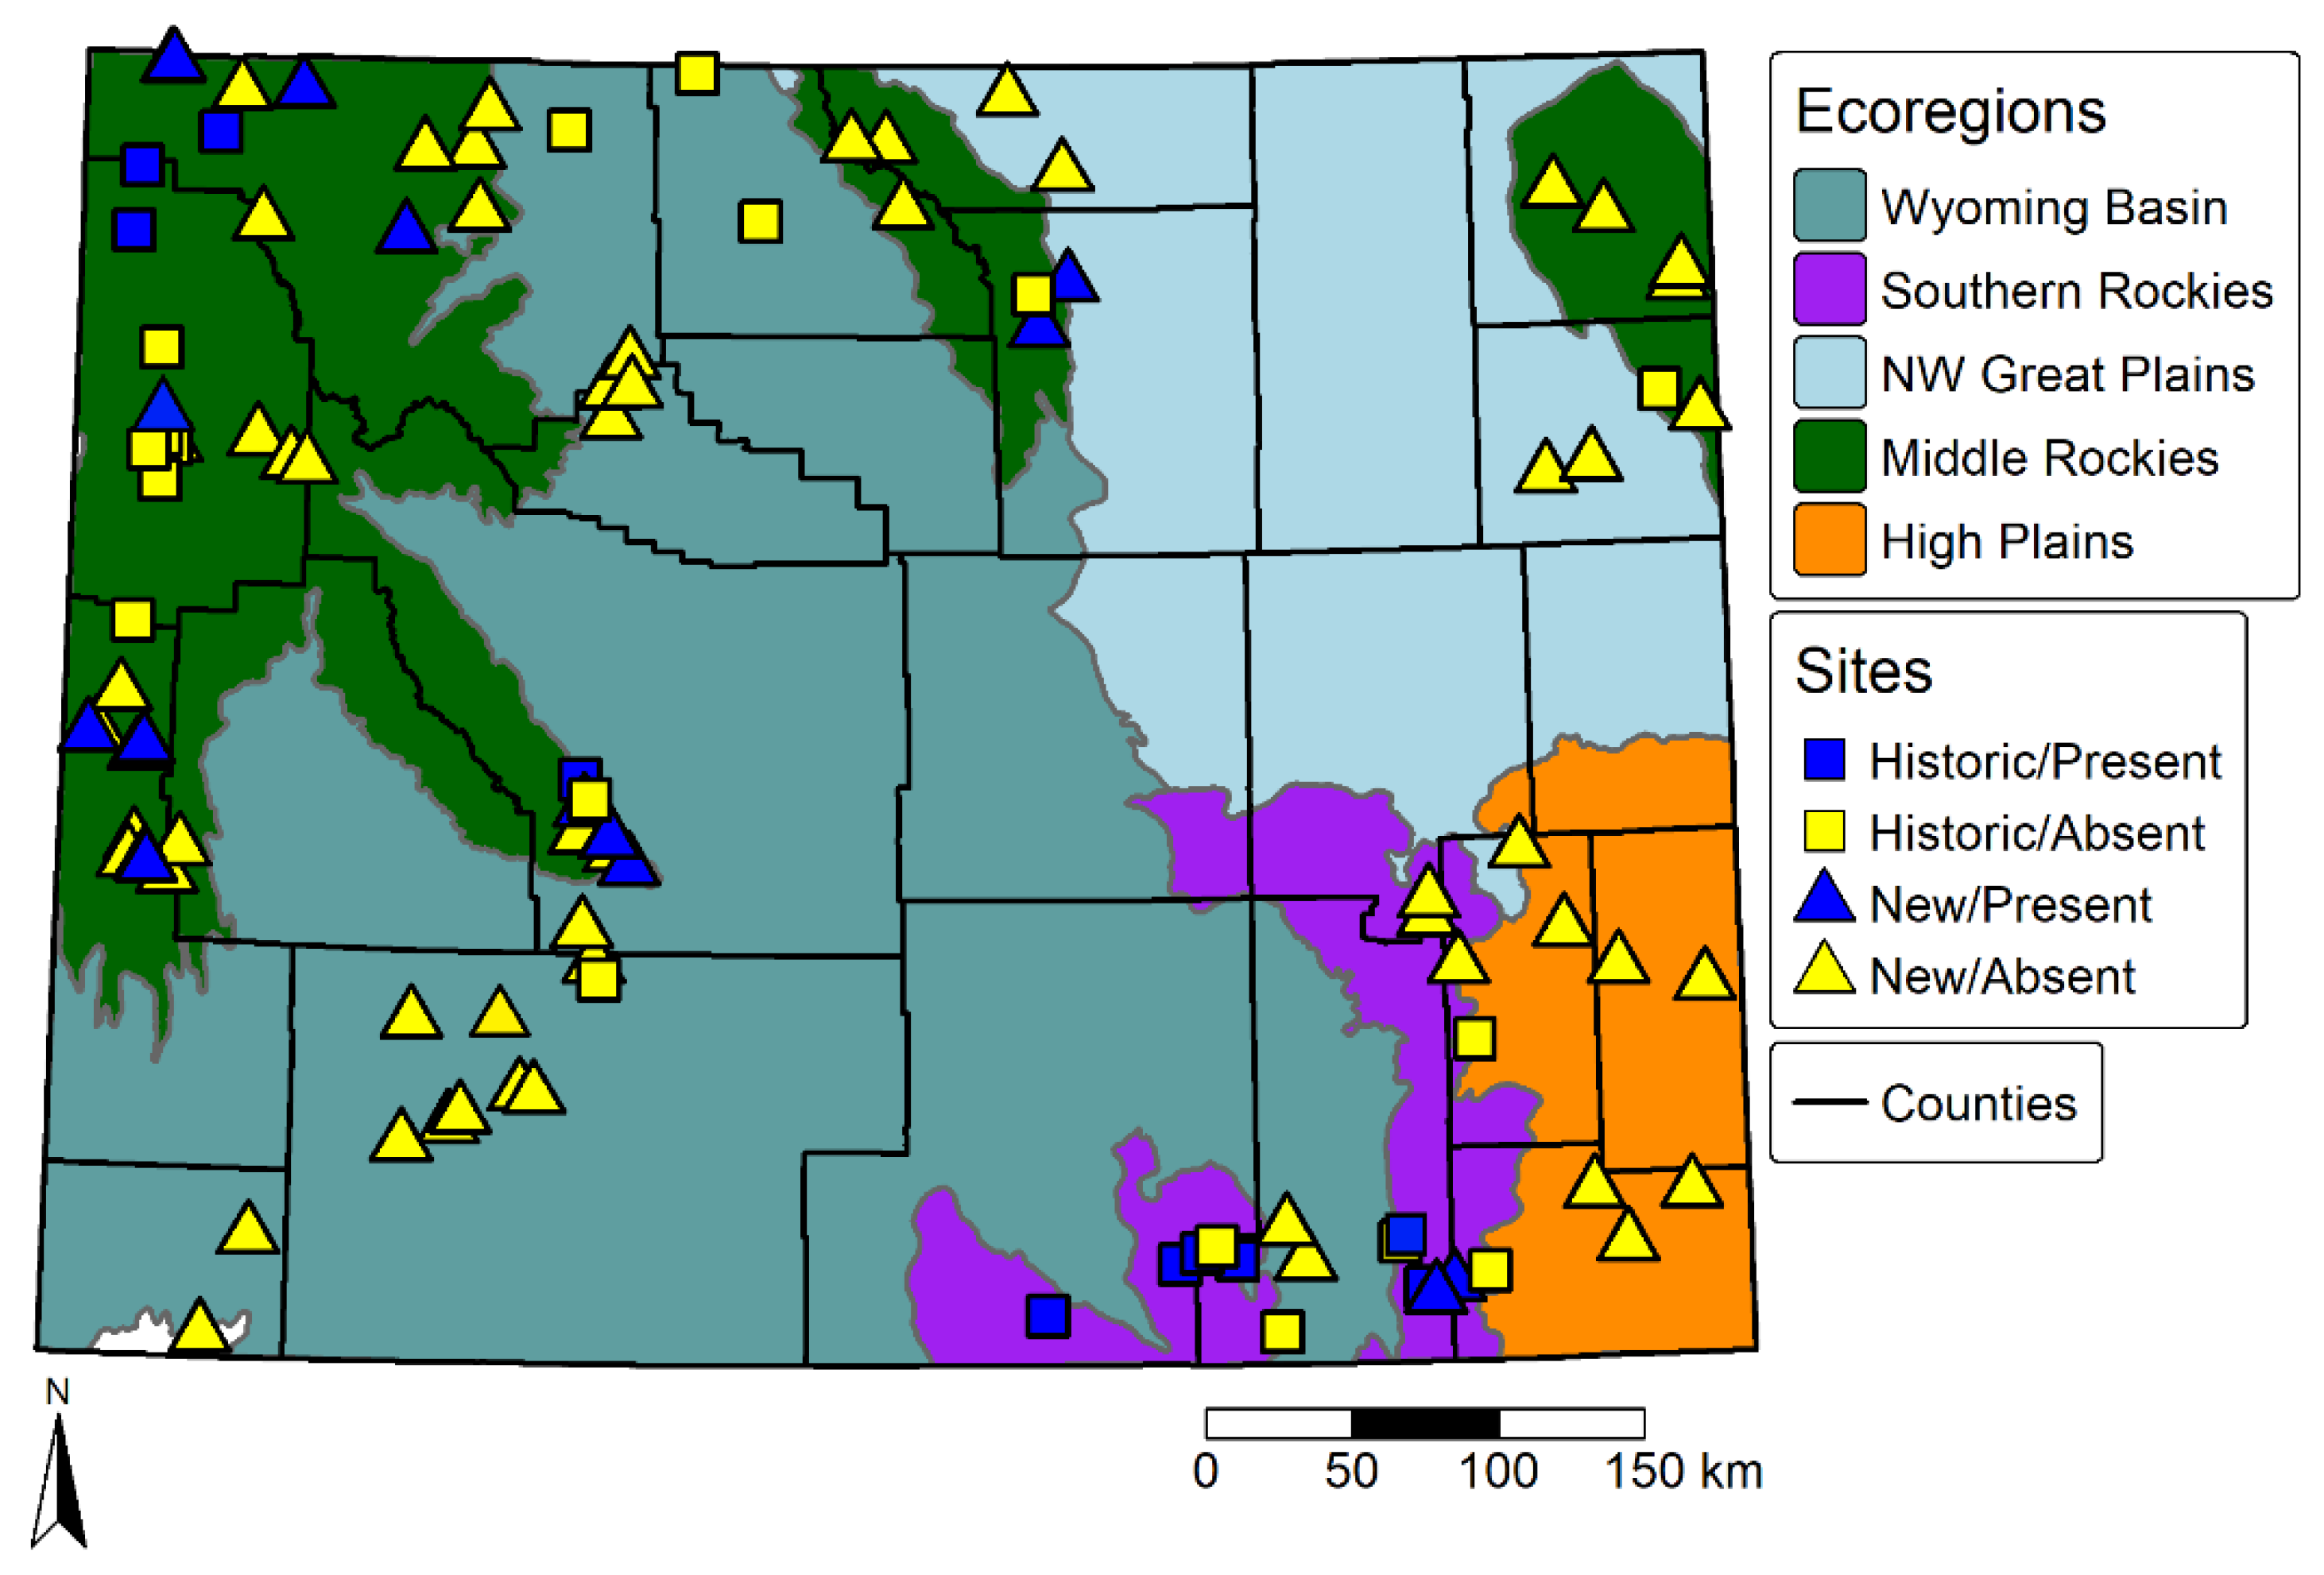
3. Results
3.1. Sampling SDM
3.2. Current Results for Bombus Occidentalis Sampling
3.3. Historical and Current SDM
3.4. Changes in Predicted Suitable Habitat
4. Discussion
5. Conclusions
Author Contributions
Funding
Data Availability Statement
Acknowledgments
Conflicts of Interest
References
- Dunn, R. Modern insect extinctions, the neglected majority. Conserv. Biol. 2005, 19, 1030–1036. [Google Scholar] [CrossRef]
- Thompson, W. Sampling Rare or Elusive Species: Concepts, Designs, and Techniques for Estimating Population Parameters; Island Press: Washington, DC, USA, 2013. [Google Scholar]
- Koch, J.B.; Strange, J.P. Constructing a species database and historic range maps for North American Bumblebees (Bombus sensu stricto Latreille) to inform conservation decisions. Uludağ Arıcılık Derg. 2009, 9, 97–108. [Google Scholar]
- Newbold, T. Applications and limitations of museum data for conservation and ecology, with particular attention to species distribution models. Prog. Phys. Geogr. 2010, 34, 3–22. [Google Scholar] [CrossRef]
- Rhoades, P.R.; Koch, J.B.; Waits, L.P.; Strange, J.P.; Eigenbrode, S.D. Evidence for Bombus occidentalis (Hymenoptera: Apidae) populations in the Olympic Peninsula, the Palouse Prairie, and forests of northern Idaho. J. Insect Sci. 2016, 16, 20. [Google Scholar] [CrossRef] [PubMed]
- Burkle, L.A.; Marlin, J.C.; Knight, T.M. Plant-Pollinator Interactions over 120 Years: Loss of Species, Co-Occurrence, and Function. Science 2013, 339, 1611–1615. [Google Scholar] [CrossRef]
- Conrad, K.F.; Warren, M.S.; Fox, R.; Parsons, M.S.; Woiwod, I.P. Rapid declines of common, widespread British moths provide evidence of an insect biodiversity crisis. Biol. Conserv. 2006, 132, 279–291. [Google Scholar] [CrossRef]
- Hallmann, C.A.; Sorg, M.; Jongejans, E.; Siepel, H.; Hofland, N.; Schwan, H.; Stenmans, W.; Muller, A.; Sumser, H.; Horren, T.; et al. More than 75 percent decline over 27 years in total flying insect biomass in protected areas. PLoS ONE 2017, 12, e0185809. [Google Scholar] [CrossRef]
- Michener, C.D. The Bees of the World, 2nd ed.; JHU Press: Baltimore, MA, USA, 2007; Volume 1. [Google Scholar]
- Ollerton, J. Pollinators and Pollination: Nature and Society; Pelagic Publishing Ltd.: London, UK, 2021. [Google Scholar]
- Losey, J.E.; Vaughan, M. The economic value of ecological services provided by insects. Bioscience 2006, 56, 311–323. [Google Scholar] [CrossRef]
- Williams, P.H.; Thorp, R.W.; Richardson, L.L.; Colla, S.R. Bumble Bees of North America; Princeton University Press: Princeton, NJ, USA, 2014; p. 208. [Google Scholar]
- Graves, T.A.; Janousek, W.M.; Gaulke, S.M.; Nicholas, A.C.; Keinath, D.A.; Bell, C.M.; Cannings, S.; Hatfield, R.G.; Heron, J.M.; Koch, J.B.; et al. Western bumble bee: Declines in the continental United States and range-wide information gaps. Ecosphere 2020, 11, e03141. [Google Scholar] [CrossRef]
- Goulson, D.; Nicholls, E.; Botias, C.; Rotheray, E.L. Bee declines driven by combined stress from parasites, pesticides, and lack of flowers. Science 2015, 347, 1255957. [Google Scholar] [CrossRef]
- Thorp, R.; Jepsen, S.; Black, S.H. Status Review of Three Formerly Common Species of Bumble Bee in the Subgenus Bombus. Prep. Xerces Soc. Invertebr. Conservation. 2008. Available online: https://xerces.org/sites/default/files/2019-10/xerces_2008_bombus_status_review_0.pdf (accessed on 1 November 2024).
- Cameron, S.A.; Lozier, J.D.; Strange, J.P.; Koch, J.B.; Cordes, N.; Solter, L.F.; Griswold, T.L. Patterns of widespread decline in North American bumble bees. Proc. Natl. Acad. Sci. USA 2011, 108, 662–667. [Google Scholar] [CrossRef] [PubMed]
- Suzuki-Ohno, Y.; Ishihama, F.; Yokoyama, J.; Inoue, M.N.; Nakashizuka, T.; Kawata, M. Estimating bee distributions and their functional range to map important areas for protecting bee species and their functions. Sci. Rep. 2024, 14, 12842. [Google Scholar] [CrossRef] [PubMed]
- Rodríguez, J.P.; Brotons, L.; Bustamante, J.; Seoane, J. The application of predictive modelling of species distribution to biodiversity conservation. Divers. Distrib. 2007, 13, 243–251. [Google Scholar] [CrossRef]
- Yost, A.C.; Petersen, S.L.; Gregg, M.; Miller, R. Predictive modeling and mapping sage grouse (Centrocercus urophasianus) nesting habitat using Maximum Entropy and a long-term dataset from Southern Oregon. Ecol. Inform. 2008, 3, 375–386. [Google Scholar] [CrossRef]
- Crawford, P.H.; Hoagland, B.W. Using species distribution models to guide conservation at the state level: The endangered American burying beetle (Nicrophorus americanus) in Oklahoma. J. Insect Conserv. 2010, 14, 511–521. [Google Scholar] [CrossRef]
- Davis, S.L.; Cipollini, D. Range, genetic diversity and future of the threatened butterfly, Pieris virginiensis. Insect Conserv. Divers. 2016, 9, 506–516. [Google Scholar] [CrossRef]
- Pogue, C.D.; Monfils, M.J.; Cuthrell, D.L.; Heumann, B.W.; Monfils, A.K. Habitat suitability modeling of the federally endangered Poweshiek skipperling in Michigan. J. Fish Wildl. Manag. 2016, 7, 359–368. [Google Scholar] [CrossRef]
- Silva, D.P.; Spigoloni, Z.A.; Camargos, L.M.; de Andrade, A.F.A.; De Marco, P.; Engel, M.S. Distributional modeling of Mantophasmatodea (Insecta: Notoptera): A preliminary application and the need for future sampling. Org. Divers. Evol. 2016, 16, 259–268. [Google Scholar] [CrossRef]
- Pelletier, T.A.; Crisafulli, C.; Wagner, S.; Zellmer, A.J.; Carstens, B.C. Historical species distribution models predict species limits in western Plethodon salamanders. Syst. Biol. 2015, 64, 909–925. [Google Scholar] [CrossRef] [PubMed]
- Rojas-Arias, L.; Gómez-Morales, D.; Stiegel, S.; Ospina-Torres, R. Niche modeling of bumble bee species (Hymenoptera, Apidae, Bombus) in Colombia reveals highly fragmented potential distribution for some species. J. Hymenopt. Res. 2023, 95, 231–244. [Google Scholar] [CrossRef]
- Elith, J.; Phillips, S.J.; Hastie, R.; Dudik, M.; Chee, Y.E.; Yates, C.J. A statistical explanation of MaxEnt for ecologists. Divers. Distrib. 2011, 17, 43–57. [Google Scholar] [CrossRef]
- Sheffield, C.S.; Richardson, L.; Cannings, S.; Ngo, H.; Heron, J.; Williams, P.H. Biogeography and designatable units of Bombus occidentalis Greene and B. terricola Kirby (Hymenoptera: Apidae) with implications for conservation status assessments. J. Insect Conserv. 2016, 20, 189–199. [Google Scholar] [CrossRef]
- Christman, M.E.; Spears, L.R.; Strange, J.P.; Pearse, W.D.; Burchfield, E.K.; Ramirez, R.A. Land cover and climate drive shifts in Bombus assemblage composition. Agric. Ecosyst. Environ. 2022, 339, 108113. [Google Scholar] [CrossRef]
- Colla, S.R.; Packer, L. Evidence for decline in eastern North American bumblebees (Hymenoptera: Apidae), with special focus on Bombus affinis Cresson. Biodivers. Conserv. 2008, 17, 1379–1391. [Google Scholar] [CrossRef]
- Tripodi, A.D.; Szalanski, A.L. The bumble bees (Hymenoptera: Apidae: Bombus) of Arkansas, fifty years later. J. Melittology 2015, 50, 1–17. [Google Scholar] [CrossRef]
- Arguez, A.; Durre, I.; Applequist, S.; Squires, M.; Vose, R.; Yin, X.; Bilotta, R.; NOAA′s U.S. Climate Normals (1981–2010). 2010. Available online: https://www.ncei.noaa.gov/metadata/geoportal/rest/metadata/item/gov.noaa.ncdc:C00820/html (accessed on 1 March 2024).
- Yackulic, C.B.; Chandler, R.; Zipkin, E.F.; Royle, J.A.; Nichols, J.D.; Campbell Grant, E.H.; Veran, S. Presence-only modelling using MAXENT: When can we trust the inferences? Methods Ecol. Evol. 2013, 4, 236–243. [Google Scholar] [CrossRef]
- Hijmans, R.; Cameron, S.; Parra, J.; Jones, P.; Jarvis, A. Very high resolution interpolated climate surfaces of global land areas. Int. J. Climatol. 2005, 25, 1965–1978. [Google Scholar] [CrossRef]
- Comer, P. Ecological Systems of the United States: A Working Classification of U.S. Terrestrial Systems; NatureServe: Arlington, VI, USA, 2003. [Google Scholar]
- Davidson, A.; Aycrigg, J.; Grossmann, E.; Kagan, J.; Lennartz, S.; McDonough, S.; Miewald, T. Digital Land Cover Map for the Northwestern United States; Northwest Gap Analysis Project, USGS GAP Analysis Program; Geological Survey: Moscow, ID, USA, 2009. [Google Scholar]
- Simley, J.D.; Carswell, W.J., Jr. The National Map-Hydrography; 2327-6932; US Geological Survey: Reston, VA, USA, 2009. [Google Scholar]
- Chapman, S.S.; Bryce, S.A.; Omernik, J.M.; Despain, D.G.; ZumBerge, J.; Conrad, M. Ecoregions of Wyoming. Trans. Wis. Acad. Sci. Arts Lett. 2004, 88, 77–103. [Google Scholar]
- Bell, C.; Tronstad, L.; Hotaling, S. Tailoring your bee sampling protocol: Comparing three methods reveals the best approaches to capturing bees. Agric. For. Entomol. 2023, 25, 477–488. [Google Scholar] [CrossRef]
- Droege, S.; Tepedino, V.J.; Lebuhn, G.; Link, W.; Minckley, R.L.; Chen, Q.; Conrad, C. Spatial patterns of bee captures in North American bowl trapping surveys. Insect Conserv. Divers. 2010, 3, 15–23. [Google Scholar] [CrossRef]
- Fourcade, Y.; Åström, S.; Öckinger, E. Climate and land-cover change alter bumblebee species richness and community composition in subalpine areas. Biodivers. Conserv. 2019, 28, 639–653. [Google Scholar] [CrossRef]
- Bucklin, D.N.; Basille, M.; Benscoter, A.M.; Brandt, L.A.; Mazzotti, F.J.; Romañach, S.S.; Speroterra, C.; Watling, J.I. Comparing species distribution models constructed with different subsets of environmental predictors. Divers. Distrib. 2015, 21, 23–35. [Google Scholar] [CrossRef]
- Nascimento, A.C.; Montalva, J.; Ascher, J.S.; Engel, M.S.; Silva, D.P. Current and future distributions of a native Andean bumble bee. J. Insect Conserv. 2022, 26, 559–569. [Google Scholar] [CrossRef]
- Janousek, W.; Douglas, M.; Cannings, S.; Clement, M.; Dephia, C.; Everett, J.; Hatfield, R.; Keinath, D.; Koch, J.; McCabe, L.; et al. Recent and future declines of a historically widespread pollinator linked to climate, land cover and pesticides. Proc. Acad. Nat. Sci. USA 2023, 120, e2211223120. [Google Scholar] [CrossRef] [PubMed]
- Kingsolver, J.G.; Arthur Woods, H.; Buckley, L.B.; Potter, K.A.; MacLean, H.J.; Higgins, J.K. Complex life cycles and the responses of insects to climate change. Integr. Comp. Biol. 2011, 51, 719–732. [Google Scholar] [CrossRef] [PubMed]
- Kerr, J.T.; Pindar, A.; Galpern, P.; Packer, L.; Potts, S.G.; Roberts, S.M.; Rasmont, P.; Schweiger, O.; Colla, S.R.; Richardson, L.L. Climate change impacts on bumblebees converge across continents. Science 2015, 349, 177–180. [Google Scholar] [CrossRef] [PubMed]
- Marcer, A.; Sáez, L.; Molowny-Horas, R.; Pons, X.; Pino, J. Using species distribution modelling to disentangle realised versus potential distributions for rare species conservation. Biol. Conserv. 2013, 166, 221–230. [Google Scholar] [CrossRef]
- Amirkhiz, R.G.; Frey, J.K.; Cain, J.W., III; Breck, S.W.; Bergman, D.L. Predicting spatial factors associated with cattle depredations by the Mexican wolf (Canis lupus baileyi) with recommendations for depredation risk modeling. Biol. Conserv. 2018, 224, 327–335. [Google Scholar] [CrossRef]
- Morales, C.L.; Montalva, J.; Arbetman, M.P.; Aizen, M.A.; Martins, A.C.; Silva, D.P. Does climate change influence the current and future projected distribution of an endangered species? The case of the southernmost bumblebee in the world. J. Insect Conserv. 2022, 26, 257–269. [Google Scholar] [CrossRef]


| Variable | Variable Description | % Contribution | ||
|---|---|---|---|---|
| Sampling | Historical | Current | ||
| shrub | Shrub index | 15.4 | 2.7 | |
| conifer | Conifer index | 13.7 | 15.7 | |
| decid | Mean deciduous tree cover | 12 | 36.8 | |
| herb | Mean herbaceous cover | 8.8 | 11.5 | 2 |
| bioclim9 | Mean temperature of the driest quarter | 11.5 | 0.4 | |
| bioclim19 | Precipitation of the coldest quarter (snowpack) | 25.7 | 8 | 0.7 |
| bioclim10 | Mean temperature of the warmest quarter | 6.3 | 12.4 | |
| forest cc | Percent forest canopy cover | 26.6 | 5 | 7.6 |
| bioclim1 | Annual mean temperature | 4.9 | 6.8 | |
| bioclim3 | Isothermality (temperature evenness) | 10 | 3.5 | 4.2 |
| bioclim8 | Mean temperature of the wettest quarter | 8.5 | 3.2 | 1 |
| bioclim13 | Precipitation of the wettest month | 5.8 | 2.6 | 6.2 |
| d2w | Distance to water | 2.5 | 3.6 | |
| Bioclim15 | Precipitation seasonality | 5.2 | ||
Disclaimer/Publisher’s Note: The statements, opinions and data contained in all publications are solely those of the individual author(s) and contributor(s) and not of MDPI and/or the editor(s). MDPI and/or the editor(s) disclaim responsibility for any injury to people or property resulting from any ideas, methods, instructions or products referred to in the content. |
© 2024 by the authors. Licensee MDPI, Basel, Switzerland. This article is an open access article distributed under the terms and conditions of the Creative Commons Attribution (CC BY) license (https://creativecommons.org/licenses/by/4.0/).
Share and Cite
Tronstad, L.M.; Bell, C.; Cook, K.; Dillon, M.E. Using Species Distribution Models to Assess the Status of the Declining Western Bumble Bee (Hymenoptera: Apidae: Bombus occidentalis) in Wyoming, USA. Environments 2025, 12, 2. https://doi.org/10.3390/environments12010002
Tronstad LM, Bell C, Cook K, Dillon ME. Using Species Distribution Models to Assess the Status of the Declining Western Bumble Bee (Hymenoptera: Apidae: Bombus occidentalis) in Wyoming, USA. Environments. 2025; 12(1):2. https://doi.org/10.3390/environments12010002
Chicago/Turabian StyleTronstad, Lusha M., Christine Bell, Katrina Cook, and Michael E. Dillon. 2025. "Using Species Distribution Models to Assess the Status of the Declining Western Bumble Bee (Hymenoptera: Apidae: Bombus occidentalis) in Wyoming, USA" Environments 12, no. 1: 2. https://doi.org/10.3390/environments12010002
APA StyleTronstad, L. M., Bell, C., Cook, K., & Dillon, M. E. (2025). Using Species Distribution Models to Assess the Status of the Declining Western Bumble Bee (Hymenoptera: Apidae: Bombus occidentalis) in Wyoming, USA. Environments, 12(1), 2. https://doi.org/10.3390/environments12010002