Article

Factors Influencing Endangered Marine Species in the Mediterranean Sea: An Analysis Based on IUCN Red List Criteria Using Statistical and Soft Computing Methodologies

by
Dimitris Klaoudatos
1,*,
Teodora Karagyaurova
1,
Theodoros G. I. Pitropakis
1,
Aikaterini Mari
1,
Dimitris R. Patas
1,
Maria Vidiadaki
1 and
Konstantinos Kokkinos
2
1
Department of Ichthyology and Aquatic Environment, School of Agricultural Sciences, University of Thessaly, 38446 Volos, Greece
2
Digital Systems Department, University of Thessaly, 41500 Larissa, Greece
*
Author to whom correspondence should be addressed.
Environments 2024, 11(7), 151; https://doi.org/10.3390/environments11070151
Submission received: 20 May 2024 / Revised: 9 July 2024 / Accepted: 11 July 2024 / Published: 16 July 2024

Abstract

:
The Mediterranean Sea is the second largest biodiversity hotspot on earth, with over 700 identified fish species is facing numerous threats. Of more than 6000 taxa assessed for the IUCN Red List, a minimum of 20% are threatened with extinction. A total of eight key factors that affect vulnerability of marine fish species in the Mediterranean Sea were identified using the scientific literature and expert-reviewed validated databases. A database of 157 teleost fish species with threat status ranging from least concern to critically endangered was compiled. Nominal logistic curves identified the factor thresholds on species vulnerability, namely, age at maturity, longevity, and asymptotic length at 8.45 years, 36 years, and 221 cm, respectively. A second-degree stepwise regression model identified four significant factors affecting the threat category of Mediterranean fish species, namely, overfishing, by-catch, pollution, and age at maturity according to their significance. Predictive analysis using supervised machine learning algorithms was further employed to predict the vulnerability of Mediterranean marine fish species, resulting in the development of a framework with classification accuracy of 87.3% and 86.6% for Support Vector Machine (SVM) and Gradient Boosting machine learning algorithms, respectively, with the ability to assess the degree of variability using limited information.

1. Introduction

Marine biodiversity provides value in many aspects of the Mediterranean population, both culturally and socio-economically [1]. It affects food security, and the tourism and fisheries industries, while also being of high importance for the cultural heritage of the various population groups residing in Mediterranean countries [1,2,3]. Biodiversity’s importance is as of now widely recognized by many stakeholders apart from academics, like mass media, decision makers, and, most importantly, public opinion [1,4,5,6,7]. Preserving the diversity of marine ecosystems is crucial as it sustains their functionality and prevents them from shifting into unfavorable conditions, thereby safeguarding the myriad direct and indirect advantages they offer. For these reasons, most conservation strategies for marine ecosystems target biodiversity [8].
The Mediterranean Sea is considered the second largest global biodiversity hotspot after the coral triangle in the western Pacific Ocean encompassing Indonesia, Malaysia, the Philippines, Papua New Guinea, Timor-Leste, and the Solomon Islands [9], boasting a uniquely rich and diverse variety of flora and fauna harboring an extensive biodiversity of roughly 17,000 species [2,10], due to its unique geographical and environmental characteristics and its major landmass convergence [11]. It is a unique geographic meeting point, situated in the convergence of Europe, Asia, and Africa, forming the biggest (approximately 2,500,000 km2) enclosed sea on Earth [10]. It has an average depth of 1500 m (4900 ft) and the deepest recorded point at 5109 m (16,762 ft) ± 1 m (3 ft) in the Calypso Deep in the Ionian Sea [10,12]. The average surface temperature ranges from 17.7 °C on the west side of the Mediterranean to 21.2 °C on the east. Throughout the year, the temperature ranges from 15.2 °C during the winter months to 18.8 °C in spring, 19.8 °C in autumn, and 25 °C during summer [13,14]. At depths of 300–500 m, the temperature ranges from 12.8 °C to 13.5 °C in the west and 13.5 °C to 15.5 °C in the east [10]. It is considered one of the least productive seas in the world, with the eastern part being one of the most oligotrophic parts of the sea [10,15]. A plethora of diverse habitats exist within the Mediterranean, such as coastal areas, deep-sea canyons, and underwater caves, providing niches for a wide array of organisms to thrive [10,16].
As of 2022, 20% of Mediterranean marine species assessed by the International Union for Conservation of Nature (IUCN) are threatened with extinction [17]. Within the Mediterranean Sea, biodiversity faces specific threats that warrant attention, such as overfishing and poaching, climate change, invasion of non-indigenous species (NIS), pollution, and eutrophication [17].
Overfishing is a significant concern, driven by unsustainable fishing practices and the depletion of fish stocks [10]. It is commonly accepted by the scientific community that overfishing can lead to decline in both target and non-target species [18,19], cause indirect impacts on marine population groups and communities [20,21], and modify the structure and function of marine ecosystems [22,23,24,25,26,27,28]. The complex and synergistic effects of exploitation and environmental variability affecting the entire food web are frequent causes of failure in fisheries management [29]. Many Mediterranean fish resources are highly exploited or overexploited [24,25,26,27,28,30], or facing the negative effects of poaching [31]. This not only disrupts marine ecosystems but also jeopardizes the livelihoods of coastal communities dependent on fishing [10].
Climate change causes water temperatures to rise, leading many species to extreme biological conditions, is also one of the most prominent threats to biodiversity [1]. This has been documented across the years regarding latitudinal shifts, colonization effects, and extinction of species [32]. The Mediterranean is presenting earlier impacts of climate change in its biodiversity and ecosystem, increasing the risk of extinction of endangered species [32]. This is due to habitat loss and the inability of certain endemic species to adapt, as well as interconnection with the creation of ideal climate conditions for invasive species to overtake [33,34,35].
According to numerous studies, the introduction and spread of marine invasive NIS pose significant threats to biodiversity, ecosystem structure, and function, recognized globally across various scales [36,37,38,39,40,41,42,43]. In the Mediterranean Sea, nearly 1000 NIS have been introduced, mainly from the Red Sea through the Suez Canal, with fish species ranking second in terms of diversity among them [42,43]. The population of these species is steadily increasing, indicating a growing success rate in their establishment [43] and in displacing native species by competing for the same resources or preying on them [44,45,46,47,48,49].
The extent of many important Mediterranean marine habitats, like seagrass meadows, has been reduced in the last 100 years, due to pollution, coastal development, and sedimentation [50,51,52]. According to [10], habitat degradation is one of the most widespread threats to biodiversity, while in areas with semi-enclosed basins, such as the Adriatic Sea, cases of cultural eutrophication are frequently recorded [16,53].
Conservation efforts such as marine protected areas (MPAs), MPA networks, and marine reserves aim to counteract this biodiversity loss [54]. MPAs are designated regions where human activities are regulated to protect marine ecosystems and biodiversity, often allowing for sustainable use of resources while preserving critical habitats [55]. Networks of MPAs are strategically designed to cover a range of habitats and species, ensuring ecological connectivity and resilience across broader areas. Marine reserves, a subset of MPAs, typically enforce stricter protections, often prohibiting extractive activities entirely to allow ecosystems to recover and thrive. These conservation strategies have shown positive impacts, such as the recovery of fish populations and the restoration of habitats, highlighting their importance in mitigating biodiversity loss and promoting marine ecosystem health. According to [56], the establishment of MPAs and their networks is crucial for achieving global biodiversity targets and ensuring the long-term sustainability of marine resources
The development of, and better accessibility to, machine learning tools and methods have allowed research in fields such as fisheries, aquaculture, marine biology and oceanography to be conducted in ways that had not been available in prior years [57]. Machine learning methods have been used in order to improve understanding and enable better management relating to a range of oceanic-related topics such as weather prediction and remote sensing [58], smart aquaculture [59], sea surface temperature and marine heatwave occurrence prediction [60], and effects on biological traits of fish species [54,61], as well as for determining driving factors leading to the extinction of marine mammals species [62], among others. Machine learning (ML) as a concept is a form of artificial intelligence (AI) which can estimate an output from a set of well-defined inputs through a range of different algorithms, with each one boasting a set of advantages and disadvantages [58]. ML methods require good data both in qualitative and quantitative means in order to perform best [57]. The principal methodology employed in ML is the iterative process of training algorithms on data to enable them to make predictions or decisions without being explicitly programmed for each task [63]. This process typically involves three main steps: data preprocessing, model training, and model evaluation. During data preprocessing, raw data are cleaned, transformed, and prepared for analysis to ensure their quality and relevance to the task at hand. Subsequently, the algorithm is trained on a portion of the data, known as the training set, using various techniques such as supervised, unsupervised, or reinforcement learning, depending on the nature of the problem. Finally, the trained model is evaluated on a separate portion of the data, called the test set, to assess its performance and generalization ability [57].
The aims of the present study were to: (i) identify key factors that affect the threat status of marine fish species in the Mediterranean Sea using the published scientific literature and established databases; (ii) identify factors that exhibit significant differences between threat status categories and further estimate the threshold values using univariate statistical methods, and; (iii) develop a framework to predict threat status of Mediterranean fish species with limited information using machine learning (ML) methodologies.

2. Materials and Methods

2.1. Data Collection and Analysis

A database of 155 teleost fish species comprising 32 endangered species and 123 non-endangered species was compiled. The database included biological traits as well as extrinsic factors associated with the threat status of fish (Table 1): longevity in years, asymptotic length in cm, maximum recorded depth in m, age at maturity in years, area of range in km2, overfishing, by-catch, pollution (with binary classification 0 for not vulnerable and 1 for vulnerable), and the threat status. Using IUCN Red List criteria for assessments in the Mediterranean, each species was assigned a threat category, namely, category 1: LC (least concern), category 2: NT (near threatened), category 3: (VU) vulnerable, category 4: (EN) endangered, or category 5: (CR) critically endangered. The IUCN Red List criteria are the universally recognized benchmark for evaluating a species’ risk of extinction on a global scale. A dichotomous response variable was used to represent extinction risk: species classified as VU, EN, or CR by the IUCN Red List were considered “threatened”, whilst NT and LC species were considered “non-threatened”.
Data sources consisted of accredited and expert-reviewed validated databases such as FishBase [64], WoRMS [65], the IUCN Red List [11], and peer-reviewed published articles. In detail, a filtering query was used in the IUCN [66]. Per taxonomy: the class Actinopterygii, per Red List category: critically endangered (CR), endangered (EN), vulnerable (VU), near threatened (NT) and least concern (LC), and lastly, per marine region: the Mediterranean and Black Seas. This formed a solid data collection consisting of 80% of species in the non-endangered categories (LC and NT) and 20% of species in the highly endangered Red List categories (EN, VU, and CR). Species to include in the dataset were chosen according to certain criteria, namely, availability of required data and Red List category as well as the need to maintain a homogenous sample from Mediterranean fish species families and also reach an acceptable sample size for use in ML methodologies [57]. For each species, the spatial distribution was cross-validated in FishBase and WoRMS, then all required data were gathered from the above sources (including the IUCN Red List of threatened species) such as longevity, asymptotic length, maximum recorded depth, age at maturity, area of range, being threatened by overfishing, and by-catch and/or pollution for the total of fish species, as presented in the summary Table 2 and the extensive Supplementary Table S1.

2.2. Univariate Analysis

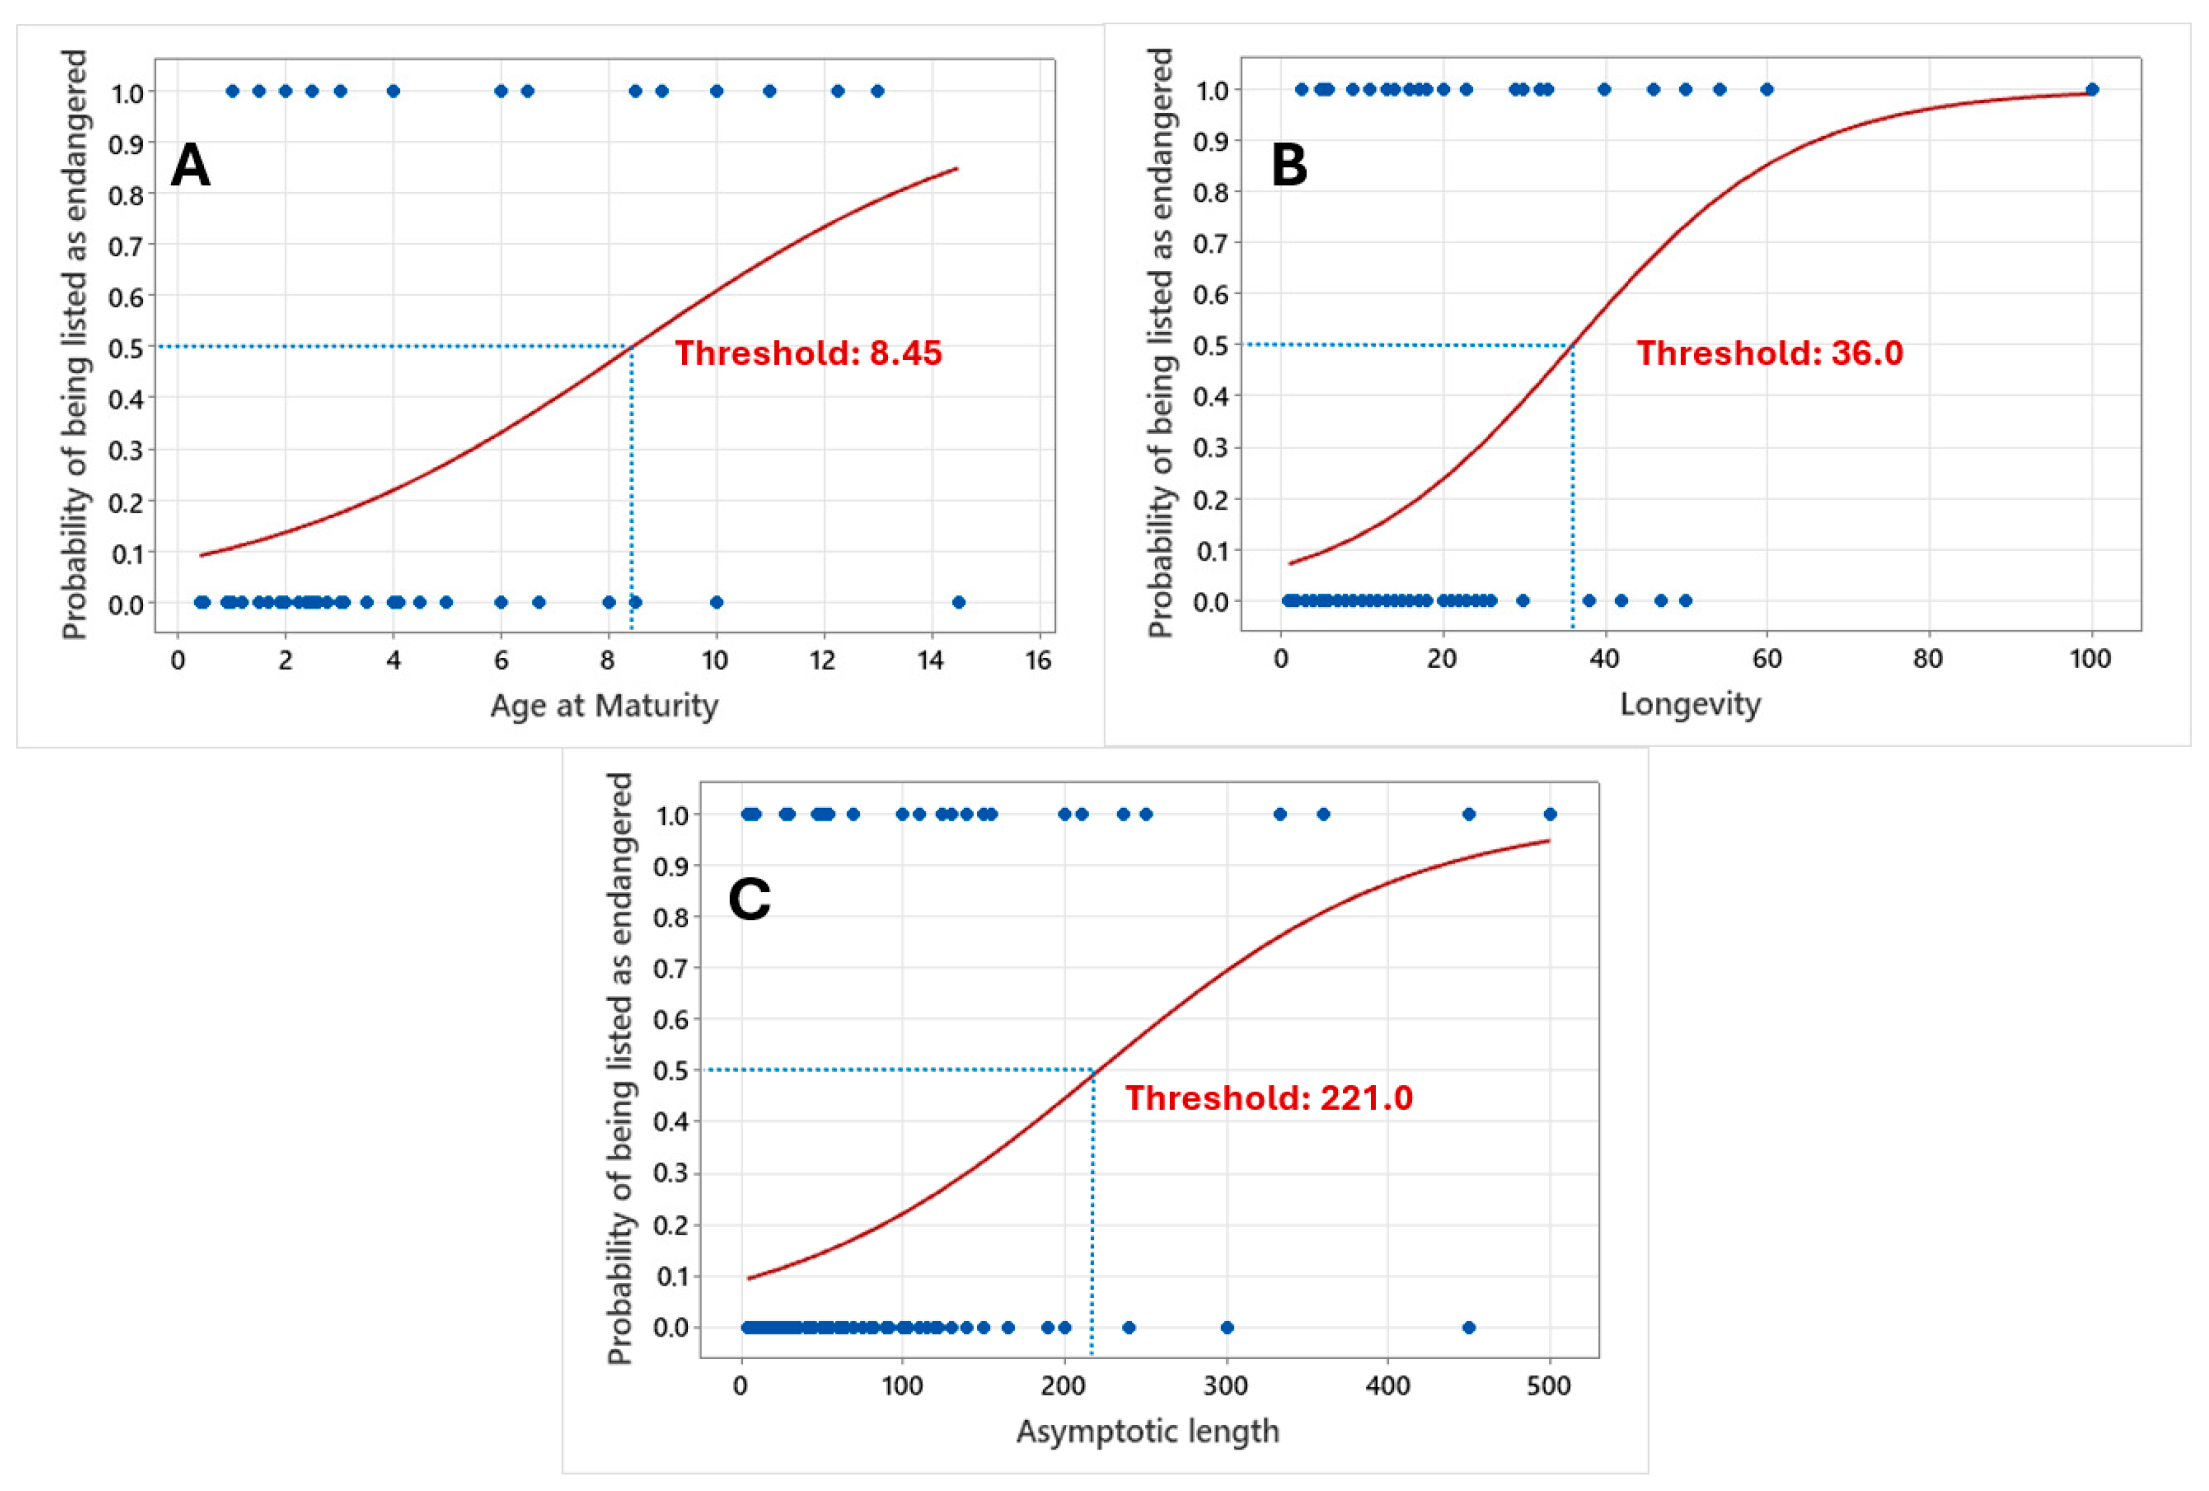
The data were coded in Microsoft Excel and analyzed using exploratory data analysis (EDA) and inferential statistics using the statistical program Jamovi (Ver. 2.5.3) [67] (Sydney, Australia) at an alpha level of 0.05. Normality of distribution was assessed using the Shapiro–Wilk normality test. Bartlett and Levene tests were used to assess homoscedasticity. Species vulnerability was assessed with the use of Student’s t and Mann–Whitney U tests [68]. Following inferential statistical analysis, nominal logistic curves were fitted to continuous factors with exhibited significant difference on the threat category, to identify each factor’s threshold on species threat status [69].

2.3. Machine Learning

Predictive analysis using supervised ML algorithms was further employed to identify the principal contributing components that affect marine fish species vulnerability in the Mediterranean, using the visual programming software Orange (version 3.36.2) (Ljubljana, Slovenia) [70] (Figure 1).
The major factors affecting the threat category and their relative importance were identified by fitting a second-degree stepwise regression using the model effects as factors, using the minimum Bayesian Information Criterion (BIC) and the minimum corrected Akaike Information Criterion (AIC). The Variance Inflation Factor (VIF) was employed as a measure of multicollinearity [69]. Sample-size-to-Feature-size Ratio (SFR) was also employed to assess the sufficiency of the data used to predict threat status [57].

2.4. Description of ML Algorithms

Following data collection, data were prepared through cleaning, coding, and error correction, and the dataset was split into a training set and a testing set using the 70%–30% training–testing ratio. Following model training, model parameter fine-tuning was attempted to optimize each model’s performance. No preprocessing on the dataset was used prior to the analyses. Evaluation and comparison of the models to identify the best overall performance was assessed with stratified 5-fold cross-validation using performance metrics. The models employed included Support Vector Machine (SVM), Gradient Boosting, Neural Network, Naïve Bayes, Adaptive Boost (ADA Boost), and Decision Trees (DT).

2.4.1. The Support Vector Machine Model

The Support Vector Machine (SVM) model is a supervised learning algorithm used primarily for classification tasks. The core idea behind the SVM model is to find the optimal hyperplane that best separates the data points of different classes in a high-dimensional space, thus maximizing the margin between the instances of different classes or class values known as support vectors [71]. The SVM model is particularly effective in high-dimensional spaces and when the number of dimensions exceeds the number of samples. It is also versatile due to the use of kernel functions, which can handle nonlinear relationships by transforming the input space into higher dimensions where a linear separator can be applied. The SVM model is trained by solving a constrained quadratic optimization problem. SVM implements mapping of inputs onto a high-dimensional space using a set of nonlinear-basis functions [72].

2.4.2. Gradient Boosting

Gradient Boosting is a powerful machine learning technique used for regression and classification tasks. It builds an ensemble of decision trees, where each tree attempts to correct the errors of its predecessor by focusing on the instances that previous trees misclassified or predicted poorly. This is achieved by sequentially fitting new models to the residual errors of prior models [73]. By combining the predictions of these models, Gradient Boosting creates a robust predictive model that typically performs well with minimal tuning [74]. It is known for its effectiveness in handling various data types and its ability to model complex relationships within data.

2.4.3. Neural Network

A Neural Network model is a computational model inspired by biological neural networks in the human brain that processes information. These networks consist of interconnected layers of nodes, or neurons, where each connection has an associated weight that adjusts as learning proceeds. The primary layers include an input layer, one or more hidden layers, and an output layer. During training, the network learns to recognize patterns and make decisions by adjusting the weights based on the error of its predictions, using algorithms such as backpropagation [75]. Neural Networks are widely used in various fields, including image and speech recognition, natural language processing, and autonomous systems, due to their ability to model complex, nonlinear relationships in data [63].

2.4.4. Naïve Bayes Classifiers

The Naïve Bayes classifier technique is a probabilistic classifier based on Bayes’ Theorem, assuming independence among predictors. It is a simple yet effective classifier, particularly in text classification tasks such as spam detection and sentiment analysis. The core principle involves calculating the posterior probability of a class given a set of features, using the prior probability of the class, the likelihood of the features given the class, and the evidence of the features [76]. Its efficiency stems from the assumption that all features contribute independently to the final classification decision, which simplifies the computation even with large datasets. Studies have shown that Naïve Bayes can perform comparably to more complex models under certain conditions, particularly when the assumption of feature independence holds approximately true [77].

2.4.5. Adaptive Boosting

Adaptive Boosting (AdaBoost) is a powerful ensemble learning technique that improves the performance of machine learning models by combining multiple weak classifiers to create a strong classifier. Proposed by Freund and Schapire in 1996, AdaBoost works by sequentially training weak classifiers, typically decision stumps, where each new classifier is focused on the errors made by the previous ones [78]. The method assigns higher weights to misclassified instances, ensuring subsequent classifiers target these harder cases more aggressively. Over several iterations, AdaBoost adjusts the weights of classifiers based on their accuracy, thereby improving overall model performance. This iterative process results in a robust predictive model capable of handling various types of classification tasks efficiently [79].

2.4.6. Decision Tree

A decision tree is a highly effective supervised learning algorithm that models decisions and their possible consequences [80]. It uses a tree-like model of decisions, where each internal node represents a test on an attribute, each branch represents the outcome of the test, and each leaf node represents a class label (decision taken after computing all attributes). This structure makes it easy to understand and interpret, as it visually maps out all potential outcomes of a series of related choices, offering a clear path from question to conclusion [81]. Decision trees are employed in various domains, such as finance for credit scoring, in medicine for diagnosing diseases, and in engineering for fault detection. The method is easy to understand, resilient to outliers, and capable of handling missing values and highly skewed data without requiring transformations. Additional advantages include simplifying complex relationships by segmenting data into subgroups and providing nonparametric approaches that do not rely on distributional assumptions [82].

3. Results

3.1. Univariate Statistics

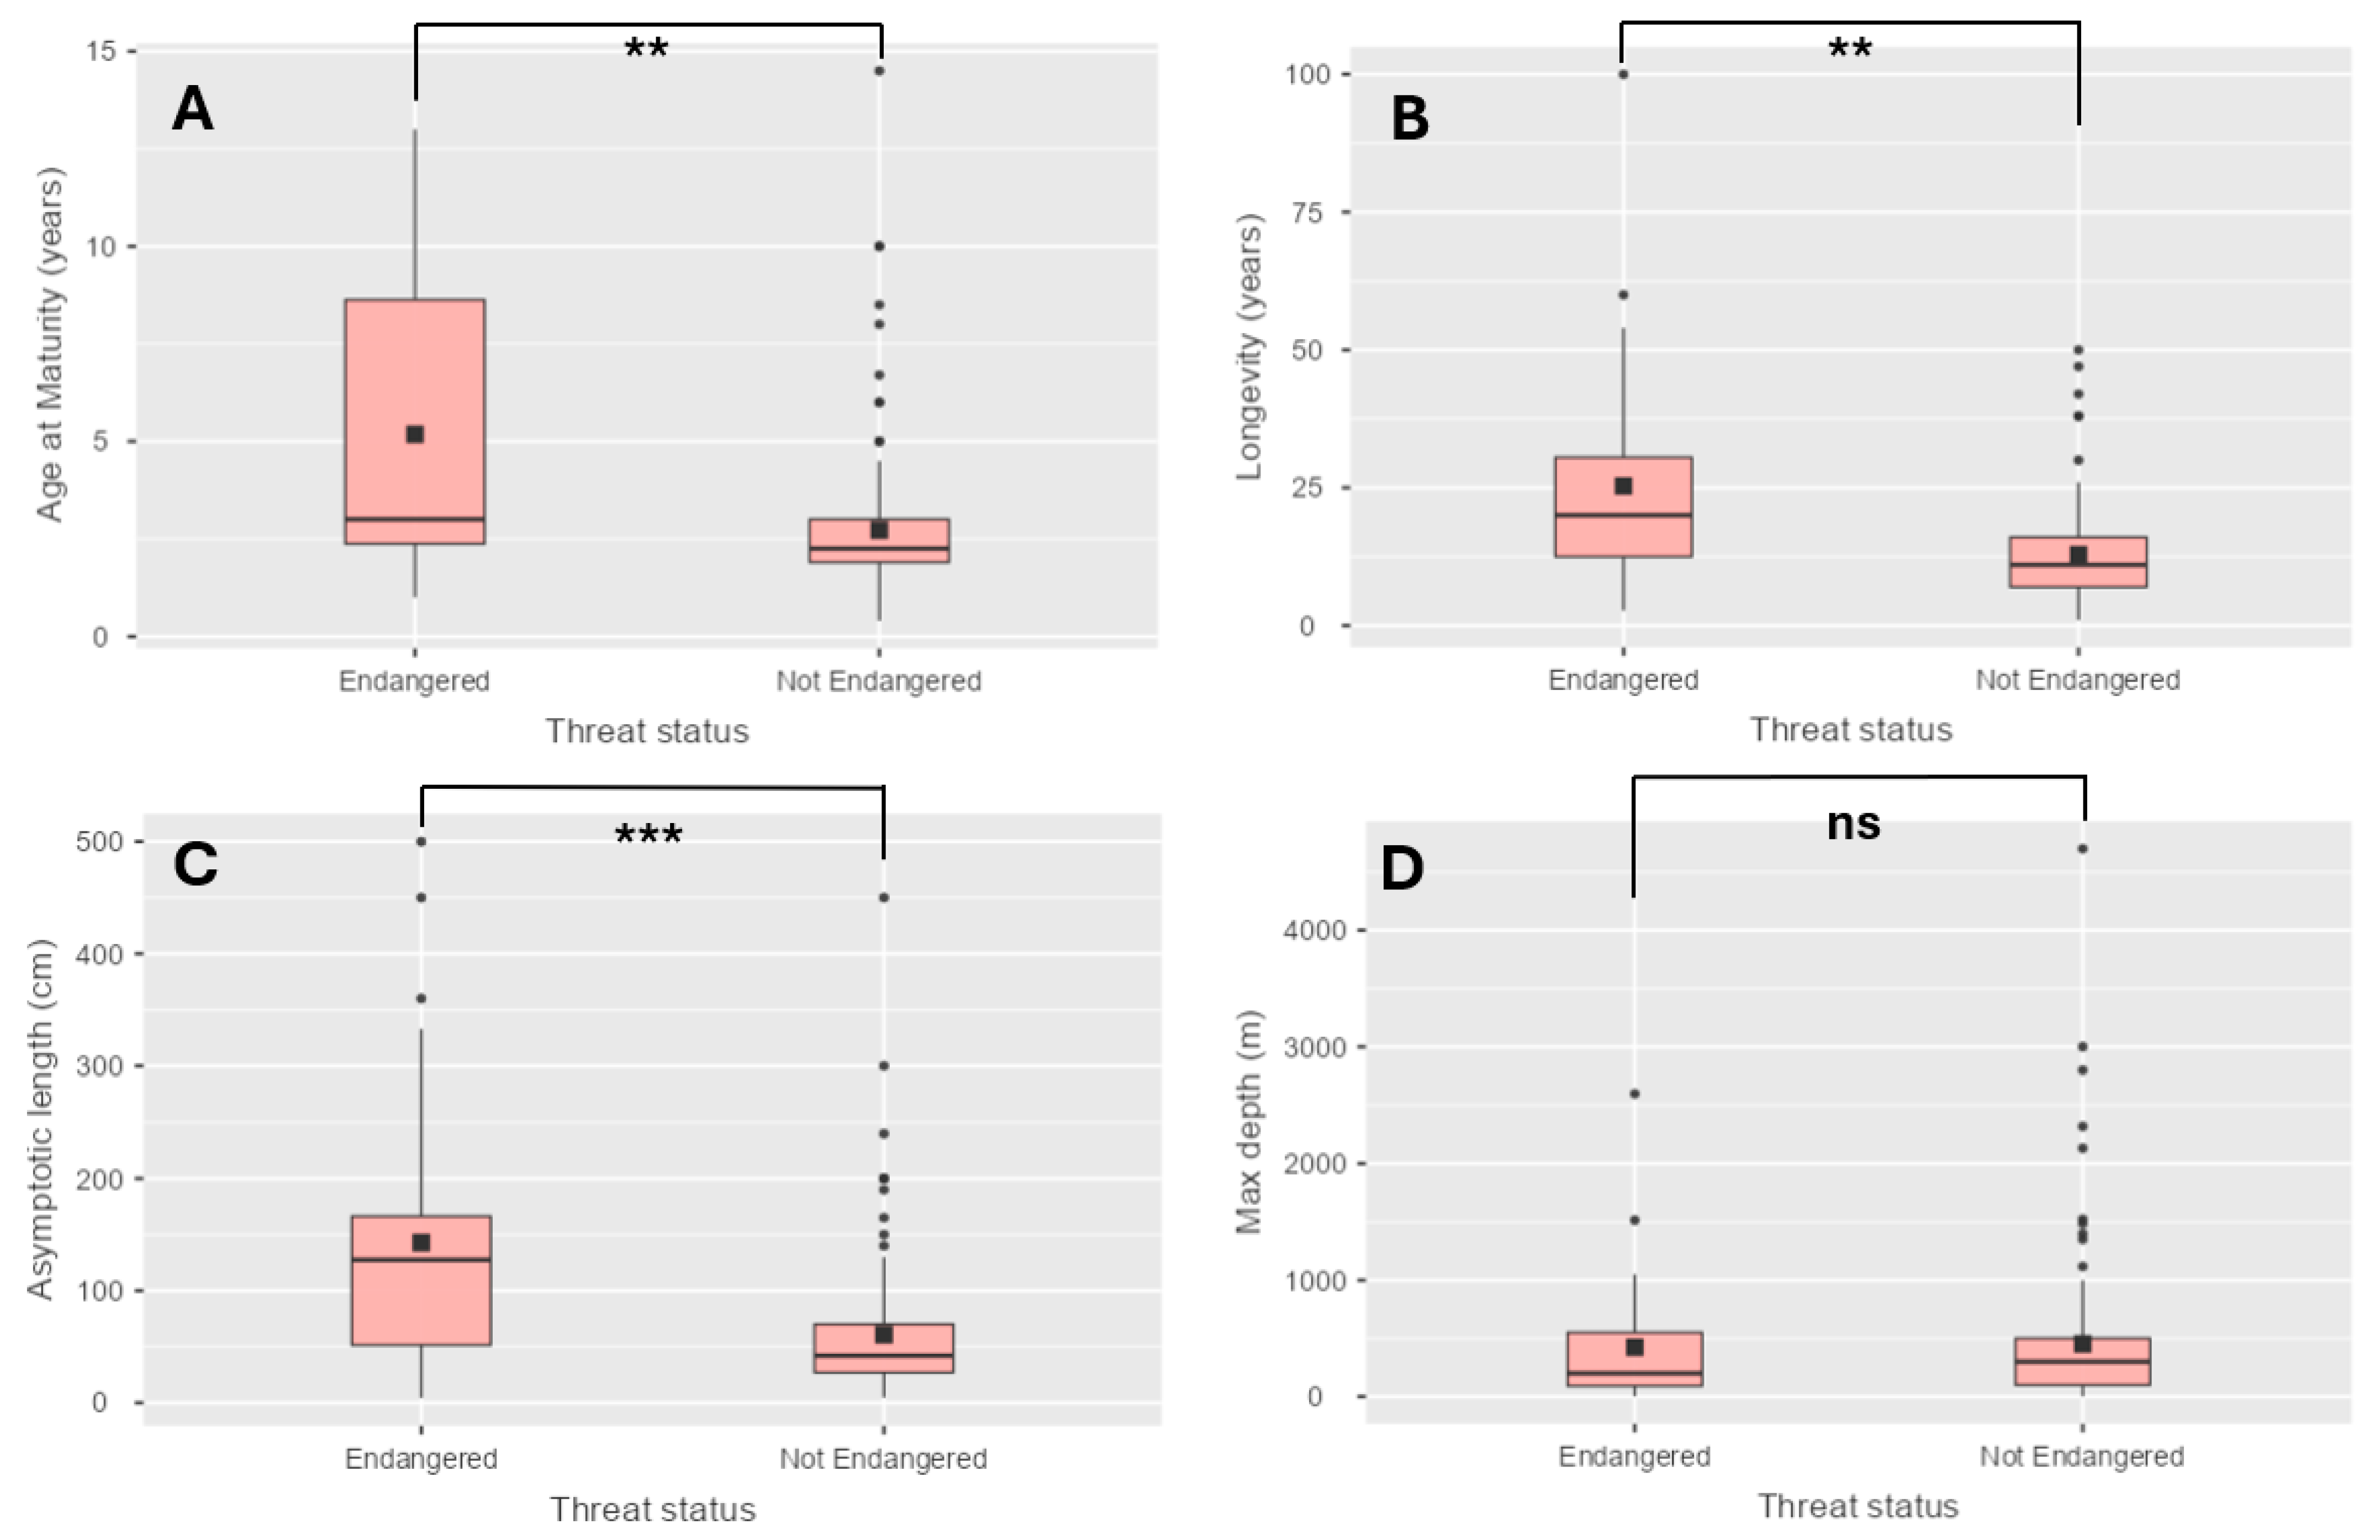
Numerical factors that were initially identified being associated with the threat status of Mediterranean Sea marine fish species are described in Table 2. Comparative boxplots of potential influential factors on marine species threat status in the Mediterranean Sea are shown in Figure 2.
Univariate statistical methods identified three factors (age at maturity, longevity, and asymptotic length) that exhibit significant differences between states of vulnerability (Figure 2).
Nominal logistic curves fitted to the three significant factors identified (age at maturity, longevity, asymptotic length) as affecting marine Mediterranean fish species vulnerability indicated that above 8.45 years age at maturity, 36 years longevity, and 221 cm asymptotic length, there is higher probability for the species in question to be at an endangered state (Figure 3).
A second-degree stepwise regression model identified four factors that exerted a significant effect on the threat category of Mediterranean fish species out of the eight factors screened, namely, overfishing, by-catch, pollution, and age at maturity (Table 3) according to their significance.
The model resulted in a chi-square statistic of 74.74 with an associated p-value < 0.0001, indicating that the overall model is significant. No lack of fit was detected in the model, with p > 0.05. No collinearities were detected among the four identified factors, with VIF values ranging between 1.05 and 1.16. The training Sample-size-to-Feature-size Ratio (SFR) was 39.25, indicating the presence of sufficient data to predict threat status using a ML approach.

3.2. Machine Learning

The four factors with a significant impact on Mediterranean fish species vulnerability identified were applied to six ML models, and their performance was assessed.
Model performance was assessed using a total of six indicators, namely, the area under the receiver-operating curve (AUC), the proportion of correctly classified examples, i.e., classification accuracy (CA), the weighted harmonic means of precision and recall (F1), the proportion of true positives among instances classified as positive (Prec), the proportion of true positives among all positive instances in the data (Recall), and the Matthews correlation coefficient (MCC). According to the indicators employed, the models that performed best in predicting the vulnerability of Mediterranean marine fish species using the four identified factors were the SVM model followed by Gradient Boosting (Figure 4).
The best CA (87.3%) was exhibited by the SVM model, with the lowest CA observed from the DT model.
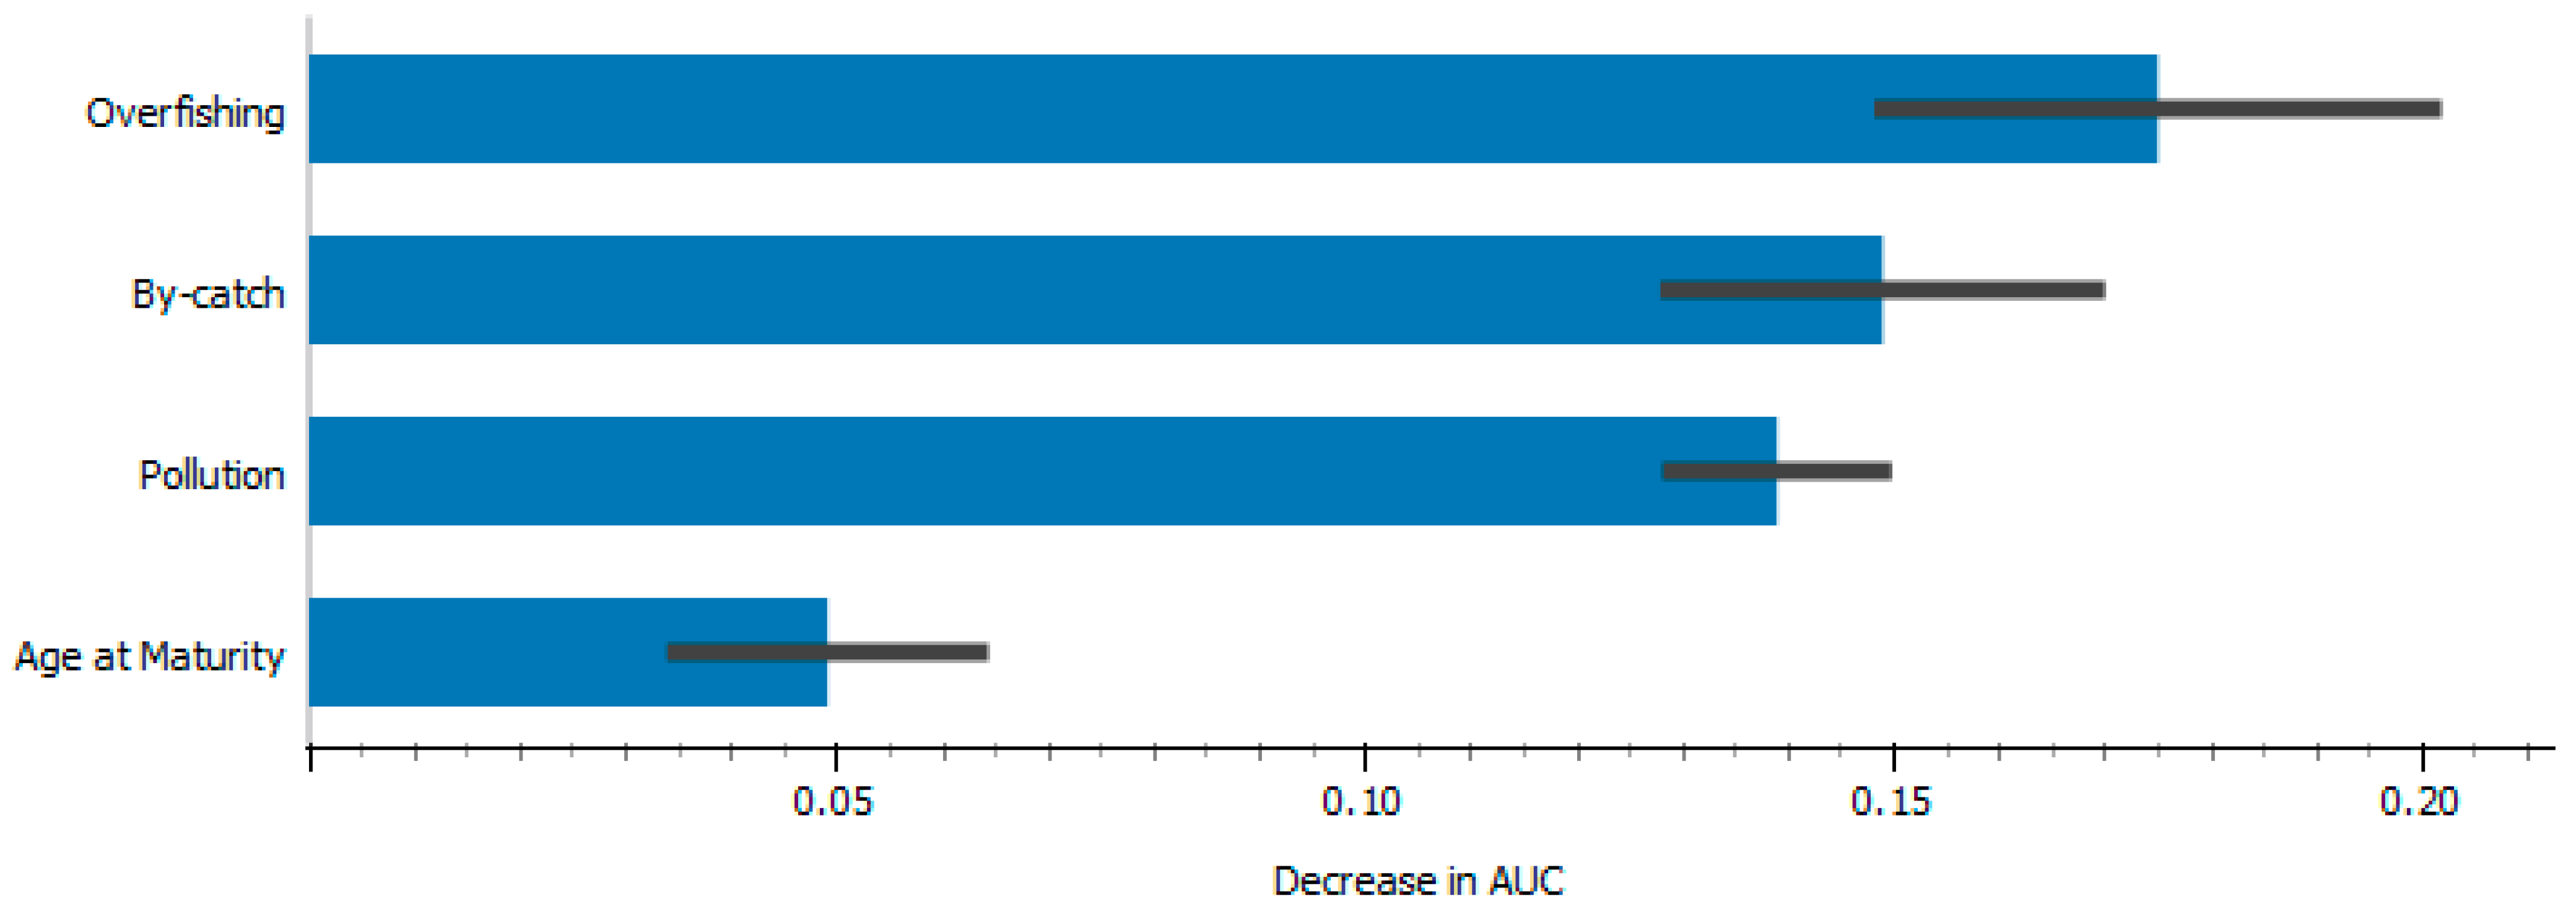
The computed contribution of the best-performing model (SVM), based on the AUC score of each feature toward prediction, was estimated by measuring the increase in the prediction error after permutation of each feature’s values, breaking the relationship between the feature and the target (Figure 5). Figure 5 further indicates that overfishing was the most significant factor, followed by by-catch, pollution, and age at maturity.
A visualization of the Decision Tree model employed by splitting the data into nodes by class purity (using the Kullback–Leibler divergence) classified the mode of classification of each instance into an endangered or non-endangered state (i.e., threat status) (Figure 6).
The visualization of the DT model (Figure 6) indicated that overfishing is a major threat to fish populations, with fish species experiencing overfishing being classified as endangered 100% of the time. Age at maturity also plays a role, with fish maturing later (greater than 8.5 years) being more likely to be endangered (88.9%) compared to those maturing earlier (less than 8.5 years) (30%). By-catch and pollution appear to have a lesser effect, although by-catch can increase the risk of endangerment (56.5% vs. 43.5%). Higher levels of pollution tend to increase the likelihood of a species being endangered, especially when combined with other factors like age at maturity. Overall, the decision tree classification aids in understanding how various environmental and biological factors contribute to the conservation status of species, suggesting that overfishing and late age at maturity are the biggest threats to a fish species becoming endangered.

4. Discussion

The Mediterranean Sea boasts rich biodiversity, with numerous fish species that contribute to its ecological balance and cultural heritage. With over 700 species identified, including commercially important species like sardines, anchovies, and sea breams, the Mediterranean Sea supports a diverse marine ecosystem crucial for both sustenance and recreation [83]. However, this rich biodiversity faces numerous threats, including overfishing, habitat degradation, pollution, and climate change, underscoring the need for effective conservation measures to safeguard this invaluable natural resource [10]. Protecting Mediterranean fish biodiversity is not only essential for the health of the marine environment but also for the socio-economic well-being of coastal communities dependent on these resources.
The Mediterranean countries are the primary contributors to the significant trade deficit in the European Union’s fishery and aquaculture products. The five largest Mediterranean nations within the European Union—France, Spain, Italy, Greece, and Portugal—constitute about 38% of Europe’s population, yet are responsible for approximately 53% of the region’s consumption. As a result, those countries are leading consumers but with a fishery and aquaculture production deficit [84].
Results indicated that fish species with an asymptotic length greater than 221 cm are more likely to be at risk of extinction. This category includes species such as Thunnus thynnus with an asymptotic length of 450 cm [85]. However, most species analyzed in this study that were assessed as endangered had an asymptotic length between 100 and 150 cm, and only six species had a length greater than 221 cm. Our sample also included species with very small asymptotic lengths, such as Pomatoschistus microps with just 9 cm [86] and Entomacrodus solus with 4.3 cm [87]. The average asymptotic length for all endangered species in the sample was calculated to be 143 ± 128 cm. The small influence of asymptotic length on the final model could be attributed to the presence of large variability within the sample of collected data.
Furthermore, fish species with longevity over 36 years and age of sexual maturity over 8.45 years were found to be more likely at risk to be in danger of extinction. Species with longer lifespans tend to mature at an older age, and species with greater longevity also tend to have a greater asymptotic length [88,89]. The small effect of longevity on our model could be attributed to the large variability within the sample data, with an average value of 25 ± 20 years. On the contrary, the influence of age at maturity as a driver for extinction risk in fish is well known and validated by previous studies [90], with our results indicating that this was the only significant and the most influential species characteristic on our ML models.
The best-performing model in the present study indicated that, with decreasing significance, overfishing was the most significant factor followed by by-catch, pollution, and age at maturity, in accordance with previous studies on marine conservation, as factors known to be of high importance to ecosystem assessment and monitoring [91,92,93,94,95]. The most influential factor on all ML models was overfishing, with minor changes exhibited in the sequence of the second, third, and fourth most influential factors from all models’ output.
Maximum depth limit was not found to influence Mediterranean fish species vulnerability. In contrast, [96] reported that species with shallower maximum depths have a higher extinction risk. A difference possibly attributed to the focus of the authors on grouper species with a global reach.
The loss, fragmentation, and degradation of habitats as a direct or indirect result of human activities are the main threats to Mediterranean species. For example, 32% of freshwater fishes are threatened by dam construction [97], which drastically alters hydrological processes, reduces the amount of water available downstream, blocks migratory routes, and can impair reproduction [2]. For species of the Acipenseridae family, pollution and degradation of habitats, in combination with late age at maturity and high longevity, according to our model, result in most of this family’s species being in a highly endangered threat status, in accordance with previous assessments [98,99,100,101,102].
In 2017, 34.2% of the fish stocks of the world’s marine fisheries were classified as overfished. Overfishing—stock abundance fished to below the level that can produce maximum sustainable yield (MSY)—not only causes negative impacts on biodiversity and ecosystem functioning, but also reduces fish production, which subsequently leads to negative social and economic consequences [103]. The role of overfishing as a driver for extinction is highlighted by our model with it being the most impactful factor, further exhibited by the fact that most of the endangered species assessed in our dataset were affected by overfishing.
By-catch is a major disruptive environmental problem for fisheries. It is a significant issue because it can lead to the overexploitation of non-target species, disrupt marine ecosystems, and cause substantial economic losses for the fishing industry due to the wastage of potentially valuable resources. Effective management and mitigation strategies, such as the use of by-catch reduction devices and more selective fishing practices, are essential to address this problem [104,105]. Although by nature by-catch does not differ much from fishing activity from the species perspective as being a threat increasing the extinction risk, as a means of integrated ecosystem management, by-catch is one of the factors which does not contribute to fishing revenues and food security [106], although there are efforts to valorize by-catch and incidental catches. Measures to minimize by-catch should be prioritized, since it presents the greatest environmental cost with the least socio-economic benefit comparative to other anthropogenic factors like overfishing and pollution [107].
The threat status used in this study originated from the IUCN’s Species Survival Commission (SCS) approach, which classifies species into various threat categories based on factors and traits such as population size, subpopulations, number of mature individuals, generation length, rate of decline in abundance, extreme fluctuations, extent of occurrence, fragmentation of populations, and quantitative data [108]. The IUCN’s initial approach to setting criteria for threat status thresholds stems from the assessment of terrestrial and avian species, resulting in cases of inconsistencies (i.e., moderately exploited but not overexploited fish species are considered endangered) [91]. Hence, we attempted to utilize factors more specific to teleost fish species, to more precisely assess and set thresholds for threat status in the Mediterranean Sea. Biological traits differ between species and greatly affect the survivability of fish populations; also, for certain species, anthropogenic influence may have detrimental effects even with a seemingly healthy population size [109]. Still utilizing the IUCN’s threat status categorizing (IUCN Red List criteria), we trained and assessed various ML models, setting thresholds for specific and measurable biological traits such as longevity, age at maturity, max depth, and asymptotic length, in accordance with anthropogenic factors. The framework presented is comparable to COSEWIC’s assessment process [88] and can be applied to ecosystems housed in the broader Mediterranean basin. There is also the possibility of determining the threat status of a species declared data-deficient (DD) or non-evaluated (NE) by the IUCN, by inserting the determined inputs (numerical and nominal). As a proof of concept, we tested four data-deficient-declared species for the Mediterranean, namely, Polyprion americanus, Bathysolea profundicola, Monochirus hispidus, and Synapturichthys kleinii, using the trained ML models to determine the threat category, with promising predictions indicating the opportunity for more specialized determination approaches, although further examination is required to verify the results.
We identified several drawbacks and challenges whilst developing our framework. One of its drawbacks is the requirement for labor-intensive searching of the literature and data entry. There is the need to develop a more automated data entry workflow, which has already been demonstrated for marine science applications [110]. Additionally, we consider the need to further specify threats in our model, including more detailed threat metrics such us fish population exploitation rate, maximum sustainable yield, and pollution events, which all would lead to a more complex data mining process leading beyond our original goal of developing a model which utilizes readily accessible data. Also, there is the possibility to extend the model with a broader range of species classes and include elasmobranchs, crustaceans, echinoderms, and/or mammalian species, or narrow down the training dataset to only include species of a specific genus or family in order to more precisely predict threat status for specific species, similarly to [96], who determined the threat status of groupers.

5. Conclusions

The results of the present study highlighted, with decreasing importance, that overfishing, by-catch, pollution, and age at maturity are the most significant factors affecting extinction risk and negatively affect teleost biodiversity in the Mediterranean Sea. The various machine learning models assessed exhibited good overall performance metrics (high AUC, CA, Recall) utilizing a suitable dataset for use in ML methods (SFR>10). Although still presenting many shortcomings such as manual data input, the framework of this study empowers stakeholders associated with ecosystem management to utilize and focus on more definable, finite data and criteria to assess the threat status for teleost fish species in combination with other assessment tools. Additionally, our work contributes to highlighting the need for an integrated ecosystem approach including regulation enforcement and applied threat mitigation measures across the study area.

Supplementary Materials

The following supporting information can be downloaded at: https://www.mdpi.com/article/10.3390/environments11070151/s1, Table S1: The complete list of species for which data were collected, along with their IUCN Red List Category and family (based on assessments up to 2023), is provided below. The abbreviations for the IUCN Red List categories are as follows: CR—Critically Endangered, EN—Endangered, VU—Vulnerable, NT—Near Threatened, and LC—Least Concern.

Author Contributions

Conceptualization: D.K.; methodology: D.K.; software: D.K. and K.K.; validation: D.K. and K.K.; formal analysis: D.K. and K.K.; investigation: T.K., T.G.I.P., A.M., D.R.P. and M.V.; resources: D.K.; data curation: T.K., T.G.I.P., A.M., D.R.P. and M.V.; writing—original draft preparation: D.K., T.K. and T.G.I.P.; writing—review and editing: D.K., T.K., T.G.I.P., A.M., D.R.P., M.V. and K.K.; visualization: D.K.; supervision, D.K. and K.K.; project administration: D.K. and K.K. All authors have read and agreed to the published version of the manuscript.

Funding

This research received no external funding.

Data Availability Statement

The datasets analyzed from the current study are available from the corresponding author upon reasonable request.

Conflicts of Interest

The authors declare no conflict of interest.

References

  1. Bianchi, C.N.; Morri, C. Marine Biodiversity of the Mediterranean Sea: Situation, Problems and Prospects for Future Research. Mar. Pollut. Bull. 2000, 40, 367–376. [Google Scholar] [CrossRef]
  2. Cuttelod, A.; García, N.; Malak, D.A.; Temple, H.J.; Katariya, V. The Mediterranean: A biodiversity hotspot under threat. In Wildlife in a Changing World—An Analysis 2008 IUCN Red List Threatened Species; International Union for Conservation of Nature and Natural Resources: Gland, Switzerland, 2009; Volume 89. [Google Scholar]
  3. Lotze, H.K. Marine biodiversity conservation. Curr. Biol. 2021, 31, R1190–R1195. [Google Scholar] [CrossRef] [PubMed]
  4. Culotta, E. Exploring biodiversity’s benefits. Science 1996, 273, 1045–1046. [Google Scholar] [CrossRef]
  5. Bengtsson, J.; Jones, H.; Setälä, H. The value of biodiversity. Trends Ecol. Evol. 1997, 12, 334–336. [Google Scholar] [CrossRef] [PubMed]
  6. Grime, J.P. Biodiversity and ecosystem function: The debate deepens. Science 1997, 277, 1260–1261. [Google Scholar] [CrossRef]
  7. Aarts, B.G.W. Ecological sustainability and biodiversity. Int. J. Sustain. Dev. World Ecol. 1999, 6, 89–102. [Google Scholar] [CrossRef]
  8. Neeman, N.; Servis, J.A.; Naro-Maciel, E. Conservation issues: Oceanic ecosystems. In Encyclopedia of the Anthropocene; Elsevier: Amsterdam, The Netherlands, 2017; Volume 1–5, pp. 193–201. ISBN 9780128096659. [Google Scholar]
  9. Asaad, I.; Lundquist, C.J.; Erdmann, M.V.; Costello, M.J. The coral triangle: The most species rich marine region on earth. Encycl. World’s Biomes 2020. [Google Scholar] [CrossRef]
  10. Coll, M.; Piroddi, C.; Steenbeek, J.; Kaschner, K.; Ben Rais Lasram, F.; Aguzzi, J.; Ballesteros, E.; Bianchi, C.N.; Corbera, J.; Dailianis, T. The biodiversity of the Mediterranean Sea: Estimates, patterns, and threats. PLoS ONE 2010, 5, e11842. [Google Scholar] [CrossRef] [PubMed]
  11. IUCN. The IUCN Red List of Threatened Species; Version 2023-1; IUCN: Gland, Switzerland, 2023. [Google Scholar]
  12. Kontoyiannis, H.; Lykousis, V.; Papadopoulos, V.; Stavrakakis, S.; Anassontzis, E.G.; Belias, A.; Koutsoukos, S.; Resvanis, L.K. Hydrography, Circulation, and Mixing at the Calypso Deep (the Deepest Mediterranean Trough) during 2006-2009. J. Phys. Oceanogr. 2016, 46, 1255–1276. [Google Scholar] [CrossRef]
  13. Shaltout, M.; Omstedt, A. Recent sea surface temperature trends and future scenarios for the Mediterranean Sea. Oceanologia 2014, 56, 411–443. [Google Scholar] [CrossRef]
  14. Danovaro, R. Climate change impacts on the biota and on vulnerable habitats of the deep Mediterranean Sea. Rend. Lincei. Sci. Fis. E Nat. 2018, 29, 525–541. [Google Scholar] [CrossRef]
  15. Azov, Y. Eastern Mediterranean—A marine desert? Mar. Pollut. Bull. 1991, 23, 225–232. [Google Scholar] [CrossRef]
  16. Danovaro, R.; Canals, M.; Gambi, C.; Heussner, S.; Lampadariou, N.; Vanreusel, A. Exploring benthic biodiversity patterns and hotspots on European margin slopes. Oceanography 2009, 22, 16–25. [Google Scholar] [CrossRef]
  17. IUCN. Guidelines for Using the IUCN Red List Categories and Criteria; Version 15; IUCN Standards and Petitions Committee: Gland, Switzerland, 2022. [Google Scholar]
  18. Baum, J.K.; Myers, R.A.; Kehler, D.G.; Worm, B.; Harley, S.J.; Doherty, P.A. Collapse and conservation of shark populations in the Northwest Atlantic. Science 2003, 299, 389–392. [Google Scholar] [CrossRef] [PubMed]
  19. Myers, R.A.; Worm, B. Extinction, survival or recovery of large predatory fishes. Philos. Trans. R. Soc. B Biol. Sci. 2005, 360, 13–20. [Google Scholar] [CrossRef]
  20. Jennings, S.; Kaiser, M.J. The effects of fishing on marine ecosystems. In Advances in Marine Biology; Elsevier: Amsterdam, The Netherlands, 1998; Volume 34, pp. 201–352. ISBN 0065-2881. [Google Scholar]
  21. Jackson, J.B.C.; Kirby, M.X.; Berger, W.H.; Bjorndal, K.A.; Botsford, L.W.; Bourque, B.J.; Bradbury, R.H.; Cooke, R.; Erlandson, J.; Estes, J.A. Historical overfishing and the recent collapse of coastal ecosystems. Science 2001, 293, 629–637. [Google Scholar] [CrossRef]
  22. Pauly, D.; Christensen, V.; Dalsgaard, J.; Froese, R.; Torres, F., Jr. Fishing down marine food webs. Science 1998, 279, 860–863. [Google Scholar] [CrossRef]
  23. Worm, B.; Barbier, E.B.; Beaumont, N.; Duffy, J.E.; Folke, C.; Halpern, B.S.; Jackson, J.B.C.; Lotze, H.K.; Micheli, F.; Palumbi, S.R. Impacts of biodiversity loss on ocean ecosystem services. Science 2006, 314, 787–790. [Google Scholar] [CrossRef]
  24. MacKenzie, B.R.; Mosegaard, H.; Rosenberg, A.A. Impending collapse of bluefin tuna in the northeast Atlantic and Mediterranean. Conserv. Lett. 2009, 2, 26–35. [Google Scholar] [CrossRef]
  25. Lleonart, J.; Maynou, F. Fish stock assessments in the Mediterranean: State of the art. Sci. Mar. 2003, 67, 37–49. [Google Scholar] [CrossRef]
  26. Papaconstantinou, C.; Farrugio, H. Fisheries in the Mediterranean. Mediterr. Mar. Sci. 2000, 1, 5–18. [Google Scholar] [CrossRef]
  27. Bas, C.; Maynou, F.; Sarda, F.; Lleonart, J. Variacions Demogràfiques a Les Poblacions D’espècies Demersals Explotades; Institut d’Estudis Catalans: Barcelona, Spain, 2003. [Google Scholar]
  28. Bombace, G.; Grati, F. Che succede alle risorse di pesca del Mediterraneo. In Notiziario Della SocietaItaliana di Biologia Marina; S.I.B.M.: Livorno, Italy, 2007; Volume 51, pp. 29–38. [Google Scholar]
  29. Hilborn, R.; Branch, T.A.; Ernst, B.; Magnusson, A.; Minte-Vera, C.V.; Scheuerell, M.D.; Valero, J.L. State of the world’s fisheries. Annu. Rev. Environ. Resour. 2003, 28, 359–399. [Google Scholar] [CrossRef]
  30. Lee, M.; Safina, C. The effects of overfishing on marine biodiversity. Curr. J. Mar. Educ. 1995, 13, 5–9. [Google Scholar]
  31. Bell, S.; Hampshire, K.; Topalidou, S. The political culture of poaching: A case study from northern Greece. Biodivers. Conserv. 2007, 16, 399–418. [Google Scholar] [CrossRef]
  32. Chefaoui, R.M.; Duarte, C.M.; Serrão, E.A. Dramatic loss of seagrass habitat under projected climate change in the Mediterranean Sea. Glob. Chang. Biol. 2018, 24, 4919–4928. [Google Scholar] [CrossRef] [PubMed]
  33. D’Amen, M.; Azzurro, E. Lessepsian fish invasion in Mediterranean marine protected areas: A risk assessment under climate change scenarios. ICES J. Mar. Sci. 2020, 77, 388–397. [Google Scholar] [CrossRef]
  34. Klausmeyer, K.R.; Shaw, M.R. Climate change, habitat loss, protected areas and the climate adaptation potential of species in mediterranean ecosystems worldwide. PLoS ONE 2009, 4, e6392. [Google Scholar] [CrossRef] [PubMed]
  35. Chatzimentor, A.; Doxa, A.; Katsanevakis, S.; Mazaris, A.D. Are Mediterranean marine threatened species at high risk by climate change? Glob. Chang. Biol. 2023, 29, 1809–1821. [Google Scholar] [CrossRef]
  36. Vilà, M.; Espinar, J.L.; Hejda, M.; Hulme, P.E.; Jarošík, V.; Maron, J.L.; Pergl, J.; Schaffner, U.; Sun, Y.; Pyšek, P. Ecological impacts of invasive alien plants: A meta-analysis of their effects on species, communities and ecosystems. Ecol. Lett. 2011, 14, 702–708. [Google Scholar] [CrossRef]
  37. Bax, N.; Williamson, A.; Aguero, M.; Gonzalez, E.; Geeves, W. Marine invasive alien species: A threat to global biodiversity. Mar. Policy 2003, 27, 313–323. [Google Scholar] [CrossRef]
  38. Molnar, J.L.; Gamboa, R.L.; Revenga, C.; Spalding, M.D. Assessing the global threat of invasive species to marine biodiversity. Front. Ecol. Environ. 2008, 6, 485–492. [Google Scholar] [CrossRef]
  39. Hulme, P.E.; Pyšek, P.; Nentwig, W.; Vilà, M. Will threat of biological invasions unite the European Union? Science 2009, 324, 40–41. [Google Scholar] [CrossRef] [PubMed]
  40. Pyšek, P.; Richardson, D.M. Invasive species, environmental change and management, and health. Annu. Rev. Environ. Resour. 2010, 35, 25–55. [Google Scholar] [CrossRef]
  41. Kumschick, S.; Gaertner, M.; Vilà, M.; Essl, F.; Jeschke, J.M.; Pyšek, P.; Ricciardi, A.; Bacher, S.; Blackburn, T.M.; Dick, J.T.A. Ecological impacts of alien species: Quantification, scope, caveats, and recommendations. Bioscience 2015, 65, 55–63. [Google Scholar] [CrossRef]
  42. Zenetos, A.; Galanidi, M. Mediterranean non indigenous species at the start of the 2020s: Recent changes. Mar. Biodivers. Rec. 2020, 13, 10. [Google Scholar] [CrossRef]
  43. Zenetos, A.; Albano, P.G.; Garcia, E.L.; Stern, N.; Tsiamis, K.; Galanidi, M. Established non-indigenous species increased by 40% in 11 years in the Mediterranean Sea. Mediterr. Mar. Sci. 2022, 23. [Google Scholar] [CrossRef]
  44. Kondylatos, G.; Theocharis, A.; Mandalakis, M.; Avgoustinaki, M.; Karagyaurova, T.; Koulocheri, Z.; Vardali, S.; Klaoudatos, D. The Devil Firefish Pterois miles (Bennett, 1828): Life History Traits of a Potential Fishing Resource in Rhodes (Eastern Mediterranean). Hydrobiology 2024, 3, 31–50. [Google Scholar] [CrossRef]
  45. Kondylatos, G.; Vagenas, G.; Kalaentzis, K.; Mavrouleas, D.; Conides, A.; Karachle, P.K.; Corsini-Foka, M.; Klaoudatos, D. Exploring the Structure of Static Net Fisheries in a Highly Invaded Region: The Case of Rhodes Island (Eastern Mediterranean). Sustainability 2023, 15, 14976. [Google Scholar] [CrossRef]
  46. Galil, B.; Marchini, A.; Occhipinti-Ambrogi, A.; Ojaveer, H. The enlargement of the Suez Canal—Erythraean introductions and management challenges. Manag. Biol. Invasions 2017, 8, 141–152. [Google Scholar] [CrossRef]
  47. Katsanevakis, S.; Wallentinus, I.; Zenetos, A.; Leppäkoski, E.; Çinar, M.E.; Oztürk, B.; Grabowski, M.; Golani, D.; Cardoso, A.C. Impacts of invasive alien marine species on ecosystem services and biodiversity: A pan-European review. Aquat Invasions 9 2014, 9, 391–423. [Google Scholar] [CrossRef]
  48. Katsanevakis, S.; Tempera, F.; Teixeira, H. Mapping the impact of alien species on marine ecosystems: The Mediterranean Sea case study. Divers. Distrib. 2016, 22, 694–707. [Google Scholar] [CrossRef]
  49. Galil, B.S.; Boero, F.; Campbell, M.L.; Carlton, J.T.; Cook, E.; Fraschetti, S.; Gollasch, S.; Hewitt, C.L.; Jelmert, A.; Macpherson, E. ‘Double trouble’: The expansion of the Suez Canal and marine bioinvasions in the Mediterranean Sea. Biol. Invasions 2015, 17, 973–976. [Google Scholar] [CrossRef]
  50. Whittaker, R.H. Vegetation of the Siskiyou mountains, Oregon and California. Ecol. Monogr. 1960, 30, 279–338. [Google Scholar] [CrossRef]
  51. Levin, L.A.; Etter, R.J.; Rex, M.A.; Gooday, A.J.; Smith, C.R.; Pineda, J.; Stuart, C.T.; Hessler, R.R.; Pawson, D. Environmental influences on regional deep-sea species diversity. Annu. Rev. Ecol. Syst. 2001, 32, 51–93. [Google Scholar] [CrossRef]
  52. Danovaro, R.; Gambi, C.; Dell’Anno, A.; Corinaldesi, C.; Fraschetti, S.; Vanreusel, A.; Vincx, M.; Gooday, A.J. Exponential decline of deep-sea ecosystem functioning linked to benthic biodiversity loss. Curr. Biol. 2008, 18, 1–8. [Google Scholar] [CrossRef] [PubMed]
  53. Gray, J.S. The measurement of marine species diversity, with an application to the benthic fauna of the Norwegian continental shelf. J. Exp. Mar. Bio. Ecol. 2000, 250, 23–49. [Google Scholar] [CrossRef] [PubMed]
  54. Spanou, D.S.; Petroudi, P.; Dimou, E.; Kokkinos, K.; Klaoudatos, D. Walleye (Sander vitreus, Mitchill 1818) age and sex classification using innovative supervised and unsupervised machine learning and soft computing methodologies. Fish. Res. 2024, 275, 107031. [Google Scholar] [CrossRef]
  55. Kriegl, M.; Elías Ilosvay, X.E.; von Dorrien, C.; Oesterwind, D. Marine protected areas: At the crossroads of nature conservation and fisheries management. Front. Mar. Sci. 2021, 8, 676264. [Google Scholar] [CrossRef]
  56. Simard, F. Marine Protected Areas and Climate Change: Adaptation and Mitigation Synergies, Opportunities and Challenges; IUCN: Gland, Switzerland, 2016; ISBN 2831718198. [Google Scholar]
  57. Zhu, J.-J.; Yang, M.; Ren, Z.J. Machine Learning in Environmental Research: Common Pitfalls and Best Practices. Environ. Sci. Technol. 2023, 57, 17671–17689. [Google Scholar] [CrossRef]
  58. Boukabara, S.-A.; Krasnopolsky, V.; Stewart, J.Q.; Maddy, E.S.; Shahroudi, N.; Hoffman, R.N. Leveraging Modern Artificial Intelligence for Remote Sensing and NWP: Benefits and Challenges. Bull. Am. Meteorol. Soc. 2019, 100, ES473–ES491. [Google Scholar] [CrossRef]
  59. Zhao, S.; Zhang, S.; Liu, J.; Wang, H.; Zhu, J.; Li, D.; Zhao, R. Application of machine learning in intelligent fish aquaculture: A review. Aquaculture 2021, 540, 736724. [Google Scholar] [CrossRef]
  60. Bonino, G.; Galimberti, G.; Masina, S.; Mcadam, R.; Clementi, E. Machine learning methods to predict sea surface temperature and marine heatwave occurrence: A case study of the Mediterranean Sea. Ocean Sci. 2024, 20, 417–432. [Google Scholar] [CrossRef]
  61. Bourillon, B.; Feunteun, E.; Acou, A.; Trancart, T.; Teichert, N.; Belpaire, C.; Dufour, S.; Bustamante, P.; Aarestrup, K.; Walker, A. Anthropogenic contaminants shape the fitness of the endangered European eel: A machine learning approach. Fishes 2022, 7, 274. [Google Scholar] [CrossRef]
  62. Davidson, A.D.; Boyer, A.G.; Kim, H.; Pompa-Mansilla, S.; Hamilton, M.J.; Costa, D.P.; Ceballos, G.; Brown, J.H. Drivers and hotspots of extinction risk in marine mammals. Proc. Natl. Acad. Sci. USA 2012, 109, 3395–3400. [Google Scholar] [CrossRef]
  63. Goodfellow, I.; Bengio, Y.; Courville, A. Deep Learning; MIT press: Cambridge, MA, USA, 2016. [Google Scholar]
  64. Froese, R.; Pauly, D. EDITORS FishBase. In World Wide Web Electronic Publication; ScienceOpen: Lexington, MA, USA, 2024. [Google Scholar]
  65. Ahyong, S.; Boyko, C.B.; Bailly, N.; Bernot, J.; Bieler, R.; Brandão, S.N.; Daly, M.; De Grave, S.; Gofas, S.; Hernandez, F.; et al. World Register of Marine Species (WoRMS) 2024. Available online: https://www.marinespecies.org/ (accessed on 20 May 2024).
  66. The IUCN Red List of Threatened Species. Available online: https://www.iucnredlist.org/ (accessed on 4 July 2024).
  67. Şahin, M.; Aybek, E. Jamovi: An Easy to Use Statistical Software for the Social Scientists. Int. J. Assess. Tools Educ. 2019, 6, 670–692. [Google Scholar] [CrossRef]
  68. Hampton, R.E.; Havel, J.E. Introductory Biological Statistics; Waveland Press: Long Grove, IL, USA, 2006; ISBN 1577663802. [Google Scholar]
  69. Sall, J.; Stephens, M.L.; Lehman, A.; Loring, S. JMP Start Statistics: A Guide to Statistics and Data Analysis Using JMP; Sas Institute: Cary, NC, USA, 2017; ISBN 1629608785. [Google Scholar]
  70. Demsar, J.; Curk, T.; Erjavec, A.; Gorup, C.; Hocevar, T.; Milutinovic, M.; Mozina, M.; Polajnar, M.; Toplak, M.; Staric, A.; et al. Orange: Data Mining Toolbox in Python. J. Mach. Learn. Res. 2013, 14, 2349–2353. [Google Scholar]
  71. Jakkula, V. Tutorial on support vector machine (svm). Sch. EECS Washingt. State Univ. 2006, 37, 3. [Google Scholar]
  72. Trafalis, T. Primal-dual optimization methods in neural networks and support vector machines training. ACAI99 1999, 5, 459–478. [Google Scholar]
  73. Friedman, J.H. Greedy function approximation: A gradient boosting machine. Ann. Stat. 2001, 29, 1189–1232. [Google Scholar] [CrossRef]
  74. Natekin, A.; Knoll, A. Gradient boosting machines, a tutorial. Front. Neurorobot. 2013, 7, 21. [Google Scholar] [CrossRef]
  75. Nielsen, M.A. Neural Networks and Deep Learning; Determination Press: San Francisco, CA, USA, 2015; Volume 25. [Google Scholar]
  76. Zhang, H. The optimality of naive Bayes. AAAI 2004, 1, 562–567. [Google Scholar]
  77. Murphy, K.P. Machine Learning: A Probabilistic Perspective; MIT press: Cambridge, MA, USA, 2012; ISBN 0262304325. [Google Scholar]
  78. Schapire, R.E. A brief introduction to boosting. In Proceedings of the International Joint Conference on Artificial Intelligence, Stockholm, Sweden, 31 July–6 August 1999; Volume 99, pp. 1401–1406. [Google Scholar]
  79. Freund, Y.; Schapire, R.E. Experiments with a new boosting algorithm. In Proceedings of the International Conference on Machine Learning, Bari, Italy, 3–6 July 1996; Volume 96, pp. 148–156. [Google Scholar]
  80. Quinlan, J.R. Induction of decision trees. Mach. Learn. 1986, 1, 81–106. [Google Scholar] [CrossRef]
  81. Safavian, S.R.; Landgrebe, D. A survey of decision tree classifier methodology. IEEE Trans. Syst. Man. Cybern. 1991, 21, 660–674. [Google Scholar] [CrossRef]
  82. Song, Y.-Y.; Ying, L.U. Decision tree methods: Applications for classification and prediction. Shanghai Arch. Psychiatry 2015, 27, 130. [Google Scholar] [PubMed]
  83. Dulvy, N.K.; Simpfendorfer, C.A.; Davidson, L.N.K.; Fordham, S.V.; Bräutigam, A.; Sant, G.; Welch, D.J. Challenges and priorities in shark and ray conservation. Curr. Biol. 2017, 27, R565–R572. [Google Scholar] [CrossRef] [PubMed]
  84. Paquotte, P.; Lem, A. Seafood Markets and Trade: A Global Perspective and an Overview of EU Mediterranean Countries; CIHEAM Montpellier: Montpellier, France, 2008. [Google Scholar]
  85. Claro, R. Características generales de la ictiofauna. Ecol. Los Peces Mar. Cuba 1994, 55–71. [Google Scholar]
  86. Knijn, R.J.; Boon, T.W.; Heessen, H.J.L.; Hislop, J.R.G. Atlas of North Sea fishes-Based on bottom-trawl survey data for the years 1985–1987. In ICES Cooperative Research Reports; Monday Morning Books: Ashland, OH, USA, 1993; ISBN 8774825321. [Google Scholar]
  87. Williams, J.T.; Bogorodsky, S.V. Entomacrodus solus, a new species of blenny (Perciformes, Blenniidae) from the Red Sea. Zootaxa 2010, 2475, 64–68. [Google Scholar] [CrossRef]
  88. Powles, H. Assessing Risk of Extinction of Marine Fishes in Canada—The COSEWIC Experience. Fisheries 2011, 36, 231–246. [Google Scholar] [CrossRef]
  89. Reynolds, J.D.; Dulvy, N.K.; Goodwin, N.B.; Hutchings, J.A. Biology of extinction risk in marine fishes. Proc. R. Soc. B Biol. Sci. 2005, 272, 2337–2344. [Google Scholar] [CrossRef]
  90. Hutchings, J.A.; Myers, R.A.; García, V.B.; Lucifora, L.O.; Kuparinen, A. Life-history correlates of extinction risk and recovery potential. Ecol. Appl. 2012, 22, 1061–1067. [Google Scholar] [CrossRef]
  91. Powles, H. Assessing and protecting endangered marine species. ICES J. Mar. Sci. 2000, 57, 669–676. [Google Scholar] [CrossRef]
  92. Kvamsdal, S.; Hopland, A.O.; Li, Y.; Selle, S. Expert opinions on threats and impacts in the marine environment. Mar. Policy 2023, 147, 105382. [Google Scholar] [CrossRef]
  93. Gray, J.S. Marine biodiversity: Patterns, threats and conservation needs. Biodivers. Conserv. 1997, 6, 153–175. [Google Scholar] [CrossRef]
  94. Mazaris, A.D.; Kallimanis, A.; Gissi, E.; Pipitone, C.; Danovaro, R.; Claudet, J.; Rilov, G.; Badalamenti, F.; Stelzenmüller, V.; Thiault, L. Threats to marine biodiversity in European protected areas. Sci. Total Environ. 2019, 677, 418–426. [Google Scholar] [CrossRef]
  95. Forster, J.; Lake, I.R.; Watkinson, A.R.; Gill, J.A. Marine biodiversity in the Caribbean UK overseas territories: Perceived threats and constraints to environmental management. Mar. Policy 2011, 35, 647–657. [Google Scholar] [CrossRef]
  96. Luiz, O.J.; Woods, R.M.; Madin, E.M.P.; Madin, J.S. Predicting IUCN Extinction Risk Categories for the World’s Data Deficient Groupers (Teleostei: Epinephelidae). Conserv. Lett. 2016, 9, 342–350. [Google Scholar] [CrossRef]
  97. Smith, K.G.; Darwall, W.R.T. The Status and Distribution of Freshwater Fish Endemic to the Mediterranean Basin; World Conservation Union (IUCN): Gland, Switzerland, 2006; ISBN 9782831709161. [Google Scholar]
  98. Freyhof, J.; Chebanov, M.; Pourkazemi, M. Acipenser nudiventris. In IUCN Red List Threatened Species 2022 (Errata Version Publish 2023); IUCN: Gland, Switzerland, 2022. [Google Scholar]
  99. Bronzi, P.; Congiu, L.; Freyhof, J. Acipenser naccarii. In IUCN Red List Threatened Species 2022; IUCN: Gland, Switzerland, 2022. [Google Scholar]
  100. Mugue, N.; Friedrich, T.; Chebanov, M.; Ruban, G. Acipenser stellatus. In IUCN Red List Threatened Species 2022; IUCN: Gland, Switzerland, 2022. [Google Scholar]
  101. Gessner, J.; Williot, P.; Rochard, E.; Freyhof, J.; Kottelat, M. Acipenser sturio. In IUCN Red List Threatened Species 2022 (Errata Version Publish 2023); IUCN: Gland, Switzerland, 2022. [Google Scholar]
  102. Gessner, J.; Freyhof, J.; Kottelat, M. Acipenser gueldenstaedtii. In IUCN Red List Threatened Species 2022; IUCN: Gland, Switzerland, 2022. [Google Scholar]
  103. Food and Agriculture Organization. The State of World Fisheries and Aquaculture 2022. In Towards Blue Transformation; Food and Agriculture Organization: Rome, Italy, 2022. [Google Scholar]
  104. Hall, M.A.; Alverson, D.L.; Metuzals, K.I. By-catch: Problems and solutions. Mar. Pollut. Bull. 2000, 41, 204–219. [Google Scholar] [CrossRef]
  105. Kelleher, K. Discards in the World’s Marine Fisheries: An Update; Food and Agriculture Organization: Rome, Italy, 2005; Volume 470, ISBN 9251052891. [Google Scholar]
  106. Bellido, J.M.; Santos, M.B.; Pennino, M.G.; Valeiras, X.; Pierce, G.J. Fishery discards and bycatch: Solutions for an ecosystem approach to fisheries management? Hydrobiologia 2011, 670, 317–333. [Google Scholar] [CrossRef]
  107. Squires, D.; Garcia, S. The least-cost biodiversity impact mitigation hierarchy with a focus on marine fisheries and bycatch issues. Conserv. Biol. 2018, 32, 989–997. [Google Scholar] [CrossRef] [PubMed]
  108. IUCN. IUCN Red List Categories and Criteria: Version 3.1; IUCN: Gland, Switzerland, 2001; ISBN 2831706335. [Google Scholar]
  109. Otero, J.; Hidalgo, M. Life-history traits and environment shape small pelagic fish demography and responses to fishing and climate across European Atlantic seas. ICES J. Mar. Sci. 2023, 80, 1447–1461. [Google Scholar] [CrossRef]
  110. Gladju, J.; Kamalam, B.S.; Kanagaraj, A. Applications of data mining and machine learning framework in aquaculture and fisheries: A review. Smart Agric. Technol. 2022, 2, 100061. [Google Scholar] [CrossRef]
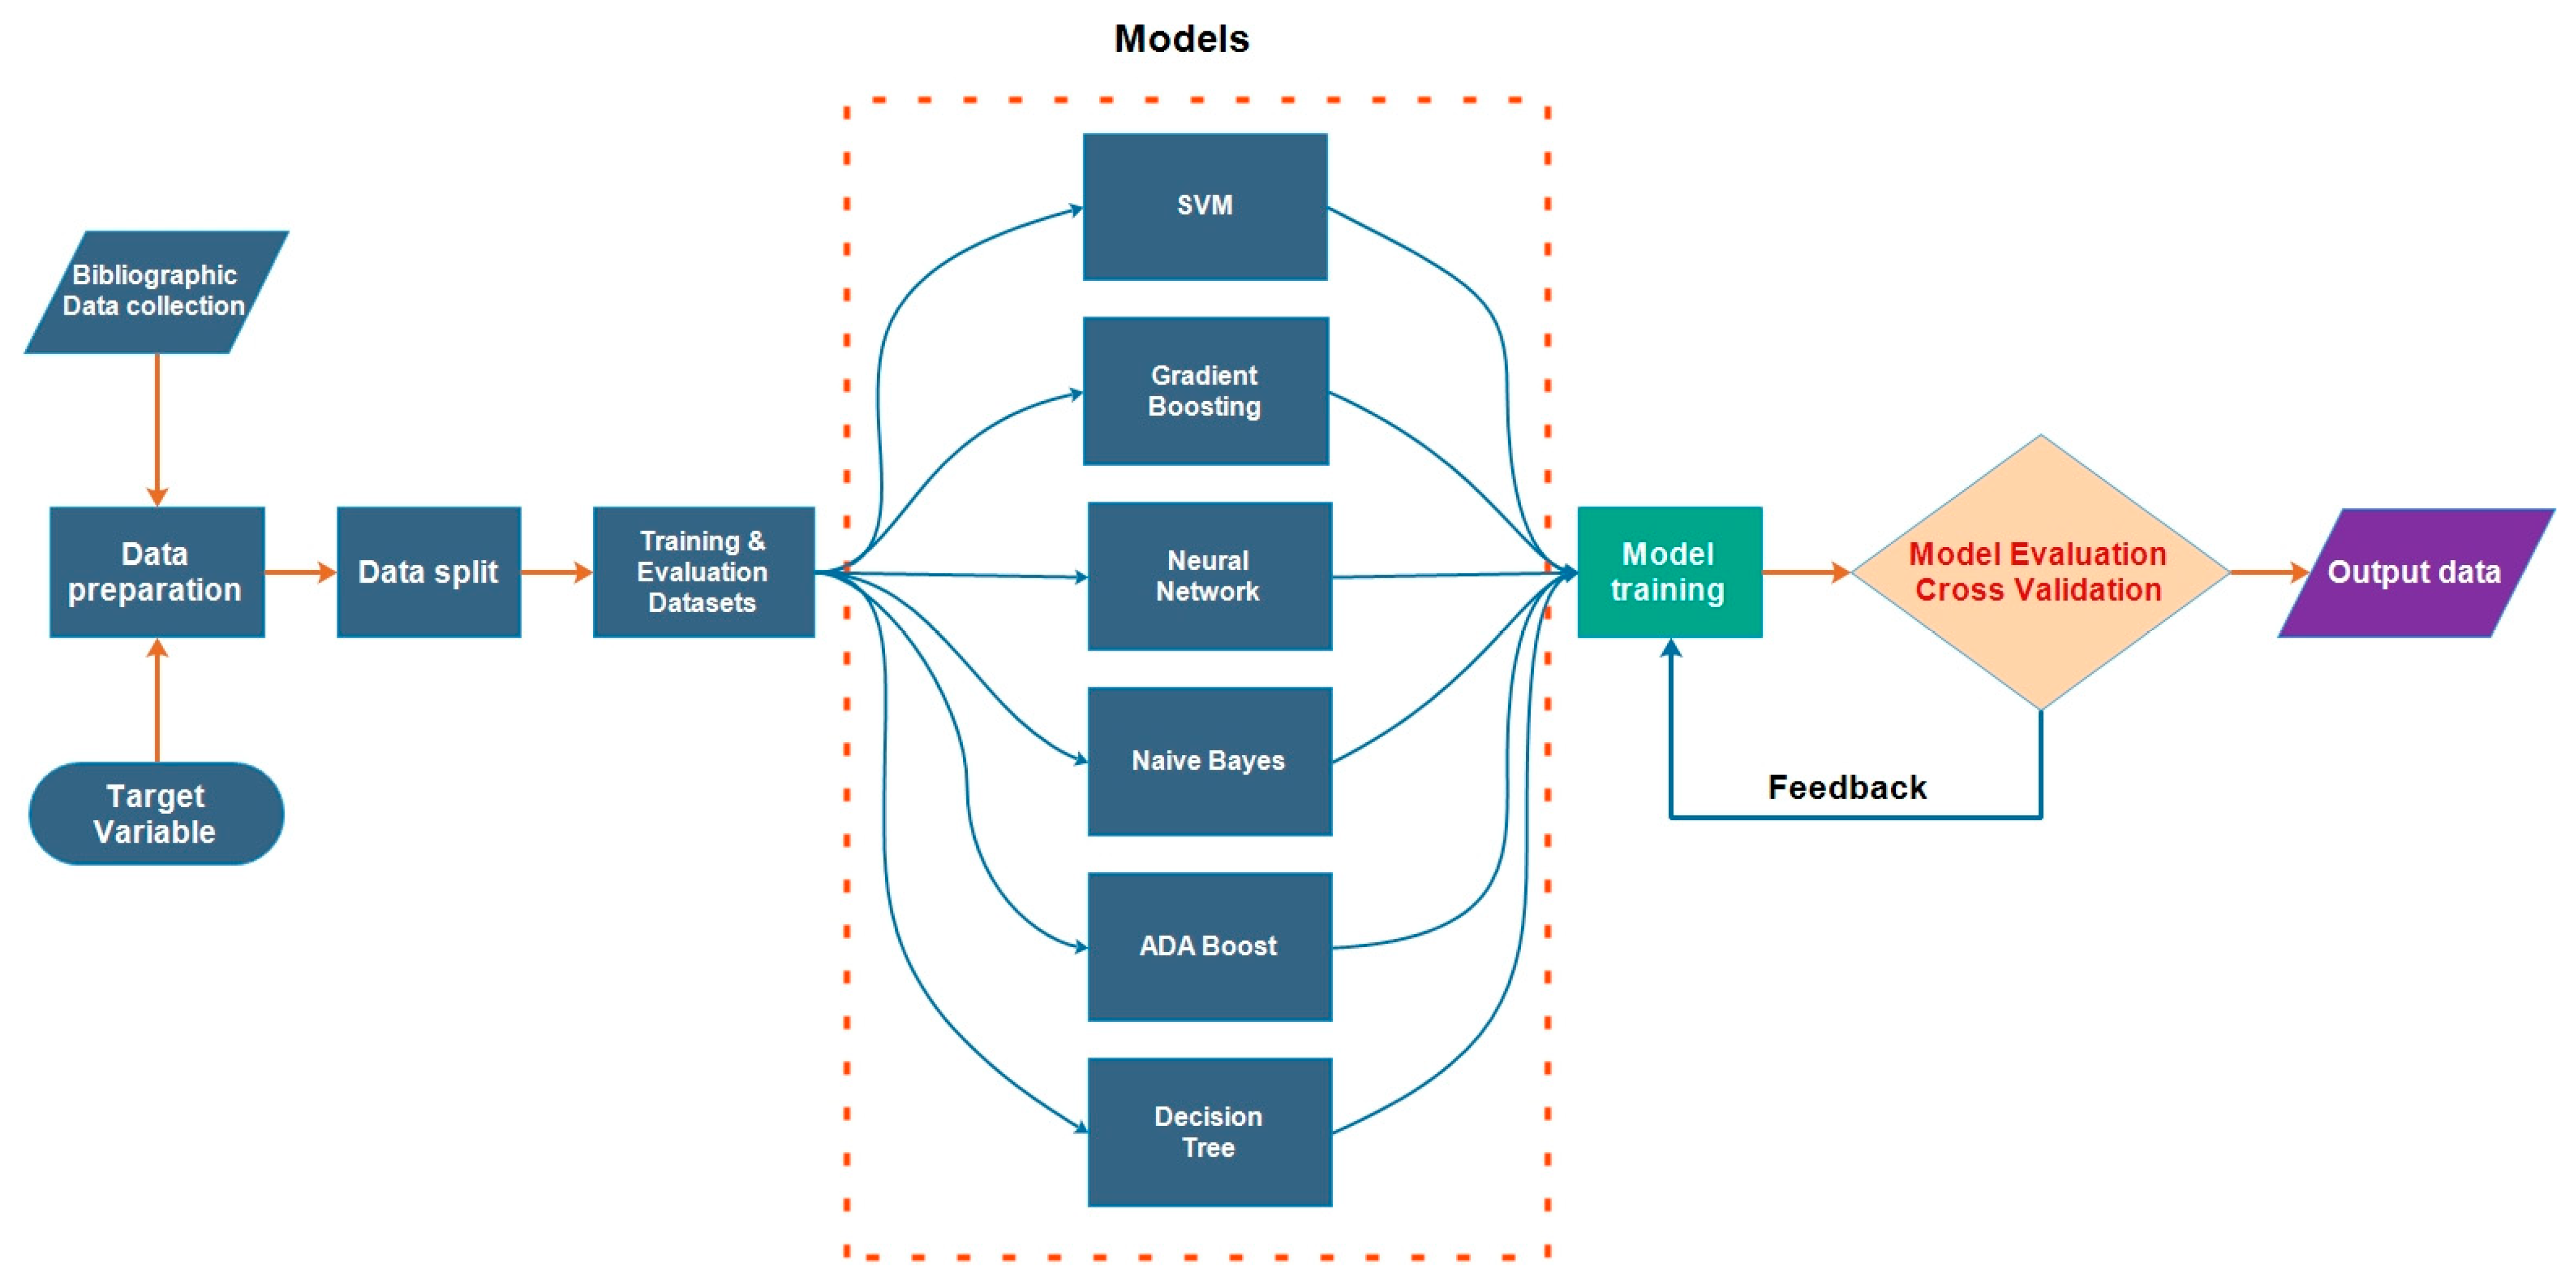
Figure 1. Workflow of the process used for predictive analysis supervised ML algorithms (shapes: rectangles are data processing steps, ovals are start points, diamonds are decisions, parallelograms are input and output; colors: blue for data-related processes, green for model training and development, orange for evaluation and testing, purple for deployment and monitoring).
Environments 11 00151 g001
Figure 2. Comparative boxplots of potential influential numerical factors on marine fish species vulnerability in the Mediterranean Sea. (A) Age at maturity (years), (B) longevity, (C) asymptotic length, and (D) maximum depth limit. Values are means (black squares), medians (horizontal box lines in boxes), standard deviation (interquartile range box), minimal and maximal value (whiskers), and black dots (outliers), (ns: non-significant, **: p < 0.01, ***: p < 0.001).
Environments 11 00151 g002
Figure 3. Nominal logistic curves (red lines) and threshold values (values above which there is an increasingly higher probability that species are listed as endangered, indicated by blue dotted lines) of the effect of age at maturity, longevity, and asymptotic length to Mediterranean marine species vulnerability (each point represents a species, 1 endangered, 0 not endangered).
Environments 11 00151 g003
Figure 4. Performance metrics used to compare model performance (area under receiver-operating curve (AUC), classification accuracy (CA), weighted harmonic mean of precision and recall (F1), the proportion of true positives among instances classified as positive (Prec), the proportion of true positives (Recall), Matthews correlation coefficient (MCC), and mean metric value), acquired from stratified five-fold cross-validation for the prediction of Mediterranean marine fish species vulnerability.
Environments 11 00151 g004
Figure 5. Importance of each factor’s contribution, based on the AUC score of the best-performing model (SVM).
Environments 11 00151 g005
Figure 6. Visualization of the Decision Tree model that splits the data into nodes by class purity (information gain or Kullback–Leibler divergence) (green not endangered, red endangered).
Environments 11 00151 g006
Table 1. Factors collected in the database that according to the IUCN scientific literature have a significant impact on the threat status of Mediterranean fish species.
FactorUnitsClassification
LongevityyearsNumerical factor
Asymptotic lengthcmNumerical factor
Maximum recorded depthmNumerical factor
Age at maturityyearsNumerical factor
Area of rangekm2Numerical factor
Overfishing0 = not vulnerable 1 = vulnerableCategorical factor
By-catch0 = not vulnerable 1 = vulnerableCategorical factor
Pollution0 = not vulnerable 1 = vulnerableCategorical factor
Table 2. Descriptive statistics of the effect of different factors on threat status (N: number of species).
Threat CategoryNMeanSEMedianSDMin.Max.
Age at Maturity (years)Endangered325.183.03.973.901.013.0
Not Endangered1232.722.31.971.970.414.5
Longevity (years)Endangered3225.3220.020.3120.312.7100.0
Not Endangered12312.8511.08.598.591.050.0
Max depth (m)Endangered32424.41200.0563.32563.323.02600
Not Endangered123452.12300.0643.48643.482.04700
Asymptotic length (cm)Endangered32142.83127.5124.4124.804.3500
Not Endangered12360.6942.060.7460.744.7450
Table 3. Nominal logistic fit least squares report for the threat category of the model effects, sorted by ascending p-values (the logworth for each model effect is defined as −log10 (p-value)); the blue line indicates significance at the 0.01 level.
SourceLogworth p-Value
Overfishing7.721Environments 11 00151 i0010.00000
Pollution4.416Environments 11 00151 i0020.00004
By-catch3.697Environments 11 00151 i0030.00020
Age at Maturity1.633Environments 11 00151 i0040.02328
Disclaimer/Publisher’s Note: The statements, opinions and data contained in all publications are solely those of the individual author(s) and contributor(s) and not of MDPI and/or the editor(s). MDPI and/or the editor(s) disclaim responsibility for any injury to people or property resulting from any ideas, methods, instructions or products referred to in the content.