Article

The Potential Impact of Long-Term Copper Fungicide Sprays on Soil Health in Avocado Orchards

by
Dumsane Themba Matse
1,2,
Thangavelautham Geretharan
3,
Eileen F. van Gorp
4,
Sean Anderson
5,
Paramsothy Jeyakumar
1,* and
Christopher W. N. Anderson
1
1
Environmental Sciences Group, School of Agriculture and Environment, Massey University, Private Bag 11 222, Palmerston North 4442, New Zealand
2
Teagasc, Environmental Research Centre, Johnstown Castle, Y35HK54 Wexford, Ireland
3
Department of Crop Science, Faculty of Agriculture, Eastern University, Chenkalady 30350, Sri Lanka
4
Environmental Science Department, Wageningen University & Research, Droevendaalsesteeg 4, 6708 PB Wageningen, The Netherlands
5
Myriad Genetics, 322 N 2200 W, Salt Lake City, UT 84116, USA
*
Author to whom correspondence should be addressed.
Environments 2024, 11(6), 109; https://doi.org/10.3390/environments11060109
Submission received: 25 April 2024 / Revised: 20 May 2024 / Accepted: 22 May 2024 / Published: 25 May 2024
(This article belongs to the Special Issue New Insights in Soil Quality and Management)

Abstract

:
The long-term use of copper (Cu)-based fungicide sprays in orchards is associated with changes in soil Cu levels. However, there is a gap in knowledge regarding the potential accumulation of Cu in orchards and the associated impacts on the soil microbial structure. This study assessed the possibility of Cu accumulation in different avocado orchard farms and further evaluated the potential effect on soil microbial activities. Soil Cu levels were quantified in Tauranga and Northland, and three avocado orchards were analysed in each experimental location. All avocado farms in both sites received Cu-based fungicide sprays for over eight years. Soil samples were collected at a 0–20 cm depth from all six orchards. The soil total and bioavailable Cu, changes in soil chemical properties, microbial biomass, dehydrogenase activity, alkaline phosphatase activity, and acid phosphatase activity were measured. The results revealed that the total Cu and bioavailable Cu concentrations in Tauranga orchards were 81.3 and 0.32, 196.7 and 0.82, and 33.6 and 0.31 mg Cu kg−1 in Farms 1, 2, and 3, respectively. In Northland orchards, the total Cu and bioavailable Cu were 54.5 and 0.06, 18.4 and 0.77, and 46 and 0.34 mg Cu kg−1 in Farm 1, 2, and 3, respectively. Five out of six of the avocado orchard farms assessed in this study had total Cu concentrations greater than 30 mg Cu kg−1 reported in New Zealand native land. The magnitude of Cu accumulation was linked with soil pH and C content. No clear trend was observed between soil Cu concentrations and the soil microbial activity. Our study results demonstrated that the long-term use of Cu-based fungicide sprays can elevate Cu concentrations in orchard soils. Mitigation strategies need to be explored to abate the accumulation of Cu in orchard soils.

1. Introduction

Avocado production plays a significant contribution to global economic development [1,2]. Globally, avocados are projected to become the second-most traded major tropical fruit by 2030 after bananas [3]. New Zealand highly relies on avocados for export marketing and is ranked as the third largest fresh fruit export next to kiwifruit and apples. The high-value horticultural crop occupies 4000 hectares in New Zealand. The main challenge facing the avocado industry is the persistent infestation by fungal diseases. To control the wide spread of these diseases, farmers rely on the use of copper (Cu) fungicide sprays. However, the repeated use of these Cu fungicide sprays is associated with Cu enrichment in orchard topsoil [4,5,6].
The Cu accumulates in soils due to Cu’s low mobility [7]. Evidence in the literature has shown that the wide use of Cu fungicide sprays in orchards is linked with Cu accumulation in soils. For examples, Holland and Solomona [8] measured total Cu in soils across 19 orchards in New Zealand from different districts, where the total Cu in soil ranged from 80 to 120 mg Cu kg−1. In 2008, the New Zealand Avocado Industry Council studied the total soil Cu measurement of 150 avocado orchards across all major avocado-growing regions in New Zealand. This study showed total soil Cu levels ranged between 4 and 541 mg Cu kg−1, with a mean of 100 mg Cu kg−1. Morgan and Johnston [5] compared the soil Cu content between an orchard receiving Cu fungicide sprays for sixteen years and pasture soil in Otago, New Zealand, and found that the mean total Cu content of the orchard soil was increased three-fold relative to pasture soil. Fernández-Calviño et al. [9] analysed soils from 170 vineyards in Spain, and they reported that 64% of the samples had a total Cu concentration higher than 100 mg total Cu kg−1. Morgan and Taylor [10] reported that long-term Cu sprays in vineyards resulted in Cu accumulations of up to 304 mg kg−1 over a period of 40 years in New Zealand. Although most EU countries have put in place restrictions and sustainable practices on the use of Cu sprays in orchards [11], Cu-based fungicide sprays are still massively used in orchard management globally. Therefore, there is a high need to monitor Cu accumulation in orchards to implement necessary measures.
An increased Cu content in soils is associated with a series of environmental problems. For example, high Cu levels in soil can pose a threat to soil enzymes and microbial functioning [12]. Poor soil microbial activity has several negative impacts on soil nutrient cycling and the decomposition of organic matter, thus, influencing soil productivity [13]. Furthermore, during rainy seasons, Cu from soil and plant litter can be washed off, possibly depositing these particles on surface water bodies [14]. Elevated Cu concentrations in water sources can increase the chances of Cu entering the food chain. Even though several studies have highlighted the high possibilities of Cu accumulation from using Cu fungicide sprays, limited studies have further analysed the impact of elevated Cu levels on soil health, which is a significant gap in knowledge.
The mobility and bioavailability of Cu is dependent on several soil properties [15]. For example, soils high in mulch, organic matter, and clay promote the complexation and adsorption of Cu, thus, reducing the bioavailable Cu either through the soil solution or uptake into the plant [16,17]. Furthermore, the presence of Fe and Al oxide complexes and precipitates with Cu in the soil solution, thus, reducing bioavailable Cu [18]. Most of the Cu accumulates in the topsoil layers. However, with microbial action, complexed Cu eventually becomes available through the microbial decomposition of organic complexes [19]. Hence, it is imperative to assess the concentration of Cu in orchards because accumulation can have a significant effect in the long term.
To provide direct evidence of whether there can be any potential accumulation of Cu in some of New Zealand’s avocado orchard soils where Cu sprays have been used for longer periods, the current study was conducted to examine the accumulation of Cu in avocado orchards. Furthermore, this study aimed to explore the effect of Cu accumulation on soil microbial biomass and enzyme activity. This study further determined the relationship between different soil chemical properties that could influence the accumulation of Cu in the sampled avocado orchard soils. Information derived from this study increases the knowledge about the effects of the use of Cu-based fungicide sprays and highlights their potential threats to soil health.

2. Materials and Methods

2.1. The Avocado Orchard Farms’ Locations

This field experiment was conducted in avocado orchard farms at two experimental sites, namely, Tauranga and Northland. These two experimental sites were chosen because they are the dominant avocado-producing areas in the North Island of New Zealand. Three avocado orchards were sampled in each experimental area, totalling six avocado orchard farms. The orchards’ location coordinates could not be provided due to growers’ privacy. The average annual rainfall for the Tauranga and Northland areas were 1369 mm and 1596 mm, respectively, with average annual and daily temperatures of 14.4 °C and 15.5 °C, respectively [20]. The Tauranga orchards were mainly dominated by yellow–brown loams, known as Pumice soil, whereas the Northland orchards had mainly clay loam soil. All avocado farms in both sites received Cu-based fungicide sprays for over eight years.

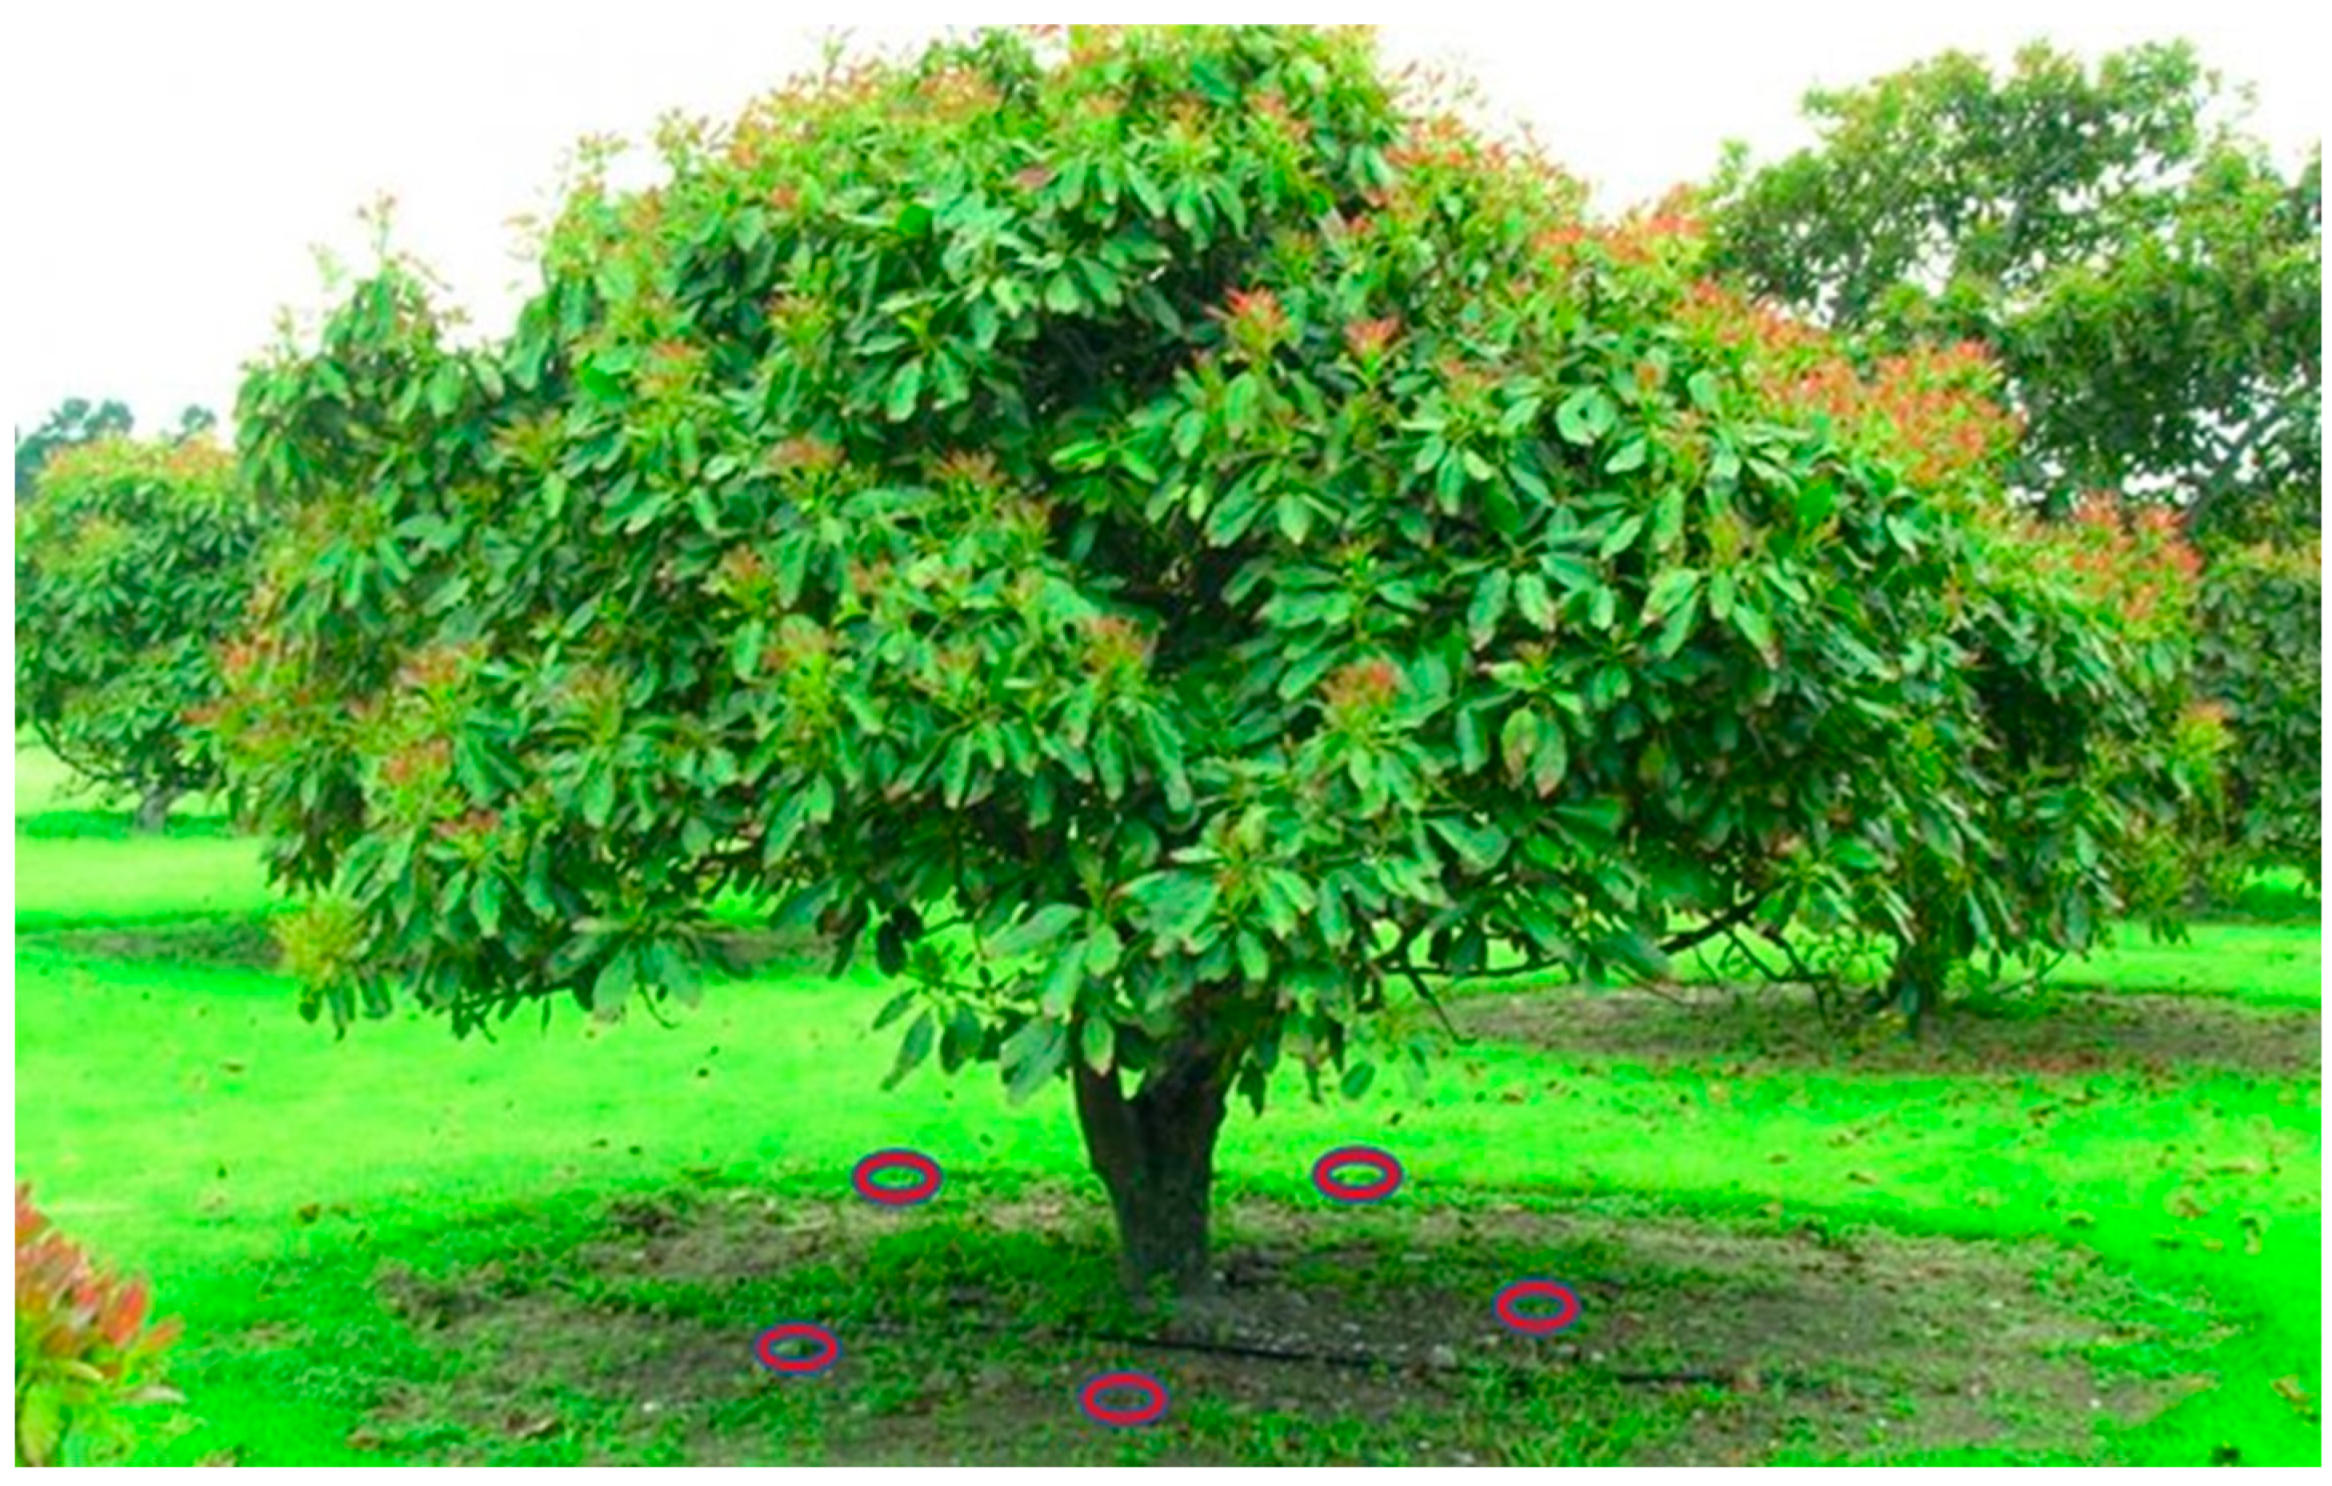
2.2. Experiment Design and Sampling

Ten avocado trees were randomly selected in each orchard. In each tree, five (5) soil cores were randomly collected to a depth of 20 cm using a soil auger (50 mm diameter) around each tree, as illustrated in Figure 1. The soil cores from each tree were bulked together to form a composite sample. However, for the microbial activity measurement, only one soil core was taken per tree, and ten trees were sampled per orchard. Soil samples for microbial activity were kept in an ice box after sampling, transported to the laboratory, and stored at −20 °C. All other soil samples were taken to the laboratory for air drying for the physico-chemical analysis.

2.3. Sample Analysis

The collected samples were air-dried at ambient temperature and sieved through a 2 mm sieve for the analysis of chemical properties. The soil pH was measured in a soil–water mixture of 1:2.5 (w/v) using a pH meter (Fisherbrand™ accumet™ 910, Fisher Scientific Ltd., Pittsburgh, PA, USA). The aluminium (Al) and iron (Fe) in the soil were extracted using the acid ammonium oxalate solution, as outlined by Blakemore [21], and the concentration was analysed using Microwave plasma atomic emission spectrometry [(MP-AES) (4200 MP-AES, Agilent, Santa Clara, CA, USA)]. The soil cation exchange capacity (CEC) was determined using the semi-micro leaching method, as outlined by Blakemore [21], and cation contents of sodium (Na), magnesium (Mg), potassium (K), and calcium (Ca) were analysed using MP-AES (4200 MP-AES, Agilent, Santa Clara, CA, USA). The total soil nitrogen (N) and carbon (C) content was measured using a Vario MACRO cube CHNS elemental analyser (Elementa Anlysensysteme Gmbh, Hanau, Germany), as outlined by Matse et al. [22].
The soil’s bioavailable Cu was extracted following a procedure by Sparks [23] by mixing 5 g sub-sample of air-dried soil and 30 mL of 0.05 M CaCl2, shaking for 2 h, and centrifuging at 10× g for 10 min. The supernatant was filtered through filter 42 Whatman filter paper and was analysed using graphite furnace atomic absorption spectrophotometry (PinAAcle 900Z, PerkinElmer, Waltham, MA, USA). The soils were analysed for total Cu from 1 g sub-sample with 10 mL 70% HNO3 and were digested for 2 h at 120 °C. The solution was then diluted to 25 mL using 2% HNO3 [24]. The Cu concentration in the samples was quantified using graphite furnace atomic absorption spectrophotometry (PinAAcle 900Z, PerkinElmer, Waltham, MA, USA).

2.4. Quality Control

All analyses were conducted using approved laboratory procedures, and all reagents used were of analytical grades. In this study, we used two certified standard reference materials for quality monitoring purposes: the National Institute of Standards and Technology SRM 2710a, Montana soil (3420 ± 0.005 mg Cu kg−1), and SRM 1573a, tomato leaves (4.70 ± 0.14 mg Cu kg−1). The mean Cu concentration in the Montana soil and tomato leaves was within 95.1–101.0% and 94.6–98.3% of the expected concentration, respectively.

2.5. The Soil Microbial Biomass and Enzyme Activity Analysis

The soil microbial biomass carbon (MBC) was analysed using the fumigation–extraction method described by Xu et al. [25]. The dehydrogenase activity (DH), acid phosphatase (ACP), and alkaline phosphatase activity (Alk.CP) were determined using the method outlined by Guan et al. [26].

2.6. Statistical Analysis

All collected data in this present study were analysed using Minitab (Version 19. Minitab Inc., State College, PA, USA). A comparison between treatments was analysed using ANOVA, and significant differences (p < 0.05) between means were performed using Tukey’s post hoc test. Correlation was performed to establish the relationship between soil properties and Cu concentrations in soils.

3. Results

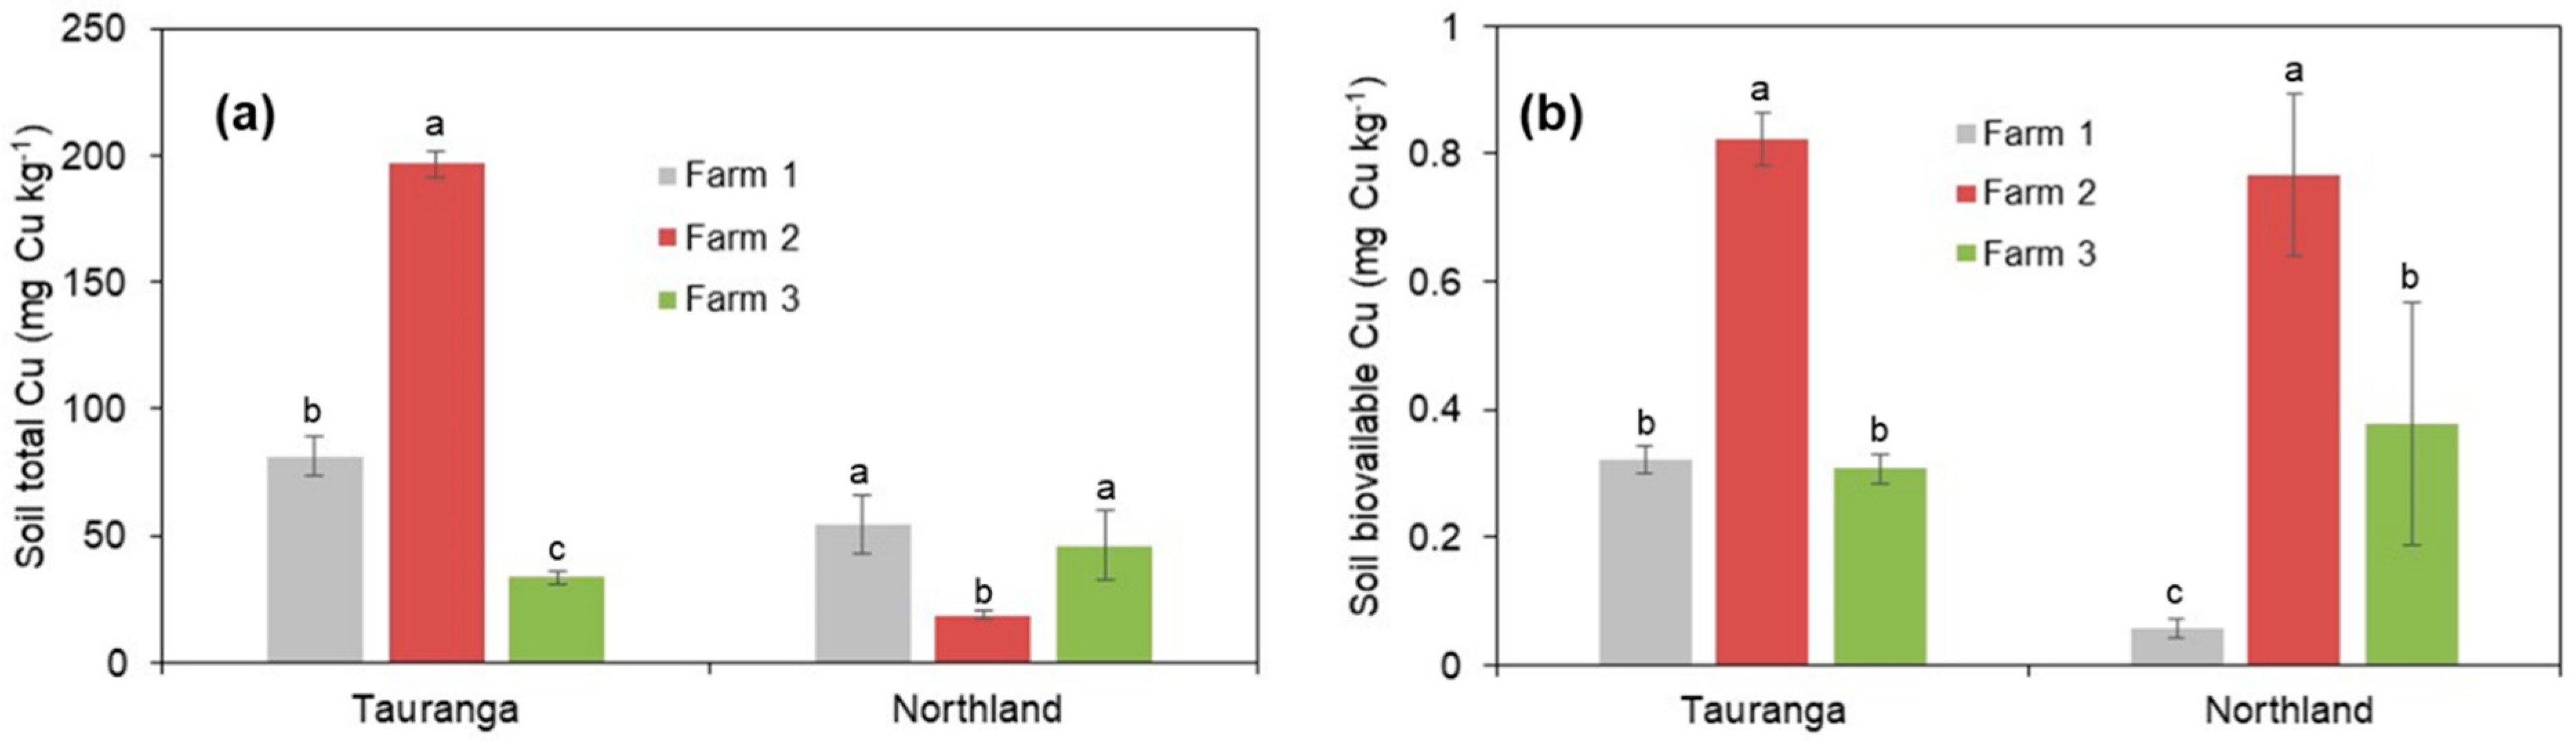
3.1. Copper Accumulation in Soil

The results presented in Figure 2a show that there were significant differences in soil total Cu concentration in the different orchards in both areas. For the Tauranga site, Farm 2 showed a significantly higher total Cu, followed by Farms 1 and Farm 3. Specifically, the total Cu concentration in Farm 2 was greater by 59% and 83% relative to Farms 1 and 2, respectively (Figure 2a). From the Northland orchards, both Farms 1 and 3 showed significantly higher total Cu concentrations relative to Farm 2 by an average of 63% (Figure 2b).
In terms of soil bioavailable Cu, in the Tauranga site, Farm 2 showed significantly (p < 0.05) higher bioavailable Cu by values of 156% and 168% compared to Farms 1 and 3, respectively, but there was no significant difference between Farms 1 and 3 (Figure 2b). In Northland, Farm 2 showed significantly higher bioavailable Cu relative to both Farms 1 (by 93%) and 3 (by 51%). Farm 1 showed significantly lower bioavailable Cu relative to both Farms 2 and 3 (Figure 2b).

3.2. Soil Chemical Properties

3.2.1. Changes in Soil Chemical Properties

The different soil chemical properties in each orchard in Tauranga and Northland are described in Table 1. In the Tauranga site, the soil pH in the three farms ranged from 5.72 to 6.10 (Table 1). Farms 1 and 2 had almost similar Fe, Al, C, and N contents. In contrast, Farm 3 soils had significantly lower contents of Fe, Al, C, and N compared to both Farms 1 and 2 (Table 1). From the Northland farms, the soil pH across the farms ranged from 5.39 to 6.63. The contents of Fe, Al, C, and N greatly varied among the three farms (Table 1). Farm 3 had lower C, N, and Al contents in both locations compared to the other farms.

3.2.2. Influence on Soil Cations

Table 2 shows that there were significant differences between the farms within each experimental site. In Tauranga, no significant difference was observed between Farms 1 and 2 in the contents of K, Ca, and Mg. However, Farm 3 showed significantly lower K, Ca, and Mg contents by an average of 112%, 174%, and 189%, respectively, relative to Farms 1 and 2. Furthermore, the mean CEC for Farms 1 and 2 was 41.0 and 47.8 cmol kg−1, respectively, compared to 19.9 cmol kg−1 for Farm 3 (Table 2). For the Northland site, both Farms 1 and 2 showed no significant difference in K content between each other, but a significantly higher content of K by an average factor of 395% relative to Farm 3 (Table 2). In reference to Ca, Mg, and Na, levels varied among the three farms with no clear trend. Overall, the CEC was higher in Farm 3 (25.2 cmol kg−1), followed by Farm 1 (23.6 cmol kg−1) and Farm 2 (17.0 cmol kg−11).

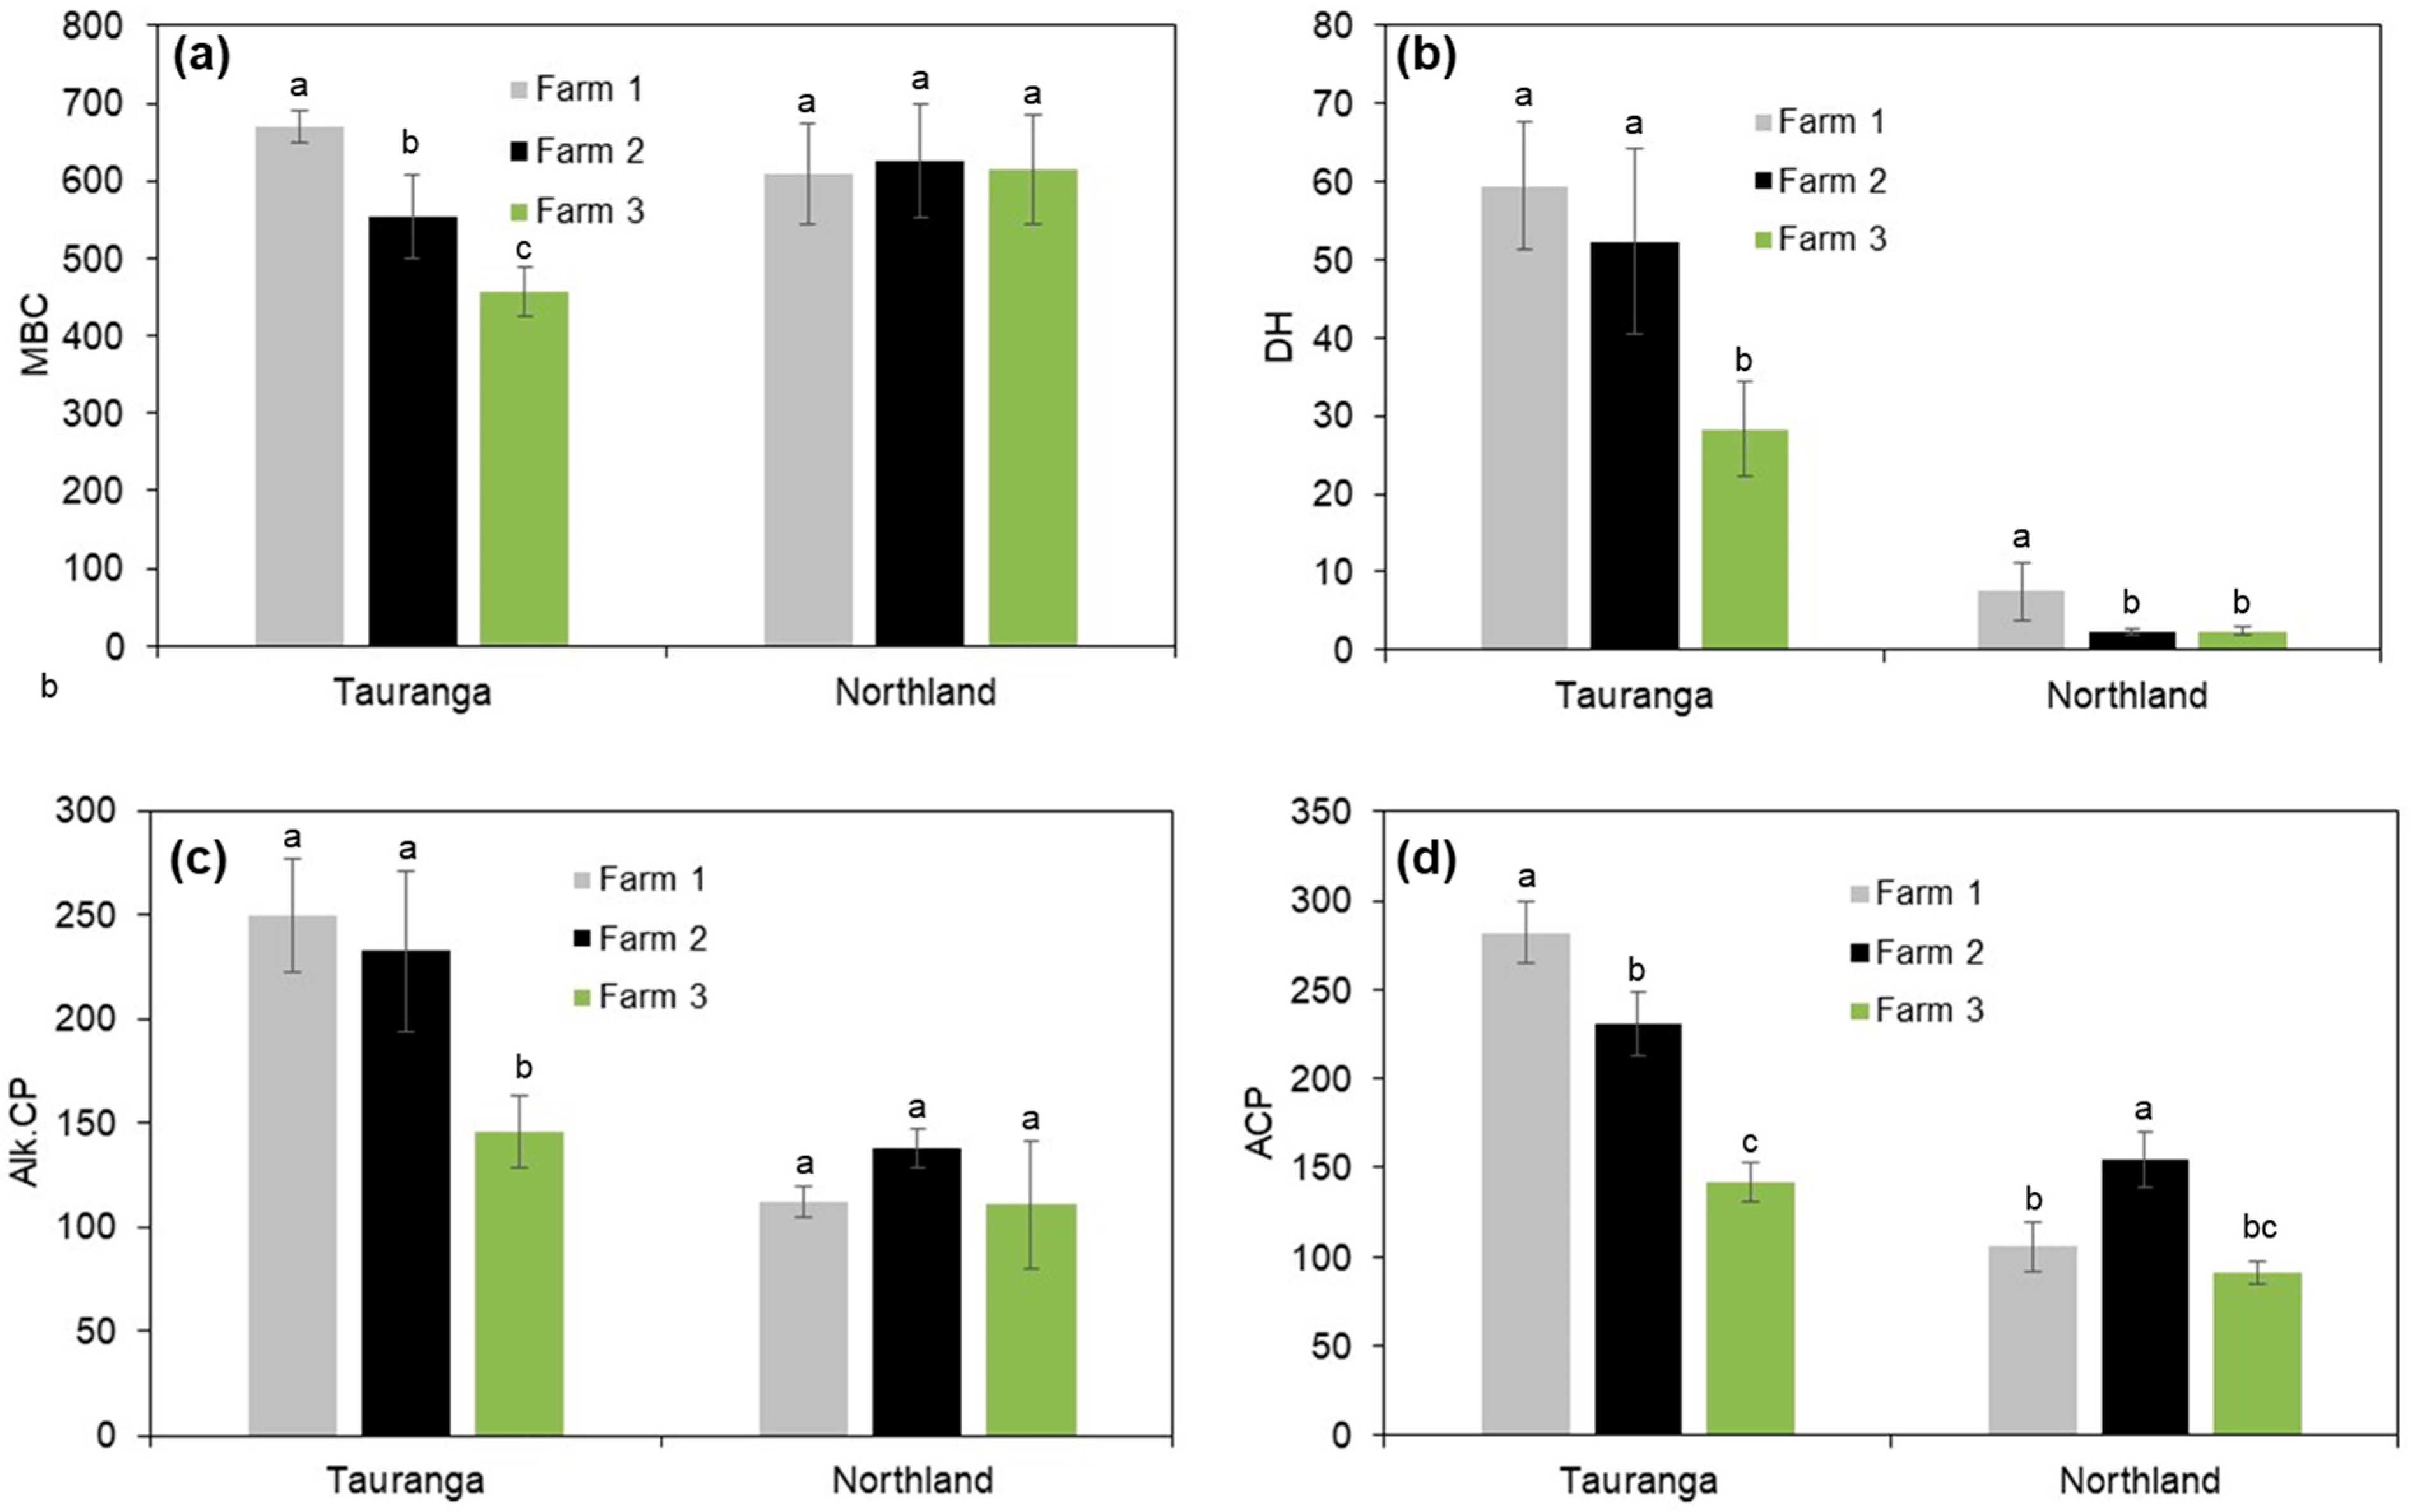
3.3. Soil Microbial Activity

The results in Figure 3 showed that the microbial activity greatly varied in the different farms. In the Tauranga site, the MBC was significantly higher in Farm 1 relative to both Farms 2 and 3. Farm 3 showed a significantly lower MBC by factors of 46.7% and 21.4% relative to Farm 1 and 2, respectively (Figure 3a). In the three farms surveyed in Tauranga, no significant differences were observed in DH activity between Farms 1 and 2, but both farms had significantly higher DH activity by an average of 97.3% relative to Farm 3 (Figure 3b). In terms of Alk.CP, Farms 1 and 2 exhibited significantly higher Alk.CP relative to farm 3. Specifically, Farm 1 and Farm 2 had significantly higher Alk.CP by folds of 1.7 and 1.6, respectively, compared to Farm 3 (Figure 3c). Furthermore, in the Tauranga site, all three Farms showed significant differences in ACP, following the order Farm 1 > Farm 2 > Farm 3 (Figure 3d). In Northland, there were no significant differences observed between the farms; the MBC ranged from 608 to 626 mg kg−1 dry soil (Figure 3a). In terms of DH activity, in the Northland site, Farm 1 showed significantly higher DH activity compared to all three farms, and no significant differences were observed between Farms 2 and 3 (Figure 3b). The soil analysis in the Northland site did not show significant changes in Alk.CP across all three farms; the Alk.CP ranged from 110.9 to 137.8 µg 4-nitrophenol g−1 h−1 (Figure 3c). Furthermore, the study results showed that only Farm 2 had significantly higher ACP among the three farms, and no significant differences were observed between Farms 1 and 3 (Figure 3d).

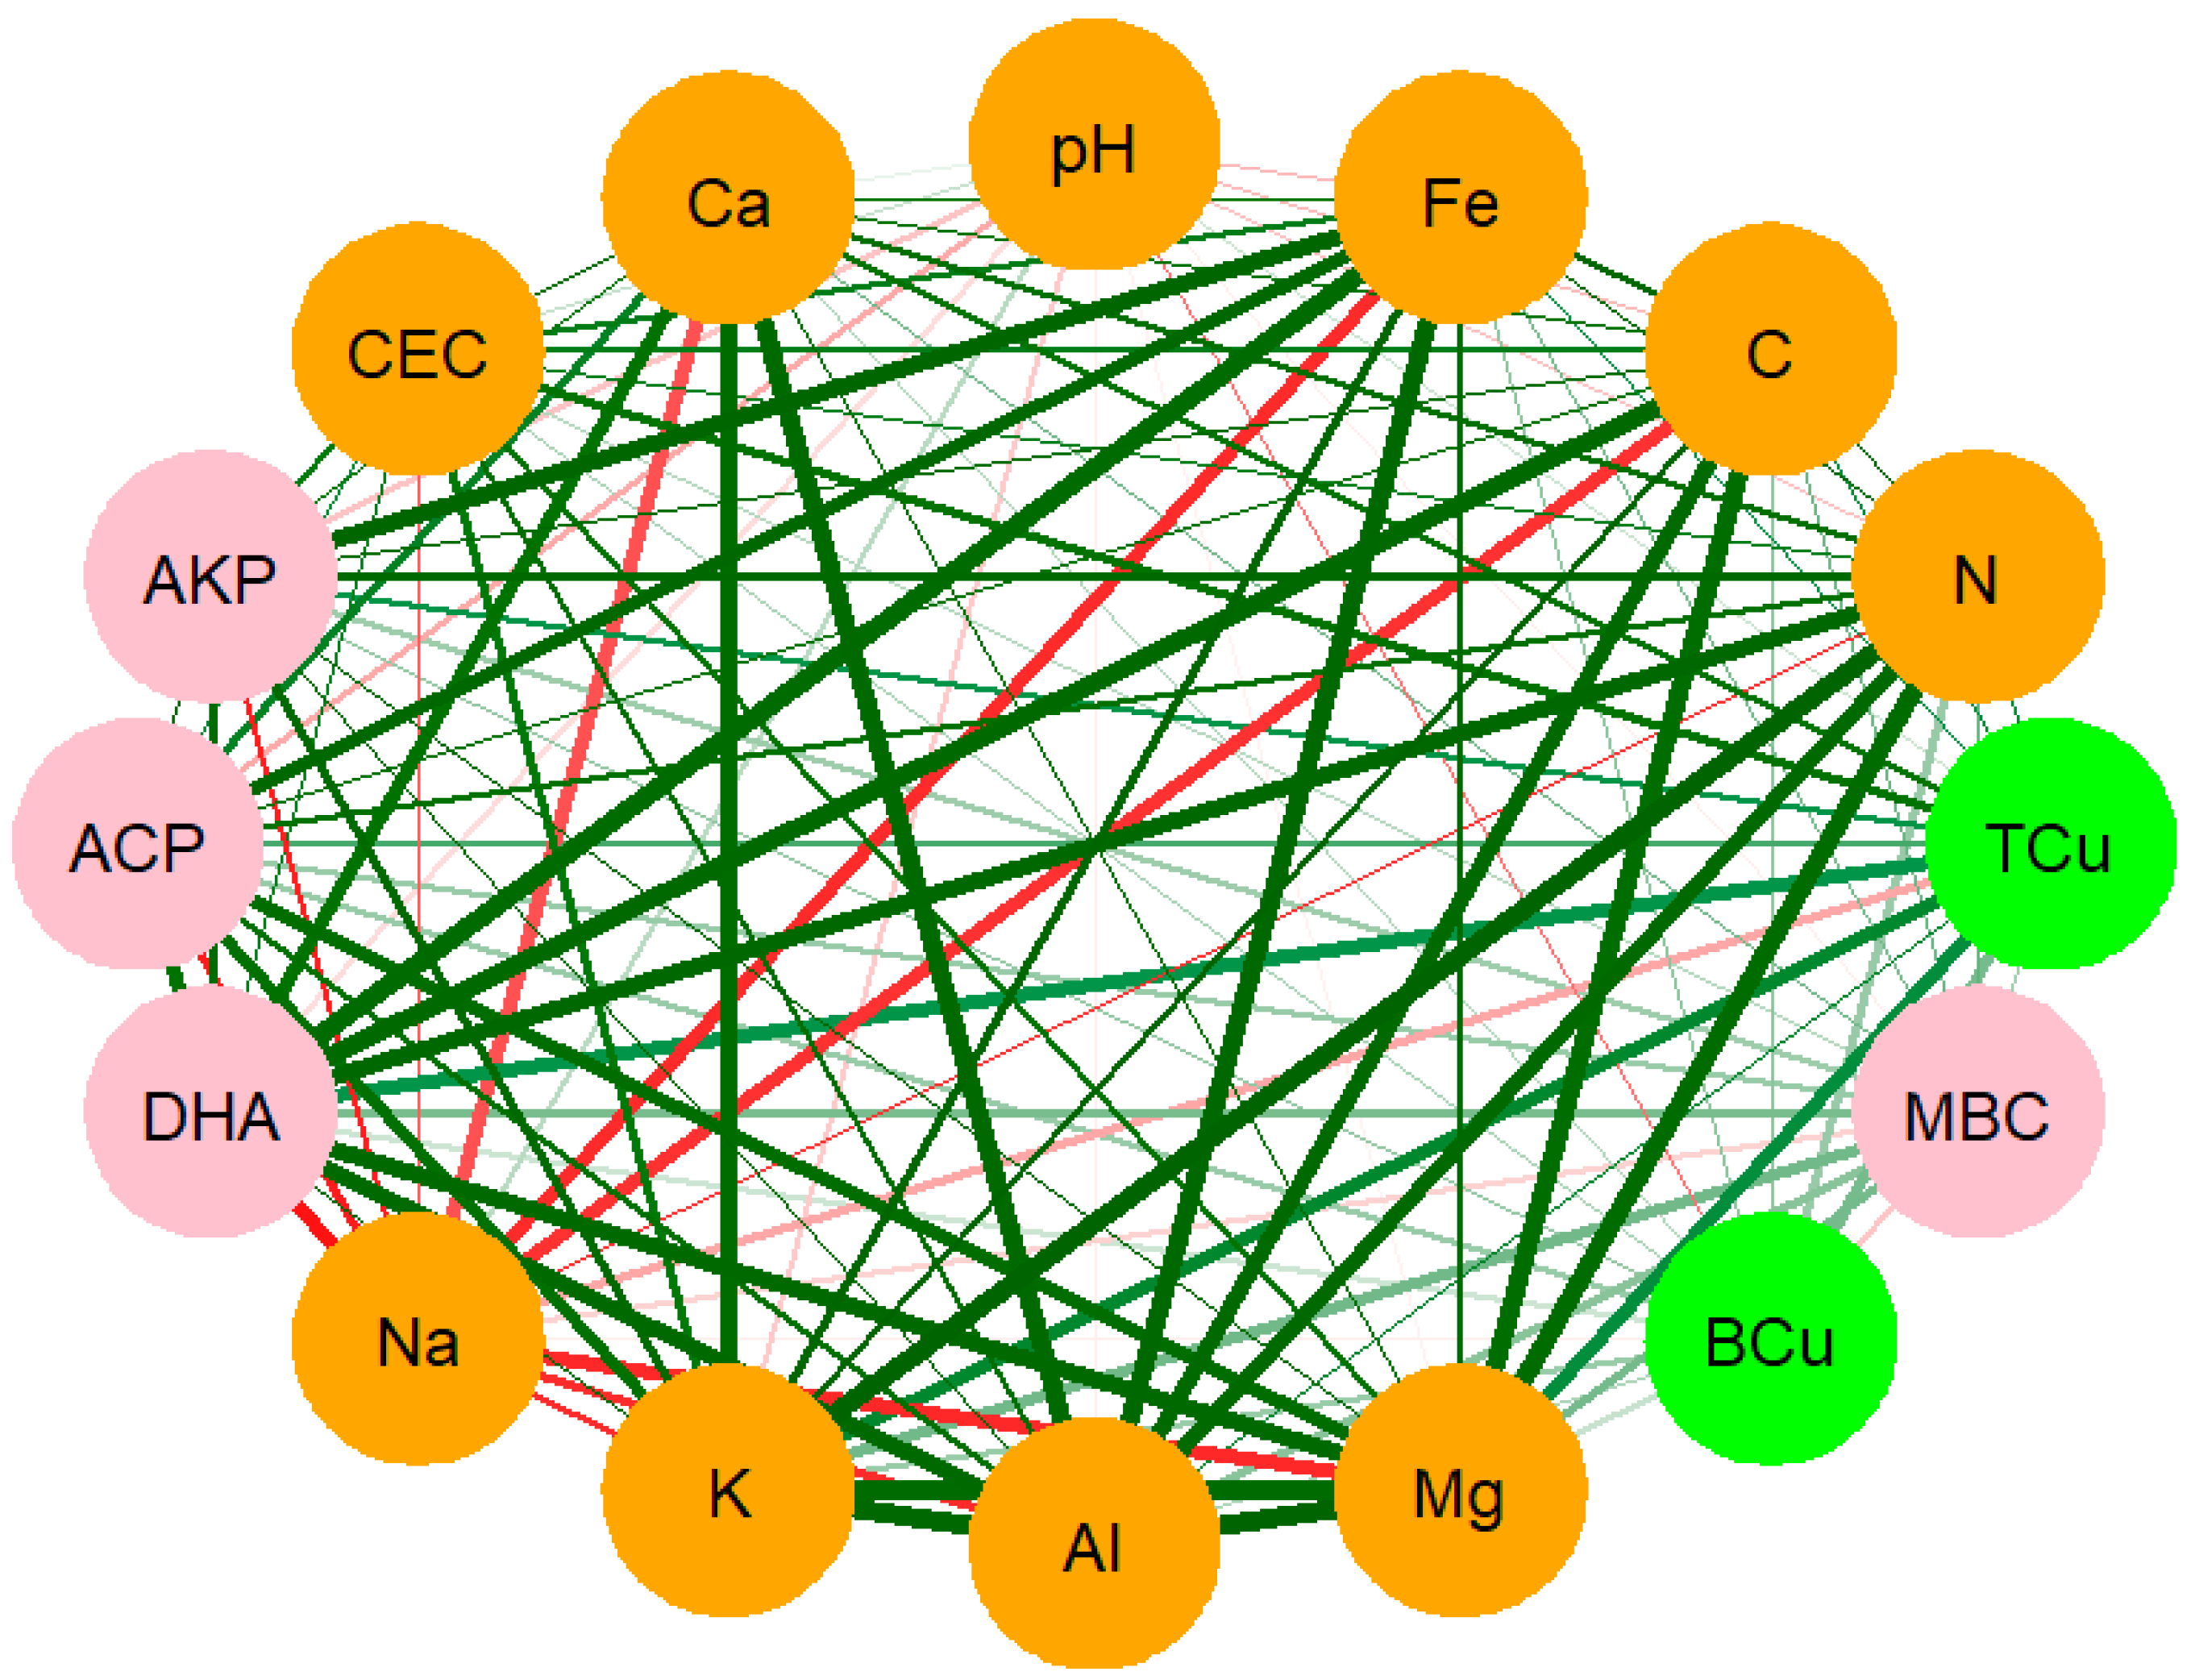
3.4. Influence of Different Soil Properties on Soil Cu Concentrations

The relationships between soil total Cu, soil bioavailable, and different soil chemical properties were determined by showing the correlation coefficient of the different parameters. Total Cu exhibited a significant (p < 0.05) and positive correlation with Fe (R2 = 0.654), CEC (R2 = 0.671, and C (R2 = 0.665), showing that the total Cu increased with increasing levels of these parameters (Figure 4, Table S1 in Supplementary Materials). A significant and negative correlation (R2 = −0.338, p < 0.05) between bioavailable Cu and soil pH was observed, indicating that an increased pH reduced bioavailable Cu. However, bioavailable Cu exhibited a not significant but positive relationship (R2 = 0.187, p > 0.05) with total Cu. There was no observed relationship between bioavailable Cu, DH activity, and MBC.

4. Discussion

4.1. Effect of Using Cu-Based Fungicide Sprays in Avocado Orchards on Cu Accumulation in Soil and Its Subsequent Effect on Soil Enzyme Activity

In our field study, soil total Cu was shown to vary greatly among the different orchards in the same area. All avocado orchard farms surveyed in this study demonstrated that total Cu in both locations was greater than the general total Cu of most native soils (<30 mg Cu kg−1, as demonstrated by Longhurst et al. [27] and Morgan and Johnston [5]) in New Zealand, except for Northland Farm 2, which had 18 mg total Cu kg−1. The higher total Cu levels could be associated with the more than 8 years in which the orchards had received Cu fungicide sprays. Even though they had higher total Cu than expected in native soils, only two farms had higher total Cu than the Northland Regional Council’s guideline for the total Cu in soil, which states the soil Cu should be below 63 mg kg−1. Furthermore, Farm 2 in both locations showed significantly higher bioavailable Cu than other farms (Figure 2b). The higher bioavailable Cu in these orchards provided strong evidence that the proportion of available Cu in the soil matrix is increasing. Soil bioavailable Cu is a good indicator to demonstrate that the Cu levels are increasing because it reflects on the effective Cu that is readily available for plants and soil microbes.
Furthermore, our study results demonstrated that the accumulation of Cu in both Tauranga and Northland was influenced by some soil properties. In this current study, the bioavailable Cu showed a significant and negative correlation with soil pH (R2 = −0.34) (Figure 4. This indicated that an acidic pH resulted in high bioavailable Cu, whereas as the pH increased, the bioavailable Cu decreased. The relationship between bioavailable Cu and pH has been discussed in several studies [28,29]. In this current study, it was observed in Northland Farm 2, in which the bioavailable Cu was in higher proportion even though it recorded the lowest total Cu relative to the other two farms. The higher bioavailable Cu in Northland Farm 2 was associated with the lower soil pH (5.39) compared to the other two farms, which had an average pH of 6.62 (Table 1). The bioavailable Cu also showed a significant and negative correlation (R2 = −0.25, p < 0.05) with organic C (Figure 4). Previous studies discussed the complexation of organic C with Cu in soil, thus, reducing bioavailable Cu in the soil solution [30,31]. Villanueva-Rey et al. [32] demonstrated that organic C is one of the key factors in determining Cu toxicity potential. This is because Cu has a high affinity to organic matter; therefore, a high organic C content is strongly linked with a lower ecotoxicity potential. There was no significant relationship between soil bioavailable and total Cu. Similar results have also been reported by Merrington et al. [33]. The lack of a significant relationship could be associated with the condition that not all total Cu was available, whereas the bioavailable Cu was highly reliant on soil properties in a specific area. Therefore, total Cu is not the best tool to estimate the bioavailability of metals in soils.
To further assess the potential effect of Cu accumulation on soil systems, the MBC, DH, Alk.CP, and ACP were analysed. In the Tauranga site, Farm 3 showed a significantly lower MBC, DH, Alk.CP, and ACP relative to both Farms 1 and 2. Despite the lower microbial activity in Farm 3, this effect could not be directly linked to Cu accumulation. However, it could be associated with the soil chemical properties. Farm 3 soils displayed a lower content of organomineral compounds than those of Farms 1 and 2 (Table 1 and Table 2). In the Northland farms, the microbial function greatly varied between farms and did not show significant differences between orchards. The lack of a clear effect of Cu on the microbial action in this study could be attributed to the Cu concentration recorded in our analysed orchard soils. Fernández-Calviño et al. [9] found that for the Cu effect to have an evident effect on phosphatase, MBC, and DH, the total Cu should be between 200 and 250 mg Cu kg−1. Furthermore, Kakutey et al. [34] reported that the application of Cu fungicides that increased the soil Cu concentration to 256.5 mg kg−1 had not correlated with the MBC. In this study, the total Cu concentration ranged between 18.4 and 196.7 mg total Cu kg−1, and the highest total Cu was only recorded in Tauranga Farm 2, which had a mean total Cu of nearly 200 mg Cu kg−1, and the other five orchards had a mean total Cu below 100 mg Cu kg−1. Even though some studies have reported the Cu effect on microbial action in thresholds of 100 mg Cu kg−1, the effect was not evident in this study, especially in the Northland orchards. The lower Cu concentrations in these farms could be strongly linked to the New Zealand farming practice of mulching. Mulch can prevent the fungicide sprays from dripping from trees and reaching the soil. Unfortunately, the plant litter from this experimental site was not analysed. However, evidence from the literature has shown that, generally, the plant litter from orchards receiving Cu sprays have a higher Cu concentration than the soils [35,36,37]. For example, Schoffer et al. [36] reported that the leaf litter total Cu content from different fruit orchard farms receiving Cu-based fungicide sprays in Chile was 3–7 times higher than the total soil Cu.
It is worth noting that the effect of Cu toxicity on enzyme action is complex, especially under field conditions with numerous factors. Different factors may have numerous influences on enzyme action and microbial biomass. Evidence in the literature has shown that the response of different enzymes to the same pollutant may vary depending on soil properties and environmental factors. Therefore, it is imperative to have site-specific data to implement well-informed management practices.

4.2. Importance of These Results in Orchard Management

Globally, the use of Cu-based fungicides in orchard programmes has been heavily linked with the accumulation of Cu in the long term. High Cu levels in soil can result in detrimental effects on soil productivity. Apart from production, high Cu from orchards can be transported to water sources through sediment transport. Copper enrichment in water sources can pose a potential threat to human health. Thus, it remains important to monitor the Cu levels in our orchards, which still include Cu-based fungicide sprays in their programmes. Results from this study demonstrated that one farm had elevated Cu levels. Understanding the potential threat that can emanate from the persistent use of Cu fungicides is important, because farm managers can be able to apply proper management practices. Besides microbial toxicity, increasing Cu levels in soils can influence other microbial-mediated processes, such as nitrification rate. Matse et al. [38] reported that increasing bioavailable Cu in soils can have a negative influence on nitrification bacteria, thus, influencing nitrogen use efficiency.
As a mitigation strategy, it is important for farmers to practise mulching because it can help to prevent the dripping of Cu from plants from reaching the soil; however, this mulch needs to be changed periodically to reduce the long-term availability of Cu through the microbial decomposition of the mulch. Furthermore, it is important to maintain the soil pH > 6.5, as it is widely known that bioavailable Cu is significantly reduced at a higher soil pH.

5. Conclusions

This current study demonstrated that the use of Cu-based fungicide sprays has a major influence on soil total Cu concentration. In Tauranga, Farm 2 showed elevated Cu concentrations (196.7 mg Cu kg−1) relative to other farms. Meanwhile, in Northland, all the assessed farms had a total Cu concentration below 100 mg Cu kg−1. There was no clear trend in associating the Cu concentrations in soils with the observed microbial activity results, indicating the soil Cu concentration had not reached a critical level. Soil properties proved to be major factors in influencing Cu accumulation and bioavailability in soil. The bioavailable soil Cu fraction could be minimized by increasing the soil pH. Data from this study proved to be important in terms of monitoring the Cu concentration in soils, which might have been influenced by the longer-term use of Cu sprays.

Supplementary Materials

The following supporting information can be downloaded at: https://www.mdpi.com/article/10.3390/environments11060109/s1, Table S1: Pearson’s correlation between soil total and bioavailable copper and different soil properties and enzyme activity.

Author Contributions

All authors contributed to the study concept and design. Conceptualization, data analysis, formal analysis, and first draft writing by D.T.M. Conceptualization, methodology, formal analysis, and writing—review and editing by T.G. Conceptualization, formal analysis, and writing—review and editing by E.F.v.G. Conceptualization, formal analysis, and writing—review and editing—by S.A. Conceptualization, data curation, supervision, writing—review and editing; fund acquisition, and project management by P.J. Conceptualization and writing—review and editing—by C.W.N.A. All authors have read and agreed to the published version of the manuscript.

Funding

This research received no external funding.

Data Availability Statement

The analysed data during this current study are available from the corresponding author upon reasonable request.

Acknowledgments

The authors would like to extend their appreciation to the avocado orchard growers in Tauranga and Northland, New Zealand, and to Bob Toes, Senior Technician at the Massey University Soil Chemistry Lab, for the endless support in collecting soil samples.

Conflicts of Interest

The authors declare no conflicts of interest.

References

  1. González-Estudillo, J.C.; González-Campos, J.B.; Nápoles-Rivera, F.; Ponce-Ortega, J.M.; El-Halwagi, M.M. Optimal Planning for Sustainable Production of Avocado in Mexico. Process Integr. Optim. Sustain. 2017, 1, 109–120. [Google Scholar] [CrossRef]
  2. Hakizimana, C.; May, J. Can smallholder avocado production reduce poverty and improve food security through internal markets? The case of Giheta, Burundi. For. Trees Livelihoods 2018, 27, 203–216. [Google Scholar] [CrossRef]
  3. Huang, K.-M.; Guan, Z.; Blare, T.; Hammami, A.M. Global Avocado Boom. Choices 2023, 38, 1–9. [Google Scholar]
  4. Fu, C.; Tu, C.; Zhang, H.; Li, Y.; Li, L.; Zhou, Q.; Scheckel, K.G.; Luo, Y. Soil accumulation and chemical fractions of Cu in a large and long-term coastal apple orchard, North China. J. Soils Sed. 2020, 20, 3712–3721. [Google Scholar] [CrossRef] [PubMed]
  5. Morgan, R.K.; Johnston, H. The accumulation of copper in a New Zealand orchard soil. J. R. Soc. N. Z. 1991, 21, 323–327. [Google Scholar] [CrossRef]
  6. Van Zwieten, L.; Rust, J.; Kingston, T.; Merrington, G.; Morris, S. Influence of copper fungicide residues on occurrence of earthworms in avocado orchard soils. Sci. Total Environ. 2004, 329, 29–41. [Google Scholar] [CrossRef] [PubMed]
  7. Tu, C.; Fan, W.; Yang, S.; Luo, Y. Inorganic Contaminants and Radionuclides; Naidu, R., Ed.; Elsevier: Amsterdam, The Netherlands, 2024; pp. 95–111. [Google Scholar]
  8. Holland, P.; Solomona, S. Copper status of orchards. Orchardist 1999, 72, 44–45. [Google Scholar]
  9. Fernández-Calviño, D.; Nóvoa-Muñoz, J.C.; Díaz-Raviña, M.; Arias-Estévez, M. Copper accumulation and fractionation in vineyard soils from temperate humid zone (NW Iberian Peninsula). Geoderma 2009, 153, 119–129. [Google Scholar] [CrossRef]
  10. Morgan, R.K.; Taylor, E. Copper Accumulation in Vineyard Soils in New Zealand. Environ. Sci. 2004, 1, 139–167. [Google Scholar] [CrossRef]
  11. Lamichhane, J.R.; Osdaghi, E.; Behlau, F.; Köhl, J.; Jones, J.B.; Aubertot, J.-N. Thirteen decades of antimicrobial copper compounds applied in agriculture. A review. Agron. Sustain. Dev. 2018, 38, 28. [Google Scholar] [CrossRef]
  12. Pinto-Poblete, A.; Retamal-Salgado, J.; Zapata, N.; Sierra-Almeida, A.; Schoebitz, M. Impact of polyethylene microplastics and copper nanoparticles: Responses of soil microbiological properties and strawberry growth. Appl. Soil Ecol. 2023, 184, 104773. [Google Scholar] [CrossRef]
  13. Li, J.; Niu, X.; Wang, P.; Yang, J.; Liu, J.; Wu, D.; Guan, P. Soil degradation regulates the effects of litter decomposition on soil microbial nutrient limitation: Evidence from soil enzymatic activity and stoichiometry. Front. Plant Sci. 2023, 13, 1090954. [Google Scholar] [CrossRef] [PubMed]
  14. Loland, J.Ø.; Singh, B.R. Copper contamination of soil and vegetation in coffee orchards after long-term use of Cu fungicides. Nutr. Cycl. Agroecosystems 2004, 69, 203–211. [Google Scholar] [CrossRef]
  15. Rieuwerts, J.S. The mobility and bioavailability of trace metals in tropical soils: A review. Chem. Speciat. Bioavailab. 2007, 19, 75–85. [Google Scholar] [CrossRef]
  16. Kumar, V.; Pandita, S.; Singh Sidhu, G.P.; Sharma, A.; Khanna, K.; Kaur, P.; Bali, A.S.; Setia, R. Copper bioavailability, uptake, toxicity and tolerance in plants: A comprehensive review. Chemosphere 2021, 262, 127810. [Google Scholar] [CrossRef] [PubMed]
  17. Mir, A.R.; Pichtel, J.; Hayat, S. Copper: Uptake, toxicity and tolerance in plants and management of Cu-contaminated soil. BioMetals 2021, 34, 737–759. [Google Scholar] [CrossRef] [PubMed]
  18. Khan, M.A.R.; Bolan, N.S.; MacKay, A.D. Adsorption and Desorption of Copper in Pasture Soils. Commun. Soil Sci. Plant Anal. 2005, 36, 2461–2487. [Google Scholar] [CrossRef]
  19. Olaniran, A.O.; Balgobind, A.; Pillay, B. Bioavailability of Heavy Metals in Soil: Impact on Microbial Biodegradation of Organic Compounds and Possible Improvement Strategies. Int. J. Mol. Sci. 2013, 14, 10197–10228. [Google Scholar] [CrossRef] [PubMed]
  20. NIWA. The Climate and Weather of Bay of Pleanty, 3rd ed.; The National Institute of Water and Atmospheric Research: Auckland, New Zealand, 2013; pp. 17–25. [Google Scholar]
  21. Blakemore, L.C. Methods for chemicalanalysis of soils. NZ Soil Bur. Sci. Rep. 1987, 80, 72–76. [Google Scholar]
  22. Matse, D.T.; Jeyakumar, P.; Bishop, P.; Anderson, C.W.N. Bioavailable Cu can influence nitrification rate in New Zealand dairy farm soils. J. Soils Sed. 2022, 22, 916–930. [Google Scholar] [CrossRef]
  23. Sparks, D. Methods of Soil Analysis Part 3 SSSA Book Ser. 5; SSSA: Madison, WI, USA, 1996. [Google Scholar]
  24. Rashid, M.H.; Fardous, Z.; Chowdhury, M.A.Z.; Alam, M.K.; Bari, M.L.; Moniruzzaman, M.; Gan, S.H. Determination of heavy metals in the soils of tea plantations and in fresh and processed tea leaves: An evaluation of six digestion methods. Chem. Cent. J. 2016, 10, 7. [Google Scholar] [CrossRef] [PubMed]
  25. Xu, C.; Peng, C.; Sun, L.; Zhang, S.; Huang, H.; Chen, Y.; Shi, J. Distinctive effects of TiO2 and CuO nanoparticles on soil microbes and their community structures in flooded paddy soil. Soil Biol. Biochem. 2015, 86, 24–33. [Google Scholar] [CrossRef]
  26. Guan, S.; Zhang, D.; Zhang, Z. Soil Enzyme and Its Research Methods; Chinese Agricultural Press: Beijing, China, 1986; pp. 274–297. [Google Scholar]
  27. Longhurst, R.D.; Roberts, A.H.C.; Waller, J.E. Concentrations of arsenic, cadmium, copper, lead, and zinc in New Zealand pastoral topsoils and herbage. N. Z. J. Agric. Res. 2004, 47, 23–32. [Google Scholar] [CrossRef]
  28. Carrillo-González, R.; Šimůnek, J.; Sauvé, S.; Adriano, D. Advances in Agronomy; Academic Press: Cambridge, MA, USA, 2006; Volume 91, pp. 111–178. [Google Scholar]
  29. Cui, H.; Zhao, Y.; Hu, K.; Xia, R.; Zhou, J.; Zhou, J. Impacts of atmospheric deposition on the heavy metal mobilization and bioavailability in soils amended by lime. Sci. Total Environ. 2024, 914, 170082. [Google Scholar] [CrossRef] [PubMed]
  30. Filipović, L.; Defterdarović, J.; Chen, R.; Krevh, V.; Gerke, H.H.; Baumgartl, T.; Kovač, Z.; Ondrašek, G.; Ružičić, S.; He, H.; et al. Leached Copper Correlation with Dissolved Organic Carbon in Sloped Vineyard Soil. Water 2023, 15, 800. [Google Scholar] [CrossRef]
  31. Navel, A.; Martins, J.M.F. Effect of long term organic amendments and vegetation of vineyard soils on the microscale distribution and biogeochemistry of copper. Sci. Total Environ. 2014, 466–467, 681–689. [Google Scholar] [CrossRef] [PubMed]
  32. Villanueva-Rey, P.; Vázquez-Rowe, I.; Quinteiro, P.; Rafael, S.; Gonçalves, C.; Moreira, M.T.; Feijoo, G.; Arroja, L.; Dias, A.C. Regionalizing eco-toxicity characterization factors for copper soil emissions considering edaphic information for Northern Spain and Portuguese vineyards. Sci. Total Environ. 2019, 686, 986–994. [Google Scholar] [CrossRef] [PubMed]
  33. Merrington, G.; Rogers, S.L.; Zwieten, L.V. The potential impact of long-term copper fungicide usage on soil microbial biomass and microbial activity in an avocado orchard. Soil Res. 2002, 40, 749–759. [Google Scholar] [CrossRef]
  34. Kakutey, K.; Sackey, L.N.A.; Akoto, O. Impact of accumulation of copper from application of copper-based fungicides on soil properties in Ghana. Discov. Environ. 2023, 1, 1. [Google Scholar] [CrossRef]
  35. Lepp, N.W.; Dickinson, N.M.; Ormand, K.L. Distribution of fungicide-derived copper in soils, litter and vegetation of different aged stands of coffee (Coffea arabica L.) in Kenya. Plant Soil 1984, 77, 263–270. [Google Scholar] [CrossRef]
  36. Schoffer, J.T.; Aponte, H.; Neaman, A.; Maria De la Fuente, L.; Arellano, E.C.; Gil, P.M.; Ginocchio, R. Copper content in soils and litter from fruit orchards in Central Chile and its relationship with soil microbial activity. Plant Soil Environ. 2022, 68, 115–128. [Google Scholar] [CrossRef]
  37. Schoffer, J.T.; Sauvé, S.; Neaman, A.; Ginocchio, R. Role of Leaf Litter on the Incorporation of Copper-Containing Pesticides into Soils Under Fruit Production: A Review. J. Soil Sci. Plant Nutr. 2020, 20, 990–1000. [Google Scholar] [CrossRef]
  38. Matse, D.T.; Jeyakumar, P.; Bishop, P.; Anderson, C.W.N. Copper induces nitrification by ammonia-oxidizing bacteria and archaea in pastoral soils. J. Environ. Qual. 2023, 52, 49–63. [Google Scholar] [CrossRef] [PubMed]
Figure 1. Demonstration of how the five soil samples in each tree were collected. Picture taken from one of the farms during soil sampling.
Environments 11 00109 g001
Figure 2. (a) The soil total Cu concentration and (b) soil bioavailable Cu in the different avocado orchards surveyed in Tauranga and Northland. Three farms were soil sampled in each area. Different small letters following each other in each area imply significant differences at p < 0.05. Vertical bars indicate the standard error of the mean (n = 10).
Environments 11 00109 g002
Figure 3. Changes in (a) microbial biomass carbon (MBC, mg kg−1 dry soil), (b) dehydrogenase activity (DH, µg g−1 24 h−1, (c) alkaline phosphatase activity (Alk.CP, µg 4-nitrophenol g−1 h−1), and (d) acid phosphatase activity (ACP, µg 4-nitrophenol g−1 h−1). Different small letters following each other in each area imply significant differences at p < 0.05. Vertical bars indicate the standard error of the mean (n = 10).
Environments 11 00109 g003
Figure 4. Pearson’s correlation between soil total and bioavailable copper (green circles) and different soil properties (orange circles) and microbial activity (pink circles). Lines of green for positive and red for negative correlation. Size of lines relative to the absolute value of correlation.
Environments 11 00109 g004
Table 1. Changes in soil chemical properties of the three farms surveyed in Tauranga and Northland.
LocationFarms pHFeAlCN
g kg−1
Tauranga Farm 16.02 ± 0.11a2.53 ± 0.05a24.83 ± 0.66a77.52 ± 1.95a6.37 ± 0.13a
Farm 26.10 ± 0.05a2.50 ± 0.05a24.7 ± 1.0a85.1 ± 1.85a6.88 ± 0.13a
Farm 35.72 ± 0.08b1.24 ± 0.05b5.71 ± 0.37b48.79 ± 1.73b3.99 ± 0.12b
Northland Farm 16.63 ± 0.09a0.81 ± 0.08a3.00 ± 0.55a29.25 ± 1.93a2.39 ± 0.14a
Farm 25.39 ± 0.07b1.11 ± 0.10b1.24 ± 0.09b35.18 ± 1.86a2.60 ± 0.12a
Farm 36.62 ± 0.09a0.46 ± 0.04a0.93 ± 0.13c18.38 ± 1.44b1.37 ± 0.10b
Numbers after± represent the standard error of means (n = 10). Different letters following each other in each location column are significantly different at p < 0.05.
Table 2. The changes in soil cations in the three farms in each location.
LocationFarms KCaMgNaa CEC
cmol kg−1
Tauranga Farm 11.81 ± 0.11a15.56 ± 1.35a2.57 ± 0.15a0.17 ± 0.04a40.98 ± 2.59a
Farm 21.99 ± 0.13a20.15 ± 0.84a2.25 ± 0.05a0.04 ± 0.01b47.81 ± 2.01a
Farm 30.90 ± 0.04b6.57 ± 0.52c0.83 ± 0.06c0.04 ± 0.01b19.86 ± 2.13b
Northland Farm 10.30 ± 0.03a6.82 ± 0.51a0.82 ± 0.06a0.25 ± 0.05a23.58 ± 1.42a
Farm 20.36 ± 0.03a2.40 ± 0.13c0.55 ± 0.03ab0.20 ± 0.03a17.01 ± 2.03a
Farm 30.07 ± 0.01b4.01 ± 0.27b0.41 ± 0.02b0.18 ± 0.01a25.16 ± 4.55a
Note: a CEC—cation exchange capacity. Numbers after± represent the standard error of means (n = 10). Different letters following each other in each location column are significantly different at p < 0.05.
Disclaimer/Publisher’s Note: The statements, opinions and data contained in all publications are solely those of the individual author(s) and contributor(s) and not of MDPI and/or the editor(s). MDPI and/or the editor(s) disclaim responsibility for any injury to people or property resulting from any ideas, methods, instructions or products referred to in the content.

