Effect of Irrigation Regime and Soil Nutrients on the Growth of the Paddy Weed Heteranthera reniformis and Rice Grain Yield


Abstract
1. Introduction
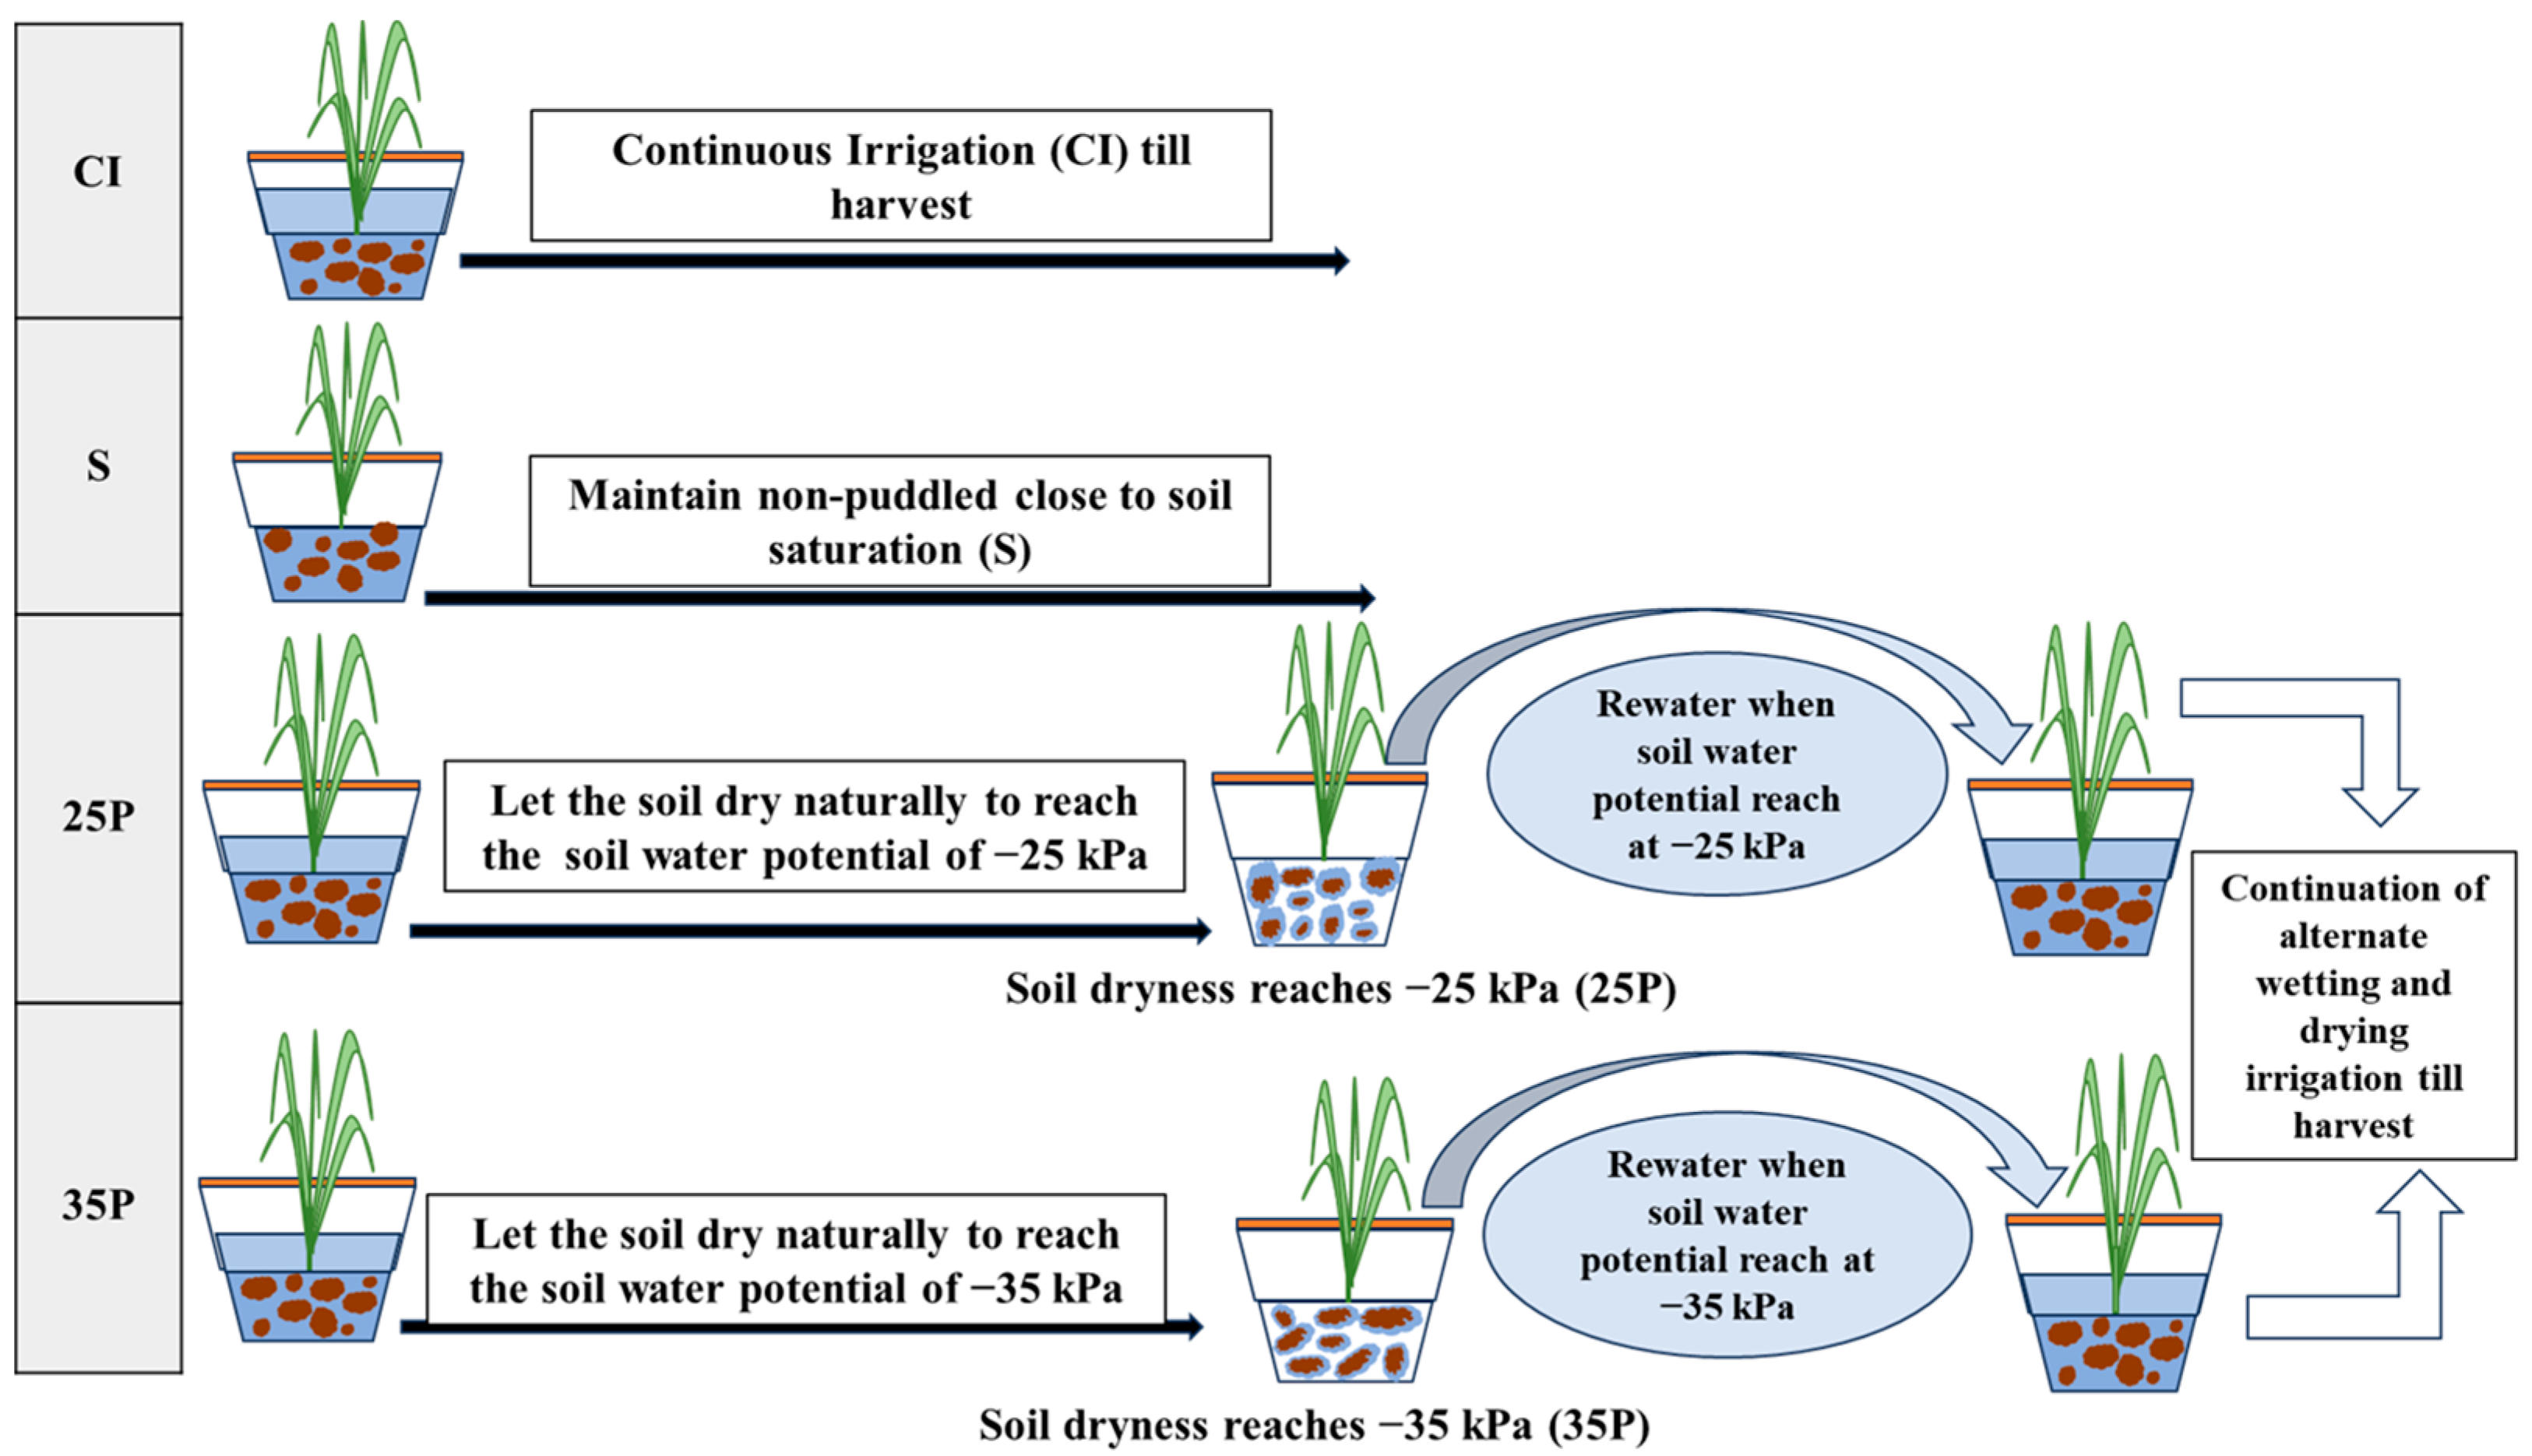
2. Materials and Methods
2.1. Field Visits, Sample Collection, and Seed Harvesting
2.2. Site Description and Soil Conditions for Pot Experiments
2.3. Plant Material and Cultivation Practices
2.4. Weeds and Crop Parameters Measurement
2.5. Crop Parameters, Yield, and Water Use Efficiency Assessment
2.6. Soil Analysis
2.7. Data Analysis
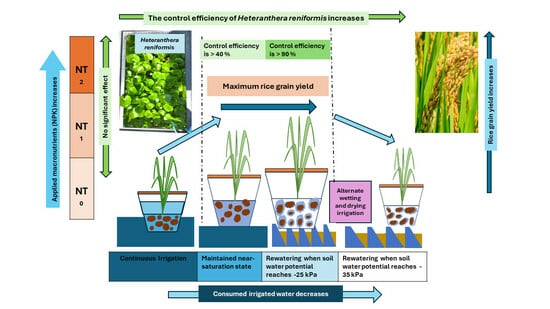
3. Results
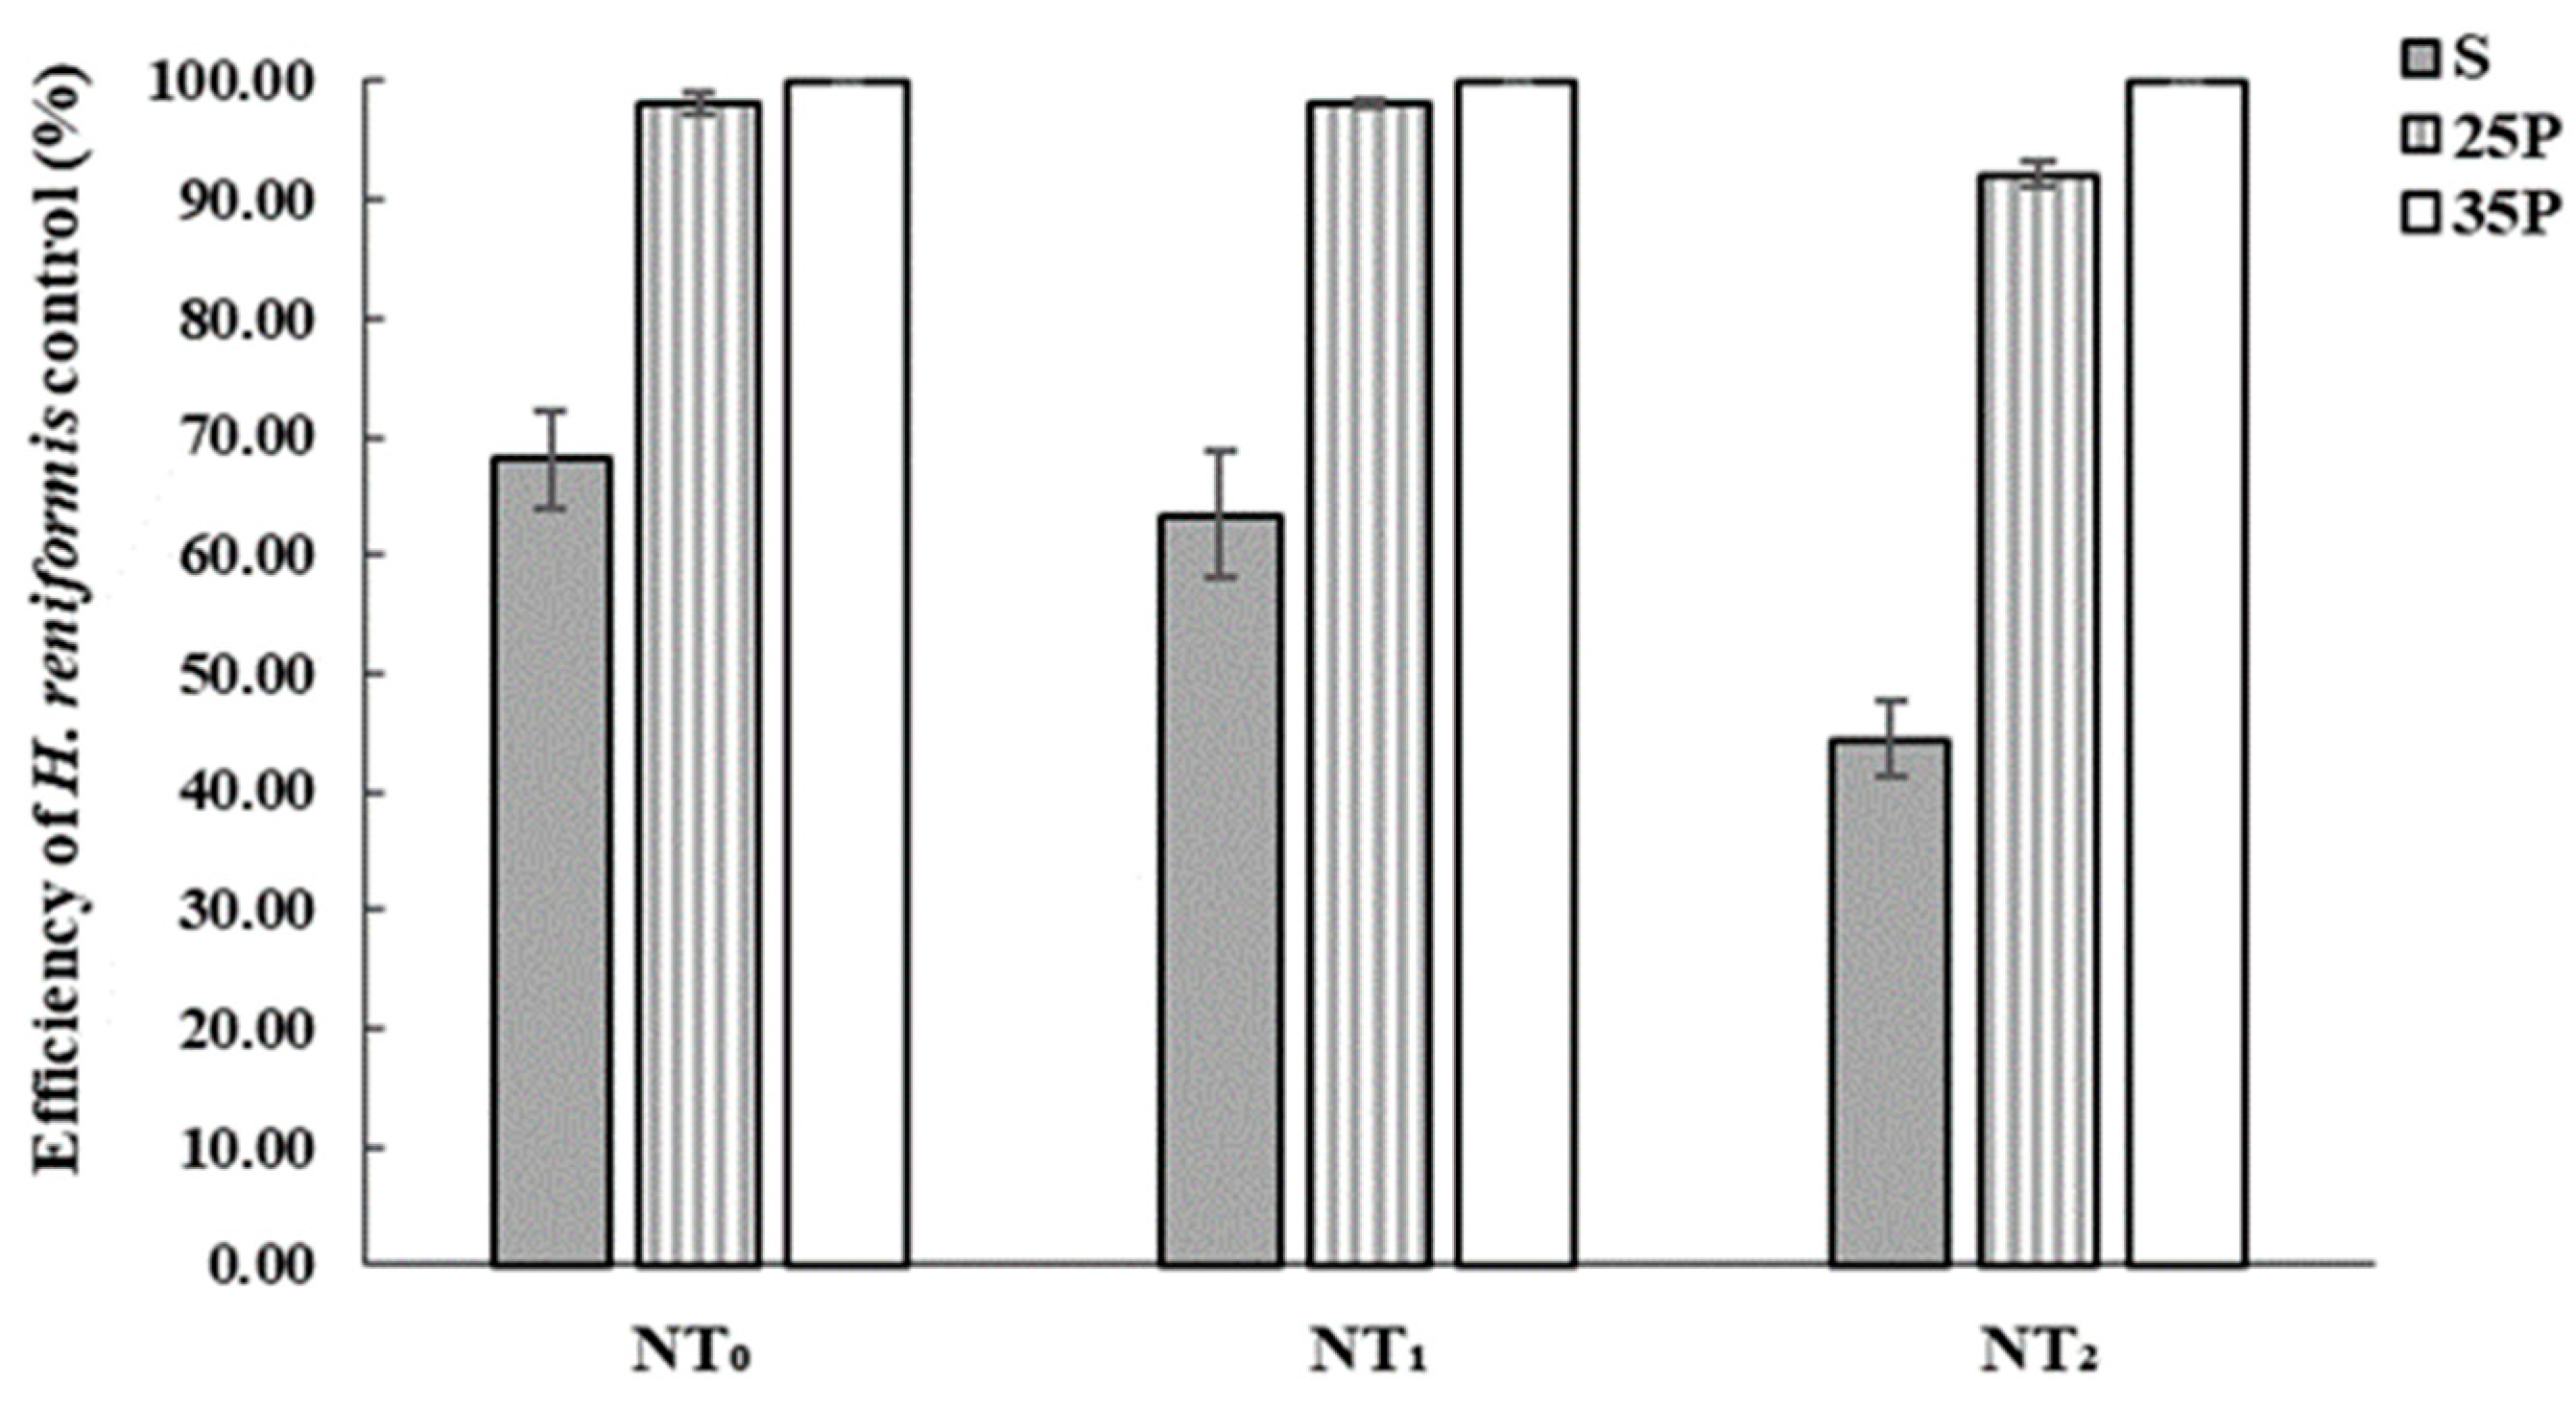
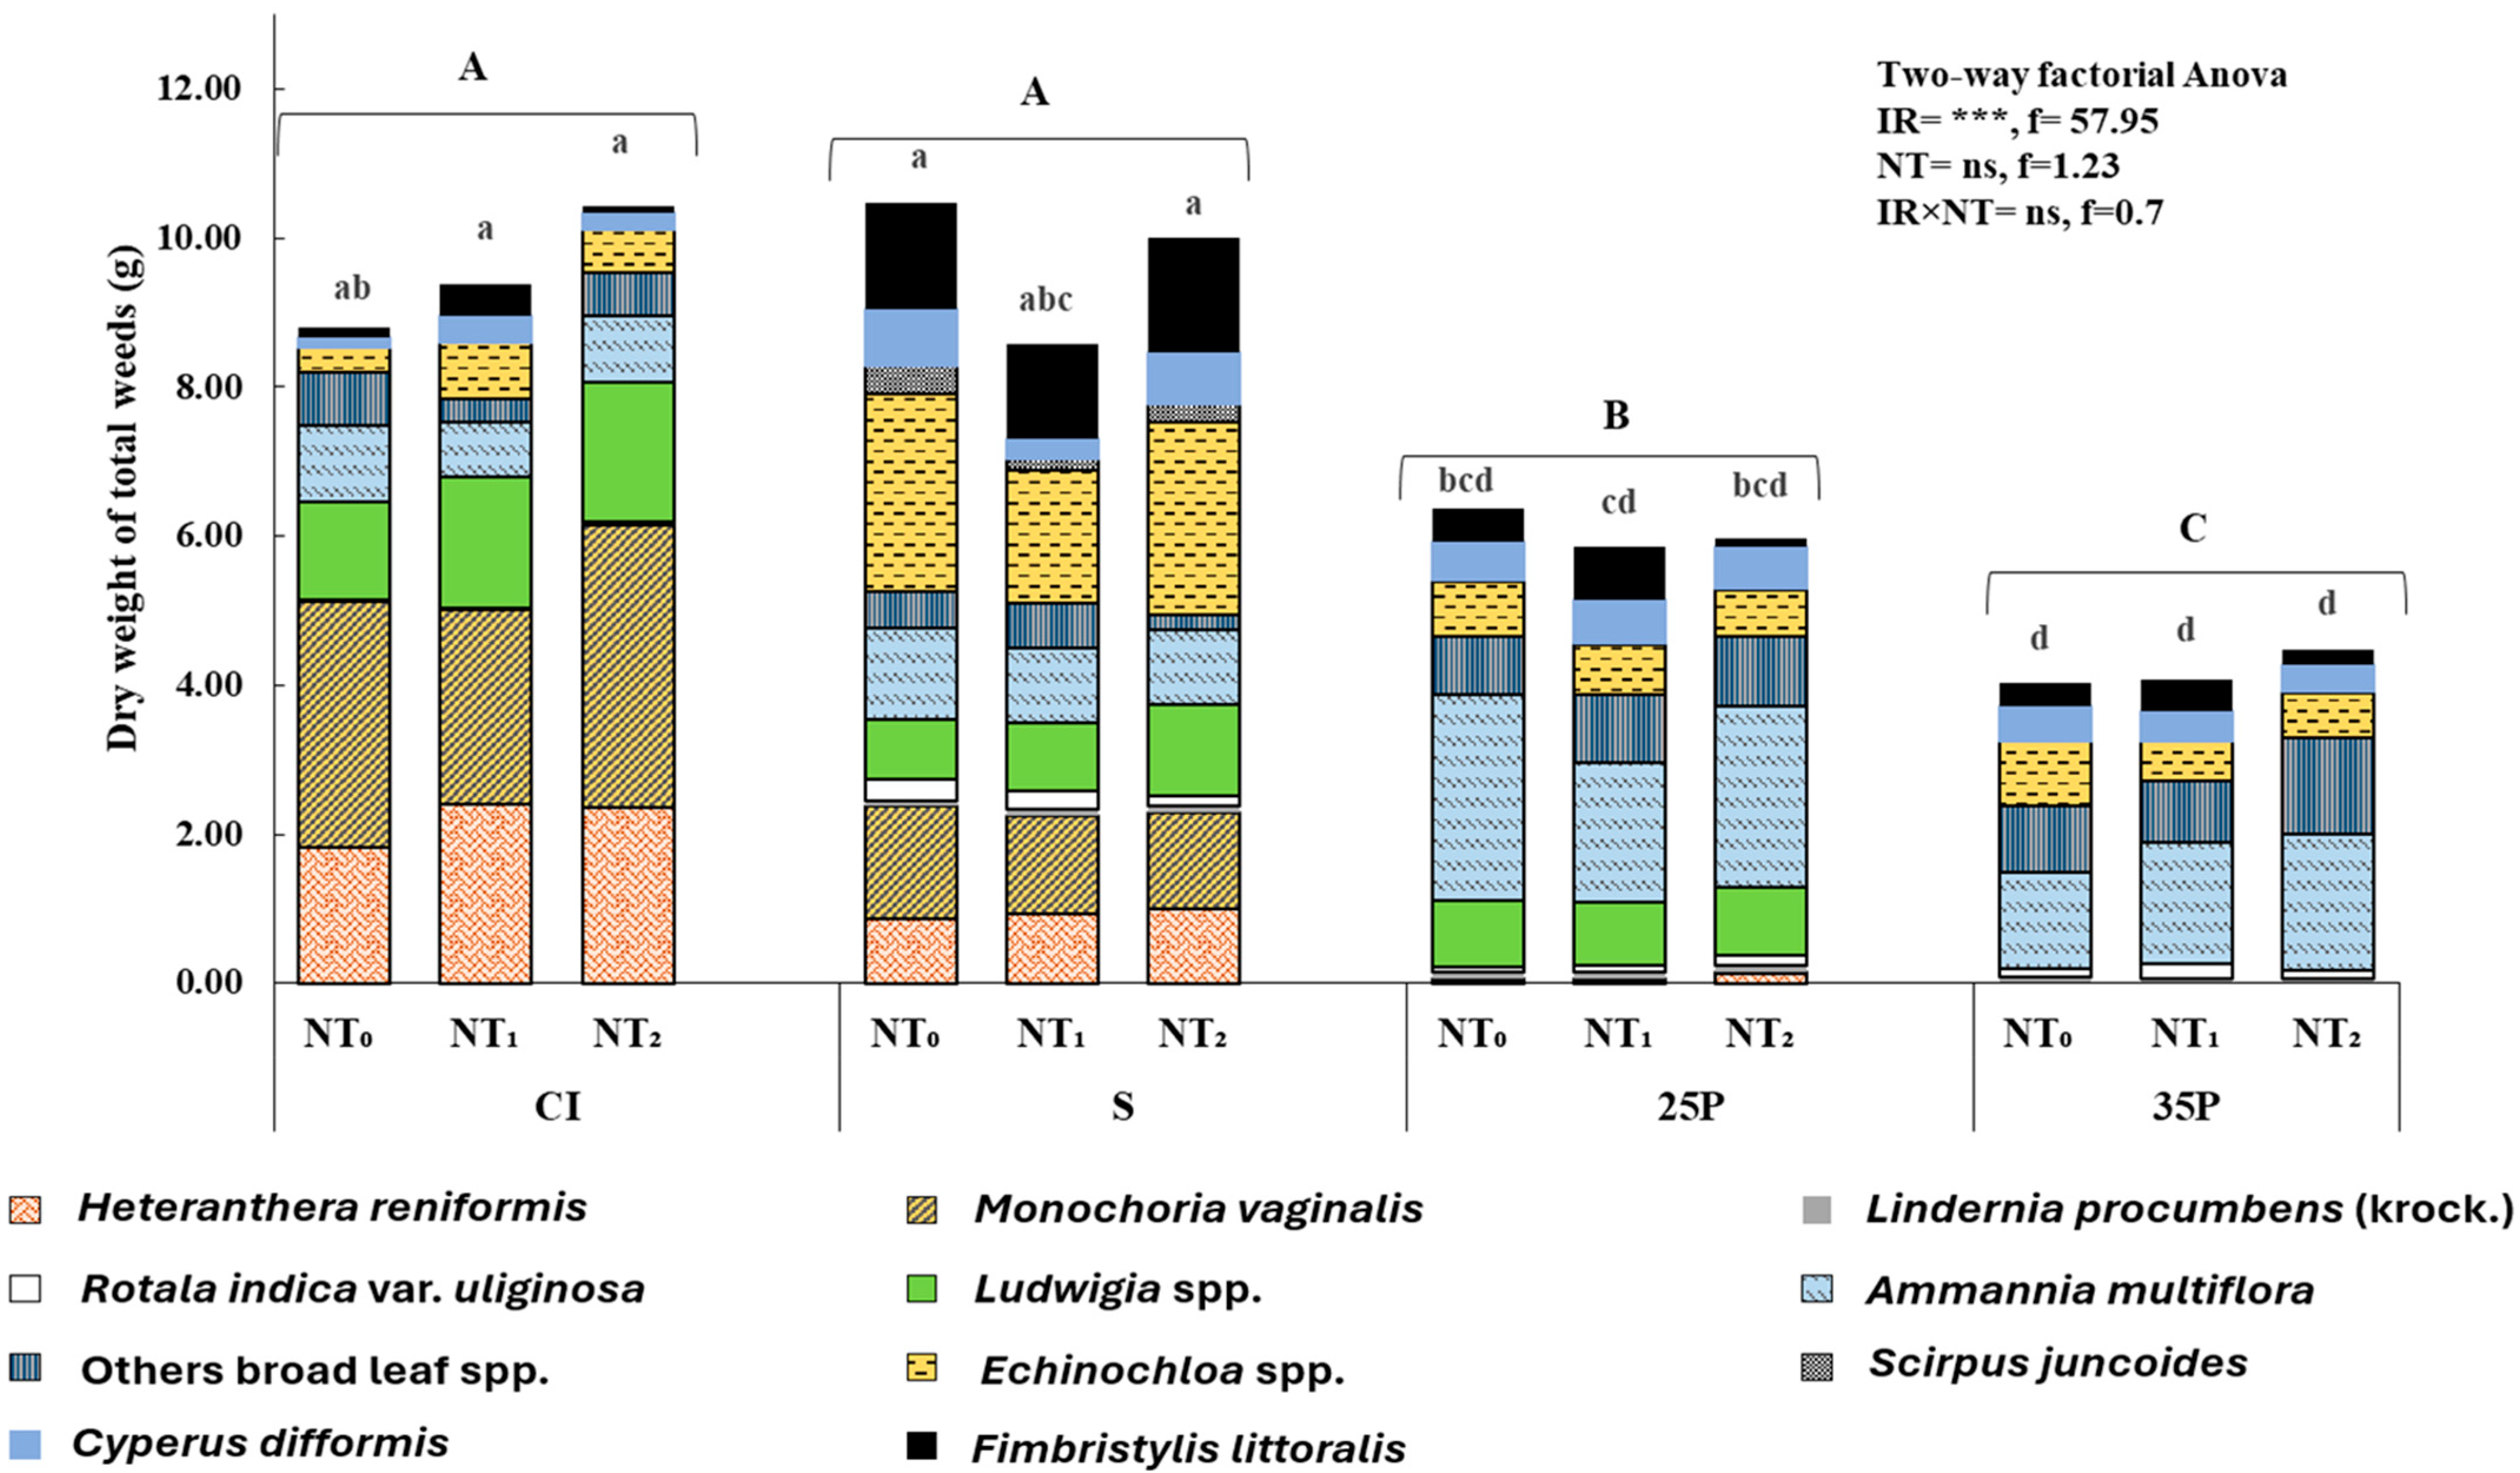
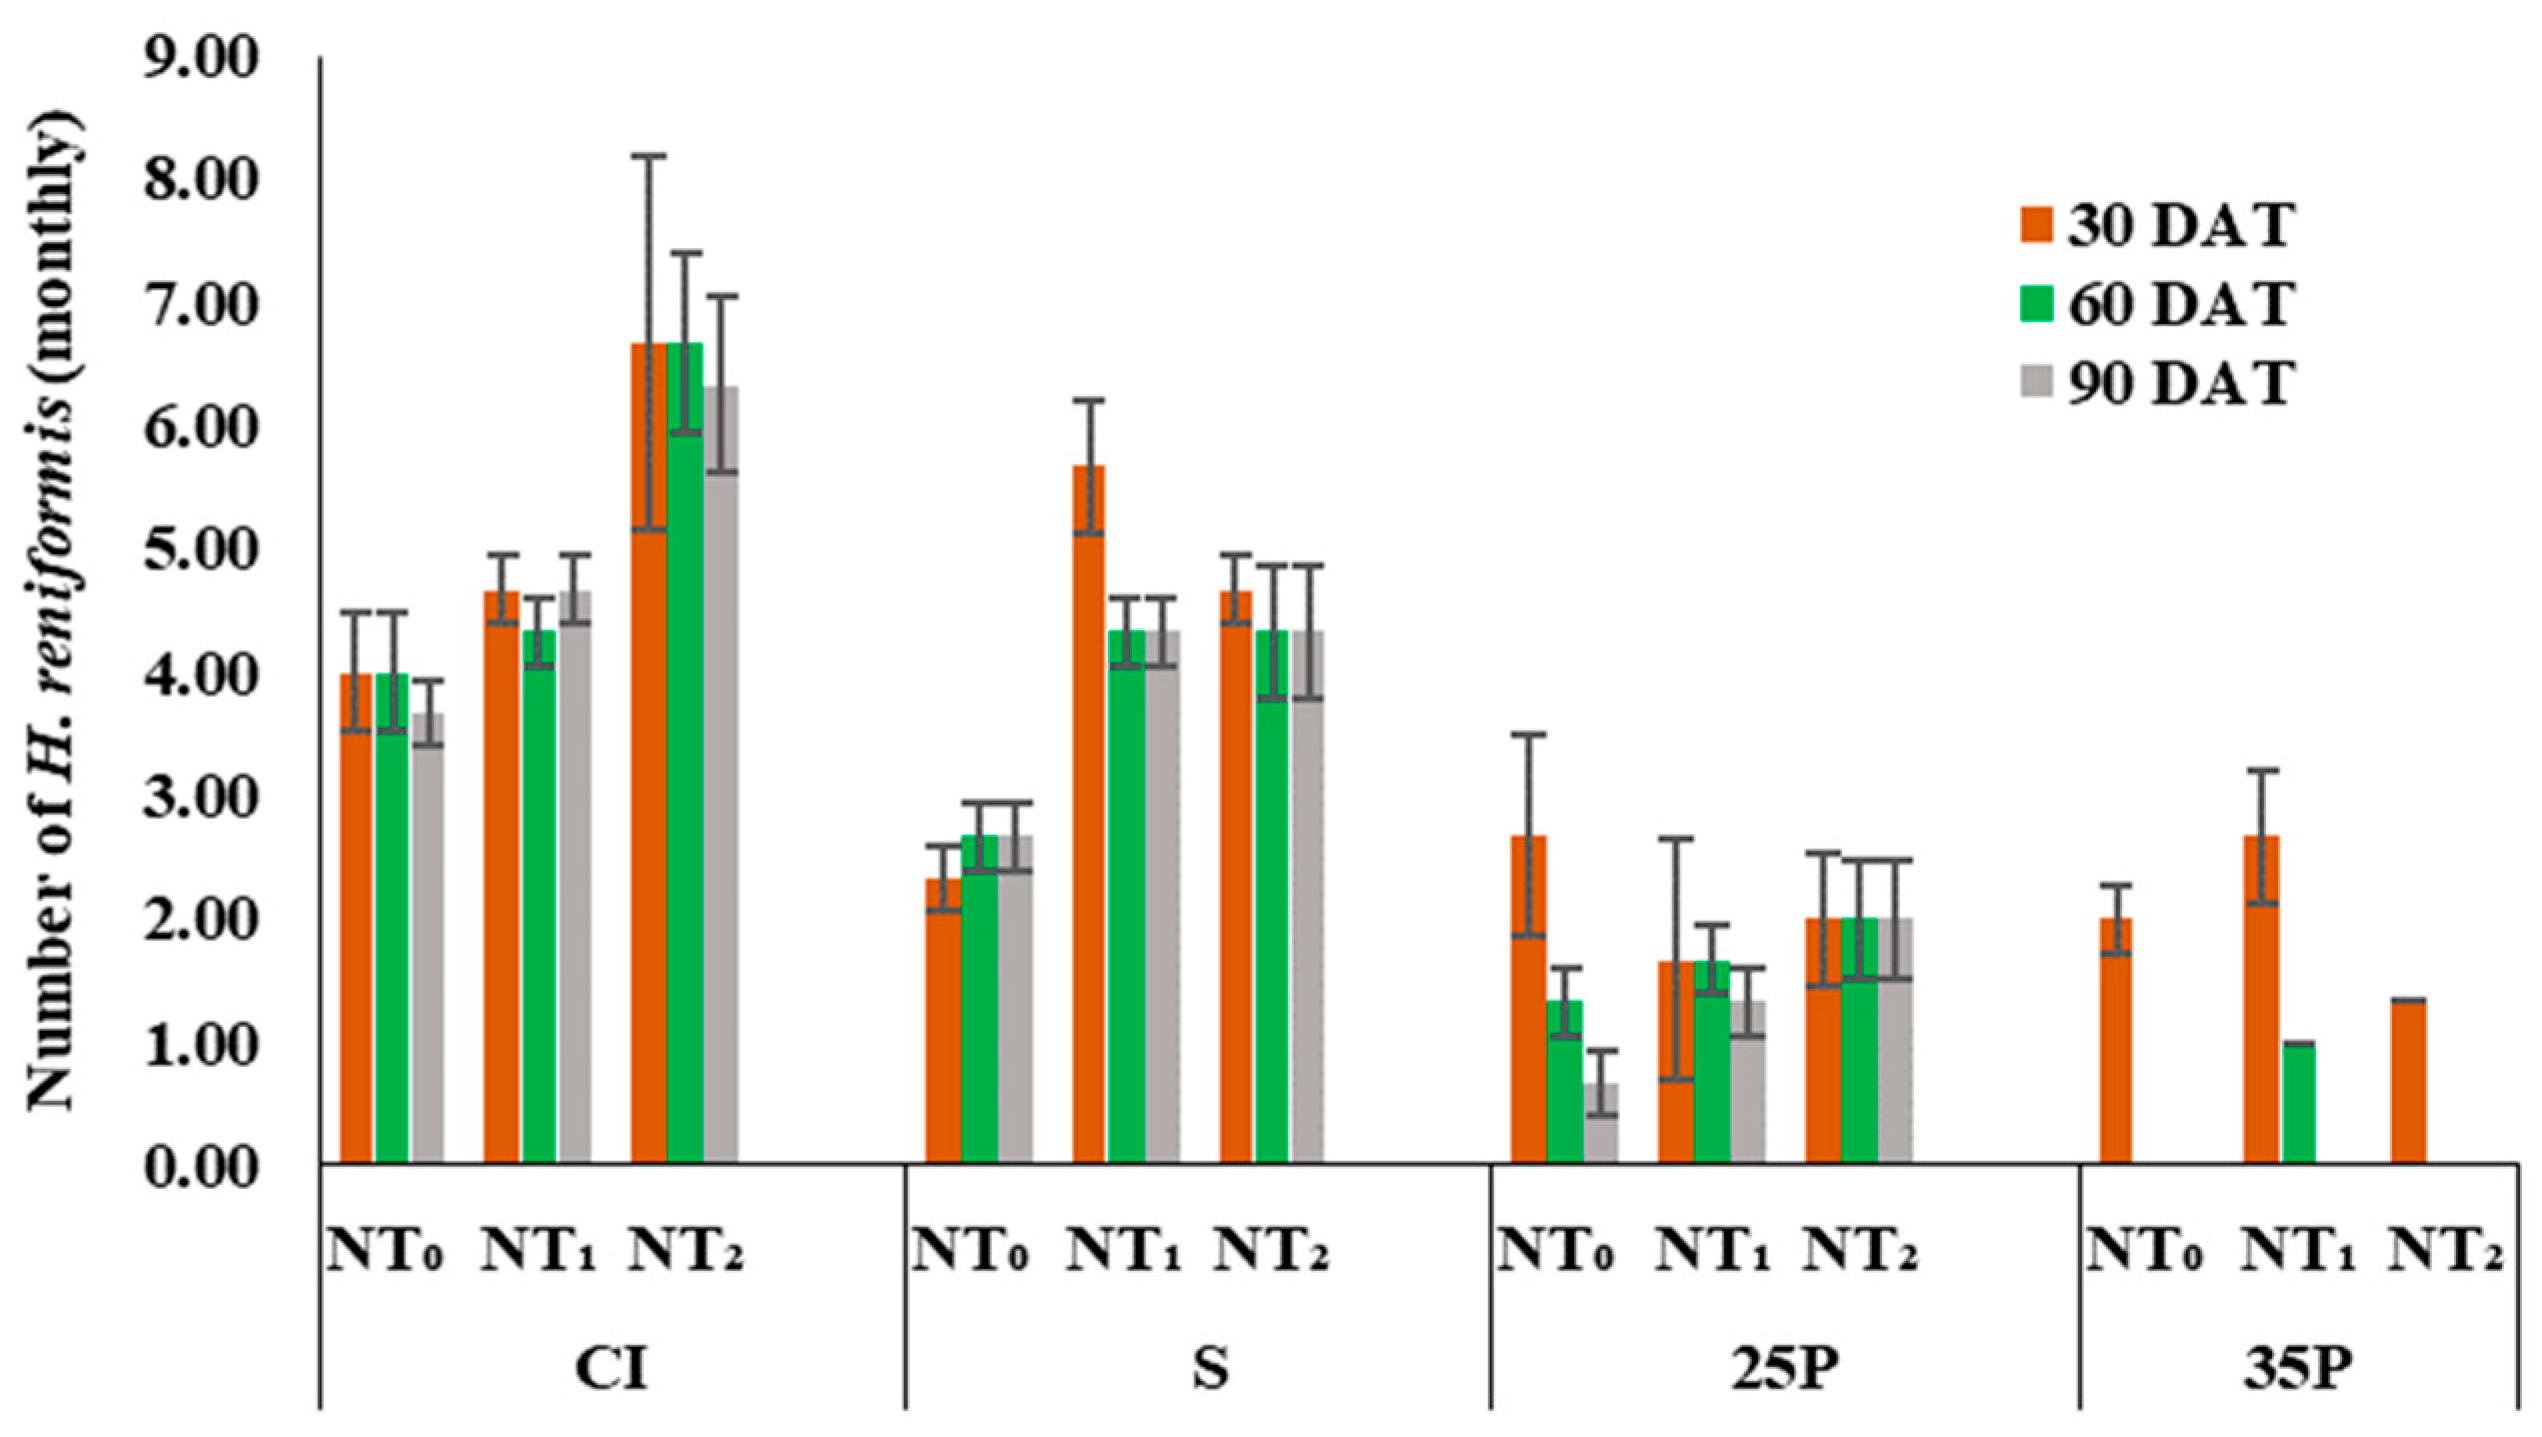
3.1. Heteranthera Reniformis Infestation and the Emergence of Other Rice Weeds
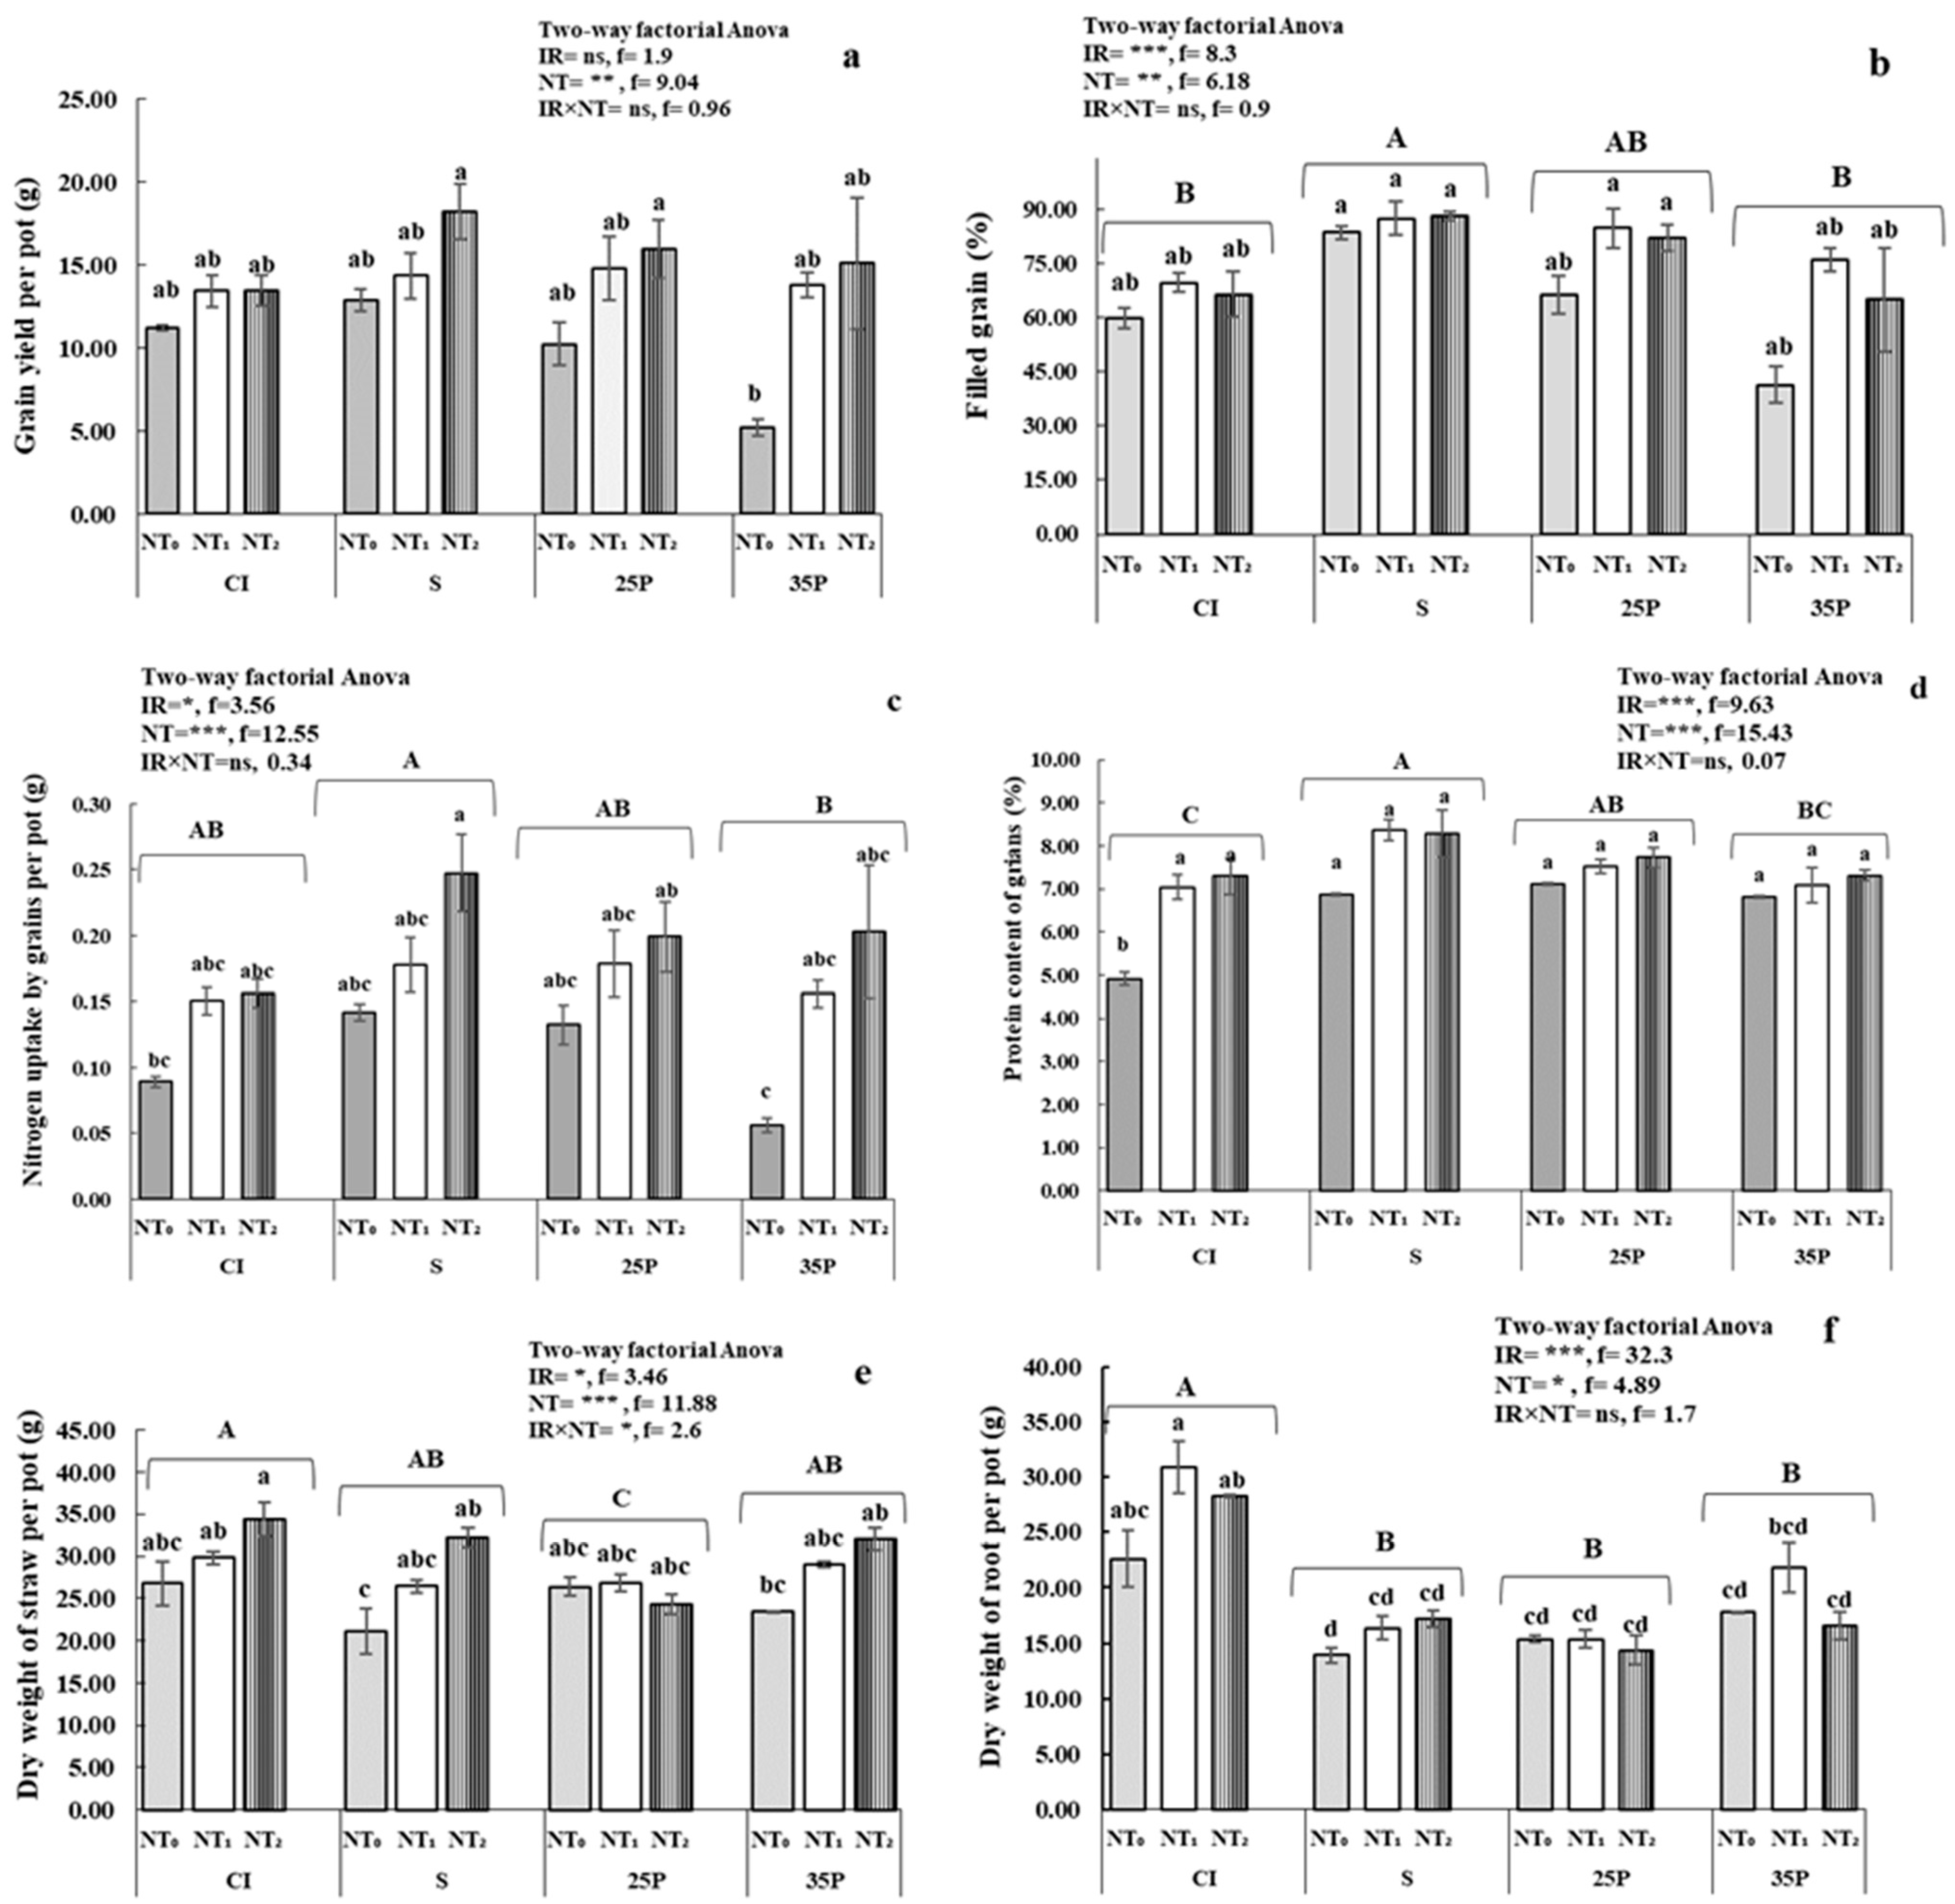
3.2. Crop Parameters, Yield, and Water Use Efficiency
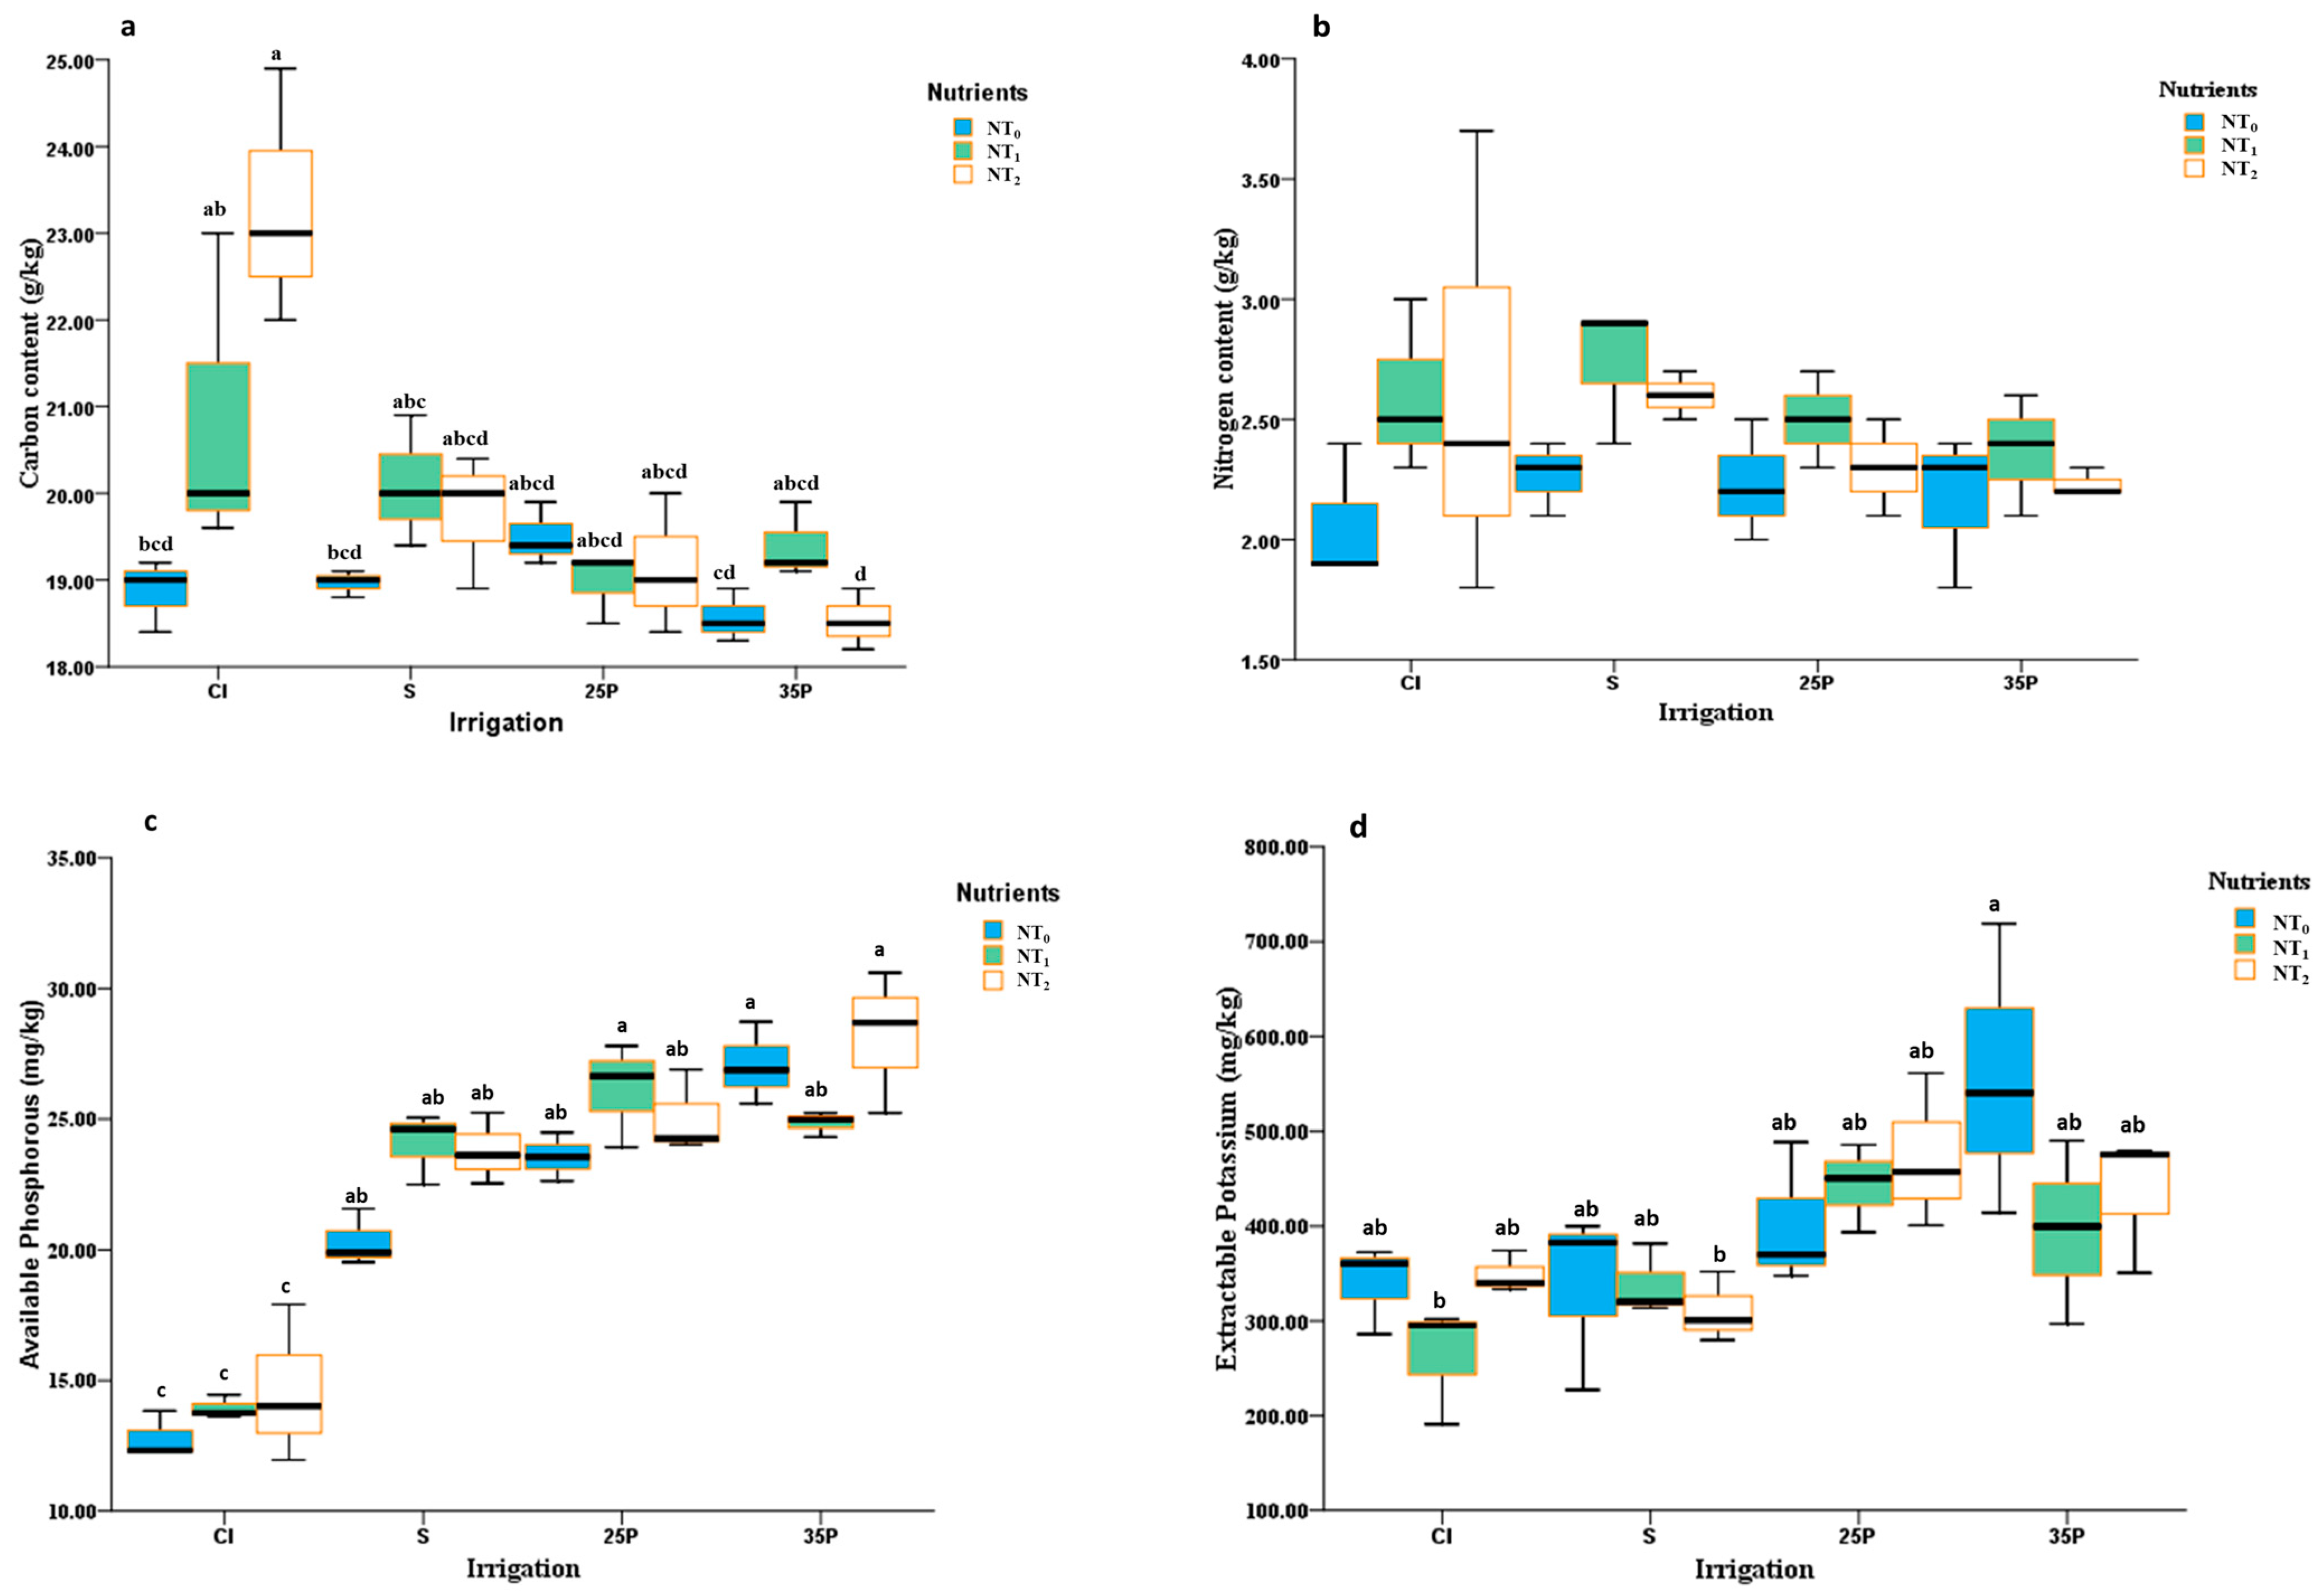
3.3. Soil Parameters
4. Discussion
5. Conclusions
Supplementary Materials
Author Contributions
Funding
Data Availability Statement
Conflicts of Interest
References
- Hill, S.R. Conservation Assessment for the Kidneyleaf Mud-plantain (Heteranthera reniformis Ruiz & Pavon); Illinois Natural History Survey Center for Wildlife and Plant Ecology Technical Report: Champaign, IL, USA, 2006. [Google Scholar]
- Gabela, F.J.A. Biology of Mudplantain (Heteranthera reniformis Ruiz et Pavon) and Its Control in Flooded Rice. Master’s Thesis, Oregon State University, Corvallis, OR, USA, 1974. [Google Scholar]
- Csurhes, S. Pest Plant Risk Assessment Kidneyleaf mudplantain; Biosecurity Queensland Department of Primary Industries and Fisheries: Brisbane, QLD, Australia, 2008. [Google Scholar]
- Arakaki, D. Heteranthera reniformis Kidneyleaf Mudplantain; Department of Agriculture: Honolulu, HI, USA, 2013.
- Karov, I.; Mitrev, S.; Mihajlov, L.; Ristova, D.; Nakova, E.; Kovacevik, B. Heteranthera reniformis Ruiz & Pavón new weed in rice field in the region of Kocani. J. Agric. Plant Sci. 2004, 4, 147–155. (In Bulgarian) [Google Scholar]
- Mineta, T. Colonization of Heteranthera reniformis Ruiz et Pavon at Kawashima Town and Okegawa City of the middle basin of the Arakawa River in Saitama Prefecture. J. Weed Sci. Technol. 2015, 60, 9–12. (In Japanese) [Google Scholar] [CrossRef]
- Natuhara, Y. Ecosystem services by paddy fields as substitutes of natural wetlands in Japan. Ecol. Eng. 2013, 56, 97–106. [Google Scholar] [CrossRef]
- Ferrero, A. Prediction of Heteranthera reniformis competition with flooded rice using day-degrees. Weed Res. 1996, 36, 197–201. [Google Scholar] [CrossRef]
- Rajcan, I.; Swanton, C.J. Understanding maize—Weed competition: Resource competition, light quality and the whole plant. Field Crops Res. 2001, 71, 139–150. [Google Scholar] [CrossRef]
- Comont, D.; Lowe, C.; Hull, R.; Crook, L.; Hicks, H.L.; Onkokesung, N. Evolution of generalist resistance to herbicide mixtures reveals a trade-off in resistance management. Nat. Commun. 2020, 11, 3086. [Google Scholar] [CrossRef]
- Brêda-Alves, F.; de-Oliveira, F.V.; Chia, M.A. Understanding the environmental roles of herbicides on cyanobacteria, cyanotoxins, and cyanoHABs. Aquat. Ecol. 2021, 55, 347–361. [Google Scholar] [CrossRef]
- Wang, W.; Man, Y.; Xie, J.; Zhang, Z.; Wang, P.; Liu, X. Occurrence and risk assessment of three chloroamide herbicides in water and soil environment in northeastern, eastern and southern China. Environ. Res. 2023, 219, 115104. [Google Scholar] [CrossRef]
- Giglio, A.; Vommaro, M.L. Dinitroaniline herbicides: A comprehensive review of toxicity and side effects on animal non-target organisms. Environ. Sci. Pollut. Res. 2022, 29, 76687–76711. [Google Scholar] [CrossRef]
- Ojelade, B.S.; Durowoju, O.S.; Adesoye, P.O.; Gibb, S.W.; Ekosse, G.I. Review of Glyphosate-Based Herbicide and Aminomethylphosphonic Acid (AMPA): Environmental and Health Impacts. Appl. Sci. 2022, 12, 8789. [Google Scholar] [CrossRef]
- Ruuskanen, S.; Fuchs, B.; Nissinen, R.; Puigbò, P.; Rainio, M.; Saikkonen, K. Ecosystem consequences of herbicides: The role of microbiome. Trends Ecol. Evol. 2023, 38, 35–43. [Google Scholar] [CrossRef]
- Luo, Y.; Fu, H.; Xiong, Y.; Xiang, Z.; Wang, F.; Bugingo, Y.C. Effects of water-saving irrigation on weed infestation and diversity in paddy fields in East China. Paddy Water Environ. 2017, 15, 593–604. [Google Scholar] [CrossRef]
- Zhang, S.; Rasool, G.; Guo, X.; Wang, R.; Zhao, Z.; Altaf, A. Response of weeds in rice fields to different water saving irrigation treatments. Pakistan J. Agric. Sci. 2021, 58, 769–776. [Google Scholar]
- Islam, S.M.M.; Gaihre, Y.K.; Islam, M.R.; Ahmed, M.N.; Akter, M.; Singh, U. Mitigating greenhouse gas emissions from irrigated rice cultivation through improved fertilizer and water management. J. Environ. Manag. 2022, 307, 114520. [Google Scholar] [CrossRef]
- Ishfaq, M.; Akbar, N.; Anjum, S.A.; Anwar-Ijl-Haq, M. Growth, yield and water productivity of dry direct seeded rice and transplanted aromatic rice under different irrigation management regimes. J. Integr. Agric. 2020, 19, 2656–2673. [Google Scholar] [CrossRef]
- Ishfaq, M.; Farooq, M.; Zulfiqar, U.; Hussain, S.; Akbar, N.; Nawaz, A. Alternate wetting and drying: A water-saving and ecofriendly rice production system. Agric. Water Manag. 2020, 241, 106363. [Google Scholar] [CrossRef]
- Carracelas, G.; Hornbuckle, J.; Rosas, J.; Roel, A. Irrigation management strategies to increase water productivity in Oryza sativa (rice) in Uruguay. Agric. Water Manag. 2019, 222, 161–172. [Google Scholar] [CrossRef]
- Ullah, H.; Mohammadi, A.; Datta, A. Growth, yield and water productivity of selected lowland Thai rice varieties under different cultivation methods and alternate wetting and drying irrigation. Ann. Appl. Biol. 2018, 173, 302–312. [Google Scholar] [CrossRef]
- Samoy-Pascual, K.; Martin, E.C.; Ariola, C.P. Effects of water and weed management on the weed density, grain yield, and water productivity of wet-seeded rice. Philipp. J. Sci. 2020, 149, 121–131. [Google Scholar] [CrossRef]
- Matsuo, N.; Mochizuki, T. Growth and yield of six rice cultivars under three water-saving cultivations. Plant Prod. Sci. 2009, 12, 514–525. [Google Scholar] [CrossRef]
- Aide, M.T. Rice production with restricted water usage: A global perspective. Egypt. J. Agron. 2019, 41, 197–206. [Google Scholar] [CrossRef]
- U.S. EPA. “Method 3050B: Acid Digestion of Sediments, Sludges, and Soils”, Revision 2; U.S. Environmental Protection Agency: Washington, DC, USA, 1996.
- Menalled, F.D.; Gross, K.L.; Hammond, M. Weed aboveground and seedbank community responses to agricultural management systems. Ecol. Appl. 2001, 11, 1586–1601. [Google Scholar] [CrossRef]
- Shelef, O.; Weisberg, P.J.; Provenza, F.D. The value of native plants and local production in an era of global agriculture. Front. Plant Sci. 2017, 8, 2069. [Google Scholar] [CrossRef] [PubMed]
- Dwomoh, J.; Ofori, S.A.; Frimpong, D.K.; Osei, C.N.; Adongo, E.; Appiah, S. Invasive Plant Species in Ghana: Route of Spread, Socio-Economic and Environmental Impact. Asian J. Environ. Ecol. 2023, 20, 19–28. [Google Scholar] [CrossRef]
- Ismail, A.M.; Johnson, D.E.; Ella, E.S.; Vergara, G.V.; Baltazar, A.M. Adaptation to flooding during emergence and seedling growth in rice and weeds, and implications for crop establishment. AoB Plants 2012, 2012, pls019. [Google Scholar] [CrossRef] [PubMed]
- Mitrushev, I.; Marinov-serafimov, P.; Andreevska, D.; Andov, D.; Glatkova, G.; Spaseva, B. Allelopathic potential of some weeds in the rice fields of the kochani region. J. Agric. Food Environ. Sci. 2022, 76, 35–44. [Google Scholar] [CrossRef]
- Recasens, J.; Calvet, V.; Cirujeda, A.; Conesa, J.A. Phenological and demographic behaviour of an exotic invasive weed in agroecosystems. Biol. Invasions Sci. 2005, 7, 17–27. [Google Scholar] [CrossRef]
- Singh, R.K.; Singh, S.R.K.; Gautam, U.S. Weed control efficiency of herbicides in irrigated wheat (Triticum aestivum). Indian Res. J. Ext. Educ. 2013, 13, 126–128. [Google Scholar]
- Fogliatto, S.; Milan, M.; Papandrea, G.; Vidotto, F. A Survey of Weed Distribution in Italian Rice Fields Related to Agronomic Techniques. In Proceedings of the 51st Conference of the Italian Society of Agronomy, Padua, Italy, 19–21 September 2022. [Google Scholar]
- Dossou-Yovo, E.R.; Saito, K. Impact of management practices on weed infestation, water productivity, rice yield and grain quality in irrigated systems in Côte d’Ivoire. Field Crop Res. 2021, 270, 108209. [Google Scholar] [CrossRef]
- Jabran, K.; Chauhan, B.S. Weed management in aerobic rice systems. Crop Prot. 2015, 78, 151–163. [Google Scholar] [CrossRef]
- Kato, Y.; Okami, M.; Katsura, K. Yield potential and water use efficiency of aerobic rice (Oryza sativa L.) in Japan. Field Crop Res. 2009, 113, 328–334. [Google Scholar] [CrossRef]
- Kumawat, A.; Sepat, S.; Kumar, D.; Singh, S.; Jinger, D.; Bamboriya, S.D. Effect of Irrigation Scheduling and Nitrogen Application on Yield, Grain Quality and Soil Microbial Activities in Direct–Seeded Rice. Int. J. Curr. Microbiol. Appl. Sci. 2017, 6, 2855–2860. [Google Scholar] [CrossRef]
- MacLaren, C.; Storkey, J.; Menegat, A.; Metcalfe, H.; Dehnen-Schmutz, K. An ecological future for weed science to sustain crop production and the environment. A review. Agron. Sustain. Dev. 2020, 40, 24. [Google Scholar] [CrossRef]
- Zhong, W.; Cai, Z. Long-term effects of inorganic fertilizers on microbial biomass and community functional diversity in a paddy soil derived from quaternary red clay. Appl. Soil Ecol. 2007, 36, 84–91. [Google Scholar] [CrossRef]
- Ruppel, S.; Makswitat, E. Effect of nitrogen fertilization and irrigation on soil microbial activities and population dynamics—A field study. J. Plant Nutr. Soil Sci. 1999, 162, 75–81. [Google Scholar] [CrossRef]
- Belder, P.; Bouman, B.A.M.; Cabangon, R.; Guoan, L.; Quilang, E.J.P.; Li, Y. Effect of water-saving irrigation on rice yield and water use in typical lowland conditions in Asia. Agric. Water Manag. 2004, 65, 193–210. [Google Scholar] [CrossRef]
- Shao, G.; Cui, J.; Yu, S.; Lu, B.; Brian, B.J.; Ding, J. Impacts of controlled irrigation and drainage on the yield and physiological attributes of rice. Agric. Water Manag. 2015, 149, 156–165. [Google Scholar] [CrossRef]
- Davatgar, N.; Neishabouri, M.R.; Sepaskhah, A.R.; Soltani, A. Physiological and morphological responses of rice (Oryza sativa L.) to varying water stress management strategies. Int. J. Plant Prod. 2009, 3, 19–32. [Google Scholar]
- Sridhar, K.; Srinivas, A.; Kumar, K.A.; Prakash, T.R.; Rao, P.R. Influence of alternate wetting and drying irrigation and nitrogen levels on grain quality, soil fertility, nutrient uptake in rice genotypes during rabi season. Pharma Innov. J. 2022, 11, 1959–1965. [Google Scholar]
- Sahrawat, K.L. Organic matter accumulation in submerged soils. Adv. Agron. 2004, 81, 169–201. [Google Scholar]
- Ethan, S. Effect of flooding on Chemistry of Paddy soils: A Review. Int. J. Innov. Sci. Eng. Technol. 2015, 2, 414–420. [Google Scholar]
- Ullah, H.; Santiago-Arenas, R.; Ferdous, Z.; Attia, A.; Datta, A. Improving water use efficiency, nitrogen use efficiency, and radiation use efficiency in field crops under drought stress: A review. Adv. Agron. 2019, 156, 109–157. [Google Scholar]
- Cao, X.; Zhang, J.; Yu, Y.; Ma, Q.; Kong, Y.; Pan, W.; Jin, Q. Alternate wetting–drying enhances soil nitrogen availability by altering organic nitrogen partitioning in rice-microbe system. Geoderma 2022, 424, 115993. [Google Scholar] [CrossRef]
- Acosta-Motos, J.R.; Rothwell, S.A.; Massam, M.J.; Albacete, A.; Zhang, H.; Dodd, I.C. Alternate wetting and drying irrigation increases water and phosphorus use efficiency independent of substrate phosphorus status of vegetative rice plants. Plant Physiol. Biochem. 2020, 155, 914–926. [Google Scholar] [CrossRef]
- Patrick, W.H.; Khalid, R.A. Phosphate release and sorption by soils and sediments: Effect of aerobic and anaerobic conditions. Science 1974, 186, 53–55. [Google Scholar] [CrossRef]
- Peyron, M.; Bertora, C.; Pelissetti, S.; Said-Pullicino, D.; Celi, L.; Miniotti, E.; Sacco, D. Greenhouse gas emissions as affected by different water management practices in temperate rice paddies. Agric. Ecosyst. Environ. 2016, 232, 17–28. [Google Scholar] [CrossRef]
- Carrijo, D.R.; Lundy, M.E.; Linquist, B.A. Rice yields and water use under alternate wetting and drying irrigation: A meta-analysis. Field Crops Res. 2017, 203, 173–180. [Google Scholar] [CrossRef]
- Yin, Y.; Ying, H.; Zheng, H.; Zhang, Q.; Xue, Y.; Cui, Z. Estimation of NPK requirements for rice production in diverse Chinese environments under optimal fertilization rates. Agric. For. Meteorol. 2019, 279, 107756. [Google Scholar] [CrossRef]
- Pena, R.J.; Sayre, K.D.; Rajaram, S. CIMMYT’s genetic progress in wheat grain quality under four nitrogen rates. Crop Sci. 1997, 37, 892–899. [Google Scholar]
- Riste, K.; Gohain, T.; Kikon, N. Response of local rice (Oryza sativa L.) cultivars to recommended NPK fertilizer dose under upland rainfed conditions. Agric. Sci. Dig. 2017, 37, 10–15. [Google Scholar]
- Kamal, M.A.; Rasul, F.; Zohaib, A.; Ahmad, K.; Abbas, T.; Rasool, T.; Nawaz, M. Effect of NPK application at various levels on yield and quality of two rice hybrids. Sci. J. Seoul Sci. 2016, 4, 14–19. [Google Scholar]
- Mahmud, A.J.; Shamsuddoha, A.T.M.; Haque, M.N. Effect of organic and inorganic fertilizer on the growth and yield of rice (Oryza sativa L.). Nat. Sci. 2016, 14, 45–54. [Google Scholar]
- Khem, B.; Hirai, Y.; Yamakawa, T.; Mori, Y.; Inoue, E.; Okayasu, T.; Mitsuoka, M. NPK balances in whole crop rice cultivation under different application methods of manure and chemical fertilizer. J. Agric. Syst. Soc. 2018, 34, 87–99. [Google Scholar]
- Kumar, S.; Narjary, B.; Kumar, K.; Jat, H.S.; Kamra, S.K.; Yadav, R.K. Developing soil matric potential based irrigation strategies of direct seeded rice for improving yield and water productivity. Agric. Water Manag. 2019, 215, 8–15. [Google Scholar] [CrossRef]
- Garg, K.K.; Das, B.S.; Safeeq, M.; Bhadoria, P.B. Measurement and modelling of soil water regime in a lowland paddy field showing preferential transport. Agric. Water Manag. 2009, 96, 1705–1714. [Google Scholar] [CrossRef]
- Angelaki, A.; Bota, V.; Chalkidis, I. Estimation of Hydraulic Parameters from the Soil Water Characteristic Curve. Sustainability 2023, 15, 6714. [Google Scholar] [CrossRef]


| Soil Type | Bulk Density g cm−3 | pH | EC [mS m−1] | TC [g kg−1] | TN [g kg−1] | K [mg kg−1] | P [mg kg−1] | LOI [%] |
|---|---|---|---|---|---|---|---|---|
| Clay | 1.09 | 6.3 | 107.6 | 32.3 | 3.3 | 449 | 35.77 | 6.19 |
| Irrigations (IRs) | Applied Nutrients (NTs) | Nutrient Amount and Application Time |
|---|---|---|
| CI—Continuous flooding at a depth of 3 cm of water | No application (NT0)(kg ha−1) Nitrogen—0 Phosphorous—0 Potassium—0 | 1st application Nitrogen—50% Phosphorous—60% Potassium—50% (Before transplanting) |
| S—Near saturation but non-puddled with daily watering | Half of the recommended quantity (NT1) (kg ha−1) Nitrogen—40 Phosphorous—25 Potassium—30 | 2nd application Nitrogen—25% Phosphorous—40% Potassium—25% (14DAT) |
| 25P—Alternate wetting and drying; rewatering after reaching soil water potential of −25 kPa | Recommended quantity (NT2) (kg ha−1) Nitrogen—80 Phosphorous—50 Potassium—60 | 3rd application Nitrogen—25% Potassium—25% (18 days before the heading stage of rice) |
| 35P—Alternate wetting and drying; rewatering after reaching soil water potential of −35 kPa |
| Irrigation [IRs] | Nutrient [NTs] | No. of Tillers | No. of Panicles | No. of Spikelets Panicles−1 | 1000 Grains Weight [g] | Harvest Index [%] | IWUE [kg m−3] |
|---|---|---|---|---|---|---|---|
| CI | |||||||
| NT0 | 10.3 abc | 10.3 ab | 87.1 a | 20.36 a | 30.02 ab | 0.34 ab | |
| NT1 | 11.3 ab | 10.7 ab | 85.5 a | 20 a | 30.96 ab | 0.41 ab | |
| NT2 | 12 ab | 11.3 a | 82.1 a | 19.88 a | 28.15 ab | 0.41 ab | |
| S | |||||||
| NT0 | 9 bc | 9 ab | 87 a | 19.03 a | 38.37 a | 0.45 ab | |
| NT1 | 9.3 bc | 9.3 ab | 90.3 a | 19.39 a | 34.97 a | 0.5 ab | |
| NT2 | 11.7 ab | 11.7 a | 91.1 a | 19.56 a | 36.04 a | 0.64 a | |
| 25P | |||||||
| NT0 | 9.3 bc | 9 ab | 85.5 a | 18.77 a | 27.64 ab | 0.39 ab | |
| NT1 | 10 abc | 9.7 ab | 90 a | 19.76 a | 35.25 a | 0.56 ab | |
| NT2 | 11 ab | 10.7 ab | 82.3 a | 20.07 a | 39.47 a | 0.61 a | |
| 35P | |||||||
| NT0 | 7.67 c | 7.3 b | 85.5 a | 19.16 a | 18.02 b | 0.2 b | |
| NT1 | 10.3 abc | 10 ab | 87 a | 20.16 a | 32.19 ab | 0.55 ab | |
| NT2 | 13 a | 12.3 a | 87.1 a | 20.35 a | 30.55 ab | 0.6 a | |
| f-value | |||||||
| IR | 2.5 ns | 1.11 ns | 1.2 ns | 1.4 ns | 5.26 ** | 2.46 ns | |
| NT | 21.9 *** | 12.2 *** | 0.75 ns | 1.7 ns | 3.09 ns | 8.81 *** | |
| IR × NT | 2.2 ns | 1.5 ns | 0.6 ns | 0.39 ns | 2.17 ns | 1.13 ns |
| Irrigation [IRs] | Nutrient [NTs] | pH | EC [mS m−1] | LOI [%] |
|---|---|---|---|---|
| CI | ||||
| NT0 | 6.37 a | 386.67 a | 29.03 a | |
| NT1 | 6.35 a | 394.33 a | 28.47 a | |
| NT2 | 6.36 a | 373.33 a | 38.93 a | |
| S | ||||
| NT0 | 6.36 a | 390.33 a | 29.12 a | |
| NT1 | 6.29 ab | 389.33 a | 21.94 a | |
| NT2 | 6.24 ab | 331.67 a | 24.51 a | |
| 25P | ||||
| NT0 | 6.19 bc | 406.33 a | 19.82 a | |
| NT1 | 6.23 bc | 332 a | 21.85 a | |
| NT2 | 6.33 ab | 437.01 a | 23.68 a | |
| 35P | ||||
| NT0 | 6.15 bc | 420.67 a | 16.63 a | |
| NT1 | 6.09 c | 389.9 a | 22.75 a | |
| NT2 | 6.07 c | 360.33 a | 15.9 a | |
| f-value | ||||
| IR | 25.04 *** | 0.46 ns | 4.25 * | |
| NT | 0.5 ns | 1.3 ns | 0.23 ns | |
| IR × NT | 2.24 ns | 2.2 ns | 0.8 ns |
Disclaimer/Publisher’s Note: The statements, opinions and data contained in all publications are solely those of the individual author(s) and contributor(s) and not of MDPI and/or the editor(s). MDPI and/or the editor(s) disclaim responsibility for any injury to people or property resulting from any ideas, methods, instructions or products referred to in the content. |
© 2024 by the authors. Licensee MDPI, Basel, Switzerland. This article is an open access article distributed under the terms and conditions of the Creative Commons Attribution (CC BY) license (https://creativecommons.org/licenses/by/4.0/).
Share and Cite
Magar, S.T.; Fujino, T.; Han, T.K.K. Effect of Irrigation Regime and Soil Nutrients on the Growth of the Paddy Weed Heteranthera reniformis and Rice Grain Yield. Environments 2024, 11, 56. https://doi.org/10.3390/environments11030056
Magar ST, Fujino T, Han TKK. Effect of Irrigation Regime and Soil Nutrients on the Growth of the Paddy Weed Heteranthera reniformis and Rice Grain Yield. Environments. 2024; 11(3):56. https://doi.org/10.3390/environments11030056
Chicago/Turabian StyleMagar, Srijana Thapa, Takeshi Fujino, and Thant Ko Ko Han. 2024. "Effect of Irrigation Regime and Soil Nutrients on the Growth of the Paddy Weed Heteranthera reniformis and Rice Grain Yield" Environments 11, no. 3: 56. https://doi.org/10.3390/environments11030056
APA StyleMagar, S. T., Fujino, T., & Han, T. K. K. (2024). Effect of Irrigation Regime and Soil Nutrients on the Growth of the Paddy Weed Heteranthera reniformis and Rice Grain Yield. Environments, 11(3), 56. https://doi.org/10.3390/environments11030056