Article

Impact of Air Conditioning Type on Outdoor Ozone Intrusion into Homes in a Semi-Arid Climate

1
Department of Public Health, Brigham Young University, Provo, UT 84602, USA
2
Department of Civil and Construction Engineering, Brigham Young University, Provo, UT 84602, USA
*
Author to whom correspondence should be addressed.
Environments 2024, 11(10), 219; https://doi.org/10.3390/environments11100219
Submission received: 26 July 2024 / Revised: 29 September 2024 / Accepted: 1 October 2024 / Published: 7 October 2024

Abstract

:
Outdoor ozone (O3) is elevated on hot, sunny days when residential air conditioning is used most. We evaluated the impact of direct evaporative coolers (ECs) and vapor-compression air conditioners (ACs) on indoor O3 concentrations in homes (N = 31) in Utah County, Utah, United States of America. Indoor and outdoor O3 concentrations were measured for 24 h at each home using nitrite-impregnated glass-fiber filters. AC homes (n = 16) provided a protective envelope from outdoor O3 pollution. Only one AC home had O3 levels above the limit of detection (LOD). Conversely, EC homes (n = 15) provided minimal protection from outdoor O3. Only one EC home had O3 levels below the LOD. The average indoor O3 concentration in EC homes was 23 ppb (95% CI 20, 25). The indoor-to-outdoor (I/O) ratio for O3 in EC homes was 0.65 (95% CI 0.58, 0.72), while the upper bound for the I/O ratio for AC homes was 0.13 (p < 0.001). Indoor exposure to O3 for residents in EC homes is approximately five times greater than for residents of AC homes. Although ECs offer energy and cost-saving advantages, public health awareness campaigns in O3-prone areas are needed, as well as research into O3 pollution controls for direct ECs such as activated carbon filtration.

1. Introduction

Tropospheric (ground-level) ozone (O3) is a gas-phase secondary pollutant that forms primarily through the reaction of volatile organic compounds (VOCs) with nitrogen oxides (NOx) in the presence of sunlight [1,2]. Thus, outdoor O3 formation is favored during seasons with high solar intensity; in urban areas that are prone to anthropogenic emissions of VOCs and NOx [3]. O3 formation is also common in rural areas where there is sufficient regional transport of precursor gases (NOx and VOCs), or under low VOC transport conditions but with supplemental biogenic production of hydrocarbons, such as isoprene [4]. Because of the ongoing presence of precursor gases in ambient air and seasonally high solar activity in many locations globally, O3 readily forms in outdoor air.
O3 is a highly reactive oxidant, and it is therefore a potent respiratory tract irritant when inhaled. O3 exposure is associated with symptoms consistent with oxidative stress to the lungs and chronic obstructive pulmonary disease (COPD)-like symptoms, including decreased lung function, respiratory tract inflammation and constriction, coughing, difficult and painful breathing, and activation of the immune system [5,6,7,8,9]. Globally, O3 is estimated to cause more than 365,000 deaths and more than 6.2 million disability-adjusted life years (DALYs) annually [10].
The United States Environmental Protection Agency (USEPA) sets National Ambient Air Quality Standards (NAAQS) for certain air pollutant criteria, including O3. The 2015 O3 NAAQS is 70 ppb, and the design value is the “annual fourth-highest daily maximum 8 h concentration, averaged over 3 years” [11]. O3 concentrations vary seasonally and daily. The highest O3 concentrations generally occur during the summer when temperatures and solar intensity are highest, including in Utah County, Utah, United States of America (U.S./USA) as shown in Figure 1. In addition, O3 concentrations are highest during the afternoon when the temperatures and sunlight are most intense. (See Figure S1). Though improvements have been made to decrease O3 pollution in urban areas, over 115 million people live in areas in the U.S. that are in nonattainment of the 2015 NAAQS standard [12].
With few exceptions, including indoor use of products that employ corona discharge or ultraviolet photochemical technologies [3,14,15], residential O3 exposure occurs almost exclusively by intrusion or the exchange of indoor with outdoor air [3]. O3 intrusion occurs by three air change mechanisms. Infiltration is the natural process by which outdoor air pollutants enter residential buildings through gaps, cracks, or small openings in the building envelope. Pollutants can also enter buildings via natural ventilation through designed openings such as windows. Mechanical ventilation systems may also contribute to the intrusion of air pollutants [16]. A salient point, however, is that most ambient air quality data comes from outdoor monitoring stations, which may not reflect actual indoor or individual exposures [17,18]. Considering that children in the US, depending on age, spend 63–83% of their time indoors at home [19] and adults spend about 70% of their time indoors at home [20,21], indoor residential monitoring is warranted to more fully understand individual exposures.
To varying degrees, housing appears to provide a protective envelope to occupants from outdoor O3. A recent review found that median residential indoor O3 concentrations across approximately 1500 homes in the USA, Europe, and Asia were only about 25% of outdoor concentrations [3]. The loss rate of O3 in the indoor environment is thought to be driven primarily by air exchange rates, penetration losses, and ozone scavenging on indoor animate and inanimate surfaces [3,22]. One notable finding in this review is that home features appear to influence indoor O3 concentrations. For example, indoor-to-outdoor (I/O) ratios are higher in homes using natural ventilation (windows open) vs. air conditioning. O3 levels also dropped in homes during periods of indoor cooking with gas stoves, which produce NO and NO2 (NOx) [23]. A recent study found that NOx emissions from gas stoves are typically dominated by NO, which reacts with O3 to form NO2, thus reducing indoor O3 but forming NO2, which is also a toxic gas [24].
Because outdoor O3 concentrations are highest when air conditioning demand is highest, indoor residential O3 concentrations are likely influenced by air conditioning type. Vapor-compression air conditioners (ACs) are the most common form of air conditioning used in the U.S. [25]. ACs recirculate indoor air, and consequently, air changes per hour (ACH) in AC homes are typically less than 1.0 [26]. Infiltration is the primary mechanism for O3 entering AC homes because AC units do not intentionally draw outdoor air into the home. In contrast, mechanical ventilation is likely the primary mechanism for O3 to enter homes with direct evaporative cooler (ECs). ECs draw large volumes of outdoor air into homes, resulting in ACH ranging from ~8 to over 20 [27,28]. ECs are a common form of air conditioning used in arid and semi-arid regions. Approximately 1 million homes, primarily in the Western U.S., use ECs as the primary air conditioning equipment [29], and an additional 400,000 homes use ECs as secondary cooling equipment [25]. There is currently little published literature on the intrusion of outdoor air pollutants into EC homes, but it seems reasonable that ECs may be a pathway for outdoor O3 and other gas-phase pollutants to enter homes. A few studies have evaluated particle-phase pollutant intrusion into EC homes, showing I/O ratios ranging from approximately 0.5–0.6 for PM10 and 0.6–1.0 for PM2.5 [28,30,31]. In a companion paper, we evaluated the intrusion of PM2.5 in EC homes in Utah County, Utah [31]. Unlike O3, maximum PM2.5 concentrations do not consistently occur on hot summer days in Utah County (Figure S2). The purpose of this study was to evaluate differences in O3 infiltration/intrusion into homes based on air conditioning type.

2. Materials and Methods

2.1. Study Design

We evaluated indoor and outdoor O3 concentrations, temperatures, and relative humidity in 31 homes in Utah County using ACs (n = 16) or EC (n = 15) for residential cooling. Samples were collected over two summers, July–September 2022 and June–August 2023. Utah County is located at a high elevation (approximately 1400 m at the valley floor) in a semi-arid region (Figure S3). Utah County has a population of over 700,000 residents and grew by over 27% between the 2010 and 2020 censuses [32]. Utah County experiences hot dry summers, where both ECs and ACs are used to cool homes. In addition, Utah County has been designated by the USEPA as a marginal nonattainment area for O3 [33], meaning that its O3 design value (4th highest 8 h average O3 concentration averaged over 3 years) is between 71 and 81 ppb [34].
Study homes were recruited from July 2022–August 2023 by personal contact and flyers and emails distributed to university faculty and staff. We recruited participants until we sampled at least 15 AC and 15 EC homes. Study personnel administered a 13-item questionnaire to the primary home occupant to determine eligibility for the study (Table S1). For this study, the primary home occupant was defined as a person over the age of 18 who was the homeowner or primary renter. Example inclusion criteria were that the home: (1) must be a single-family dwelling, (2) must have an AC or EC air conditioning unit, (3) must be smaller than 4000 ft2 (371.6 m2), (4) must be located in Utah County, Utah, (5) home occupants must not use humidifiers, vaporizers, or air purifiers, (6) home occupants must not smoke or vape, and (7) home occupants must be willing to not cook in the home during sampling. Home occupants were compensated with 50 USD for their time and meal costs. Each primary home occupant was also asked to sign a video/photo release form, which permitted study personnel to take study-related photographs. Brigham Young University’s Institutional Review Board (IRB) reviewed the study and determined that because the unit of study was the home, and not the residents, the study did not require ethics review for research with human subjects.
A total of 47 sampling visits occurred over the course of the study in 31 homes, 16 with AC and 15 with EC units (Table 1). Each of the homes was intended to be sampled at least once; repeat measurements of some of the homes enabled us to evaluate the repeatability of O3 measurements at the same home across different days in the study. Eight of the homes had two visits with O3 measurements, and two homes (H02 and H16) had three O3 measurements (Tables S2 and S3). Repeat sampling of homes was driven primarily by PM2.5 measurements, including resampling two AC homes during a wildfire smoke event on 8 and 12 September 2022, as described in our companion paper [28]. Of the 47 visits, we only had two visits where we did not obtain O3 data (Tables S2 and S3). However, these were follow-up visits, and we obtained data from these homes for at least one visit.

2.2. Housing Questionnaire

During the initial visit, study personnel obtained written consent and administered a 24-item questionnaire about the home, which asked about factors such as the number of occupants, age, and size of the home, and type of air conditioning system being used. A few of the key characteristics are summarized in Table 1. The full set of questions is available in the Supplementary Materials (Table S4), and the responses are available in the data repository. At the end of the visit, the residents were administered a shortened questionnaire to determine if the users used their air conditioner or evaporative cooler and if they followed the study protocols. (Table S5).

2.3. O3 Measurement

Indoor and outdoor O3 concentrations were measured using the Occupational Safety and Health Administration (OSHA) method ID-214 [32]. The O3 sample is an integrated measurement, meaning we obtained a single O3 concentration for each of the indoor and outdoor locations at each home visit over an approximately 24 h sampling period. Each O3 sample was collected on double nitrite ( N O 2 )-impregnated glass fiber filters (IGFFs) housed in a three-piece 37 mm polystyrene cassette. Sampling media was purchased from SGS Galson Laboratories (SGS Galson, East Syracuse, NY, USA). As air is pulled through the cassette, O3 reacts with nitrite in the filters, converting it to nitrate by Equation (1):
N O 2 + O 3 N O 3 + O 2
Sampling cassettes were attached to Gilian LFS-113 low flow pumps (Sensidyne, LP St. Petersburg, FL, USA) with 1/8” (3.18 mm) inner diameter polyvinyl chloride (PVC) tubing. Cassettes were placed 1–1.5 m above the ground on tripods, as shown in Figure 2. The indoor tripods were placed away from cooling/heating vents in a central living area in the home, and the outdoor tripods were placed on the home property away from clothes dryer exhaust vents, aerosol-producing devices such as barbeque grills, and landscape sprinklers. Study personnel checked local weather reports before scheduling home visits to avoid sampling when rain was expected.
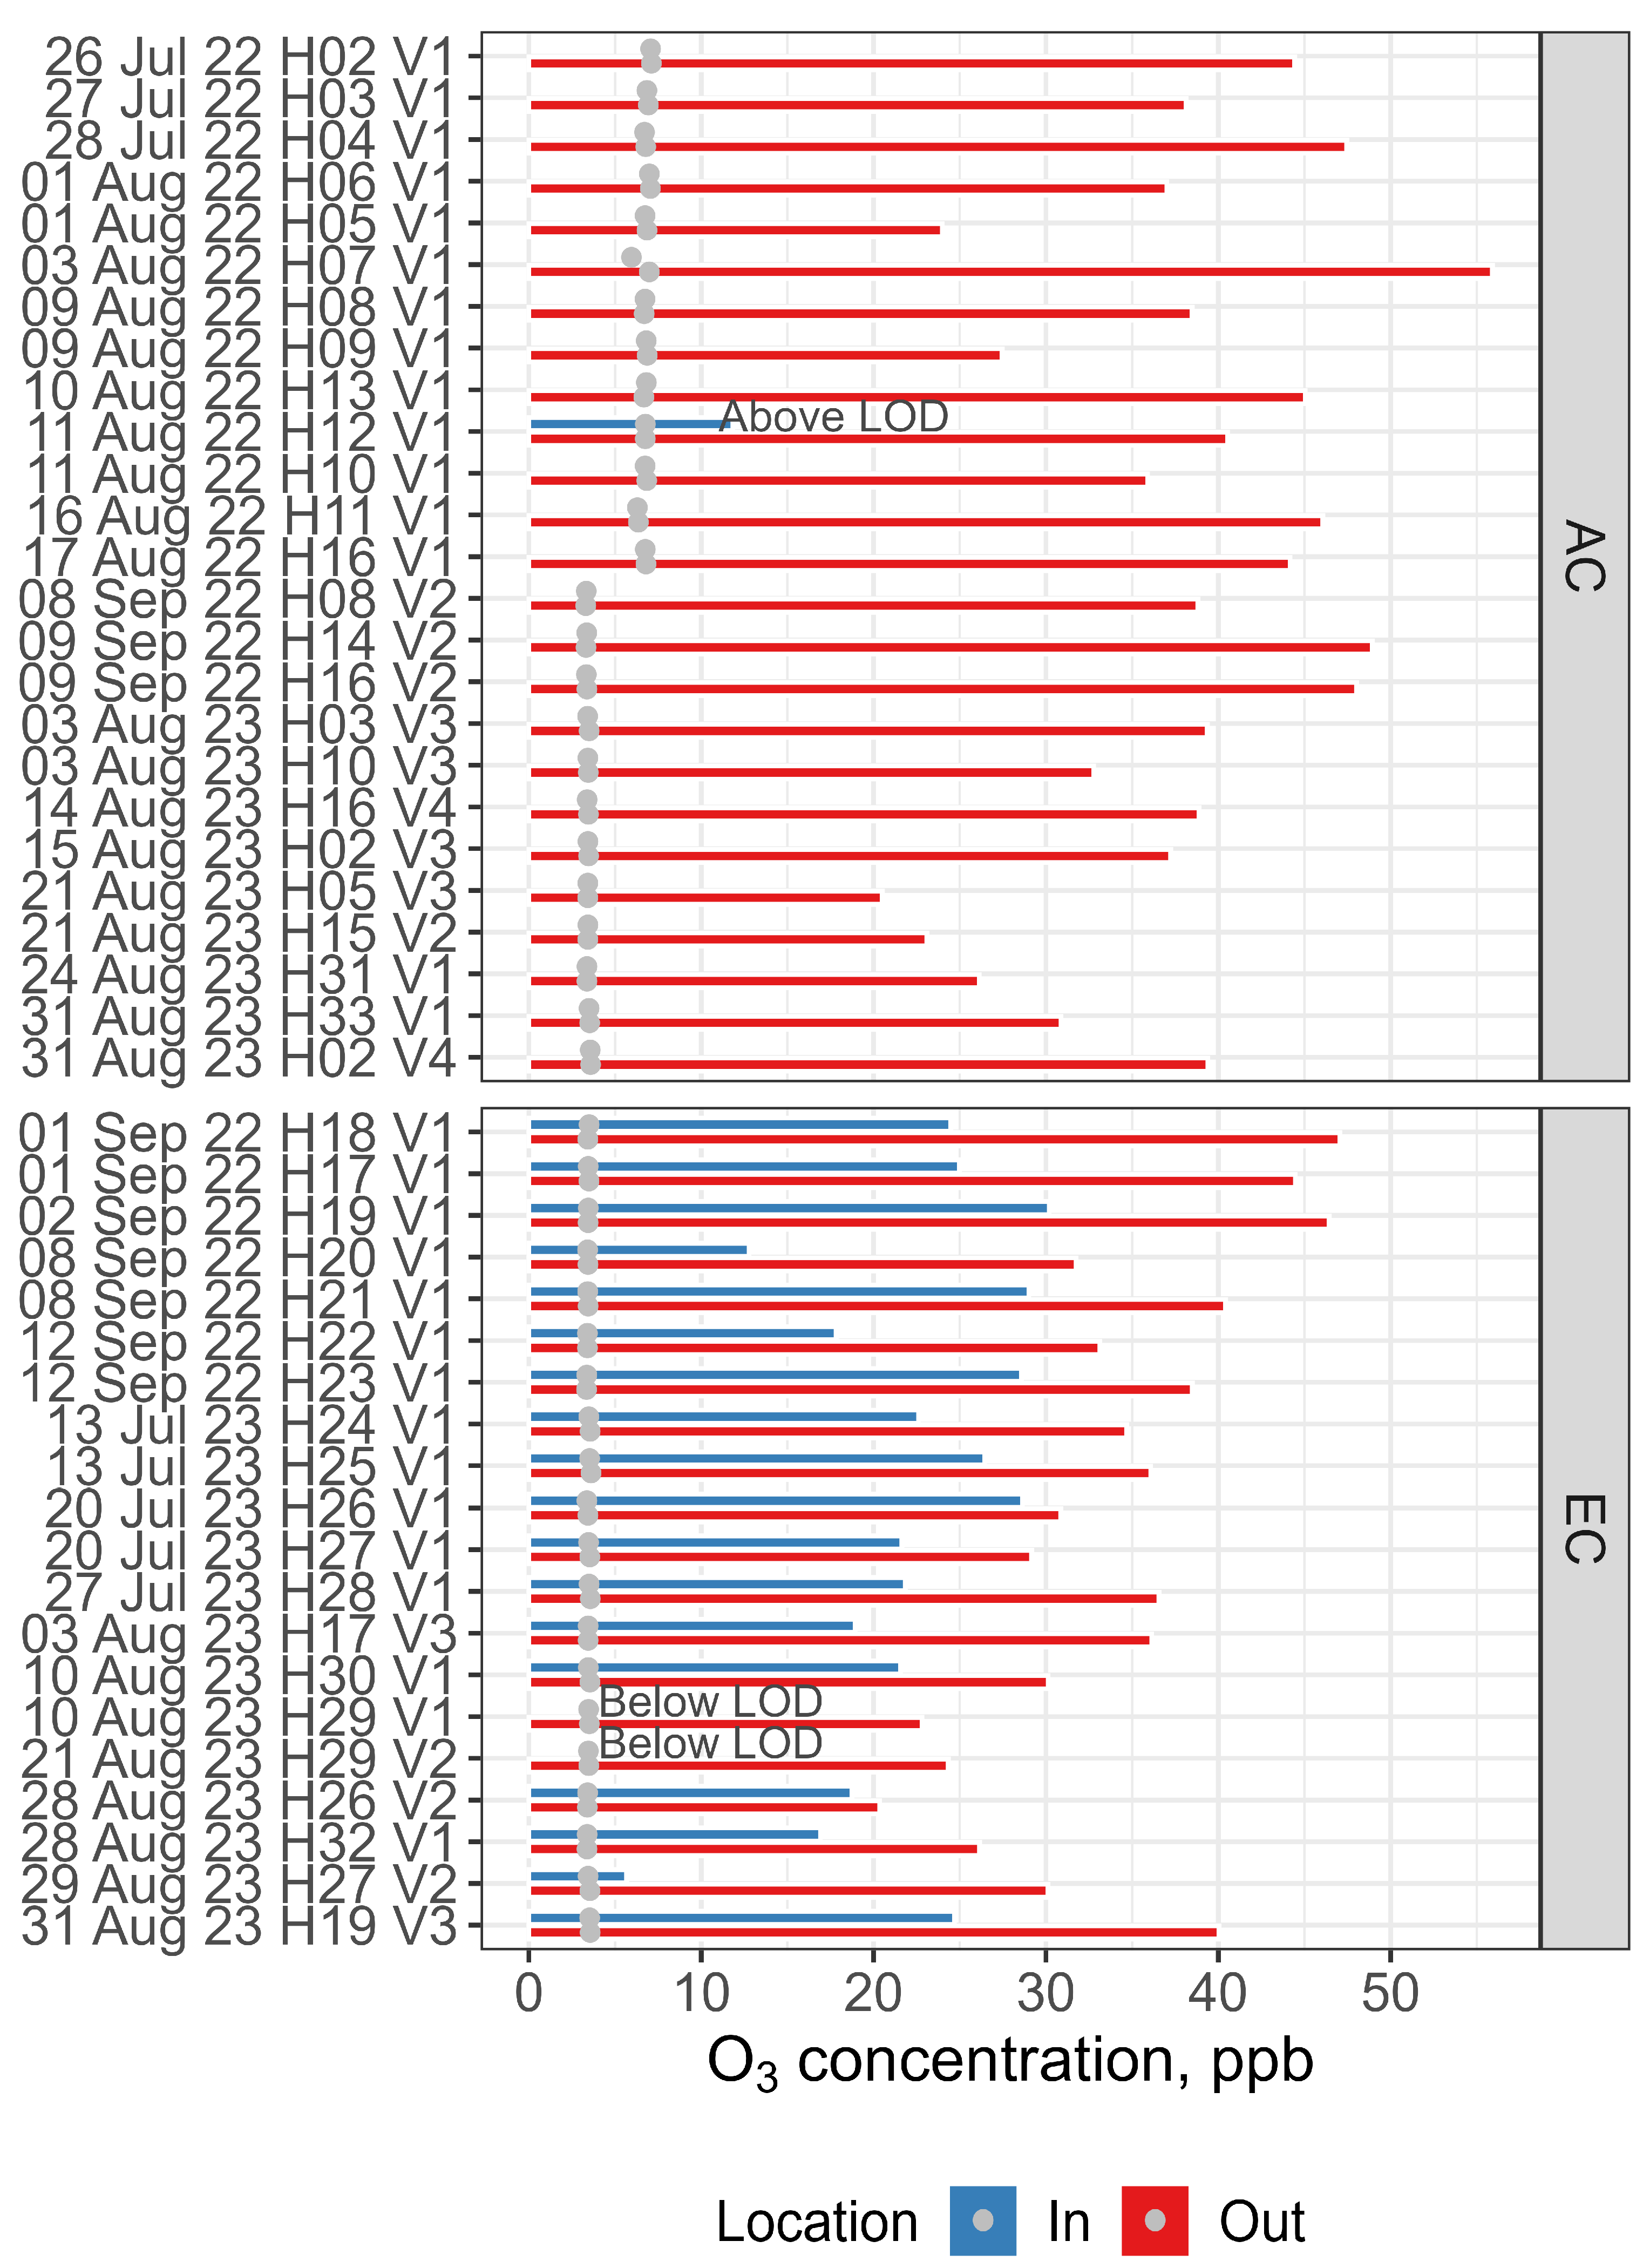
Sampling pumps ran continuously with a constant flow rate of 0.25 or 0.5 L/min over the 24 h period. Pumps were pre- and post-calibrated with representative media in-line using Defender 510 low flow calibrators (Mesa Laboratories, Inc. Lakewood, CO, USA). We set the flow rate to 0.25 L/min for the first two batches of O3 samples. In our initial batch, (homes 02 through 07) we did not observe any indoor samples above the limit of detection (LOD; Figure 3). We subsequently decided to sample at a 0.5 L/min flow rate for the duration of the study to decrease the LOD from ~7 ppb to ~3.5 ppb (Table S2). This included all measurements conducted after 17 August 2022. By so doing, we were able to quantify O3 concentrations down to ~3.5 ppb, including the indoor O3 concentration of 5.7 ppb sampled from H27 V2 on 29 August 2023 (Figure 3). At higher flow rates, our measurements could be biased low due to the increased chance of O3 breakthrough based on OSHA method ID-214 [32].
After sample collection, O3 cassettes were shipped to SGS Galson for analysis using a modified version of OSHA Method ID-214 [35]. The level of quantitation (LOQ) was determined according to the method using a 0.1 ppm detection limit standard. This standard was run with each batch of samples and minimally every 24 h. The LOQ was 4.0 µg for all samples. Method modifications, based on in-house studies, included desorbing samples in eluent rather than deionized H2O, dilution volume of 10 mL rather than 5 mL, increased desorption time from 15–30 min with mechanical shaking, background correction where the mass of O3 found on in-house media from the same lot is subtracted from sample mass rather than from blanks, decreased media expiration of 42 days rather than 45 days, use of 1.0 mM NaHCO3/8.0 mM Na2CO3 eluent rather than 3.5 mM Na2CO3/1.0 mM NaHCO3 eluent, and 1.0 mL/min rather than 1.2 mL/min flow rate, use of AS14A analytical column rather than Dionex AG14 guard column, use of 50 µL rather than 40 µL injection volume, daily verification of calibration curve, use of commercial rather than lab-prepared nitrate stock solution, use of 15–20 min helium sparging of eluent rather than 15 min sonicating, and use of in-house expiration guidelines for reagents with no specified expiration in the OSHA method. We calculated O3 concentrations in parts per billion (ppb) using the mass of N O 3 , the total volume of air sampled, and adjusting for ambient pressure (See Section S.7).

2.4. Temperature and Relative Humidity Measurement

During each home visit, we collected temperature and relative humidity indoors and outdoors using Extech SD500 temperature/relative humidity data loggers (Extech Instruments, Nashua, NH, USA). The temperature/relative humidity data loggers were attached to tripods by string and affixed 1–1.5 m off the ground (Figure 2). Data were collected every minute over a 24 h period.

2.5. Quality Assurance Steps

We calculated the sample bias of our outdoor O3 measurements using the nearest Utah Division of Air Quality (UDAQ) O3 monitors located in Lindon and Spanish Fork (Figure S3 and Table S6). As shown in Figure 1, the outdoor concentrations are relatively uniform across Utah County. We compared the hourly (Figures S4–S6) and daily average O3 concentrations (Figure S7) from the two UDAQ O3 monitors in Utah County for the days on which we collected samples. The O3 concentrations at the two monitors have a similar order of magnitude and are well correlated (R2 = 0.68). Assuming the O3 samplers used in our study have similar accuracy, we expected that the outdoor O3 concentrations measured at each of the study homes would be similarly correlated to the O3 concentrations measured at the nearest UDAQ monitor.
We compared the outdoor O3 concentrations measured at each of the homes in our study with the O3 concentrations from the nearest UDAQ monitor in Figure S8. The daily outdoor O3 concentrations measured at the study homes tended to be smaller than the concentrations measured at the UDAQ monitors. The mean normalized bias was less pronounced in 2022 (−7%) than in 2023 (−22%; Figure S9 and Table S7). For the samples collected in 2022, there was no noticeable difference in the bias between the samples with low and high flow rate (Figure S10). The correlation between the integrated samples and the 24 h average from the reference monitors was reasonable but lower than we expected (Figure S11). Despite having a larger negative bias in 2023, the correlation between the outdoor O3 samples in the study and the UDAQ monitors was better in 2023 (R2 = 0.41) than in 2022 (R2 = 0.20). The integrated O3 samples conducted in the study are less accurate and sensitive than the regulatory stationary O3 samples. Even still, we believe they can be used to detect the large differences in O3 concentrations observed in this study.
We compared the temperature and relative humidity data we collected using the Extech samplers to measurements from the Brigham Young University (BYU) weather station, as shown in Figures S12–S15 [36]. For the most part, the outdoor temperatures measured by the Extech at each of the homes and at the BYU weather station were very similar. However, the temperatures from our Extech outdoor samplers frequently had spikes of temperature in the afternoon that far exceeded normal ambient temperatures and the BYU weather station temperatures, often reaching above 50 or 60 Celsius (Figures S12 and S13). We believe this is due to the outdoor Extech samplers heating in the sun. As noted, we had a few days with missing or incomplete outdoor temperatures. To address both issues, we used the BYU weather station temperature in our study to represent the outdoor temperatures for all visits.
The relative humidity data collected from the outdoor Extech samplers compared well to the relative humidity measured from the BYU weather station (Figures S14 and S15). We did not notice a consistent bias for certain periods of the day, like we did for the temperature data. Because there did not appear to be a systematic bias, and to keep the relative humidity data consistent between the indoor and outdoor measurements, we retained the Extech relative humidity values for the outdoors. In cases of missing or incomplete data from the Extech samples for outside measurement, we used the BYU weather station as the source of the outdoor relative humidity for the cases listed in Table S8.

2.6. Data Analysis Steps

For each of the visits, we calculated the ratio of indoor to outdoor (I/O) O3 concentrations using Equation (2).
I n d o o r   t o   O u t d o o r   R a t i o   I / O = I n d o o r   O 3   C o n c e n t r a t i o n   ( p p b ) O u t d o o r   O 3   C o n c e n t r a t i o n   ( p p b )
The I/O ratio normalizes the indoor O3 concentration to the outdoor O3 concentration. The I/O ratio is a preferable metric to the absolute indoor O3 concentration because the outdoor O3 concentration can vary widely each day, and we only measured the indoor concentration at each home during one to three visits. The range of average 8 h O3 concentrations measured by the Lindon UDAQ monitor across the summer of 2022 and 2023 ranged by a factor of 2.7 (max/min = 76/28 ppb; Figure 1).
Another advantage of using the I/O ratio is it controls the measurement bias in our sample. As noted in the quality assurance section, the mean O3 concentrations were biased on average by −7% in 2022 and −22% in 2023. By assuming that the bias is proportional to O3 concentration, and that it impacts both our indoor and outdoor samples equally, the I/O ratio removes the measurement bias.
In cases where the O3 concentrations were below the LOD, we used the LOD as an upper limit of the indoor O3 concentration. In these cases, the reported I/O ratio is an estimate of the upper limit of the actual I/O ratio. In other words, the actual I/O ratio will likely be lower than reported. After calculating the I/O ratio for each home visit, we then calculated the average I/O ratio for each home using Equation (3).
χ j = 1 v j i = 0 v j I / O i
where:
  • xj is the mean I/O for home, j
  • I/Oi is the Indoor to Outdoor ratio of the 24 h integrated O3 concentrations for visit, i
  • vj is the total number of visits made at house, j (vj = 1, 2, or 3)
We then calculated the mean I/O ratio across all EC and AC homes, x ¯ k , from the home mean I/O values, xj, using Equation (4).
x ¯ k = 1 n k j = 0 n k x j
where:
  • x ¯ k is the mean I/O for homes with air conditioning type, k (k = AC or EC)
  • n k is the total number of homes with air conditioning type, k
We then calculated the 95% confidence intervals of the mean I/O for AC and EC homes, x ¯ k assuming the distribution of the mean, x ¯ k approximates a t-distribution in Equation (5).
x ¯ k ±   t / 2 , n k 1 · s d k n k
where:
  • is the type 1 error rate for a 100 1 confidence interval.
  • For a 95% confidence interval, = 0.05
  • t / 2 , n k 1 is the t-critical value based on the type I error rate and number of homes with air conditioning type, k
  • sdk is the sample standard deviation from homes with air conditioning type, k
We then calculated if the sample mean I/O ratio between AC and EC homes are significantly different using a two-sample t-test [37]. The results of the t-test and confidence intervals are robust if the random variables, xj, are independently and identically distributed. By averaging the repeat visits for each home in Equation (3), we avoid the dependence of repeat samples at each home and can treat the mean I/O ratio for each home, xj, as an independent random variable. In the results section, we also evaluate if the mean I/O, xj, are identically distributed. Our analyses were performed using R Statistical Software [38].

3. Results

The average indoor and outdoor O3 concentrations for the visits are displayed by date, house number, and visit number in Figure 3. Indoor O3 concentrations are missing for all but one of the AC homes in Figure 3 because they were below the LOD. The LOD decreases from ~7 to ~3.5 ppb for all visits conducted after 17 August 2022 due to the increase in the sample flow rate, as discussed previously. The indoor O3 concentrations from the EC homes were all above the LOD, except for two visits, both conducted at House 29.
Because O3 levels fluctuate during the day and night, the 24 h average concentrations are lower than the 8 h daily maximum concentrations. To place the 24 h integrated concentrations into the context of the NAAQS 8 h daily maximum standard, we compared average 24 h O3 concentrations with the average 8 h daily maximum concentrations from the Lindon and Spanish Fork monitors in the summer of 2022 and 2023 (Figure S16). On average, the 24 h concentrations were 74% and 79% of the 8 h daily maximum concentrations for the Lindon and Spanish Fork monitors, respectively (Tables S9 and S10). Using these ratios, the equivalent 24 h concentrations to an 8 h daily maximum concentration of 55 ppb (moderate AQI level) [13] is between 41 and 44 ppb and an equivalent 24 h standard to a 70 ppb concentration (NAAQS and the AQI level for unhealthy for sensitive groups) is between 52 and 55 ppb. We had one outdoor measurement (H07 V1) that was above the equivalent 24 h NAAQS level of 52 ppb, and eleven outdoor measurements above the equivalent moderate air quality standard of 41 ppb. All the indoor concentrations were below 30 ppb. However, as noted above, the integrated samples are biased low by 7% in 2022 and 23% in 2023. In addition, because we only sampled each home between one to three times, the indoor concentrations likely reached higher levels on days with higher O3 concentrations.
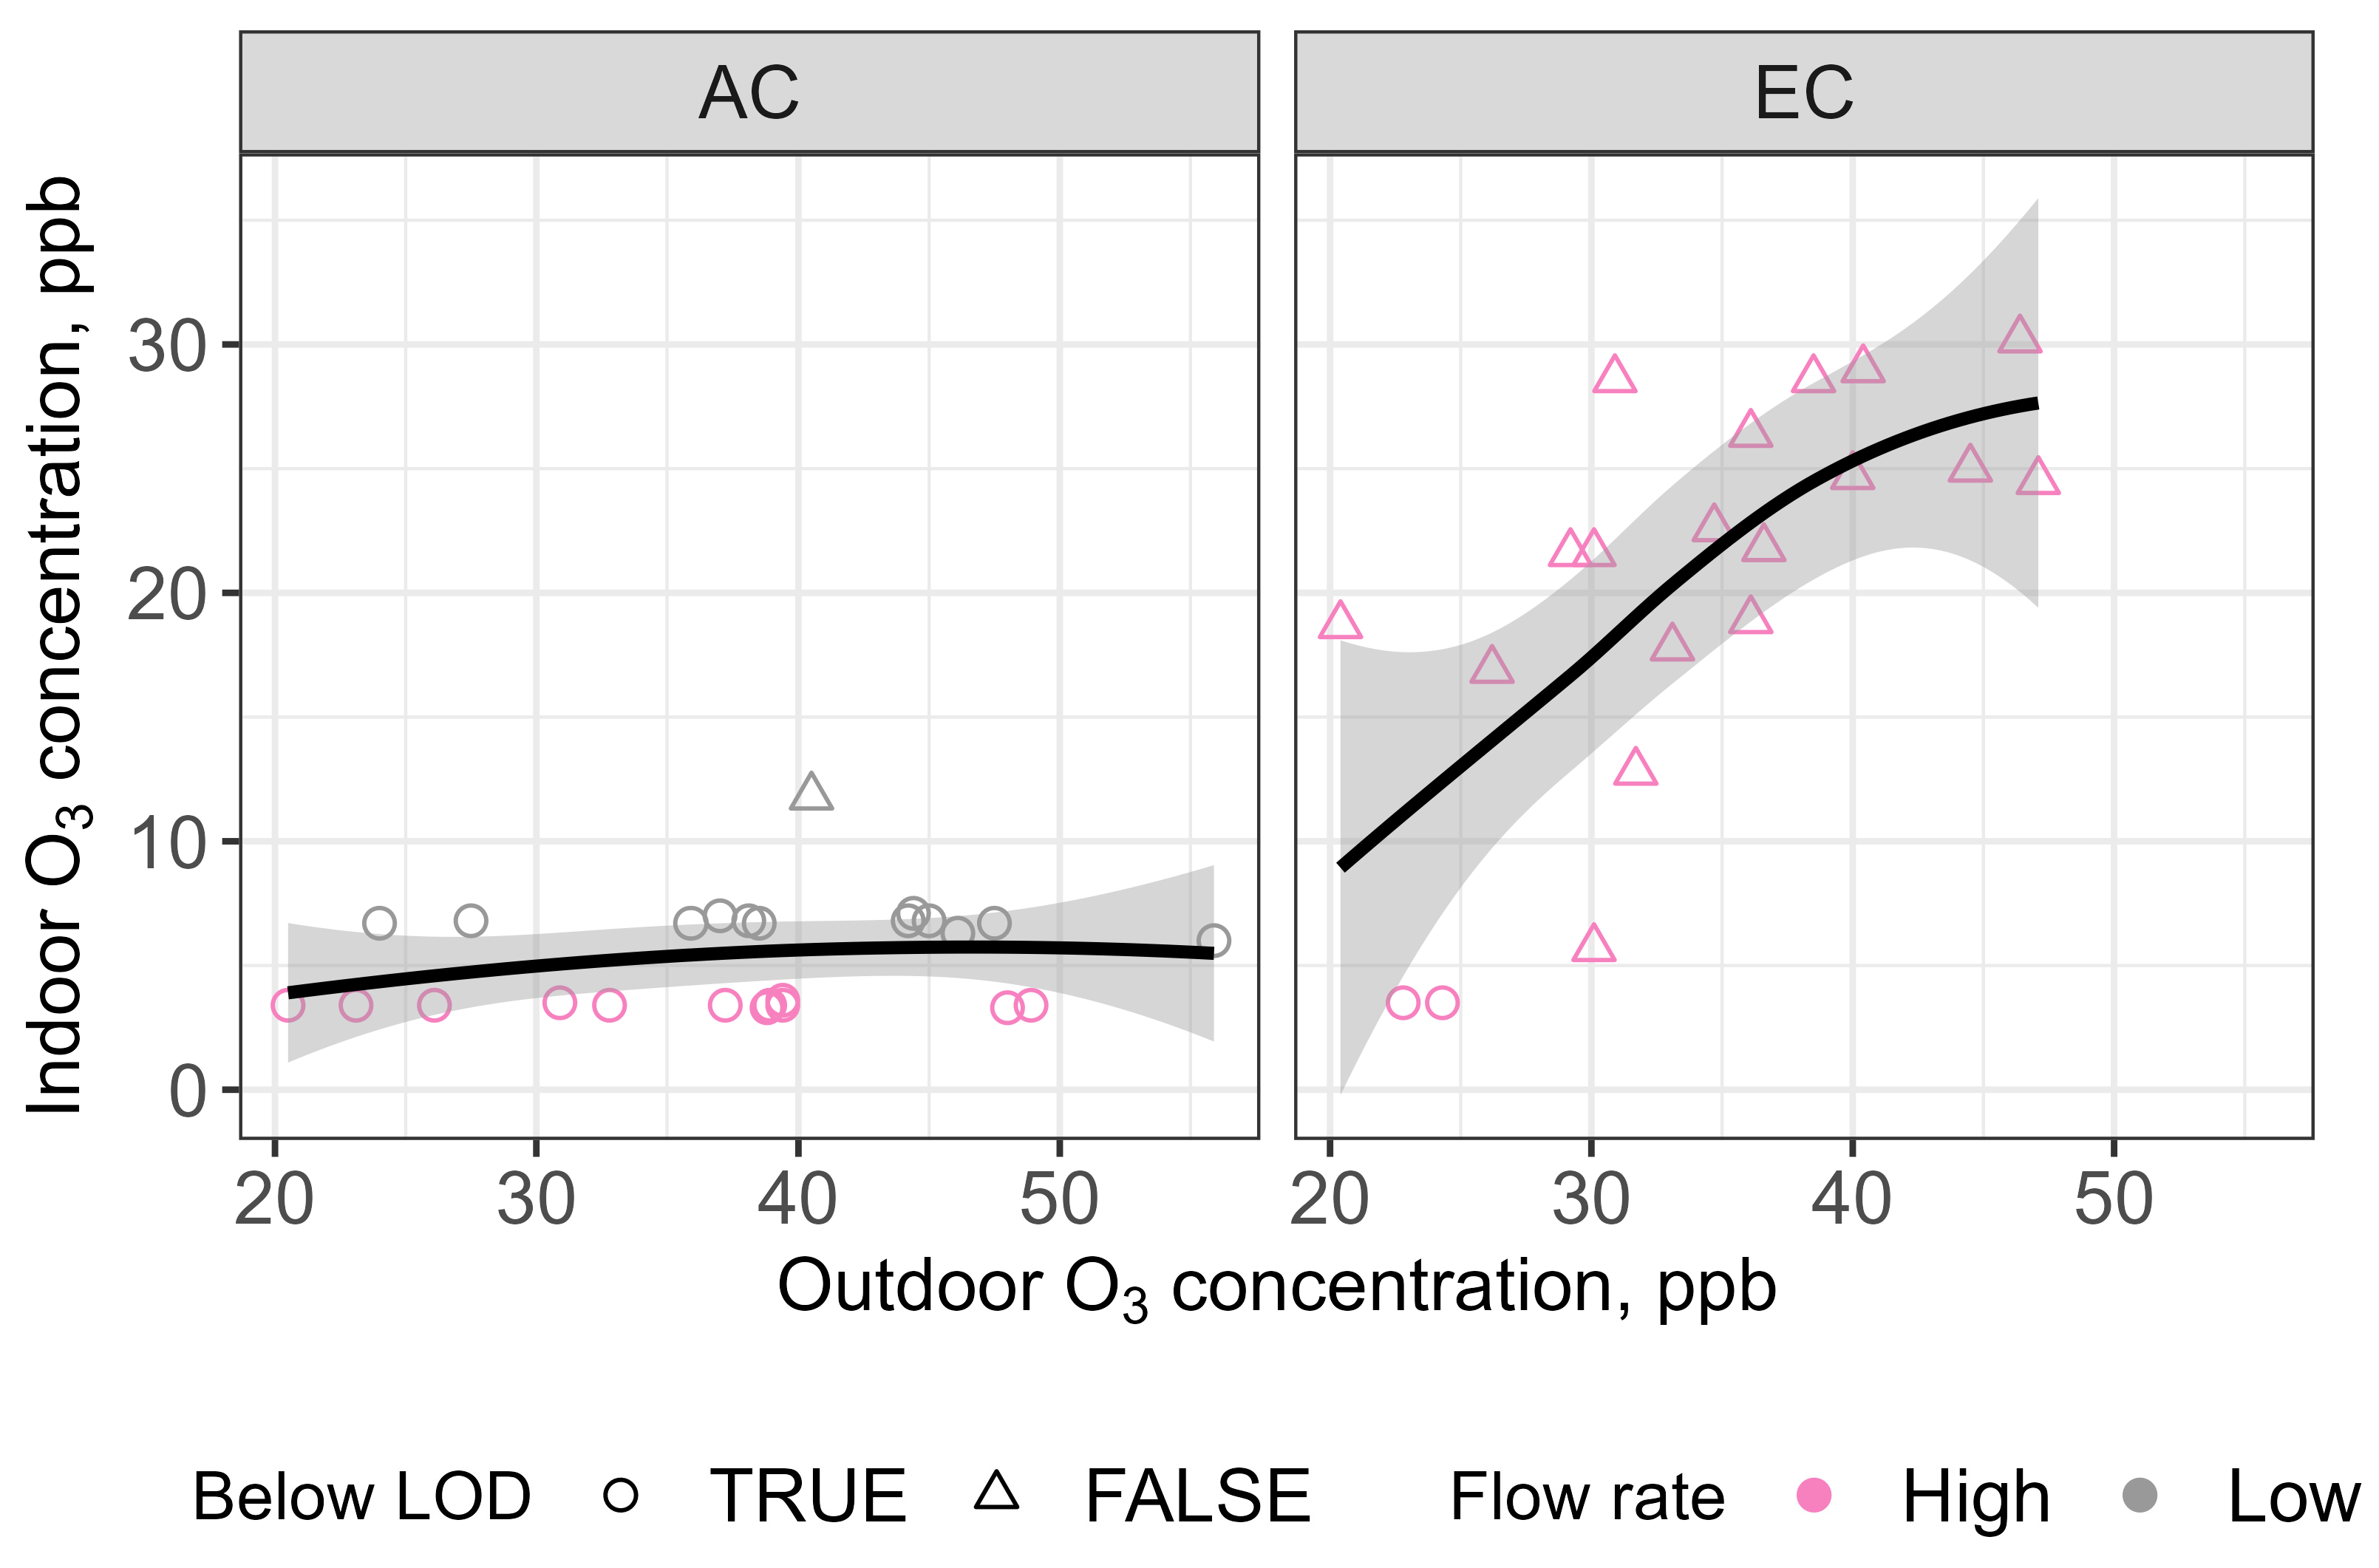
Figure 4 displays a scatterplot of the indoor and outdoor O3 concentrations organized by air conditioning type. In cases where the indoor concentration was below the LOD, we graphed the concentration using the LOD and labeled the point as being below the LOD. We also plotted a locally estimated scatterplot smoothing (LOESS) line to capture the trend of the data using the stats [39] and ggplot2 [40] R packages.
For the AC visits, no strong trend in indoor concentration and outdoor O3 concentration is observed. All but one visit (H12 V1) was below the LOD. The LOD does not vary with the outdoor O3 concentrations. The lower LOD is easily observed for the O3 samples made using the high flow rate (0.5 L/min) for measurements made after 17 August 2022. For the EC visits, there is a strong positive correlation between the indoor O3 concentration and the outdoor O3 concentration. As outdoor O3 concentrations increase, the indoor O3 concentrations also tend to increase.

3.1. Indoor/Outdoor Ratios

We calculated the indoor-to-outdoor ratio of the O3 concentrations using Equation (2). If the indoor concentration was below the LOD, we used the LOD as the value for the indoor concentration. Figure 5 displays the Indoor/Outdoor (I/O) ratio for each visit, organized by house number and type of air conditioning.
For the AC homes, the I/O ratios are consistently lower for the visits made with the high flow rate after 17 August 2022, due to the lower LOD. This is especially apparent for the same homes that were sampled with both the high and low flow rates. The actual indoor O3 concentration values for these visits are likely lower than the LOD, and the I/O ratios for these visits should be treated as an upper limit. The I/O ratios from individual visits to the AC homes range from 0.07 (H14) to 0.29 (H12). Because the LOD is the same among the AC homes measured with the same flow rate, the differences in the I/O ratios among AC homes measured with the same flow rate are only caused by variations in the outdoor O3 concentrations, with an exception for H12, which measured indoor O3 concentrations above the LOD. Thus, the variation among the I/O ratios of the AC homes with the same flow rate is quite small.
All indoor O3 measurements in EC homes were above the LOD, except for H29. For the EC homes, there is a wider range of I/O ratios. The I/O ratios ranges from 0.14 (H29) to 0.93 (H26), spanning a factor of 0.93/0.14 = 6.6 times. The repeat O3 I/O ratios made at each EC home are quite consistent, except for the two visits made at H27, which had very different I/O values.
We examined the characteristics of the homes with unique O3 I/O values observed in Figure 5. H12 was the only AC house with indoor O3 concentrations above the LOD. This home was among several that reported frequently opening windows on cooler days in the home survey. This house was also among several where the average indoor temperature was higher inside the home than outside the home (Table S11). For the first 12 h of the visit, the outdoor temperature was below 25 °C, and the average temperature was higher inside the home than outside the home (Figure S12). We suspect there was a higher penetration of outdoor O3 due to opened windows.
Both visits made to H27 had similar outdoor O3 concentrations (~30 ppb), but the second visit had a much lower indoor O3 concentration (6 ppb) than the first visit (22 ppb), as shown in Table S3. The average temperature for the first visit was lower inside than outside the house, but the average temperature for the second visit was 1.6 °C higher inside than outside the house (Table S12). In addition, the indoor relative humidity was 61% on the first visit, and only 34% on the second visit. We suspect that the resident was using the EC unit substantially less, or not at all, during the second visit. By reducing the use of the EC, the I/O ratio for that home fell within the range of values obtained from the AC homes.
Both indoor O3 measurements made at H29 were below the LOD. H29 was the only home that reported always using AC in addition to using their roof-top EC. We suspect that the low indoor concentration from this home could be due to the O3 monitor being located in a room that was conditioned primarily by the window AC units rather than by the roof-top EC unit.
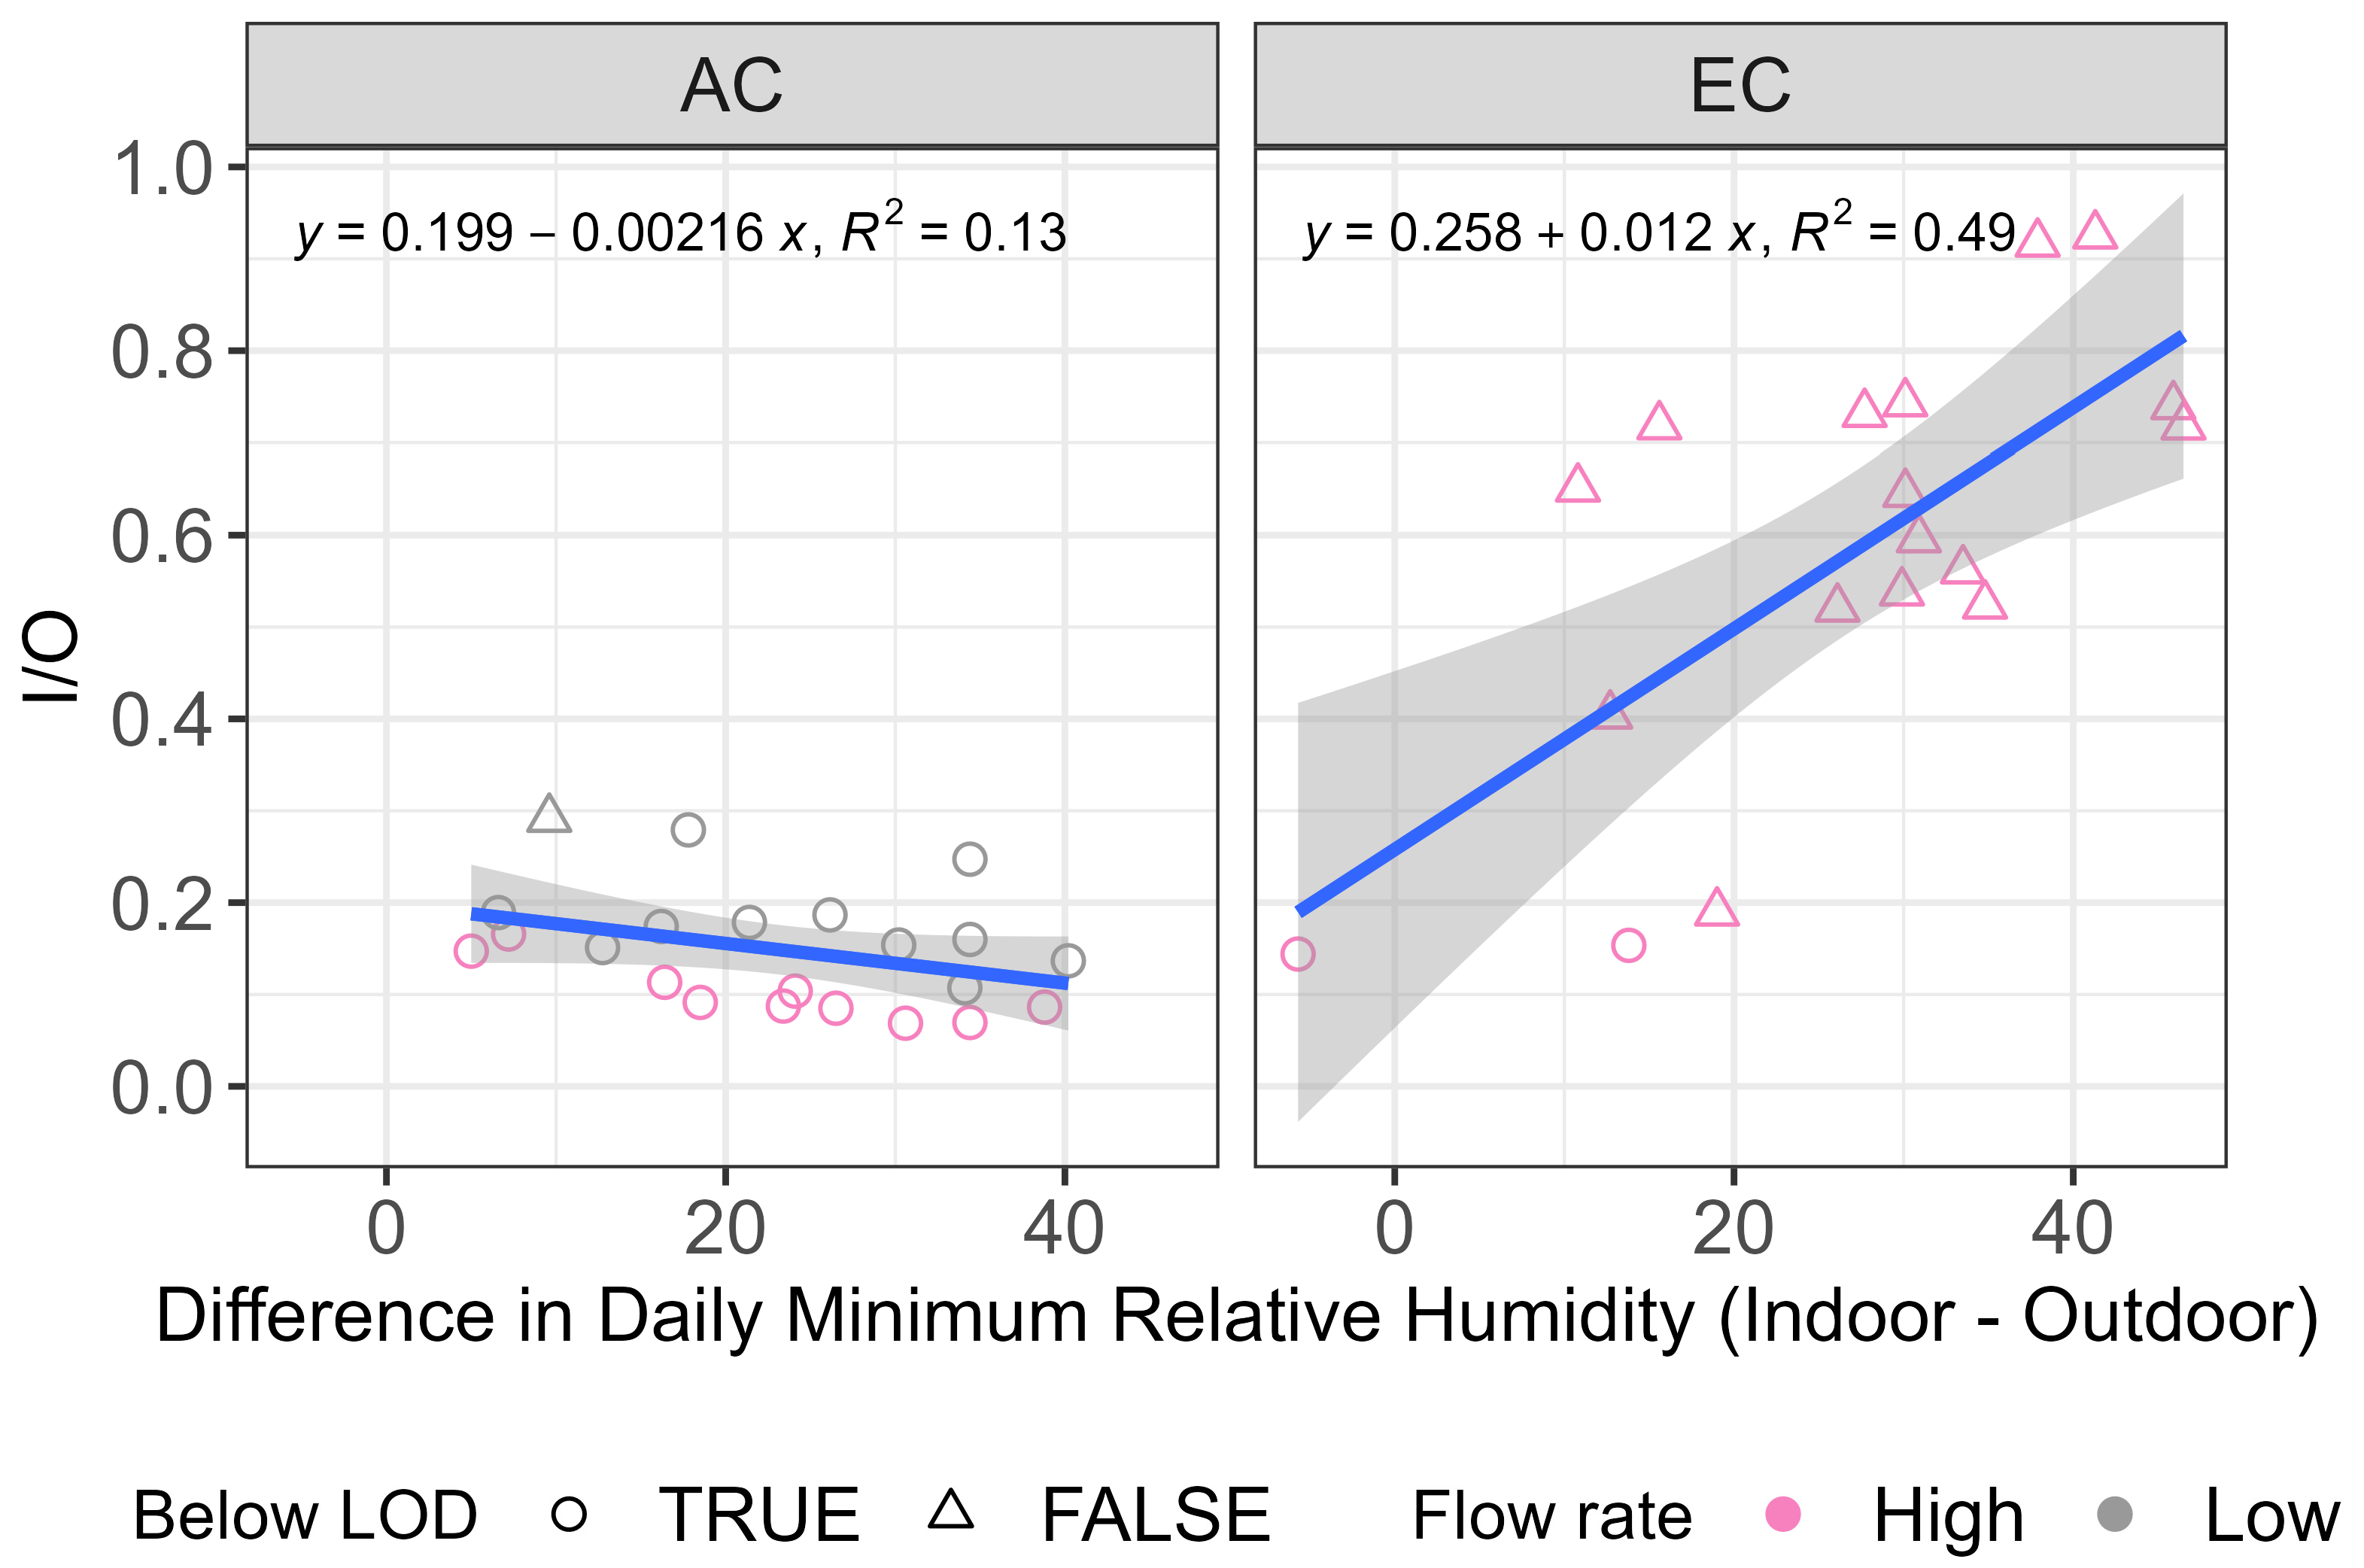
We examined if there were measured factors that could explain the large variability in the observed I/O values within the EC homes, including the presence of wildfire smoke (Figure S17), average outdoor temperature (Figure S18), and relative humidity (Figure S19). A slightly positive relationship appears to exist between the I/O ratio and average outdoor temperature, but no apparent relationship was observed with relative humidity or wildfire smoke. We hypothesized that the difference between the indoor and outdoor temperature and the difference between indoor and outdoor relative humidity could be better indicators of EC use and subsequent air exchange rates. We expected that when the EC is operating, the indoor temperature should be lower than the outdoor temperature, while the indoor relative humidity should be higher than the outdoors. As shown in Figures S14 and S15, the minimum outdoor humidity typically occurs in the afternoon, when O3 levels are at their peak (Figures S4–S6). Whereas humidity levels in EC homes tend to be higher during the afternoon when the residents are using the EC (Figure S15). We calculated the difference between the indoor and outdoor I/O ratios for the following factors: average temperature, daily maximum temperature (Figure S20), average relative humidity, and daily minimum relative humidity.
Of these, the strongest factor relating to the I/O ratio was the difference in the indoor and outdoor daily minimum relative humidity, as shown in Figure 6. In all but one visit, the minimum relative humidity was higher indoors than outdoors. The average increase in minimum relative humidity is higher in EC homes (27%) than in AC homes (21%; Tables S13 and S14). The two largest I/O values for EC homes (0.93 and 0.92) occurred when the increase in relative humidity was 38% and 47%, and the indoor maximum temperature was more than 10 °C lower than the outside temperature (Figure S22). The smallest three I/O values in EC homes all occurred when the increase in relative humidity was below 20%, including the visits made at H29, which utilized AC window units. This observation led us to conclude that the O3 monitor was located in a room that was conditioned primarily by the window AC units rather than by the roof-top EC unit. The increase in the minimum relative humidity explained nearly 50% of the variability in the observed I/O values from the EC homes from a linear model shown in Figure 6.
In Figure 7, we evaluated the O3 I/O ratio as a function of the outdoor O3 as measured by the closest UDAQ monitor. In general, the I/O ratio increases as the outdoor O3 increases. We attribute the positive relationship between I/O ratios and outdoor O3 to increased EC use on hot summer days that also have high O3 concentrations. Thus, O3 concentrations increase inside EC homes on days with high outdoor O3, due to both a larger magnitude of outdoor O3 concentrations, and a larger penetration of the available O3 due to increased use of ECs.

3.2. Representative I/O Ratios during Air Conditioning Use

We calculated the mean I/O ratio for each home, xj, and sampled it using Equation (3). For the AC homes that had visits measured at both the high and low flow rates (Figure 5), we only used the high flow rate visits to calculate the mean I/O ratio for each home because all these samples were below the LOD, which suggests that the visits with the lowest detection limit are likely closer to the actual I/O. On the other hand, we retained the I/O ratio from visits made at the low flow rate that were the only visits made at that home (H04, H06, H07, H11, H12, and H13). H12 measured indoor O3 concentrations above the LOD (Figure 3) at the low flow rate, and it is possible that AC homes can have indoor O3 concentrations between the high flow rate LOD (3.5 ppb) and the low flow rate LOD (7 ppb).
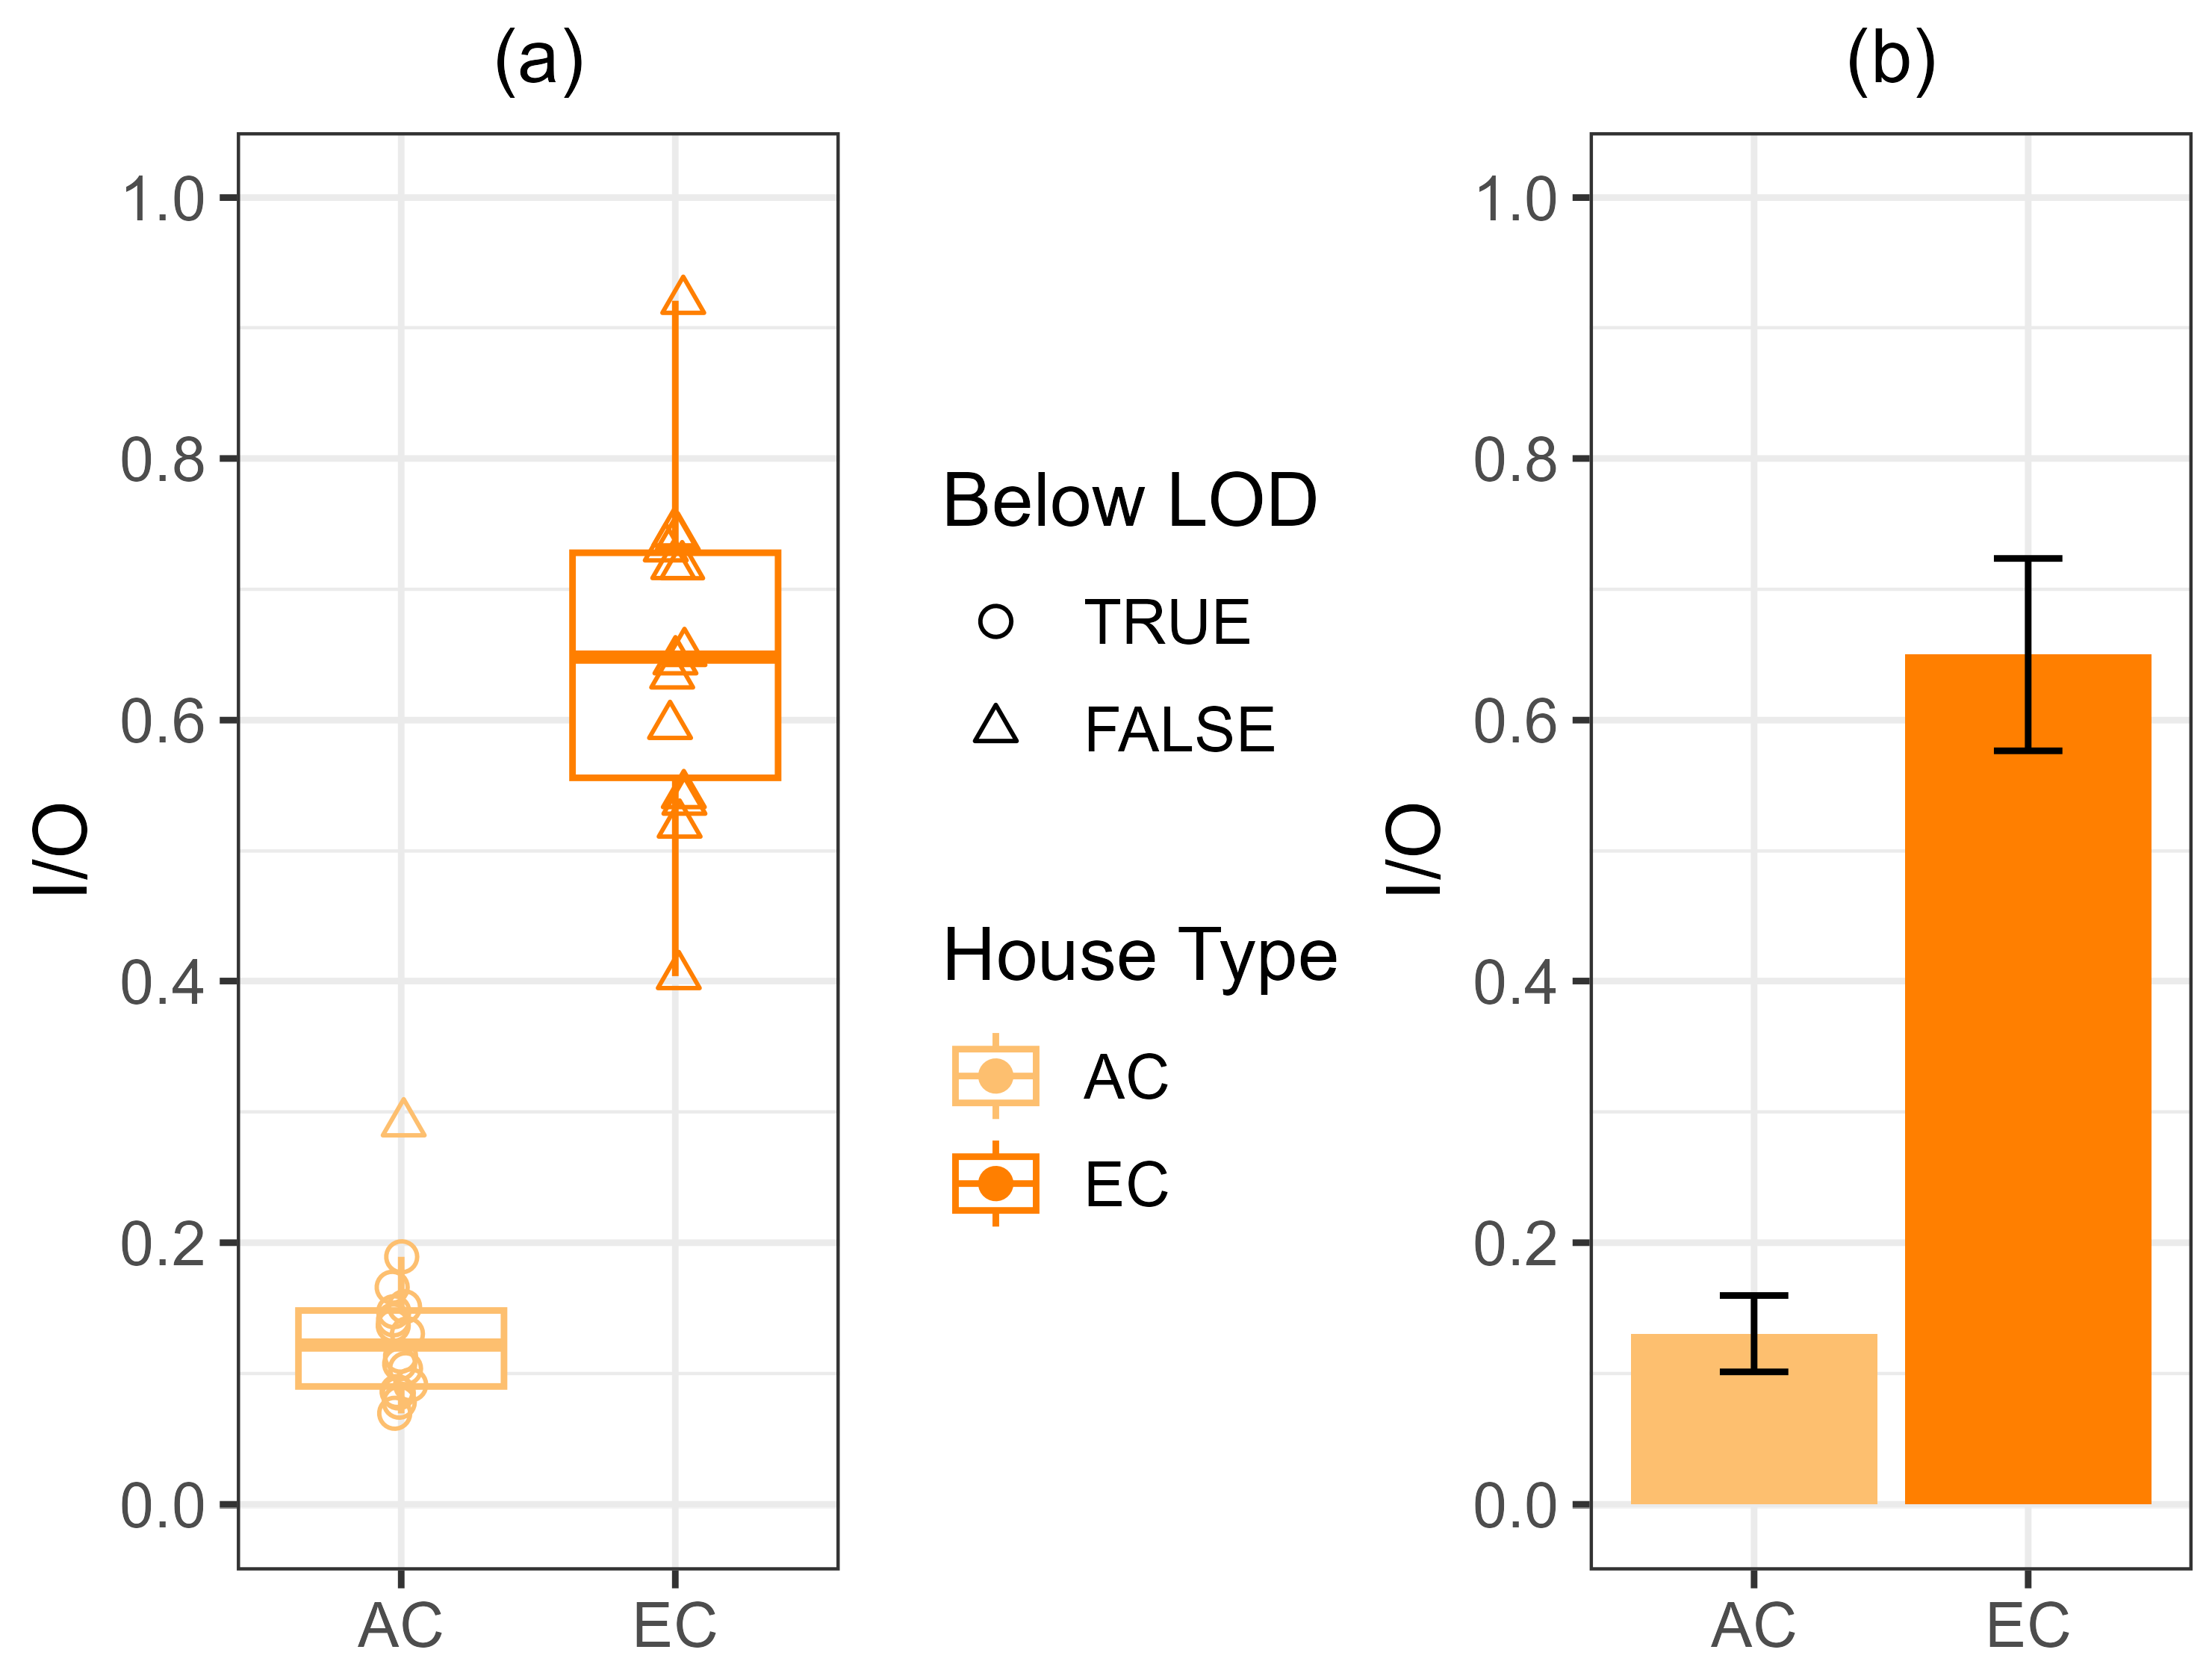
For the EC homes, we removed the visits that did not appear to be representative of EC use. We removed the two visits from H29 because the measurements from this house appeared more representative of window mounted vapor-compression air conditioning than the roof-mounted evaporative cooler. We also removed the second visit from H27, where the EC appears to have been minimally used. The resulting mean I/O ratio for each home, xj, in the revised data set are shown in Figure 8a.
We then used Equation (4) to calculate the mean I/O ratio for AC and EC homes, x ¯ k . By first averaging the per-visit I/O ratios into a single I/O ratio per home, we avoid the dependance of the repeat samples from each home on one another and can treat the per home I/O ratio as an independent identically distributed random variable, necessary to accurately calculate 95% confidence intervals of the sample mean. In addition, the distributions of the mean I/O, xj, for the individual AC and EC homes appear to be identically distributed (approximately normal), as shown in Figure 8. Because the mean I/O ratio for each home, xj, are approximately independent and identically distributed, the distribution of the mean I/O ratio across all AC or EC homes, x ¯ k should approximate a t-distribution, and the calculated confidence intervals and t-test results should be accurate.
The resulting mean I/O ratio and 95% confidence intervals of the mean, x ¯ k are shown in Figure 8b and Table S15. The mean I/O ratio from EC homes (0.65) is five times larger than the mean I/O ratio from AC homes (0.13). The difference between the two-sample means using a two-sided t-test is extremely statistically significant (p-value < two-sample; Table S16). The mean indoor concentrations of O3 for AC and EC homes are 4.9 ppb and 22.6 ppb, respectively (Table S17). The difference is also extremely statistically significant (p-value < 1 × 10⁻¹⁰; Table S18).

4. Discussion

In terms of energy use, evaporative cooling presents an attractive alternative to vapor compression air conditioning for homes in hot, dry climates. Direct ECs can operate on approximately 20–50% of the energy required by typical residential AC units [42,43,44]. Additionally, refrigerants such as R-22 used in older vapor compression ACs are responsible for the depletion of the protective ozone layer in the stratosphere and are also potent greenhouse gases [45]. Concerns about climate change appear to have prompted a renewed interest in evaporative cooling, as evidenced by several recent reviews that focus on issues surrounding EC performance [44,46,47].
Less attention has been given to the potential for ECs to pull outdoor air pollutants into homes. A small, albeit growing body of literature, suggests that ECs contribute to the intrusion of particle-phase pollutants into homes. These studies suggest that EC cooling pads capture some particle-phase pollutants, but their efficiency is inversely associated with particle cut-point size; specifically, the PM10 fraction is removed at a higher efficiency than the PM2.5 fraction [28,30,48]. Adding to our understanding of how ECs influence particle-phase pollution intrusion, a recent study by our team showed significantly higher intrusion/infiltration of PM2.5 in EC compared to AC homes during summer months [31]. However, a gap in the literature that remains, is understanding how EC units influence the intrusion of gas-phase pollutants in homes.
In general, our findings for O3 infiltration into AC homes were similar, although lower, than the median levels reported in a review article by Nazaroff and Weschler (2022) [3]. In their review, they found the median I/O ratio for O3 were 25%. Across approximately 1500 homes located in Asia, North America, and Europe, the median indoor O3 level was 6 ppb, whereas the outdoor O3 concentration was 22 ppb. However, for EC homes in our study, our findings were significantly higher, showing a mean I/O ratio of 0.60. Our findings for EC homes are similar to Raysoni et al. (2013), who showed I/O ratios for NO2 and aromatic hydrocarbons ranging from approximately 0.6–1.0 in two schools in El Paso, Texas, using ECs [49].
The disparity in O3 I/O ratios may be, at least partially, related to income. EC homes in our study were almost twice as old as AC homes. EC homes also tended to be renter-occupied, whereas AC homes were predominantly owner-occupied. Other residential environmental exposures, such as radon, have proven to be difficult for renters to mitigate because they often do not have the power to make changes to their housing. Studies show that homeowners are significantly more likely to test for and have knowledge of radon than non-homeowners [50,51,52]. Similarly, renters in EC homes may be more vulnerable to health effects associated with O3 intrusion but may have limited options for reducing their exposures. The large difference in the O3 intrusion/infiltration between EC and AC homes highlights a paradox in current Clean Air Act policies. As captured by Nazaroff and Weschler (2022) [3], “…whereas monitoring and regulations are applied outdoors, inhalation of air primarily occurs indoors”. U.S. adults and children spend most of their time indoors at home [19,20,21]. Outdoor air pollution is measured at the community level using fixed-site monitors, which do not account for the effect of housing on personal exposures [53,54]. Air conditioning type is illustrative of this problem. Using the USEPA 8 h standard for O3 (70 ppb), with an I/O ratio of 0.60, residents inside EC homes would be expected, on average, to be exposed to 46 ppb of O3 over the 8 h period, whereas residents inside AC homes would be expected to be exposed to less than 9 ppb of O3 over the same period. AC homes in our study provided an effective protective barrier from outdoor O3 that was not observed for EC homes. Current Clean Air Act policies do not take housing factors, such as air conditioning type, into account. Around one million homes, primarily in the southwest and Rocky Mountain states in the U.S., use ECs [25]. Additional studies are needed to understand if there are O3-related health effects associated with air conditioning type, particularly in arid and semi-arid urban areas with high outdoor pollution levels.
Our data showed a large variation in the measured I/O ratios among EC homes. The variation in I/O ratios was a strong function of EC usage, as indicated by the increase in the relative humidity indoors compared to outdoors. The average I/O factors we calculated were based over a 24 h period. However, these factors will likely be higher for EC homes, during the 8 h period with the highest O3 concentrations and temperatures. We observed a 24 h I/O ratio as high as 0.93 in our study. With an outdoor O3 concentration of 70 ppb, residents in this home would be expected to be exposed to at least 65 ppb of O3 over the 8 h period. Although somewhat anecdotal, home H12 was the only AC home in our study that had indoor O3 above the LOD [3].
The exchange of indoor with outdoor air is a strong driver of O3 concentrations inside residential buildings [3]. Outdoor air enters residential buildings, along with entrained gas and particle-phase pollutants, by infiltration through gaps or cracks in the building envelope or by natural or mechanical ventilation. A recent review of residential air exchange rates by Nazaroff (2020), which included ~10,000 U.S. and European homes, found a geometric mean of 0.5 ACH with an interquartile range of 0.3–0.7 ACH [3]. In contrast, the U.S. Department of Energy recommends sizing residential EC units to give 20 to 40 ACH [55]. The approximately two order of magnitude difference in ACH between EC and AC homes may prove to have important health ramifications. Studies show that living in a home with central air conditioning is associated with decreased risk of O3-related mortality, presumably because AC homes have low ACH and subsequently low infiltration of outdoor O3 [56,57]. Our findings suggest EC units pull high volumes of outdoor air into homes during daytime summer hours when O3 concentrations are at their peak. Air conditioning type, therefore, likely results in significant exposure disparities between residents of AC and EC homes during seasons and in locations with high outdoor O3 pollution.
For individuals without AC in O3-prone locations, including those using ECs or natural ventilation, activated carbon filters may help reduce indoor levels. Activated carbon filters have proven to be a cost-effective method for reducing O3 in non-residential buildings [3,58,59]. However, there is currently little published literature on the effectiveness of activated carbon for O3 mitigation in residential buildings. One residential study in China found no significant difference in O3 levels between using and not using portable air cleaners fitted with activated carbon filters [60]. Additional field studies are needed to determine the effectiveness and economic feasibility of indoor filtering of O3. Public health awareness campaigns could be encouraged targeting residents of EC homes in areas with high summertime O3 and PM2.5 concentrations. Residents susceptible to air pollution could be encouraged to replace their ECs with AC units. Interventions for low-income residents and renters may be more difficult. Public cooling centers could be considered as a possible intervention to protect these vulnerable people from both summertime heat and air pollution. However, cooling centers have been traditionally underutilized, and should be accompanied by other interventions focused on high risk groups [61].
The strengths of our study include that we controlled for indoor pollution sources, and collected outdoor comparison samples at each home. Quackenboss (1989) found that ECs lowered indoor PM for smokers due to high ACH, but did not account for the intrusion of outdoor pollution [62]. Our study design helped to identify the proportion of outdoor O3 that enters EC homes without interference from indoor sources. Our study was limited by using convenience sampling. This may have introduced bias into our sample, and as a result our study homes may not be representative of homes in the larger Utah County population area. Our results were also limited by the sensitivity of our O3 measurements. In our analyses, we were obliged to use the LOD for all but one of the AC homes. Thus, the indoor O3 concentrations for AC homes reported here are likely overestimates of the actual indoor levels.

5. Conclusions

Evaporative coolers have advantages of low-cost and low-energy use. They also do not require the use of refrigerants, that when leaked from refrigeration systems can contribute to climate change and depletion of the beneficial ozone layer in the stratosphere. In addition, in cases of high indoor air pollution (e.g., smoking or cooking), ECs may be beneficial, as discussed in our companion paper evaluating PM2.5 indoor air quality, in that they introduce large volumes of dilution air into the home. However, our findings suggest that occupants of homes with EC units who are particularly sensitive to O3, such as asthmatics and the elderly, may be at higher risk of indoor O3 exposure depending on location. We recommend they consider replacing their ECs with AC units that do not introduce large volumes of outdoor air into the home. We also recommend that additional research evaluate the effectiveness of interventions, such as activated carbon filters to reduce O3 exposure in EC homes.

Supplementary Materials

The following supporting information can be downloaded at: https://www.mdpi.com/article/10.3390/environments11100219/s1, S.1. Average temperature and ozone concentrations by hour of the day for summer 2022 and 2023 in Utah County, S.2. Outdoor daily mean PM2.5 concentrations at Lindon and Spanish Fork monitors from 2021 to 2023 in Utah County, S.3. Ariel view of Utah County showing Lindon and Spanish Fork air quality monitors, S.4. Questionnaire used to determine study eligibility, S.5. Summaries of ozone measurement data for homes with central air conditioning and evaporative coolers, S.6. Questionnaire used to collect information about study home characteristics, S.7. Description of calculations used to determine ozone concentration from home visits, S.8. Comparison of ozone measurements from study homes with measurements from Utah Division of Air Quality (UDAQ) Monitors, S.9. Indoor and outdoor temperature and relative humidity measurements at study homes, S.10. Summaries of 24-hr and 8-h ozone concentrations measured at the UDAQ monitoring stations in Lindon and Spanish Fork, Utah, S.11. Summary tables of temperature and relative humidity data from study homes, S.12. Indoor/outdoor ozone concentrations for each study home and visit, organized by air conditioning type, S.13. Summary statistics of the I/O ozone ratio and indoor ozone concentrations for study homes, organized by air conditioning type, S.14. Pictures of example air conditioning units from selected study homes, S.15. References [35,63,64,65,66,67].

Author Contributions

Conceptualization, J.D.J. and D.S.; methodology, J.D.J., S.V.R., J.W., H.J. and D.S.; validation, J.D.J. and D.S.; formal analysis, D.S., H.J.; investigation, J.D.J., S.V.R., J.W., H.J. and D.S.; resources, J.D.J. and D.S.; data curation, J.D.J. and D.S.; writing—original draft preparation, J.D.J., S.V.R., J.W., H.J. and D.S.; writing—review and editing, J.D.J., S.V.R., J.W., H.J. and D.S; visualization, D.S. and H.J.; supervision, J.D.J. and D.S.; project administration, J.D.J. and D.S.; funding acquisition, J.D.J. and D.S. All authors have read and agreed to the published version of the manuscript.

Funding

This work was supported in part by a College Undergraduate Research Award from Brigham Young University’s College of Life Sciences and an Experiential Learning Grant from the Ira A. Fulton College of Engineering.

Data Availability Statement

The data and analysis scripts are publicly available at https://github.com/darrell-sonntag/EvapCoolerUtahCounty, accessed on 28 September 2024. The information from the participant survey is also made available, except for any information which could be used to identify the homes in the study (address and home area).

Acknowledgments

Our special thanks to our research assistants, Paula Chanthakhoun, Royce P. Harline, Alisandra Olivares, Tyler C. Peterson, Julianna Stock, Jaxson Tadje, Braedon Tarone, Selah E. Willis, and Dallin Widowski, for their contributions to this work. We thank the residents for giving us access to their homes to collect the data reported herein. We also thank the anonymous Environments reviewers for their insightful and helpful suggestions.

Conflicts of Interest

The authors declare no conflicts of interest.

References

  1. Seinfeld, J.H.; Pandis, S.N. Atmospheric Chemistry and Physics: From Air Pollution to Climate Change; John Wiley & Sons, Incorporated: New York, NY, USA, 2016; Available online: http://ebookcentral.proquest.com/lib/byu/detail.action?docID=4462549 (accessed on 24 June 2022).
  2. Zhang, J.; Wei, Y.; Fang, Z. Ozone Pollution: A Major Health Hazard Worldwide. Front. Immunol. 2019, 10, 2518. Available online: https://www.frontiersin.org/journals/immunology/articles/10.3389/fimmu.2019.02518 (accessed on 7 July 2024). [CrossRef] [PubMed]
  3. Nazaroff, W.W.; Weschler, C.J. Indoor ozone: Concentrations and influencing factors. Indoor Air 2021, 32, e12942. [Google Scholar] [CrossRef] [PubMed]
  4. Logan, J.A. Ozone in rural areas of the United States. J. Geophys. Res. Atmos. 1989, 94, 8511–8532. [Google Scholar] [CrossRef]
  5. Nuvolone, D.; Petri, D.; Voller, F. The effects of ozone on human health. Environ. Sci. Pollut. Res. 2017, 25, 8074–8088. [Google Scholar] [CrossRef]
  6. Bello-Medina, P.C.; Rodríguez-Martínez, E.; Prado-Alcalá, R.A.; Rivas-Arancibia, S. Ozone pollution, oxidative stress, synaptic plasticity, and neurodegeneration. Neurol. (Engl. Ed.) 2021, 37, 277–286. [Google Scholar] [CrossRef]
  7. Rivas-Arancibia, S.; Hernández-Orozco, E.; Rodríguez-Martínez, E.; Valdés-Fuentes, M.; Cornejo-Trejo, V.; Pérez-Pacheco, N.; Dorado-Martínez, C.; Zequeida-Carmona, D.; Espinosa-Caleti, I. Ozone Pollution, Oxidative Stress, Regulatory T Cells and Antioxidants. Antioxidants 2022, 11, 1553. [Google Scholar] [CrossRef]
  8. Wiegman, C.H.; Li, F.; Ryffel, B.; Togbe, D.; Chung, K.F. Oxidative Stress in Ozone-Induced Chronic Lung Inflammation and Emphysema: A Facet of Chronic Obstructive Pulmonary Disease. Front. Immunol. 2020, 11, 1957. [Google Scholar] [CrossRef]
  9. Lodovici, M.; Bigagli, E. Oxidative Stress and Air Pollution Exposure. J. Toxicol. 2011, 2011, 487074. [Google Scholar] [CrossRef]
  10. Hu, W.; Yang, J. Effect of ambient ozone pollution on disease burden globally: A systematic analysis for the global burden of disease study 2019. Sci. Total. Environ. 2024, 926, 171739. [Google Scholar] [CrossRef]
  11. EPA, U.S. NAAQS Table. Available online: https://www.epa.gov/criteria-air-pollutants/naaqs-table (accessed on 16 May 2024).
  12. EPA, U.S. 8-Hour Ozone Nonattainment Area Summary. 2015. Available online: https://www3.epa.gov/airquality/greenbook/jnsum.html (accessed on 28 May 2024).
  13. EPA, U.S. Technical Assistance Document for the Reporting of Daily Air Quality—The Air Quality Index (AQI). EPA-454/B-24-002. Available online: https://document.airnow.gov/technical-assistance-document-for-the-reporting-of-daily-air-quailty.pdf (accessed on 1 May 2024).
  14. Guo, C.; Gao, Z.; Shen, J. Emission rates of indoor ozone emission devices: A literature review. Build. Environ. 2019, 158, 302–318. [Google Scholar] [CrossRef]
  15. Zhang, Q.; Jenkins, P.L. Evaluation of ozone emissions and exposures from consumer products and home appliances. Indoor Air 2017, 27, 386–397. [Google Scholar] [CrossRef]
  16. Stamp, S.; Burman, E.; Chatzidiakou, L.; Cooper, E.; Wang, Y.; Mumovic, D. A critical evaluation of the dynamic nature of indoor-outdoor air quality ratios. Atmos. Environ. 2022, 273, 118955. [Google Scholar] [CrossRef]
  17. Rodes, C.E.; Lawless, P.A.; Thornburg, J.W.; Williams, R.W.; Croghan, C.W. DEARS particulate matter relationships for personal, indoor, outdoor, and central site settings for a general population. Atmos. Environ. 2010, 44, 1386–1399. [Google Scholar] [CrossRef]
  18. Janssen, N.A.H.; Hoek, G.; Brunekreef, B.; Harssema, H.; Menswik, I.; Zuidhof, A. Personal sampling of particles in Adults: Relation among Personal, Indoor, and Outdoor Air Concentrations. Am. J. Epidemiol. 1998, 147, 537–547. [Google Scholar] [CrossRef]
  19. Hubal, E.A.C.; Sheldon, L.S.; Burke, J.M.; McCurdy, T.R.; Berry, M.R.; Rigas, M.L.; Zartarian, V.G.; Freeman, N.C. Children’s exposure assessment: A review of factors influencing Children’s exposure, and the data available to characterize and assess that exposure. Environ. Health Perspect. 2000, 108, 475–486. [Google Scholar] [CrossRef]
  20. Spalt, E.W.; Curl, C.L.; Allen, R.W.; Cohen, M.; Adar, S.D.; Stukovsky, K.H.; Avol, E.; Castro-Diehl, C.; Nunn, C.; Mancera-Cuevas, K.; et al. Time–location patterns of a diverse population of older adults: The Multi-Ethnic Study of Atherosclerosis and Air Pollution (MESA Air). J. Expo. Sci. Environ. Epidemiol. 2016, 26, 349–355. [Google Scholar] [CrossRef]
  21. Klepeis, N.E.; Nelson, W.C.; Ott, W.R.; Robinson, J.P.; Tsang, A.M.; Switzer, P.; Behar, J.V.; Hern, S.C.; Engelmann, W.H. The National Human Activity Pattern Survey (NHAPS): A resource for assessing exposure to environmental pollutants. J. Expo. Sci. Environ. Epidemiol. 2001, 11, 231–252. [Google Scholar] [CrossRef] [PubMed]
  22. Weschler, C.J. Roles of the human occupant in indoor chemistry. Indoor Air 2016, 26, 6–24. [Google Scholar] [CrossRef]
  23. Zhang, J.; Lioy, P.J. Ozone in residential air: Concentrations, I/O ratios, indoor chemistry, and exposures. Indoor Air 1994, 4, 95–105. [Google Scholar] [CrossRef]
  24. Lebel, E.D.; Finnegan, C.J.; Ouyang, Z.; Jackson, R.B. Methane and NOx Emissions from Natural Gas Stoves, Cooktops, and Ovens in Residential Homes. Environ. Sci. Technol. 2022, 56, 2529–2539. [Google Scholar] [CrossRef]
  25. U.S. Energy Information Administration (EIA); Residential Energy Consumption Survey (RECS). Table HC7.1 Air conditioning in U.S. Homes, by Housing Unit Type, 2020. 2023. Available online: https://www.eia.gov/consumption/residential/data/2020/hc/pdf/HC%207.1.pdf (accessed on 25 June 2024).
  26. Yamamoto, N.; Shendell, D.G.; Winer, A.M.; Zhang, J. Residential air exchange rates in three major US metropolitan areas: Results from the Relationship Among Indoor, Outdoor, and Personal Air Study 1999–2001. Indoor Air 2010, 20, 85–90. [Google Scholar] [CrossRef] [PubMed]
  27. Macher, J.M.; Girman, J.R. Multiplication of microorganisms in an evaporative air cooler and possible indoor air contamination. Environ. Int. 1990, 16, 203–211. [Google Scholar] [CrossRef]
  28. Li, W.-W.; Paschold, H.; Morales, H.; Chianelli, J. Correlations between short-term indoor and outdoor PM concentrations at residences with evaporative coolers. Atmospheric Environ. 2003, 37, 2691–2703. [Google Scholar] [CrossRef]
  29. United States Geological Survey. Evaporative Coolers Work Best in the Dry Areas of the U.S. (Area A). Available online: https://www.usgs.gov/media/images/evaporative-coolers-work-best-dry-areas-us-area-a (accessed on 25 June 2024).
  30. Paschold, H.; Li, W.-W.; Morales, H.; Walton, J. Laboratory study of the impact of evaporative coolers on indoor PM concentrations. Atmos. Environ. 2003, 37, 1075–1086. [Google Scholar] [CrossRef]
  31. Sonntag, D.B.; Jung, H.; Harline, R.P.; Peterson, T.C.; Willis, S.E.; Christensen, T.R.; Johnston, J.D. Infiltration of Outdoor PM2.5 Pollution into Homes with Evaporative Coolers in Utah County. Sustainability 2023, 16, 177. [Google Scholar] [CrossRef]
  32. U.S. Census Bureau QuickFacts: Utah County, Utah. Available online: https://www.census.gov/quickfacts/utahcountyutah (accessed on 19 May 2024).
  33. USEPA, Green Book | US EPA. Available online: https://www3.epa.gov/airquality/greenbook/jbcs.html#UT (accessed on 29 May 2024).
  34. EPA, U.S. Ozone Designation and Classification Information. Available online: https://www.epa.gov/green-book/ozone-designation-and-classification-information (accessed on 29 May 2024).
  35. OSHA, Ozone in Workplace Atmospheres ID-214. Occupational Safety and Health Administration, T-ID-214-02-0801-M. Available online: https://www.osha.gov/sites/default/files/methods/osha-id214.pdf (accessed on 1 January 2008).
  36. BYU Physics and Astronomy Weather Station. Available online: https://marvin.byu.edu/ (accessed on 24 May 2024).
  37. stats version, R: Student’s t-Test. Available online: https://stat.ethz.ch/R-manual/R-devel/library/stats/html/t.test.html (accessed on 24 July 2024).
  38. Team, R.C. R: A Language and Environment for Statistical Computing; R Foundation for Statistical Computing: Vienna, Austria, 2023; Available online: https://www.R-project.org/ (accessed on 16 June 2023).
  39. R: Local Polynomial Regression Fitting. Available online: https://stat.ethz.ch/R-manual/R-devel/library/stats/html/loess.html (accessed on 27 May 2024).
  40. Wickham, H. ggplot2: Elegant Graphics for Data Analysis; Springer: New York, NY, USA, 2016; Available online: https://ggplot2.tidyverse.org (accessed on 1 January 2008).
  41. A box and whiskers plot (in the style of Tukey)—Geom_boxplot. Available online: https://ggplot2.tidyverse.org/reference/geom_boxplot.html (accessed on 2 November 2023).
  42. Watt, J.R.; Brown, W.K. 1937-Evaporative Air Conditioning Handbook, 3rd ed.; Distributed by Prentice Hall, PTR; Lilburn, G.A., Ed.; Fairmont Press: Upper Saddle River, NJ, USA, 1997. [Google Scholar]
  43. Bom, G.J. Evaporative Air-Conditioning: Applications for Environmentally Friendly Cooling; in World Bank Technical Paper; no. 421; World Bank: Washington, DC, USA, 1999. [Google Scholar]
  44. Yang, Y.; Cui, G.; Lan, C.Q. Developments in evaporative cooling and enhanced evaporative cooling—A review. Renew. Sustain. Energy Rev. 2019, 113, 109230. [Google Scholar] [CrossRef]
  45. Bolaji, B.O.; Huan, Z. Ozone depletion and global warming: Case for the use of natural refrigerant—A review. Renew. Sustain. Energy Rev. 2012, 18, 49–54. [Google Scholar] [CrossRef]
  46. Kapilan, N.; Isloor, A.M.; Karinka, S. A comprehensive review on evaporative cooling systems. Results Eng. 2023, 18, 101059. [Google Scholar] [CrossRef]
  47. Tejero-González, A.; Franco-Salas, A. Optimal operation of evaporative cooling pads: A review. Renew. Sustain. Energy Rev. 2021, 151, 111632. [Google Scholar] [CrossRef]
  48. Paschold, H.; Li, W.-W.; Morales, H.; Pingitore, N.E.; Maciejewska, B. Elemental analysis of airborne particulate matter and cooling water in west Texas residences. Atmos. Environ. 2003, 37, 2681–2690. [Google Scholar] [CrossRef]
  49. Raysoni, A.U.; Stock, T.H.; Sarnat, J.A.; Sosa, T.M.; Sarnat, S.E.; Holguin, F.; Greenwald, R.; Johnson, B.; Li, W.-W. Characterization of traffic-related air pollutant metrics at four schools in El Paso, Texas, USA: Implications for exposure assessment and siting schools in urban areas. Atmos. Environ. 2013, 80, 140–151. [Google Scholar] [CrossRef]
  50. Larsson, L.S. Risk-Reduction Strategies to Expand Radon Care Planning with Vulnerable Groups. Public Health Nurs. 2014, 31, 526–536. [Google Scholar] [CrossRef] [PubMed]
  51. Larsson, L.S.; Butterfield, P.; Hill, W.G.; Houck, G.; Messecar, D.C.; Cudney, S. Radon Testing for Low-Income Montana Families. Available online: https://aarst.org/proceedings/2011/RADON_TESTING_FOR_LOW-INCOME_MONTANA_FAMILIES.pdf (accessed on 7 July 2024).
  52. Hill, W.G.; Butterfield, P.; Larsson, L.S. Rural Parents’ Perceptions of Risks Associated with Their Children’s Exposure to Radon. Public Health Nurs. 2006, 23, 392–399. [Google Scholar] [CrossRef] [PubMed]
  53. Avery, C.L.; Mills, K.T.; Williams, R.; McGraw, K.A.; Poole, C.; Smith, R.L.; Whitsel, E.A. Estimating Error in Using Residential Outdoor PM2.5 Concentrations as Proxies for Personal Exposures: A Meta-analysis. Environ. Health Perspect. 2010, 118, 673–678. [Google Scholar] [CrossRef]
  54. Wheeler, A.J.; Xu, X.; Kulka, R.; You, H.; Wallace, L.; Mallach, G.; Van Ryswyk, K.; MacNeill, M.; Kearney, J.; Rasmussen, P.E.; et al. Windsor, Ontario Exposure Assessment Study: Design and Methods Validation of Personal, Indoor, and Outdoor Air Pollution Monitoring. J. Air Waste Manag. Assoc. 2011, 61, 142–156. [Google Scholar] [CrossRef]
  55. Department of Energy, U.S. Evaporative Coolers. Energy.gov. Available online: https://www.energy.gov/energysaver/evaporative-coolers (accessed on 28 September 2024).
  56. Smith, R.L.; Xu, B.; Switzer, P. Reassessing the relationship between ozone and short-term mortality in U.S. urban communities. Inhal. Toxicol. 2009, 21, 37–61. [Google Scholar] [CrossRef]
  57. Charles, J.W. Ozone’s Impact on Public Health: Contributions from Indoor Exposures to Ozone and Products of Ozone-Initiated Chemistry. Environ. Health Perspect. 2006, 114, 1489–1496. [Google Scholar] [CrossRef]
  58. Shair, F. Relating indoor pollutant concentrations of ozone and sulfur dioxide to those outside: Economic reduction of indoor ozone through selective filtration of the make-up air. ASHRAE Trans. 1981, 87, 116–139. [Google Scholar]
  59. Weschler, C.J.; Shields, H.C.; Naik, D.V. Ozone-removal efficiencies of activated carbon filters after more than three years of continuous service. In Proceedings of the ASHRAE Annual Meeting, Orlando, FL, USA, 25–29 June 1994; in ASHRAE Transactions, 100. ASHRAE: Orlando, FL, USA, 1994; pp. 1121–1129. [Google Scholar]
  60. Barkjohn, K.K.; Norris, C.; Cui, X.; Fang, L.; Zheng, T.; Schauer, J.J.; Li, Z.; Zhang, Y.; Black, M.; Zhang, J.; et al. Real-time measurements of PM2.5 and ozone to assess the effectiveness of residential indoor air filtration in Shanghai homes. Indoor Air 2020, 31, 74–87. [Google Scholar] [CrossRef]
  61. Bedi, N.S.; Adams, Q.H.; Hess, J.J.; Wellenius, G.A. The Role of Cooling Centers in Protecting Vulnerable Individuals from Extreme Heat. Epidemiology 2022, 33, 611–615. [Google Scholar] [CrossRef]
  62. Quackenboss, J.J.; Lebowitz, M.D.; Crutchfield, C.D. Indoor-outdoor relationships for particulate matter: Exposure classifications and health effects. Environ. Int. 1989, 15, 353–360. [Google Scholar] [CrossRef]
  63. Google LLC. Google Earth Version 10.56.0.1. Available online: https://earth.google.com/web/ (accessed on 26 June 2024).
  64. Utah County Evaporative Cooler Air Quality Study. Google My Maps. Available online: https://www.google.com/maps/d/u/0/edit?mid=16kZcXy2IDVdfBM13103vhYMxD5W6lY0&usp=sharing (accessed on 26 June 2024).
  65. Stephenson, D.J.; Lillquist, D.R. The Effects of Temperature and Pressure on Airborne Exposure Concentrations When Performing Compliance Evaluations Using ACGIH TLVs and OSHA PELs. Appl. Occup. Environ. Hyg. 2001, 16, 482–486. [Google Scholar] [CrossRef] [PubMed]
  66. NOAA, Station Pressure Calculator. Available online: https://www.weather.gov/epz/wxcalc_stationpressure (accessed on 6 May 2024).
  67. National Weather Service. Provo Municipal Airport—Time Series Viewer. Available online: https://www.weather.gov/wrh/timeseries?site=KPVU (accessed on 27 April 2024).
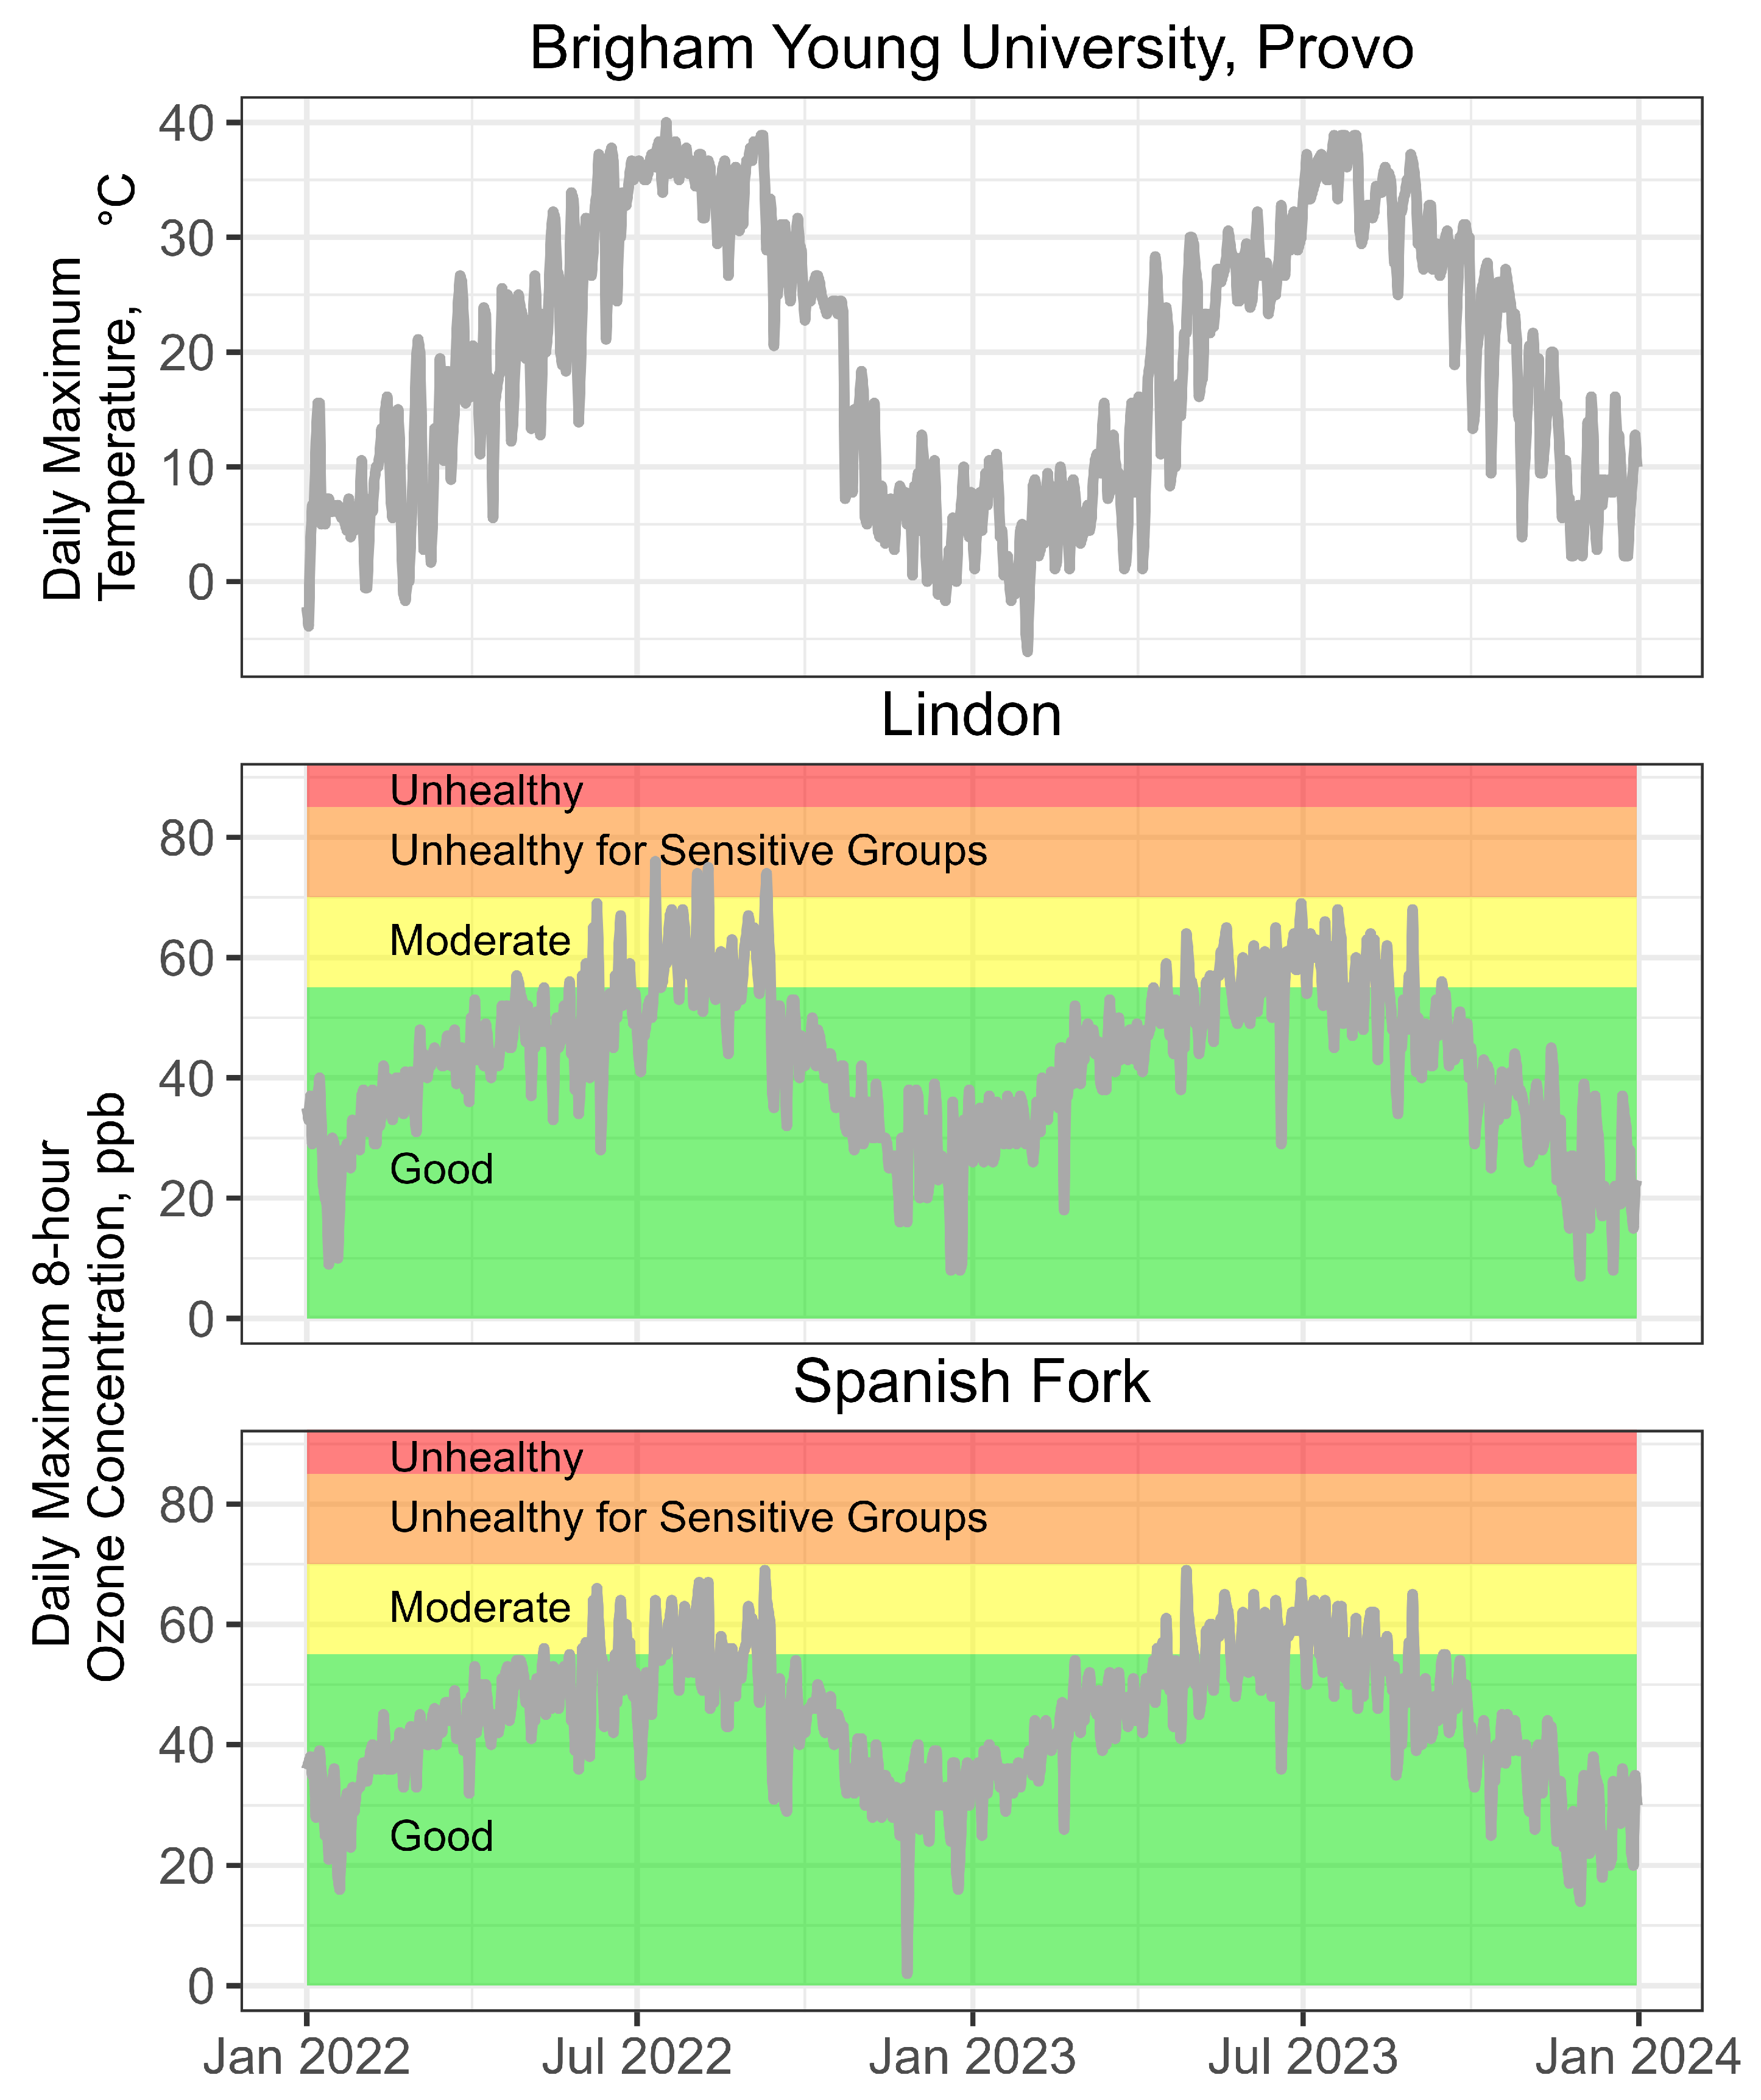
Figure 1. Daily Maximum Temperature (°C) measured at Brigham Young University, and the Daily Maximum 8-h O3 Concentrations (ppb) measured at the Utah Division of Air Quality Monitors in Lindon and Spanish Fork for 2022 and 2023, with the US EPA Air Quality Index (AQI) levels for O3 also displayed [13].
Environments 11 00219 g001
Figure 2. (a) Example outdoor and (b) indoor setup of the O3 sampling cassettes and pump.
Environments 11 00219 g002
Figure 3. Average indoor and outdoor O3 concentrations for each date, home, and visit organized by central air conditioners and evaporative coolers. Missing indoor observations are below the limit of detection (LOD). LOD values ranged between 3 and 6 ppb during the study and are represented with grey points.
Environments 11 00219 g003
Figure 4. Average indoor and outdoor O3 concentrations for each visit organized by central air conditioner and evaporative cooler homes. Visits with high flow rate were sampled at 0.5 L/min, visits with a low flow rate were sampled at 0.25 L/min. The limit of detection (LOD) was used for visits where the indoor O3 concentration is below the LOD. The smooth line is a LOESS fit, and the grey bands are 95% confidence intervals of the mean predicted value.
Environments 11 00219 g004
Figure 5. Indoor/Outdoor (I/O) O3 concentrations for each house and visit, organized by central air conditioner (AC) and evaporative cooler (EC) homes. Visits with high flow rate were sampled at 0.5 L/min, visits with low flow-rate were sampled at 0.25 L/min. The limit of detection (LOD) was used for visits where the indoor O3 concentration is below the LOD. The home visits are ordered by the mean I/O ratio of each home, xj.
Environments 11 00219 g005
Figure 6. Indoor/Outdoor (I/O) O3 concentrations for each visit, plotted against the difference in the indoor and outdoor daily minimum relative humidity. Separate panels for central air conditioner and evaporative cooler homes. Visits with a high flow rate were sampled at 0.5 L/min, and visits with a low flow rate were sampled at 0.25 L/min. The limit of detection was used for visits where the indoor O3 concentration was below the LOD. Linear regression was used to predict the I/O ratio as a function of the difference in minimum relative humidity.
Environments 11 00219 g006
Figure 7. Indoor/Outdoor (I/O) O3 concentrations for each visit, plotted against the daily average O3 concentrations at the closest UDAQ monitor. Separate panels for central air conditioner and evaporative cooler homes. Visits with high flow rate were sampled at 0.5 L/min and visits with low flow rate were sampled at 0.25 L/min. The limit of detection (LOD) was used for visits where the indoor O3 concentration was below the LOD. The smooth line is a LOESS fit, and the grey bands are 95% confidence intervals of the mean predicted value.
Environments 11 00219 g007
Figure 8. (a) Boxplot of the representative O3 I/O ratio for each home, xj, in the study organized by central air conditioner and evaporative cooler for each home in the study. The limit of detection (LOD) was used for visits where the indoor O3 concentration was below the LOD. The boxplots are in the style of Tukey; the middle line is the median, the bottom and upper lines are the 25th and 75th percentiles, respectively; whiskers extend to the largest value within 1.5 times the interquartile range; observations beyond the whiskers are labeled individually [41]. (b) Mean (I/O) O3 concentrations by air conditioning type, x ¯ k and accompanying 95% confidence intervals of the mean.
Environments 11 00219 g008
Table 1. Characteristics of single-family homes with central air conditioning and evaporative coolers in Utah County, Utah.
Home Characteristics AC (n = 16) EC (n = 15)
Mean SD aMin Max Mean SD aMin Max
Age of home (yrs) 33.0 26.3 2 80 62 22.6 21 100
Area (m2) 191 35 144 278 177 86 79 386
Number of residents 4.1 1.7 2 8 3.0 1.9 1 7
Occupant density b2.1 0.9 1.0 3.6 2.0 1.7 0.5 7.4
Owner occupied (%) 82 53
a Sample standard deviation; b Occupant density calculated as number of people living in the home per 100 m2.
Disclaimer/Publisher’s Note: The statements, opinions and data contained in all publications are solely those of the individual author(s) and contributor(s) and not of MDPI and/or the editor(s). MDPI and/or the editor(s) disclaim responsibility for any injury to people or property resulting from any ideas, methods, instructions or products referred to in the content.