
Co-Valorisation Energy Potential of Wastewater Treatment Sludge and Agroforestry Waste


Abstract
1. Introduction
2. Materials and Methods
2.1. Samples
2.2. Chemical Characterization
2.2.1. Proximate Analysis
2.2.2. Elemental Analysis
2.2.3. Calorimetry
2.3. Statistical Analysis
3. Results and Discussion
3.1. Physicochemical Characterization of Biomass
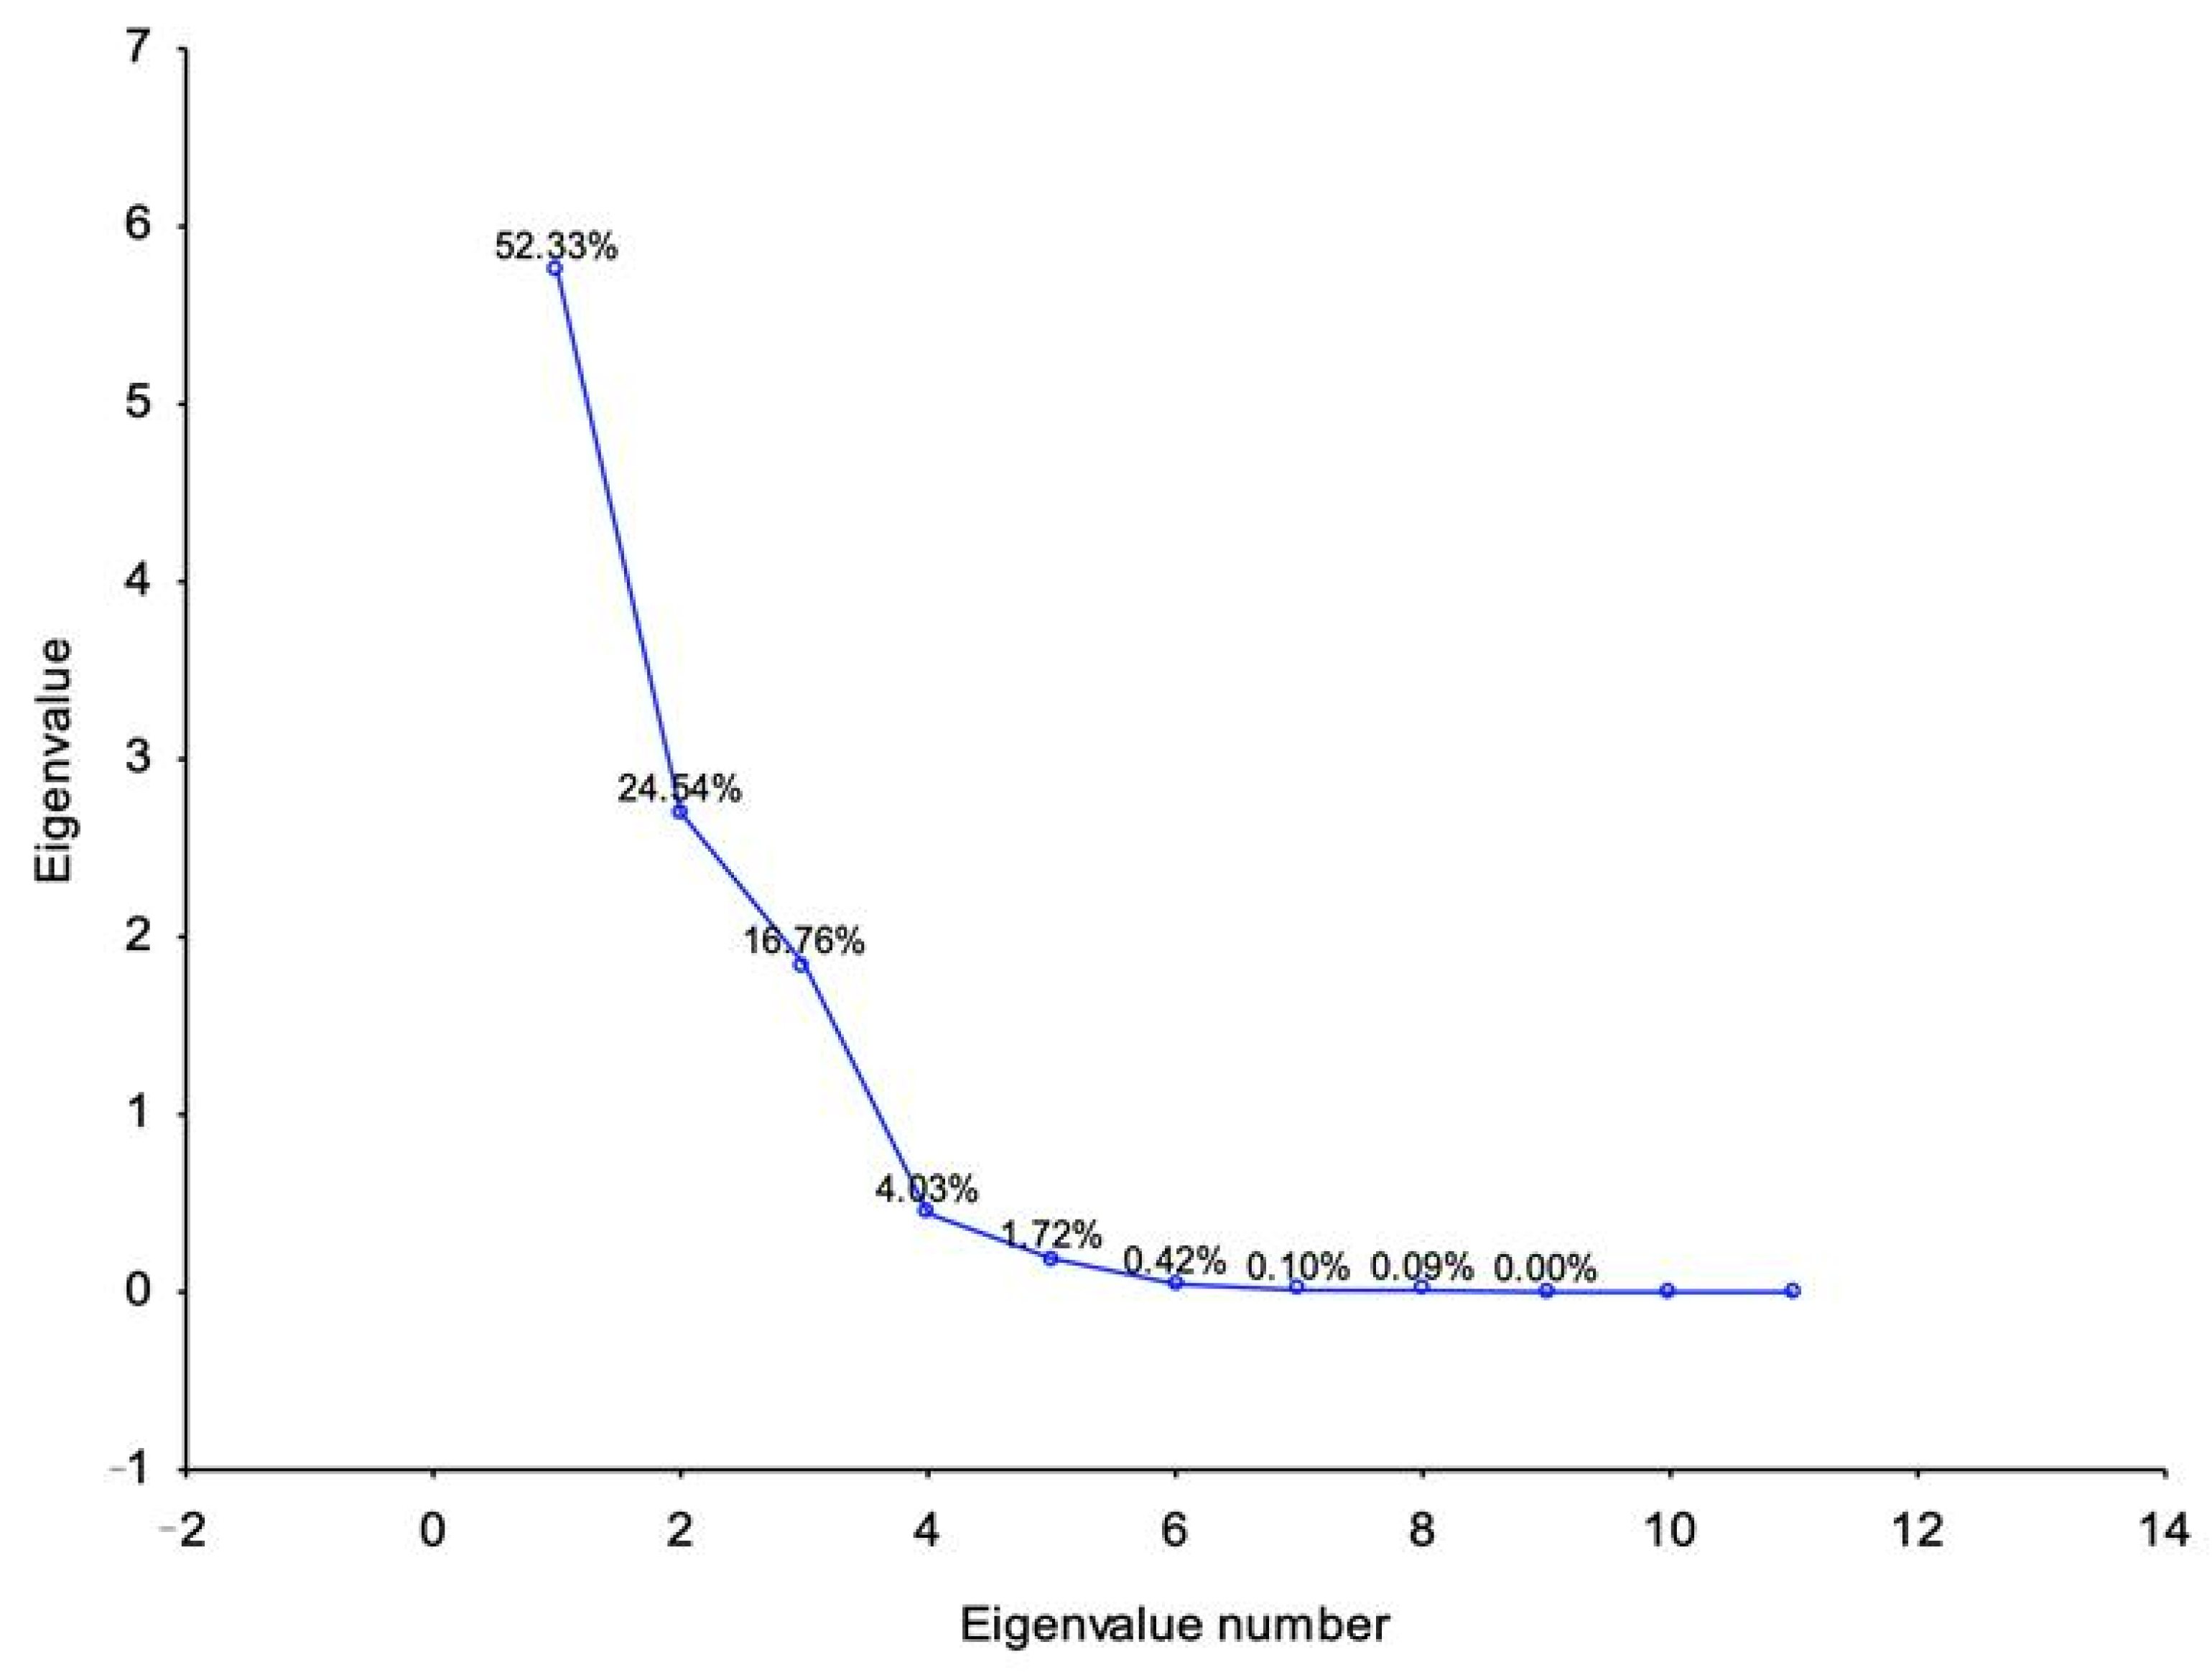
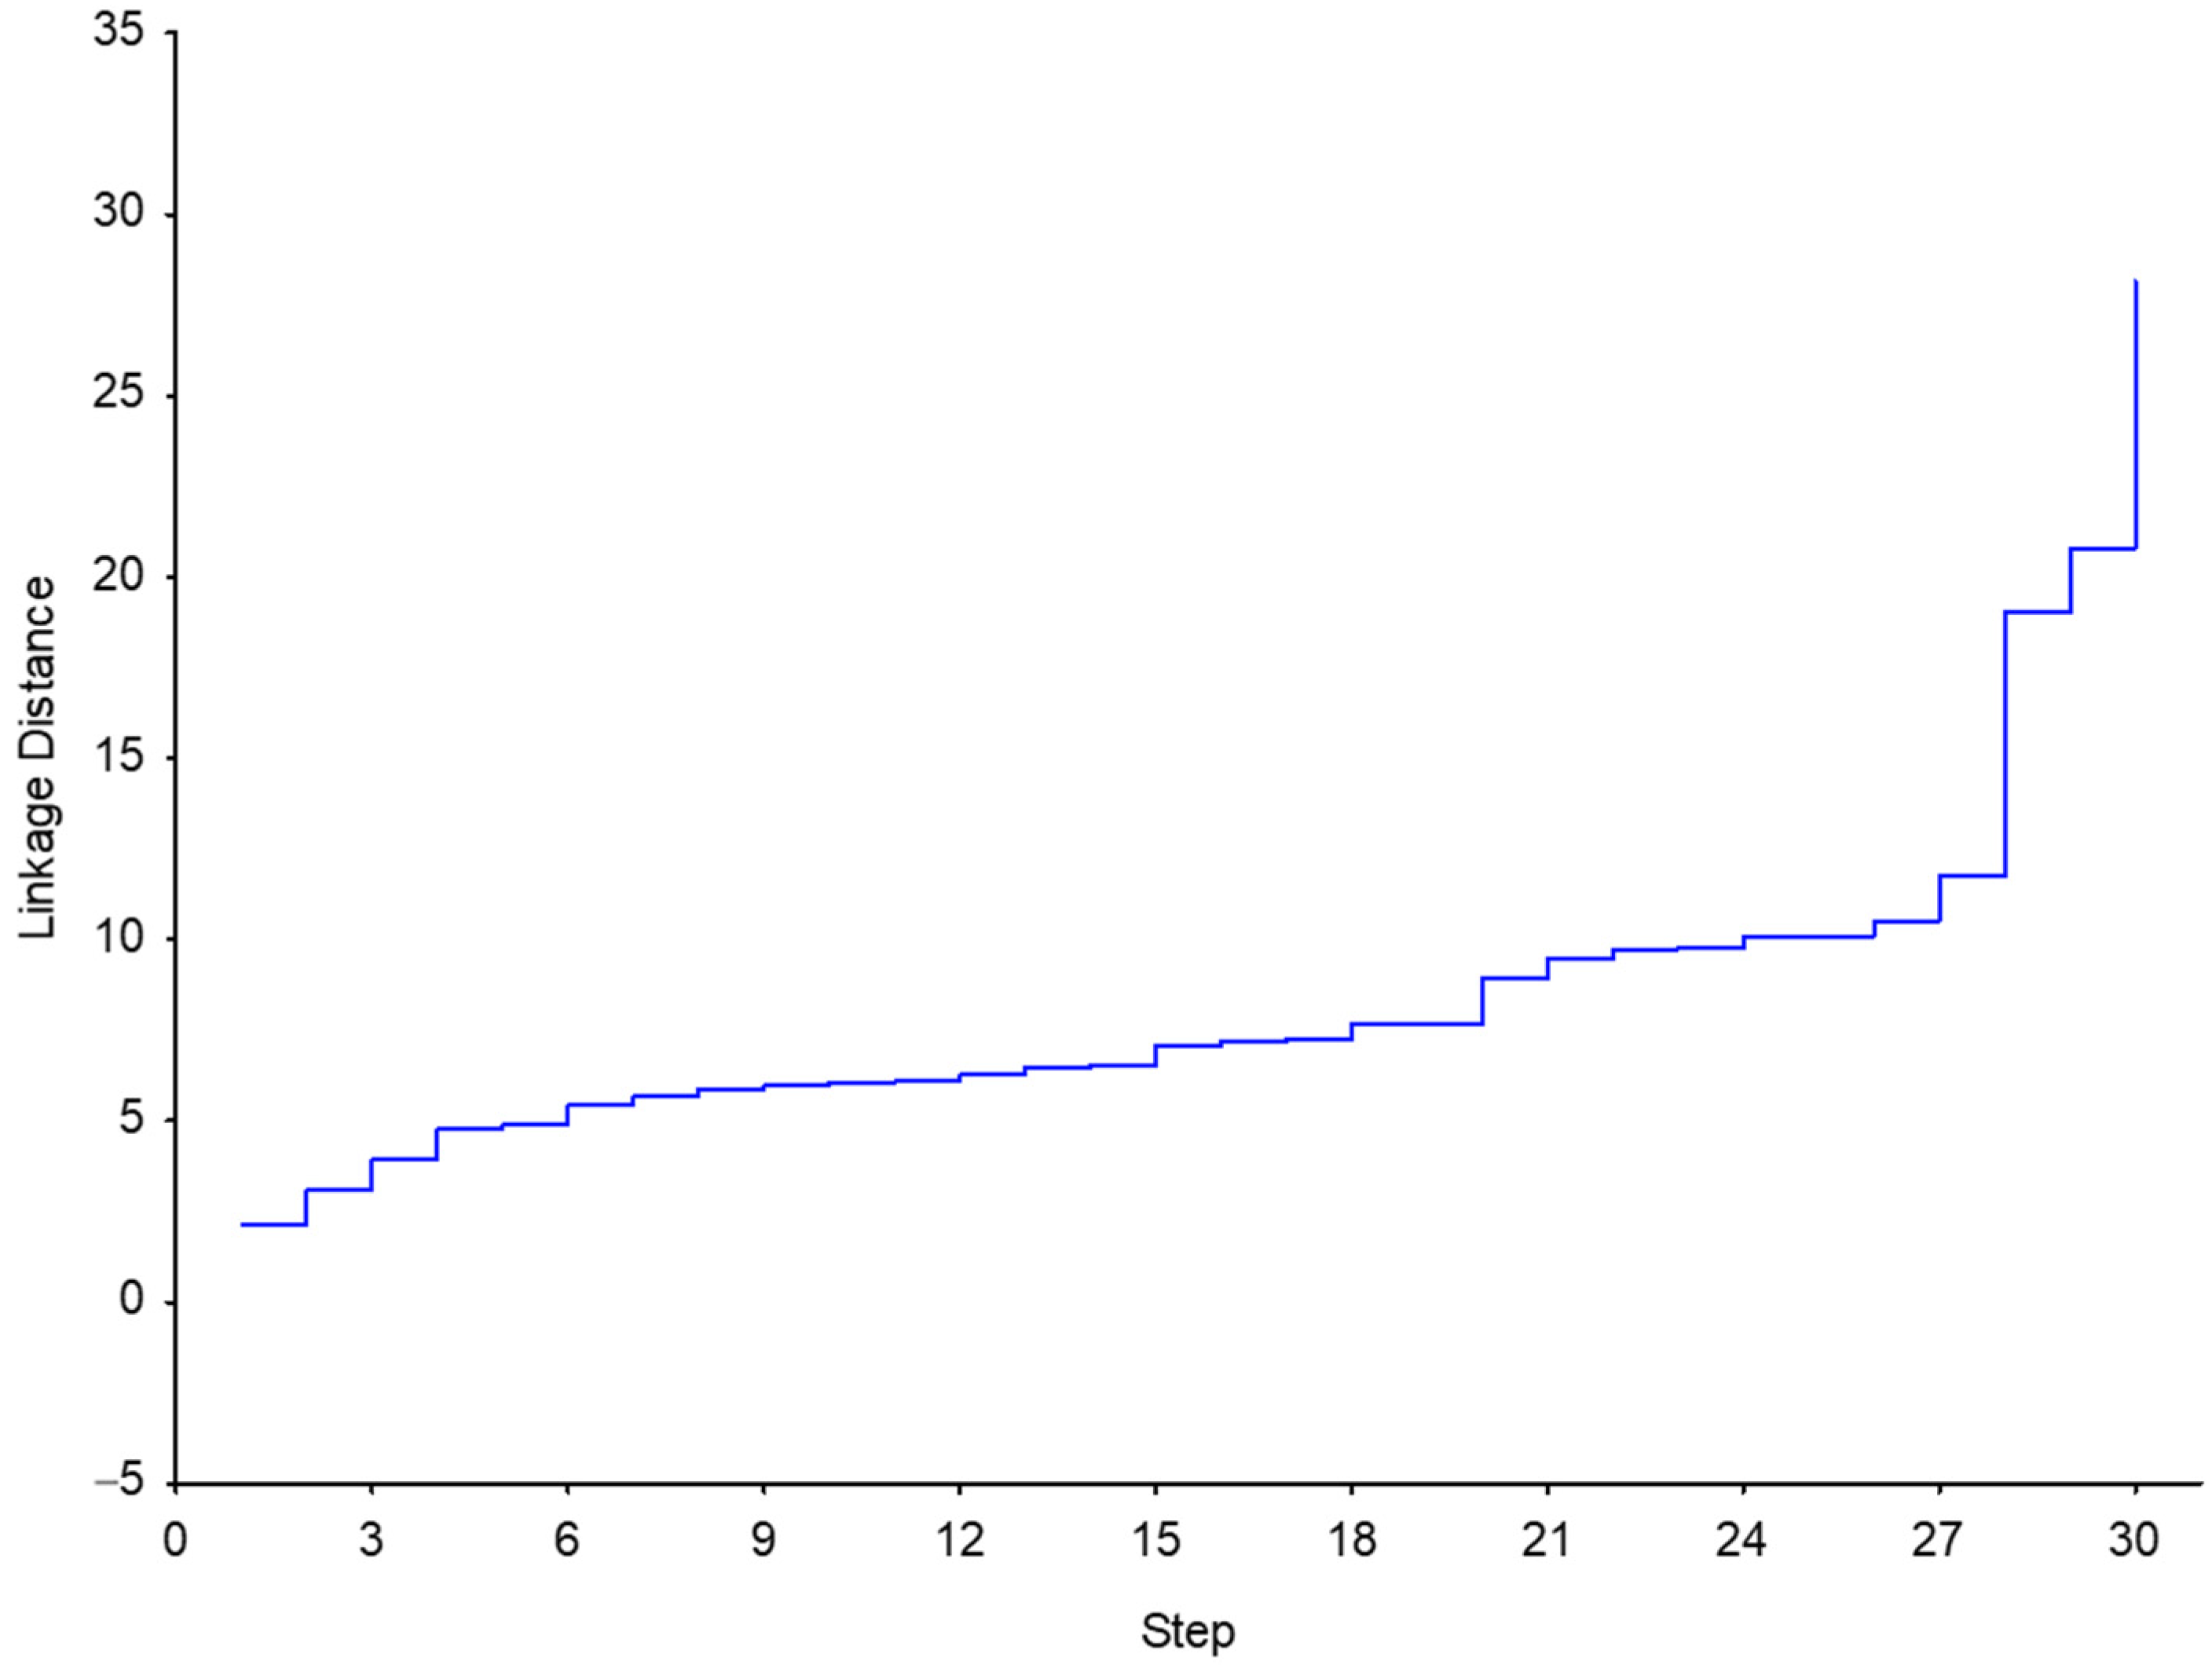
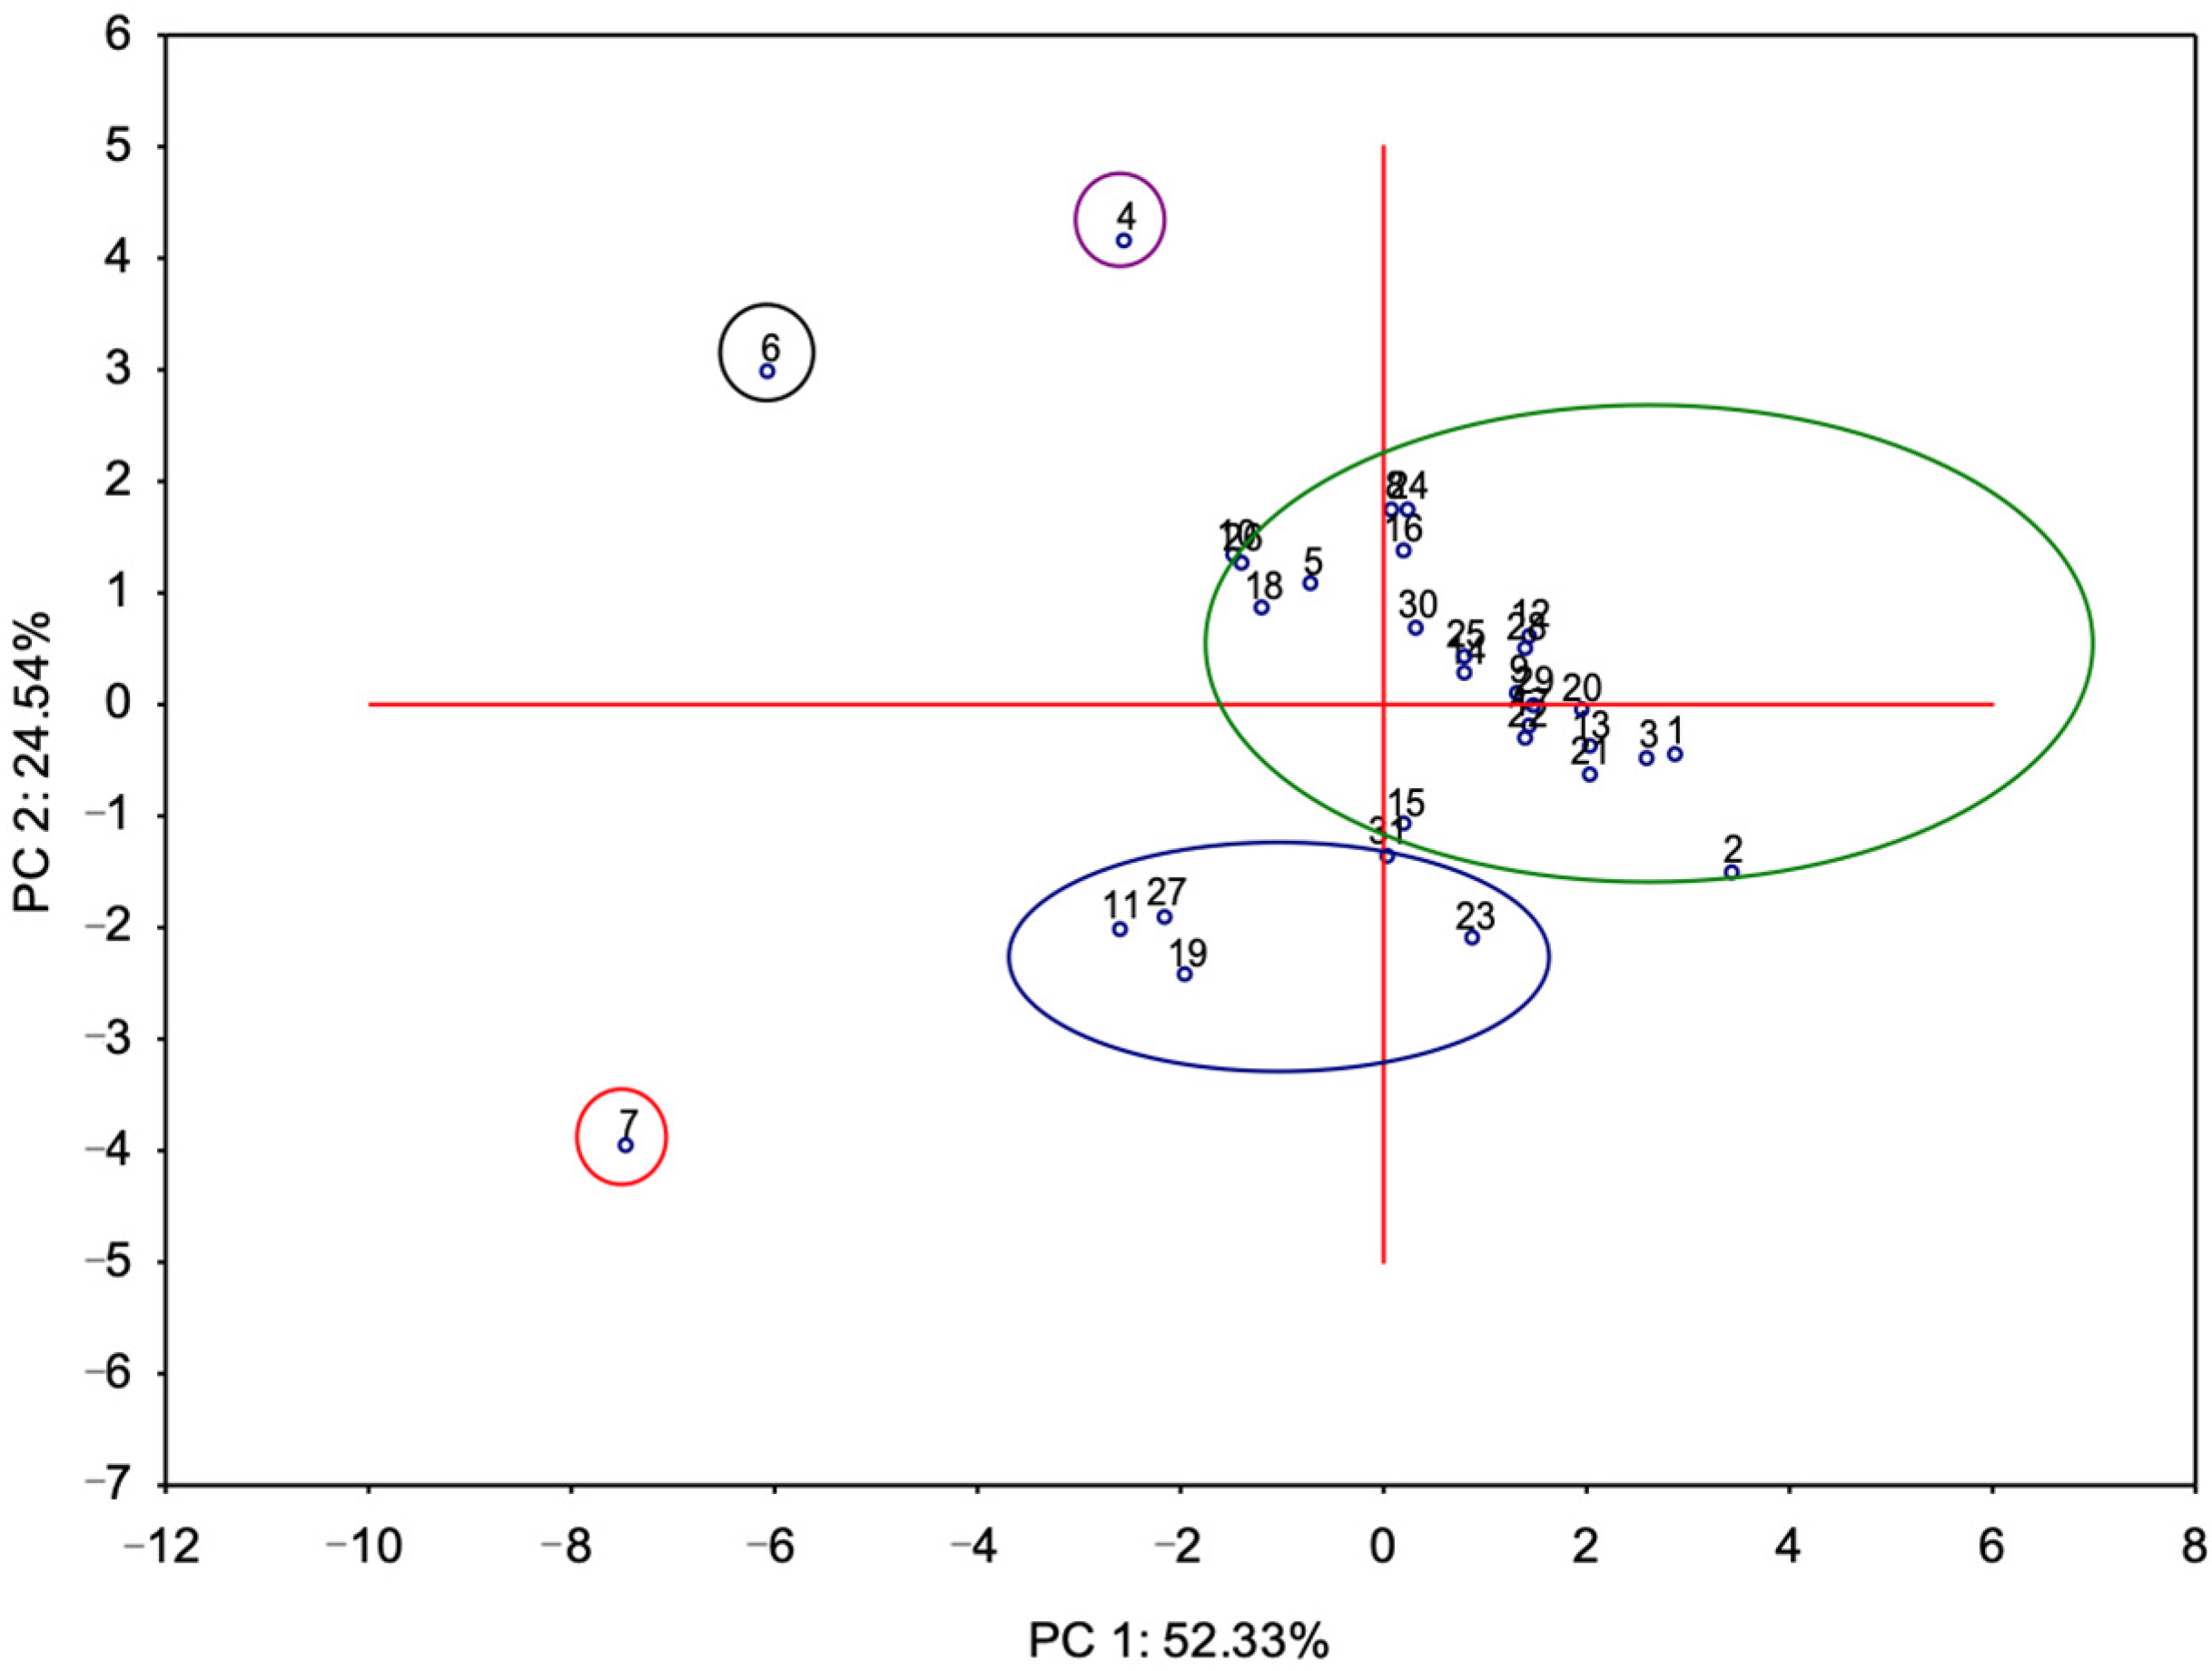
3.2. Study of Biomass Mixtures to Improve the Use of WWTP Sludge as Fuel
3.3. Relationship between Proximate Analysis, Elemental Composition, and Biomass Calorific Values
4. Conclusions
Author Contributions
Funding
Data Availability Statement
Conflicts of Interest
Appendix A

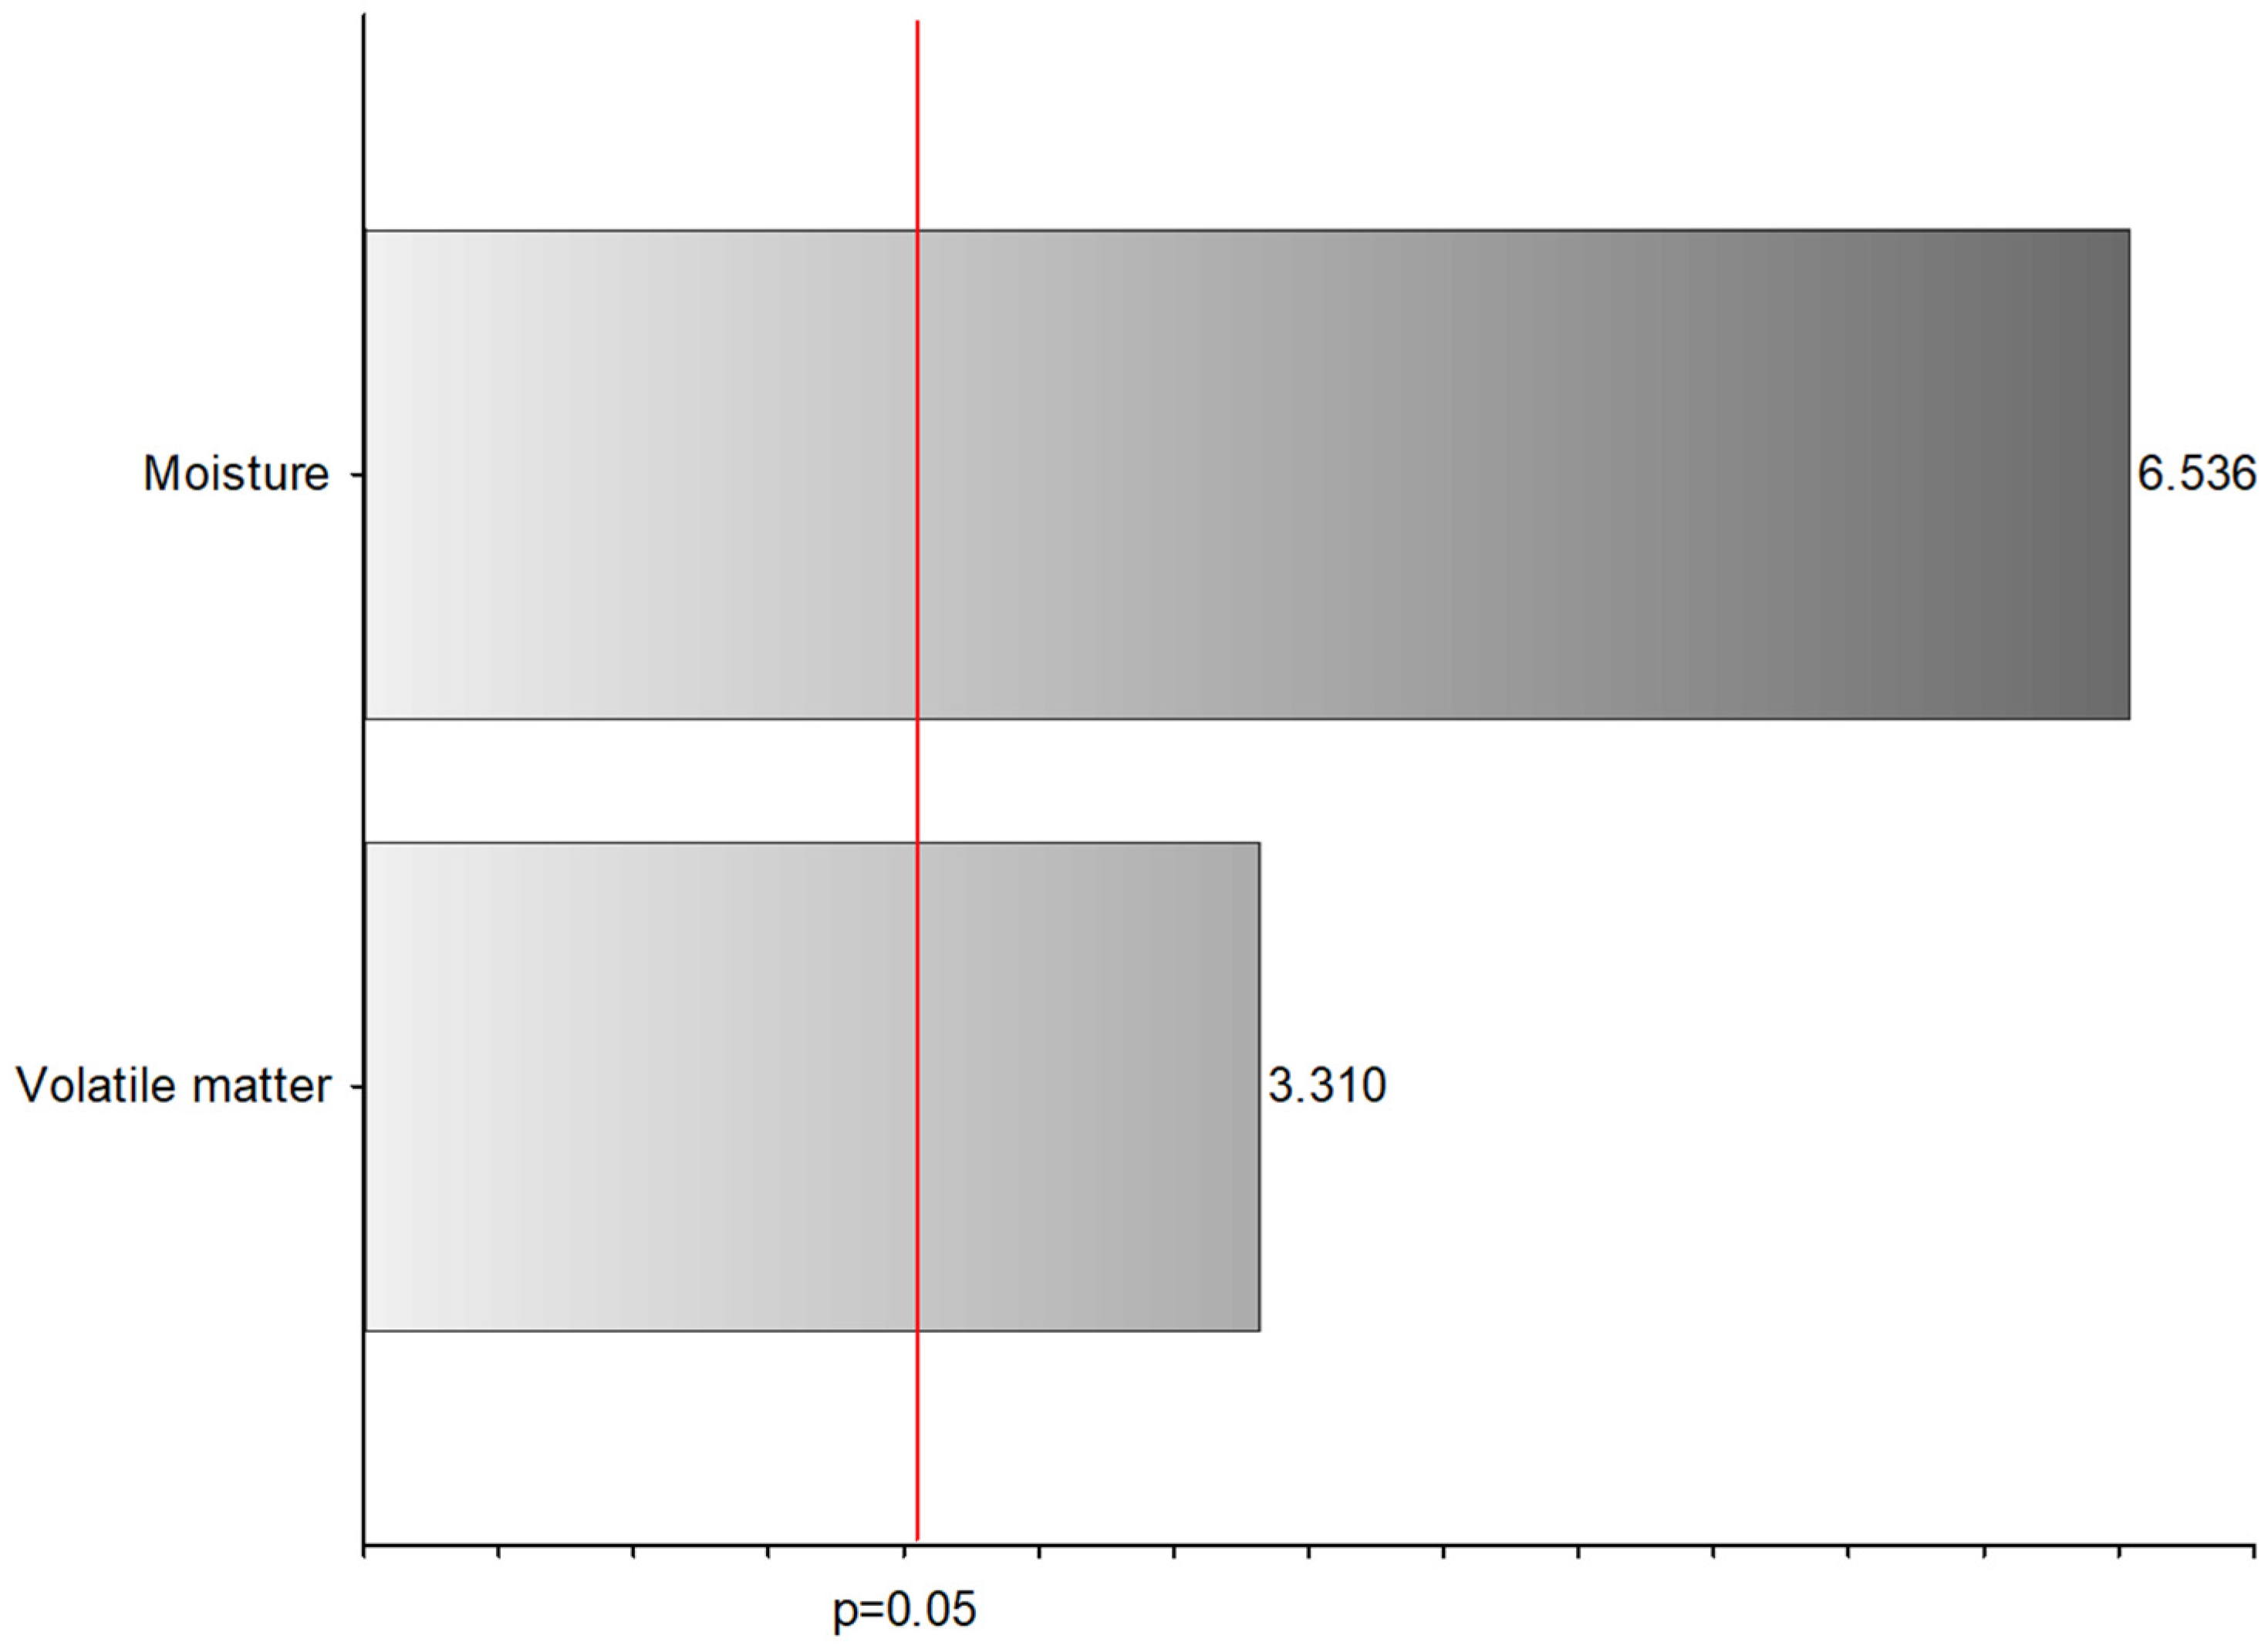
| Effect | Tolerance | Variance | R2 | NHV Beta (β) | NHV Partial | NHV Semi-Pair | NHV t | NHV p |
|---|---|---|---|---|---|---|---|---|
| Moisture | 0.9767 | 1.0239 | 0.0233 | −0.6982 | −0.7772 | −0.6900 | −6.5362 | 0.0000 |
| Volatile matter | 0.9767 | 1.0239 | 0.0233 | −0.3537 | −0.5304 | −0.3495 | −3.3108 | 0.0026 |
References
- Ferreira Gregorio, V.; Pié, L.; Terceño, A. A Systematic Literature Review of Bio, Green and Circular Economy Trends in Publications in the Field of Economics and Business Management. Sustainability 2018, 10, 4232. [Google Scholar] [CrossRef]
- Mujtaba, M.; Fernandes Fraceto, L.; Fazeli, M.; Mukherjee, S.; Savassa, S.M.; Araujo De Medeiros, G.; Do Espírito Santo Pereira, A.; Mancini, S.D.; Lipponen, J.; Vilaplana, F. Lignocellulosic Biomass from Agricultural Waste to the Circular Economy: A Review with Focus on Biofuels, Biocomposites and Bioplastics. J. Clean. Prod. 2023, 402, 136815. [Google Scholar] [CrossRef]
- Sohi, S.; Lopez-Capel, E.; Krull, E.; Bol, R. Biochar, Climate Change and Soil: A Review to Guide Future Research Soils of the Atacama Desert: Reservoir for and Fingerprint of Life View Project Agricultural Nutrient-Use Efficiency View Project. 2009. Available online: https://www.researchgate.net/publication/228656328 (accessed on 23 September 2023).
- Stephenson, P.J.; Damerell, A. Bioeconomy and Circular Economy Approaches Need to Enhance the Focus on Biodiversity to Achieve Sustainability. Sustainability 2022, 14, 10643. [Google Scholar] [CrossRef]
- Demirbas, A. Competitive Liquid Biofuels from Biomass. Appl. Energy 2011, 88, 17–28. [Google Scholar] [CrossRef]
- Mutascu, M. Is Biomass Energy Really Sustainable in the United States? Renew. Sustain. Energy Rev. 2023, 181, 113325. [Google Scholar] [CrossRef]
- Wang, F.; Harindintwali, J.D.; Yuan, Z.; Wang, M.; Wang, F.; Li, S.; Yin, Z.; Huang, L.; Fu, Y.; Li, L.; et al. Technologies and Perspectives for Achieving Carbon Neutrality. Innovation 2021, 2, 100180. [Google Scholar] [CrossRef]
- Aguilar, R.; Ramírez, J.A.; Garrote, G.; Vázquez, M. Kinetic Study of the Acid Hydrolysis of Sugar Cane Bagasse. J. Food Eng. 2002, 55, 309–318. [Google Scholar] [CrossRef]
- Kumar, A.; Kumar, N.; Baredar, P.; Shukla, A. A Review on Biomass Energy Resources, Potential, Conversion and Policy in India. Renew. Sustain. Energy Rev. 2015, 45, 530–539. [Google Scholar] [CrossRef]
- Zhou, Y.; Xu, G.; Li, H.; Chen, Y.; Xu, X.; Li, M. Effect of Greenhouse Gas Emissions on the Life Cycle of Biomass Energy Production and Conversion under Different Straw Recycling Modes. Environ. Res. 2023, 238, 117184. [Google Scholar] [CrossRef]
- Kor-Bicakci, G.; Eskicioglu, C. Recent developments on thermal municipal sludge pretreatment technologies for enhanced anaerobic digestion. Renew. Sustain. Energy Rev. 2019, 110, 423–443. [Google Scholar] [CrossRef]
- Gao, N.; Kamran, K.; Quan, C.; Williams, P.T. Thermochemical conversion of sewage sludge: A critical review. Prog. Energy Combust. Sci. 2020, 79, 100843. [Google Scholar] [CrossRef]
- Zhai, Y.; Chen, H.; Xu, B.B.; Xiang, B.; Chen, Z.; Li, C.; Zeng, G. Influence of sewage sludge-based activated carbon and temperature on the liquefaction of sewage sludge: Yield and composition of bio-oil, immobilization and risk assessment of heavy metals. Bioresour. Technol. 2014, 159, 72–79. [Google Scholar] [CrossRef] [PubMed]
- Lopes, B.C.; Machado, E.C.; Rodrigues, H.F.; Leal, D.; Calábria De Araújo, J.; Teixeira De Matos, A. Environmental Technology Effect of alkaline treatment on pathogens, bacterial community and antibiotic resistance genes in different sewage sludges for potential agriculture use Effect of alkaline treatment on pathogens, bacterial community and antibiotic. Environ. Technol. 2020, 41, 529–538. [Google Scholar] [CrossRef] [PubMed]
- Brookman, H.; Gievers, F.; Zelinski, V.; Ohlert, J.; Loewen, A. Influence of hydrothermal carbonization on composition, formation and elimination of biphenyls, dioxins and furans in sewage sludge. Energies 2018, 11, 1582. [Google Scholar] [CrossRef]
- Chen, G.; Tian, S.; Liu, B.; Hu, M.; Ma, W.; Li, X. Stabilization of heavy metals during co-pyrolysis of sewage sludge and excavated waste. Waste Manag. 2020, 103, 268–275. [Google Scholar] [CrossRef] [PubMed]
- Taboada-Santos, A.; Braz, G.H.R.; Fernandez-Gonzalez, N.; Carballa, M.; Lema, J.M. Thermal hydrolysis of sewage sludge partially removes organic micropol- lutants but does not enhance their anaerobic biotransformation. Sci. Total Environ. 2019, 690, 534–542. [Google Scholar] [CrossRef] [PubMed]
- Xu, D.; Lin, G.; Liu, L.; Wang, Y.; Jing, Z.; Wang, S. Comprehensive evaluation on product characteristics of fast hydrothermal liquefaction of sewage sludge at different temperatures. Energy 2018, 159, 686–695. [Google Scholar] [CrossRef]
- Li, S.; Jiang, Y.; Snowden-Swan, L.J.; Askander, J.A.; Schmidt, A.J.; Billing, J.M. Techno-economic uncertainty analysis of wet waste-to-biocrude via hydrothermal liquefaction. Appl. Energy 2021, 283, 116340. [Google Scholar] [CrossRef]
- Zhen, G.; Lu, X.; Kato, H.; Zhao, Y.; Li, Y.Y. Overview of pretreatment strategies for enhancing sewage sludge disintegration and subsequent anaerobic digestion: Current advances, full-scale application and future perspectives. Renew. Sustain. Energy Rev. 2017, 69, 559–577. [Google Scholar] [CrossRef]
- Liu, H.; Basar, I.A.; Eskicioglu, C. Hydrothermal liquefaction for sludge-to-energy conversion: An evaluation of biocrude production and management of waste streams. Energy 2023, 281, 128268. [Google Scholar] [CrossRef]
- Angnes, G. Gas Emissions in the Swine Manure Composting Process; Federal University of Santa Catarina, Centre for Agrarian Sciences: Florianopolis, Brazil, 2012. (In Portuguese) [Google Scholar]
- Wang, X.B.; Nan, W.U.; Cai, R.J.; Geng, W.N.; Xu, X.Y. Changes in speciation, mobility and bioavailability of Cd, Cr and As during the transformation process of pig manure by black soldier fly larvae (Hermetia illucens). J. Integr. Agric. 2021, 20, 1157–1166. [Google Scholar] [CrossRef]
- Lopez-Real, J.; Baptista, M. A Preliminary Comparative Study of Three Manure Composting Systems and their Influence on Process Parameters and Methane Emissions. Compost. Sci. Util. 1996, 4, 71–82. [Google Scholar] [CrossRef]
- Romero, C.M.; Li, C.; Owens, J.; Ribeiro, G.O.; Mcallister, T.A.; Okine, E.; Hao, X. Nutrient cycling and greenhouse gas emissions from soil amended with biochar-manure mixtures. Pedosphere 2021, 31, 289–302. [Google Scholar] [CrossRef]
- Wang, H.; Magesan, G.N.; Bolan, N.S. An overview of the environmental effects of land application of farm effluents. (Special Issue: Land application of farm wastes). N. Z. J. Agric. Res. 2004, 47, 389–403. [Google Scholar] [CrossRef]
- Berenguer, P.; Cela, S.; Santiveri, F.; Boixadera, J.; Lloveras, J. Copper and zinc soil accumulation and plant concentration in irrigated maize fertilized with liquid swine manure. Agron. J. 2008, 100, 1056–1061. [Google Scholar] [CrossRef]
- Wang, N.; Wu, X.; Liao, P.; Zhang, J.; Liu, N.; Zhou, Z.; Zhang, L. Morphological transformation of heavy metals and their distribution in soil aggregates during biotransformation of livestock manure. Biocatal. Agric. Biotechnol. 2021, 32, 101963. [Google Scholar] [CrossRef]
- Formentini, T.A.; Basile-Doelsch, I.; Legros, S.; Borschneck, D.; Venzon, J.S.; Pinheiro, A.; Doelsch, E. Redistribution of Zn towards light-density fractions and potentially mobile phases in a long-term manure-amended clayey soil. Geoderma 2021, 394, 115044. [Google Scholar] [CrossRef]
- Mattias, J.L. Heavy Metals in Soils under Swine Liquid Manure Application in Two Watersheds in Santa Catarina. Ph.D. Thesis, Federal University of Santa Maria, Santa Maria, Brazil, 2006. (In Portuguese). [Google Scholar]
- Penuelas, J.; Sardans, J.; Alcaniz, J.M.; Poch, J.M. Increased eutrophication and nutrient imbalances in the agricultural soil of NE Catalonia, Spain. J. Environ. Biol. 2009, 30, 841–846. [Google Scholar]
- ISO 18134-1:2015; Solid Biofuels—Determination of Moisture Content Oven Dry Method. ISO: Geneva, Switzerland, 2015.
- ISO 18122:2015; Solid Biofuels—Determination of Ash Content. ISO: Geneva, Switzerland, 2015.
- ISO 18123:2015; Solid Biofuels—Determination of the Content of Volatile Matter. ISO: Geneva, Switzerland, 2015.
- ISO 16948:2015; Solid Biofuels—Determination of Total Content of Carbon, Hydrogen and Nitrogen. ISO: Geneva, Switzerland, 2015.
- ISO 18125:2017; Solid Biofuels—Determination of Calorific Value. ISO: Geneva, Switzerland, 2015.
- Liu, H.; Basar, I.A.; Nzihou, A.; Eskicioglu, C. Hydrochar derived from municipal sludge through hydrothermal processing: A critical review on its formation, characterization, and valorization. Water Res. 2021, 199, 117186. [Google Scholar] [CrossRef]
- ISO 17225-6:2014; Solid Biofuels—Fuel Specifications and Classes—Part 6: Graded Non-Woody Pellets. ISO: Geneva, Switzerland, 2014.
- Zhang, Q.; Zeng, L.; Fu, X.; Pan, F.; Shi, X.; Wang, T. Comparison of anaerobic co-digestion of pig manure and sludge at different mixing ratios at thermophilic and mesophilic temperatures. Bioresour. Technol. 2021, 337, 125425. [Google Scholar] [CrossRef]
- Wilson, M. Manure and Nutrients: A Complicated Relationship; Minnesota Crop News; University of Minnesota Extension: St. Paul, MN, USA, 2017; Available online: https://blog-crop-news.extension.umn.edu/2017/11/manure-and-nutrients-complicated.html (accessed on 13 July 2021).
- Di Bella, G.; Corsino, S.F.; De Marines, F.; Lopresti, F.; La Carrubba, V.; Torregrossa, M.; Viviani, G. Occurrence of Microplastics in Waste Sludge of Wastewater Treatment Plants: Comparison between Membrane Bioreactor (MBR) and Conventional Activated Sludge (CAS) Technologies. Membranes 2022, 12, 371. [Google Scholar] [CrossRef] [PubMed]
- Núñez-Regueira, L.; Rodríguez-Añon, J.A.; Proupín-Castiñeiras, J.; Vilanova-Diz, A.; Montero-Santoveña, N. Determination of calorific values of forest waste biomass by static bomb calorimetry. Thermochim Acta 2001, 371, 23–31. [Google Scholar] [CrossRef]
- Nathans, L.L.; Oswald, F.L.; Nimon, K. Multiple linear regression: A guidebook of variable importance. Pract. Assess. Res. Evaluation. 2012, 17, 1–19. [Google Scholar]


| ID | Sample | Nd (%) | Cd (%) | Hd (%) | Sd (%) | Od (%) |
|---|---|---|---|---|---|---|
| 1 | Serzedo WWTP sludge | 8.12 ± 0.371 | 48.82 ± 0.366 | 6.76 ± 0.097 | 0.66 ± 0.027 | 9.34 ± 0.356 |
| 2 | Ponte da Baia-Amarante WWTP sludge | 6.86 ± 0.364 | 35.94 ± 0.334 | 4.59 ± 0.134 | 0.84 ± 0.043 | 21.87 ± 0.618 |
| 3 | Santo Emilião WWTP sludge | 8.54 ± 0.351 | 42.97 ± 0.308 | 5.25 ± 0.144 | 0.68 ± 0.024 | 22.29 ± 0.455 |
| 4 | Swine waste | 2.68 ± 0.329 | 40.03 ± 0.299 | 4.55 ± 0.059 | 0.14 ± 0.015 | 38.49 ± 0.285 |
| 5 | Cork powder | 0.62 ± 0.379 | 62.74 ± 0.289 | 7.31 ± 0.123 | ND | 28.79 ± 0.710 |
| 6 | Conventional biomass | 1.11 ± 0.338 | 47.24 ± 0.265 | 5.22 ± 0.172 | ND | 45.80 ± 0.700 |
| 7 | Biochar | 2.14 ± 0.360 | 50.70 ± 0.289 | 1.51 ± 0.076 | ND | 34.35 ± 0.223 |
| ID | Sample | Moisturead (%) | Volatile Matterd (%) | Ashd (%) | Fixed Carbond (%) |
|---|---|---|---|---|---|
| 1 | Serzedo WWTP sludge | 9.77± 0.157 | 53.24 ± 0.010 | 26.30 ± 0.028 | 10.69 ± 0.169 |
| 2 | Ponte da Baia-Amarante WWTP sludge | 8.88 ± 0.117 | 51.00 ± 0.018 | 29.90 ± 0.026 | 10.22 ± 0.097 |
| 3 | Santo Emilião WWTP sludge | 11.32 ± 0.194 | 56.21 ± 0.013 | 20.27 ± 0.011 | 12.20 ± 0.192 |
| 4 | Swine waste | 8.86 ± 0.124 | 56.97 ± 0.012 | 14.11 ± 0.021 | 20.06 ± 0.115 |
| 5 | Cork powder | 2.11 ± 0.118 | 66.14 ± 0.012 | 0.54 ± 0.024 | 31.21 ± 0.153 |
| 6 | Conventional biomass | 8.26 ± 0.185 | 76.01 ± 0.015 | 0.63 ± 0.028 | 15.10 ± 0.144 |
| 7 | Biochar | 3.89 ± 0.153 | 34.10 ± 0.019 | 11.30 ± 0.015 | 50.71 ± 0.157 |
| ID | Sample | GHV (MJ/kg) | NHV (MJ/kg) |
|---|---|---|---|
| 1 | Serzedo WWTP sludge | 18.09 ± 0.421 | 16.70 ± 0.441 |
| 2 | Ponte da Baia-Amarante WWTP sludge | 15.82 ± 0.033 | 14.87 ± 0.054 |
| 3 | Santo Emilião WWTP sludge | 18.52 ± 0.139 | 17.44 ± 0.160 |
| 4 | Swine waste | 17.51 ± 0.037 | 16.58 ± 0.029 |
| 5 | Cork powder | 27.24 ± 0.062 | 25.73 ± 0.037 |
| 6 | Conventional biomass | 19.79 ± 0.018 | 18.72 ± 0.027 |
| 7 | Biochar | 32.87 ± 0.835 | 32.56 ± 0.826 |
| ID | 12 | 13 | 14 | 15 | 20 | 21 | 22 | 23 | 28 | 29 | 30 | 31 |
|---|---|---|---|---|---|---|---|---|---|---|---|---|
| Sample | 75% SS + 25% CB | 75% SS + 25% SB | 75% SS + 25% CP | 75% SS + 25% B | 75% PBAS + 25% CB | 75% PBAS + 25% SB | 75% PBAS + 25% CP | 75% PBAS + 25% B | 75% SES + 25% CB | 75% SES + 25% SB | 75% SES + 25% CP | 75% SES + 25% B |
| Nd (%) | 5.783 ± 0.310 | 6.620 ± 0.346 | 6.020 ± 0.264 | 6.042 ± 0.339 | 5.796 ± 0.262 | 5.747 ± 0.399 | 5.901 ± 0.380 | 6.045 ± 0.337 | 7.208 ± 0.293 | 6.456 ± 0.314 | 5.841 ± 0.386 | 6.863 ± 0.253 |
| Cd (%) | 48.780 ± 0.379 | 45.953 ± 0.344 | 51.789 ± 0.323 | 51.171 ± 0.313 | 39.164 ± 0.486 | 38.157 ± 0.426 | 45.242 ± 0.252 | 40.416 ± 0.439 | 43.631 ± 0.288 | 43.226 ± 0.312 | 48.315 ± 0.452 | 45.312 ± 0.265 |
| Hd (%) | 6.105 ± 0.130 | 5.600 ± 0.069 | 6.247 ± 0.153 | 5.590 ± 0.156 | 4.910 ± 0.094 | 4.694 ± 0.088 | 5.706 ± 0.131 | 4.156 ± 0.102 | 5.309 ± 0.131 | 5.206 ± 0.153 | 5.924 ± 0.162 | 4.472 ± 0.170 |
| Sd (%) | 0.511 ± 0.047 | 0.576 ± 0.062 | 0.515 ± 0.037 | 0.494 ± 0.013 | 0.646 ± 0.069 | 0.636 ± 0.014 | 0.652 ± 0.085 | 0.665 ± 0.066 | 0.567 ± 0.099 | 0.494 ± 0.016 | 0.419 ± 0.058 | 0.510 ± 0.059 |
| Od (%) | 18.440 ± 0.737 | 17.503 ± 0.765 | 15.071 ± 0.584 | 14.653 ± 0.193 | 27.402 ± 0.811 | 27.097 ± 0.716 | 19.588 ± 0.783 | 24.095 ± 0.892 | 28.344 ± 0.380 | 25.392 ± 0.290 | 23.665 ± 0.534 | 25.221 ± 0.418 |
| Moisturead (%) | 9.592 ± 0.179 | 9.744 ± 0.128 | 8.355 ± 0.156 | 8.800 ± 0.127 | 8.626 ± 0.150 | 8.772 ± 0.168 | 7.823 ± 0.161 | 8.083 ± 0.169 | 10.357 ± 0.194 | 10.207 ± 0.145 | 9.518 ± 0.138 | 9.493 ± 0.172 |
| Volatile Matterd (%) | 58.435 ± 0.019 | 53.673 ± 0.013 | 56.965 ± 0.019 | 48.955 ± 0.015 | 57.753 ± 0.020 | 53.088 ± 0.013 | 55.302 ± 0.017 | 46.017 ± 0.020 | 60.510 ± 0.014 | 55.898 ± 0.014 | 59.190 ± 0.014 | 49.665 ± 0.016 |
| Ashd (%) | 20.380 ± 0.010 | 23.748 ± 0.029 | 20.358 ± 0.021 | 22.051 ± 0.020 | 22.082 ± 0.015 | 23.671 ± 0.018 | 22.911 ± 0.024 | 24.623 ± 0.013 | 14.941 ± 0.029 | 19.226 ± 0.027 | 15.836 ± 0.021 | 17.622 ± 0.024 |
| Fixed Carbond (%) | 11.592 ± 0.182 | 12.834 ± 0.144 | 14.322 ± 0.194 | 20.195 ± 0.122 | 11.538 ± 0.146 | 14.469 ± 0.192 | 13.964 ± 0.202 | 21.277 ± 0.137 | 14.192 ± 0.226 | 14.669 ± 0.136 | 15.456 ± 0.164 | 23.220 ± 0.191 |
| GHVd (MJ/kg) | 18.546 ± 0.279 | 17.940 ± 0.171 | 20.043 ± 0.733 | 21.779 ± 0.493 | 17.129 ± 0.128 | 16.435 ± 0.031 | 18.902 ± 0.191 | 19.991 ± 0.178 | 19.025 ± 0.034 | 18.269 ± 0.096 | 20.720 ± 1.612 | 21.954 ± 0.203 |
| NHVd (MJ/kg) | 17.391 ± 0.302 | 16.786 ± 0.158 | 18.756 ± 0.746 | 20.833 ± 0.487 | 16.117 ± 0.112 | 15.467 ± 0.033 | 17.726 ± 0.212 | 19.134 ± 0.161 | 17.930 ± 0.056 | 17.196 ± 0.065 | 19.499 ± 1.645 | 21.032 ± 0.222 |
| ID | 8 | 9 | 10 | 11 | 16 | 17 | 18 | 19 | 24 | 25 | 26 | 27 |
|---|---|---|---|---|---|---|---|---|---|---|---|---|
| Sample | 50% SS + 50% CB | 50% SS + 50% SB | 50% SS + 50% CP | 50% SS + 50% B | 50% PBAS + 50% CB | 50% PBAS + 50% SB | 50% PBAS + 50% CP | 50% PBAS + 50% B | 50% SES + 50% CB | 50% SES + 50% SB | 50% SES + 50% CP | 50% SES + 50% B |
| Nd (%) | 4.707 ± 0.387 | 5.439 ± 0.364 | 4.222 ± 0.267 | 4.933 ± 0.359 | 4.184 ± 0.371 | 4.774 ± 0.375 | 3.964 ± 0.263 | 4.599 ± 0.369 | 5.464 ± 0.339 | 5.369 ± 0.351 | 5.258 ± 0.364 | 5.193 ± 0.377 |
| Cd (%) | 49.016 ± 0.381 | 43.025 ± 0.425 | 55.305 ± 0.253 | 49.943 ± 0.478 | 42.966 ± 0.380 | 38.663 ± 0.379 | 50.134 ± 0.487 | 41.696 ± 0.371 | 45.375 ± 0.401 | 42.843 ± 0.473 | 51.125 ± 0.403 | 47.393 ± 0.330 |
| Hd (%) | 6.151 ± 0.097 | 5.346 ± 0.124 | 6.981 ± 0.119 | 4.227 ± 0.106 | 5.023 ± 0.053 | 4.608 ± 0.160 | 6.111 ± 0.143 | 3.849 ± 0.142 | 5.298 ± 0.110 | 5.044 ± 0.129 | 6.228 ± 0.102 | 3.885 ± 0.123 |
| Sd (%) | 0.314 ± 0.067 | 0.456 ± 0.029 | 0.359 ± 0.034 | 0.233 ± 0.082 | 0.408 ± 0.074 | 0.484 ± 0.043 | 0.391 ± 0.041 | 0.345 ± 0.083 | 0.406 ± 0.046 | 0.393 ± 0.054 | 0.363 ± 0.072 | 0.357 ± 0.080 |
| Od (%) | 26.315 ± 0.549 | 25.055 ± 0.629 | 20.008 ± 0.160 | 22.360 ± 0.120 | 33.809 ± 0.223 | 29.164 ± 0.439 | 24.181 ± 0.379 | 29.387 ± 0.702 | 33.388 ± 0.231 | 29.611 ± 0.602 | 27.122 ± 0.118 | 26.884 ± 0.421 |
| Moisturead (%) | 9.148 ± 0.121 | 9.848 ± 0.152 | 6.449 ± 0.118 | 6.880 ± 0.119 | 8.650 ± 0.110 | 9.203 ± 0.104 | 5.495 ± 0.192 | 6.822 ± 0.117 | 9.656 ± 0.154 | 10.081 ± 0.159 | 6.814 ± 0.148 | 7.705 ± 0.151 |
| Volatile Matterd (%) | 63.054 ± 0.019 | 54.998 ± 0.018 | 60.198 ± 0.018 | 44.169 ± 0.014 | 63.104 ± 0.018 | 54.301 ± 0.013 | 58.569 ± 0.016 | 41.647 ± 0.015 | 66.444 ± 0.015 | 56.560 ± 0.018 | 62.173 ± 0.017 | 46.152 ± 0.019 |
| Ashd (%) | 13.497 ± 0.014 | 20.678 ± 0.014 | 13.124 ± 0.029 | 18.303 ± 0.024 | 13.610 ± 0.011 | 22.306 ± 0.014 | 15.220 ± 0.013 | 20.123 ± 0.013 | 10.068 ± 0.011 | 16.740 ± 0.025 | 9.904 ± 0.027 | 16.288 ± 0.020 |
| Fixed Carbond (%) | 14.302 ± 0.119 | 14.475 ± 0.149 | 20.230 ± 0.109 | 30.649 ± 0.109 | 14.636 ± 0.084 | 14.189 ± 0.122 | 20.716 ± 0.163 | 31.408 ± 0.088 | 13.832 ± 0.176 | 16.619 ± 0.144 | 21.109 ± 0.139 | 29.855 ± 0.184 |
| GHVd (MJ/kg) | 19.014 ± 0.038 | 17.941 ± 0.130 | 22.613 ± 0.512 | 25.744 ± 1.227 | 18.221 ± 0.474 | 16.854 ± 0.030 | 21.037 ± 1.085 | 24.080 ± 0.281 | 19.173 ± 0.225 | 18.077 ± 0.094 | 22.419 ± 2.007 | 25.397 ± 0.642 |
| NHVd (MJ/kg) | 17.746 ± 0.049 | 16.840 ± 0.155 | 21.278 ± 0.500 | 25.079 ± 1.249 | 17.186 ± 0.464 | 15.904 ± 0.017 | 19.623 ± 1.095 | 23.492 ± 0.263 | 18.081 ± 0.232 | 17.038 ± 0.105 | 21.136 ± 2.007 | 24.390 ± 0.666 |
| Dependent Variable | Multiple R | Multiple R2 | Adjusted R2 | SS Model | Df Model | MS Model | SS Residual | Residual df | MS Residual | F | p |
|---|---|---|---|---|---|---|---|---|---|---|---|
| NHV | 0.8294 | 0.6879 | 0.6656 | 288.5142 | 2 | 144.2571 | 130.8501 | 28 | 4.6732 | 30.8689 | 0.001 |
Disclaimer/Publisher’s Note: The statements, opinions and data contained in all publications are solely those of the individual author(s) and contributor(s) and not of MDPI and/or the editor(s). MDPI and/or the editor(s) disclaim responsibility for any injury to people or property resulting from any ideas, methods, instructions or products referred to in the content. |
© 2024 by the authors. Licensee MDPI, Basel, Switzerland. This article is an open access article distributed under the terms and conditions of the Creative Commons Attribution (CC BY) license (https://creativecommons.org/licenses/by/4.0/).
Share and Cite
Borges, A.D.S.; Oliveira, M.; Teixeira, B.M.M.; Branco, F. Co-Valorisation Energy Potential of Wastewater Treatment Sludge and Agroforestry Waste. Environments 2024, 11, 14. https://doi.org/10.3390/environments11010014
Borges ADS, Oliveira M, Teixeira BMM, Branco F. Co-Valorisation Energy Potential of Wastewater Treatment Sludge and Agroforestry Waste. Environments. 2024; 11(1):14. https://doi.org/10.3390/environments11010014
Chicago/Turabian StyleBorges, Amadeu D. S., Miguel Oliveira, Bruno M. M. Teixeira, and Frederico Branco. 2024. "Co-Valorisation Energy Potential of Wastewater Treatment Sludge and Agroforestry Waste" Environments 11, no. 1: 14. https://doi.org/10.3390/environments11010014
APA StyleBorges, A. D. S., Oliveira, M., Teixeira, B. M. M., & Branco, F. (2024). Co-Valorisation Energy Potential of Wastewater Treatment Sludge and Agroforestry Waste. Environments, 11(1), 14. https://doi.org/10.3390/environments11010014