Article

Emissions and By-Products from Producing Torrefied Solid Recovered Fuel Using Pulp Industry Waste

1
Department of Occupational Safety and Health, China Medical University, Taichung 406, Taiwan
2
Graduate Institute of Environmental Engineering, National Taiwan University, Taipei 106, Taiwan
3
Department of Environmental Engineering, National I-Lan University, I-Lan 260, Taiwan
4
Department of Environmental Engineering, Da-Yeh University, Changhua 515, Taiwan
5
Department of Chemical Engineering and Biotechnology, National Taipei University of Technology, Taipei 106, Taiwan
6
Department of Forestry and Resource Conservation, National Taiwan University, Taipei 106, Taiwan
*
Author to whom correspondence should be addressed.
Environments 2023, 10(8), 135; https://doi.org/10.3390/environments10080135
Submission received: 4 May 2023 / Revised: 15 June 2023 / Accepted: 16 June 2023 / Published: 2 August 2023

Abstract

:
Emissions and by-products from manufacturing torrefied solid recovered fuel using pulp industry waste containing wood waste with pulp sludge (WPS) were studied. Two batches of WPS1 and WPS2 were tested. The torrefaction of WSP1 and WPS2 were performed at their respectively optimal temperature of 573 and 593 K and time of 20 min, referred as cases WPST1-573-20 and WPST2-593-20, respectively. WPS1 contained higher fixed carbons and volatile matters but lower ash content than WPS2. The results showed that the solid yields of 56 and 61 wt.%, gas yields of 16 and 16 wt.% and liquid yields of 28 and 24 wt.% for WPST1-573-20 and WPST2-593-20, respectively. The maximal concentration of emissions for WPST1-573-20 and WPST2-593-20 are about 1952.5 and 3743.5 ppmv for CO, 26.5 and 156 ppmv for NOx and 31.5 and 392 ppmv for SO2, respectively. The CCO exceeded the emission standard and required further action. The collected non-condensable gases consisted of hydrocarbons ranging from C1-HC to C6-HC, with C4-HC being the predominant component. Here, Cn-HC represents hydrocarbons with a carbon atom count of n. The GC-MS analysis revealed the primary liquid byproducts. The liquid products can be used directly as pyroligneous liquor in agriculture. Furthermore, with refining techniques, these liquid byproducts can be transformed into high-quality chemicals for applications such as fungicides, pesticides, solvents, surfactants, and as precursors or monomers in the synthesis of other chemicals.

1. Introduction

The net zero emission target by 2050 has been launched by many countries, including Taiwan. According to Taiwan greenhouse gas inventory report [1], carbon emission of pulp and paper production industry is 48.7 CO2 MT in 2020, where is attributed to 18.8% of total carbon emission from industrial sectors. Therefore, increasing the use of alternative biomass fuels of pulp and paper production is one of the key strategies to reduce carbon emission of the sector.
Bio-waste sludge has been used for the filtration of H2S and odor compounds [2,3,4], as well as energy conversion. Among thermal conversion from bio-waste to energy, torrefaction has been commonly employed to upgrade the qualities of solid fuels made from biomass (noted as solid bio-fuel, SBF) or combustible wastes (called as solid recovered fuel, SRF) which may contain some non-biomass combustibles [5,6,7,8,9,10,11]. The improvements of torrefied SBF (SBFT) or SRF (SRFT) include enhancement of heating value, energy densification ratio (ED), grindability, hydrophobicity and combustibility, while reduction of O/C ratio, H/C ratio and smell. The biomass used includes agricultural residues [12,13,14,15,16,17,18,19,20,21], energy crops [8,11,17,22], forest biomass [23] and lignocellulosic biomass [24,25,26,27,28,29,30,31,32,33]. The combustible wastes such as waste bamboo chopsticks [5], biofiber from municipal solid waste [16] and pulp industry waste containing wood waste with pulp sludge (WPS) [6] have been also found their uses for making SRF and SRFT. Other materials of interest treated by torrefaction for improving their properties include coffee bean ground [12], spent coffee ground [34] and microalga [35].
The desired end-products of torrefaction for SBF and SRF are SBFT and SRFT, respectively. However, during the torrefaction process, hydrocarbons (HCs) are released along with other pollutants. To enhance the torrefaction process, which involves mild pyrolysis, it is beneficial to condense or remove the hydrocarbon from gas phase before discharging them to air pollution control devices. This not only reduces the load on subsequent air pollution control systems, but also allows for the recovery of valuable products from the condensed liquid [36,37,38]. In a study on torrefaction of waste bamboo chopsticks at 563 K for 40 min, Chen et al. [36] noted that the liquid products contain some organic acids and medicine compounds. Grewal et al. [37] reported the potential application of pyroligneous acid in agriculture via pyrolysis of plant biomass. Park et al. [38] investigated the impact of temperature on torrefaction of wood pellets to produce liquid and solid fuels. The study revealed that as the torrefaction temperature increased from 250 to 400 °C, the solid yield decreased to 30.3%. In contrast, the gas yield increased to 17.5% and the liquid yield rose to 52.2%. These changes were attributed to the partial elimination and decomposition of hemicellulose, cellulose, and lignin in the wood pellets. The liquid products obtained from torrefaction contained pyrolyzates of hemicellulose and cellulose, including furans and acids, as well as pyrolyzates of lignin, such as guaiacol, eugenol, and other phenolics. As for the discharged gas after condensation coupled with torrefaction, Chen et al. [36] indicated that some non-condensable HCs mainly with low carbon number (C1 to C6) release together with emissions of CO, NOx, SOx and CO2.The C1–C6 HCs have fuel values if recovered. Therefore, the emissions of other non-condensable air pollutants need further control before release to atmosphere.
Torrefaction can produce high-quality torrefied WPS (WPST) for better use as SRFT, as reported by previous work (Huang et al. [6]). However, the resulting emissions and by-products of the torrefaction process must be thoroughly characterized to determine the necessary pollution control measures and to explore potential uses for the by-products. Therefore, the main focus of this study was to analyze the emissions and by-products resulting from the optimized torrefaction process for pulp industry waste, as previously obtained by Huang et al. [6]. The obtained information will be particularly valuable in understanding the composition and characteristics of emissions and by-products to promote sustainable biomass energy solutions and efficient waste management practices in the pulp industry.

2. Materials and Methods

2.1. Torrefaction of WPS and Sampling of Products

Two batches of pulp industry waste (WPS1 and WPS2) were obtained from an eastern Taiwan virgin pulp factory. The basic properties of WPS were previously discussed in Huang et al. [6]. The key differences between WPS1 and WPS2 were that WPS1 had higher fixed carbon and volatile matter content, but lower ash, O/C ratio, nitrogen, and sulfur compared to WPS2. Torrefaction experiments on WPS were conducted at set temperatures (TT) of 553, 573, and 593 K, with torrefaction times (tT) of 20, 40, and 60 min, respectively. The flow rate of nitrogen working gas, controlled by a mass flow controller (K5850, Brooks Co., Charlotte, VA, USA), was set at 165 mL/min. A 5 g sample of WPS was loaded into a sample boat and charged into the reactor at the designated temperature. A lab-scale torrefaction system was used, consisting of a tube furnace (TF-35, Cheng Huei Co., New Taipei City, Taiwan) and temperature controller (11-AC-21190/R, Kindleuro Co., Ltd., Taipei, Taiwan). The tube was constructed from 314 stainless steel and had an inner diameter of 6.2 cm and a length of 15 cm. Prior to each experiment, the tube was purged with nitrogen gas at a flow rate of 500 mL/min for 10 min to ensure a clean environment before loading the sample. Duplicate experiments were conducted under each condition to ensure the reliability and reproducibility of the results.
The flue gas was directed through a two-stage cooling water system, consisting of consecutive cooling water containers. Within this system, condensable compounds were effectively condensed at approximately 298 K and subsequently collected by a condenser for further analysis. Non-condensable gases, including hydrocarbons, were continuously collected every 5 min using a gas sampling bag. Additionally, an online gas analyzer was employed to instantly measure CO, NOx, SO2, O2, and CO2. The torrefied solid recovered fuel (SRF) derived from WPS (WPST) was characterized after completing the torrefaction process. It was determined that the optimal TT and tT for producing torrefied WPS (WPST) were 573 K and 20 min for WPST1 (referred to as WPST1-573-20), and 593 K and 20 min for WPST2 (referred to as WPST2-593-20), with TT1 of 573 K being lower than TT2 of 593 K.
As the optimized torrefaction process for pulp industry waste has been reported by Huang et al. [6], this study conducted additional analysis of the gas and liquid by-products while the torrefaction system, equipment, and procedures were similar to those outlined in Huang et al.’s study [6].

2.2. Gas Analysis

Gas samples collected in the sampling bag were analyzed for hydrocarbons (HCs) using a gas chromatography (GC) system equipped with a flame ionization detector (FID) (Agilent 6890 ChemStation, Hewlett Packard Inc., Wilmington, DE, USA). The GC column used was a model AB-5 with dimensions of 30 m length, 0.32 mm inner diameter, and 0.5 µm film thickness, provided by Abel Industries (Dumfries, VA, USA). The temperatures for injection, oven, and detection were set at 523, 323, and 523 K, respectively. The ignition gas consisted of H2 at a flow rate of 40 mL/min and the air flow rate was 450 mL/min. The carrier gas used was He at a flow rate of 4.5 mL/min. For HC measurements, a volume of 100 μL of the gas product sample was injected into the GC-FID system. Noting the gaseous products were non-condensable, the GC-FID spectra of gaseous products were compared with those of standard gases of HCs with low carbon number of alkanes containing CH4, C2H6, C3H8, C4H10, C5H12 and C6H14.
The peaks of product gas were sorted by the similar chemical polarity of the alkanes of standard gas. The HCs detected from the product gas were then classified corresponding to CnH2n+2 as Cn-HC with n = 1 to 6, i.e., C1-HC, C2-HC, C3-HC, C4-HC, C5-HC and C6-HC, respectively.
The emissions of CO, NOx, SO2 (ppmv), CO2 (vol.%) and O2 (vol.%) were continuously detected employing the gas analyzer of model Tempest 100 (Telegan Gas Monitoring Ltd., Abingdon, Oxfordshire, UK).

2.3. Liquid Analysis

The liquid condensate obtained during the process was collected and subjected to analysis. The organic components of the liquid products were characterized using a GC-FID system (Agilent 5890 Series II, Hewlett Packard Inc., Wilmington, DE, USA) equipped with a fused silica capillary column (Cat.# 007-5-30V-1.5F) from Quadrex Co. (Woodbridge, CT, USA). The column had a length of 30 m, an inner diameter of 0.53 mm, and a film thickness of 1.5 µm. The temperatures for injection, oven, and detection were set at 503, 373 and 503 K, respectively. The ignition gas and ignition gases were the same as those used for the gas analysis by GC-FID. For the analysis, a volume of 1 μL of the liquid product sample was injected into the GC-FID system.
The HCs were identified using a gas chromatography-mass spectrophotometer (GC-MS) system (Thermo Scientific FOCUS GC Gas Chromatograph 1255080, Thermo Fisher Scientific Inc., Waltham, MA, USA). The system was equipped with a Trace TR-1701 column (Thermo Fisher Scientific Inc., Waltham, MA, USA) having a length of 30 m, an inner diameter of 0.25 mm, and a film thickness of 0.25 µm. The temperature settings were the same as those used for the liquid product analysis by GC-FID. Split ratio was 50:1 and split flow was 50 mL/min. Helium (He) gas was used as the carrier gas at a flow rate of 1 mL/min. For the analysis, a volume of 150 μL of the liquid product sample was injected into the GC-MS system.

3. Results & Discussion

3.1. Emissions and Gas Products from Manufacturing WPST1-573-20 and WPST2-593-20

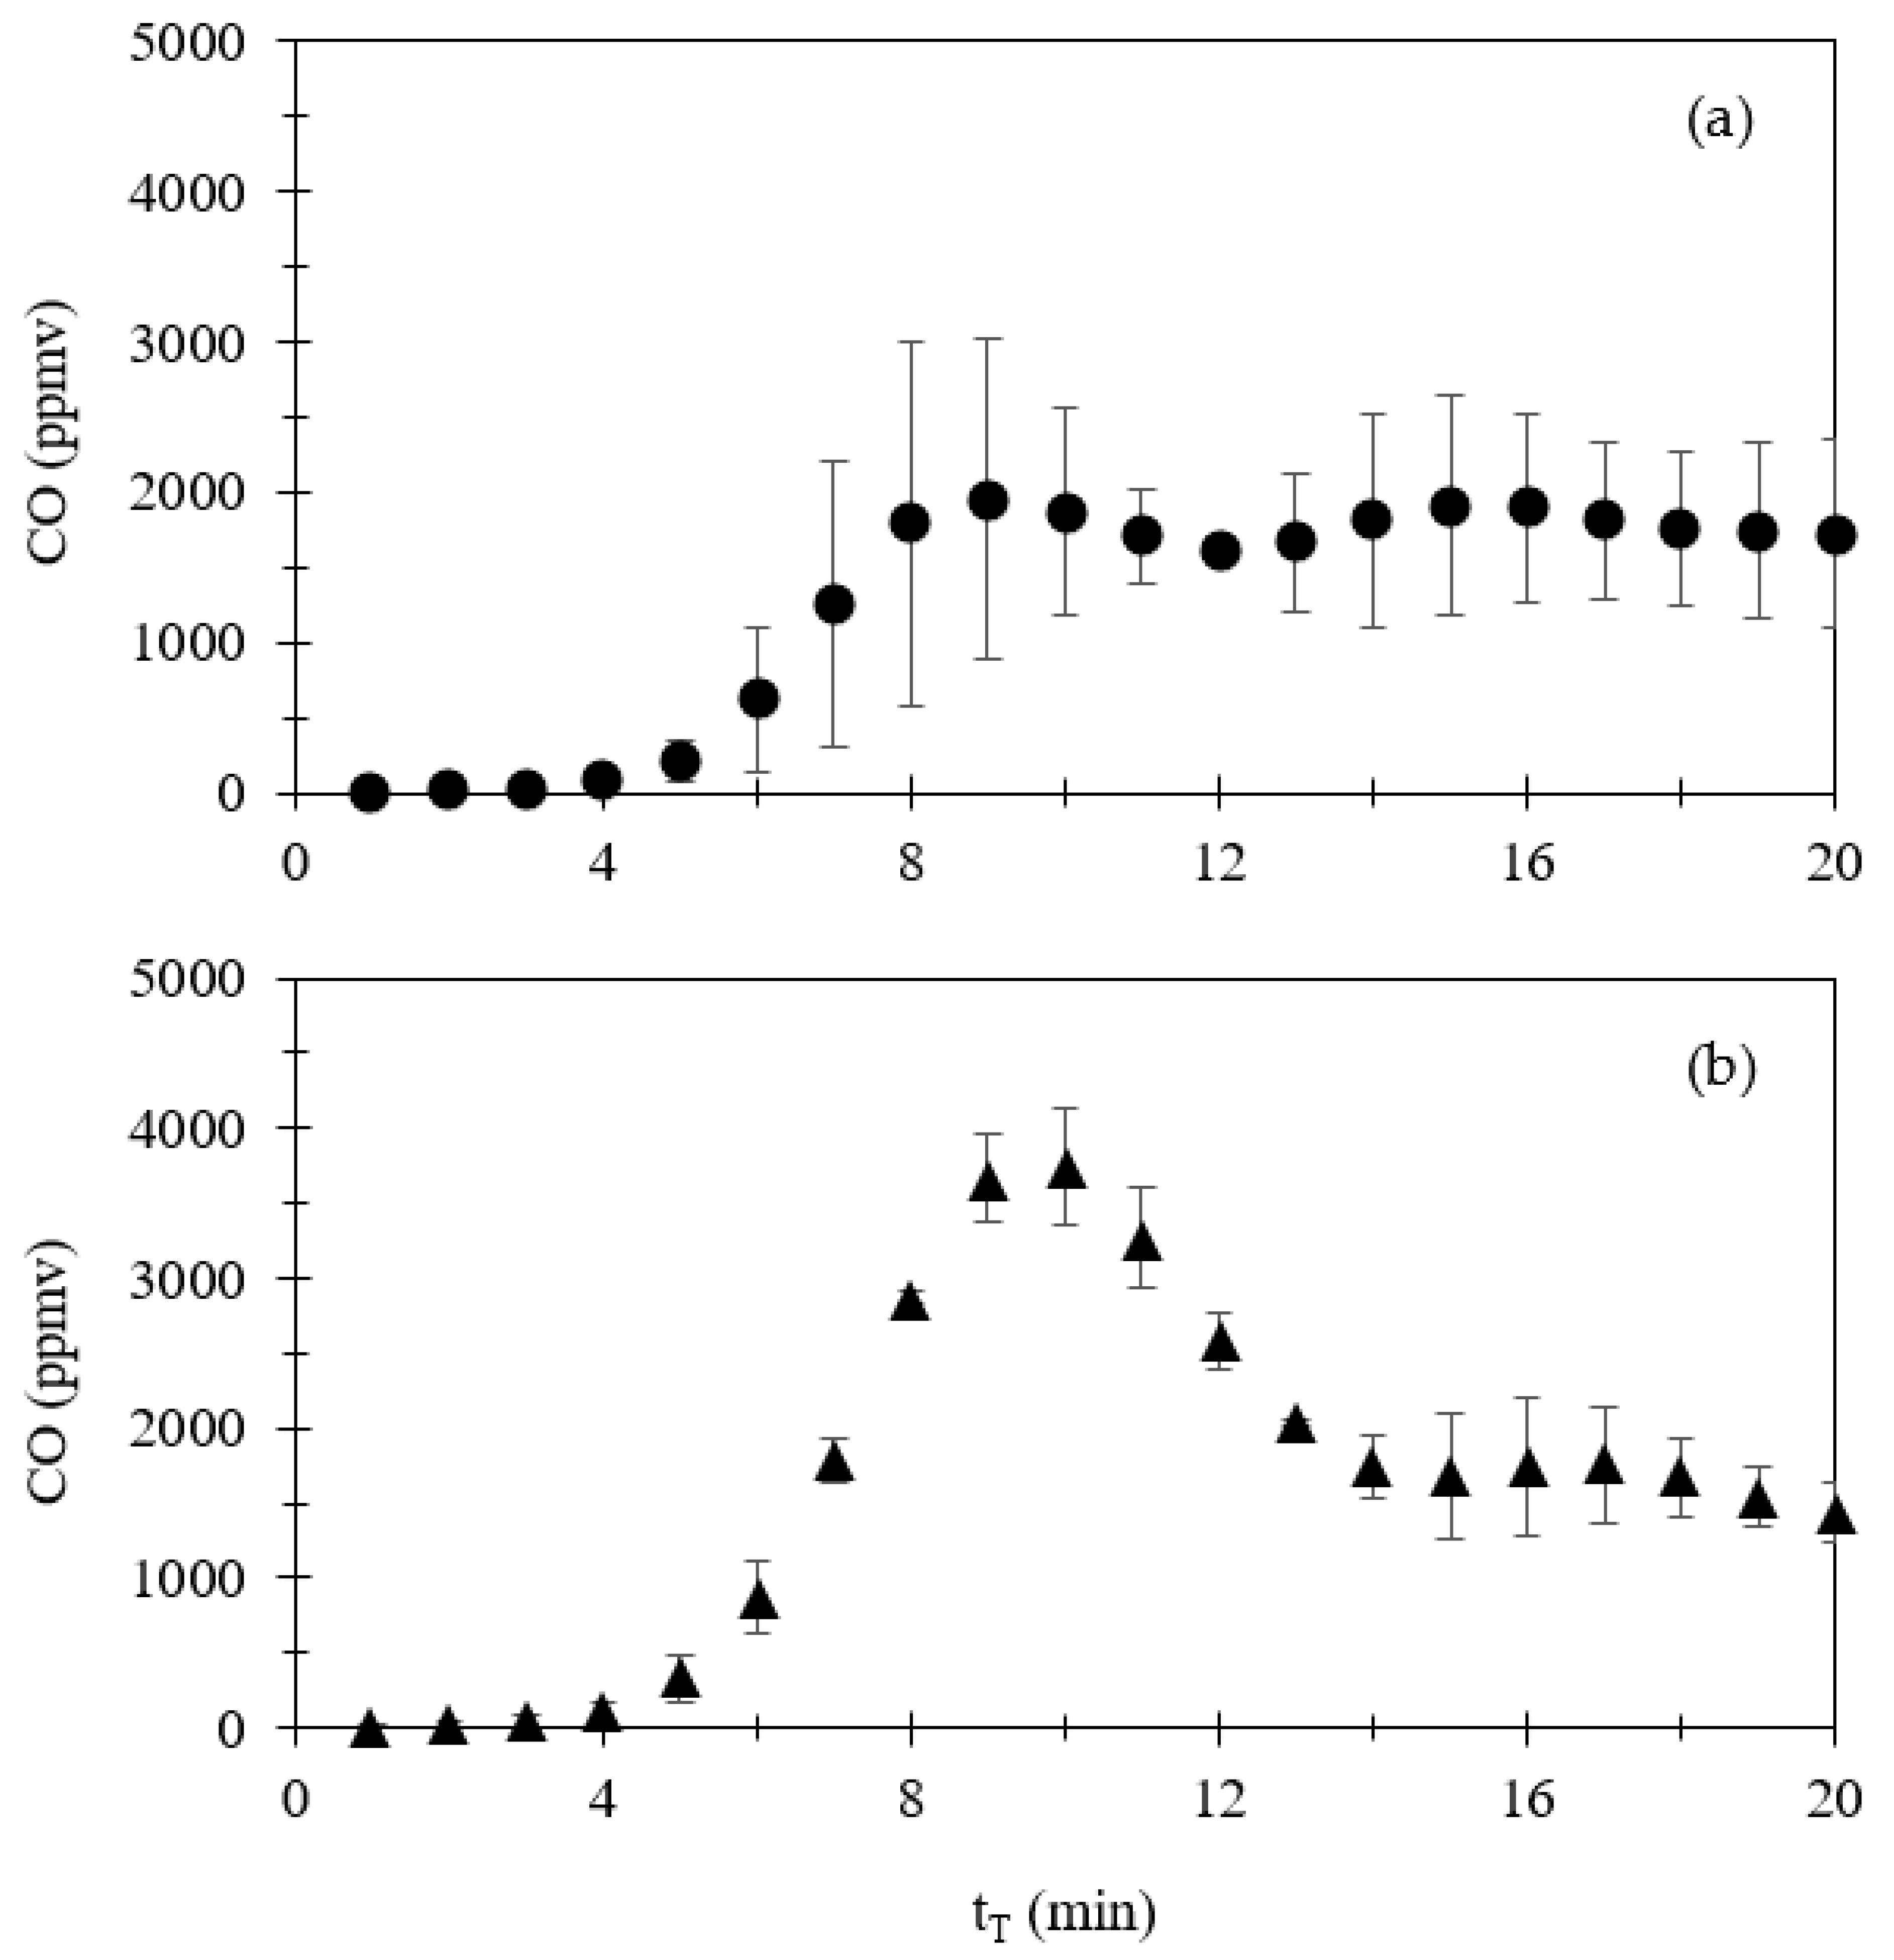
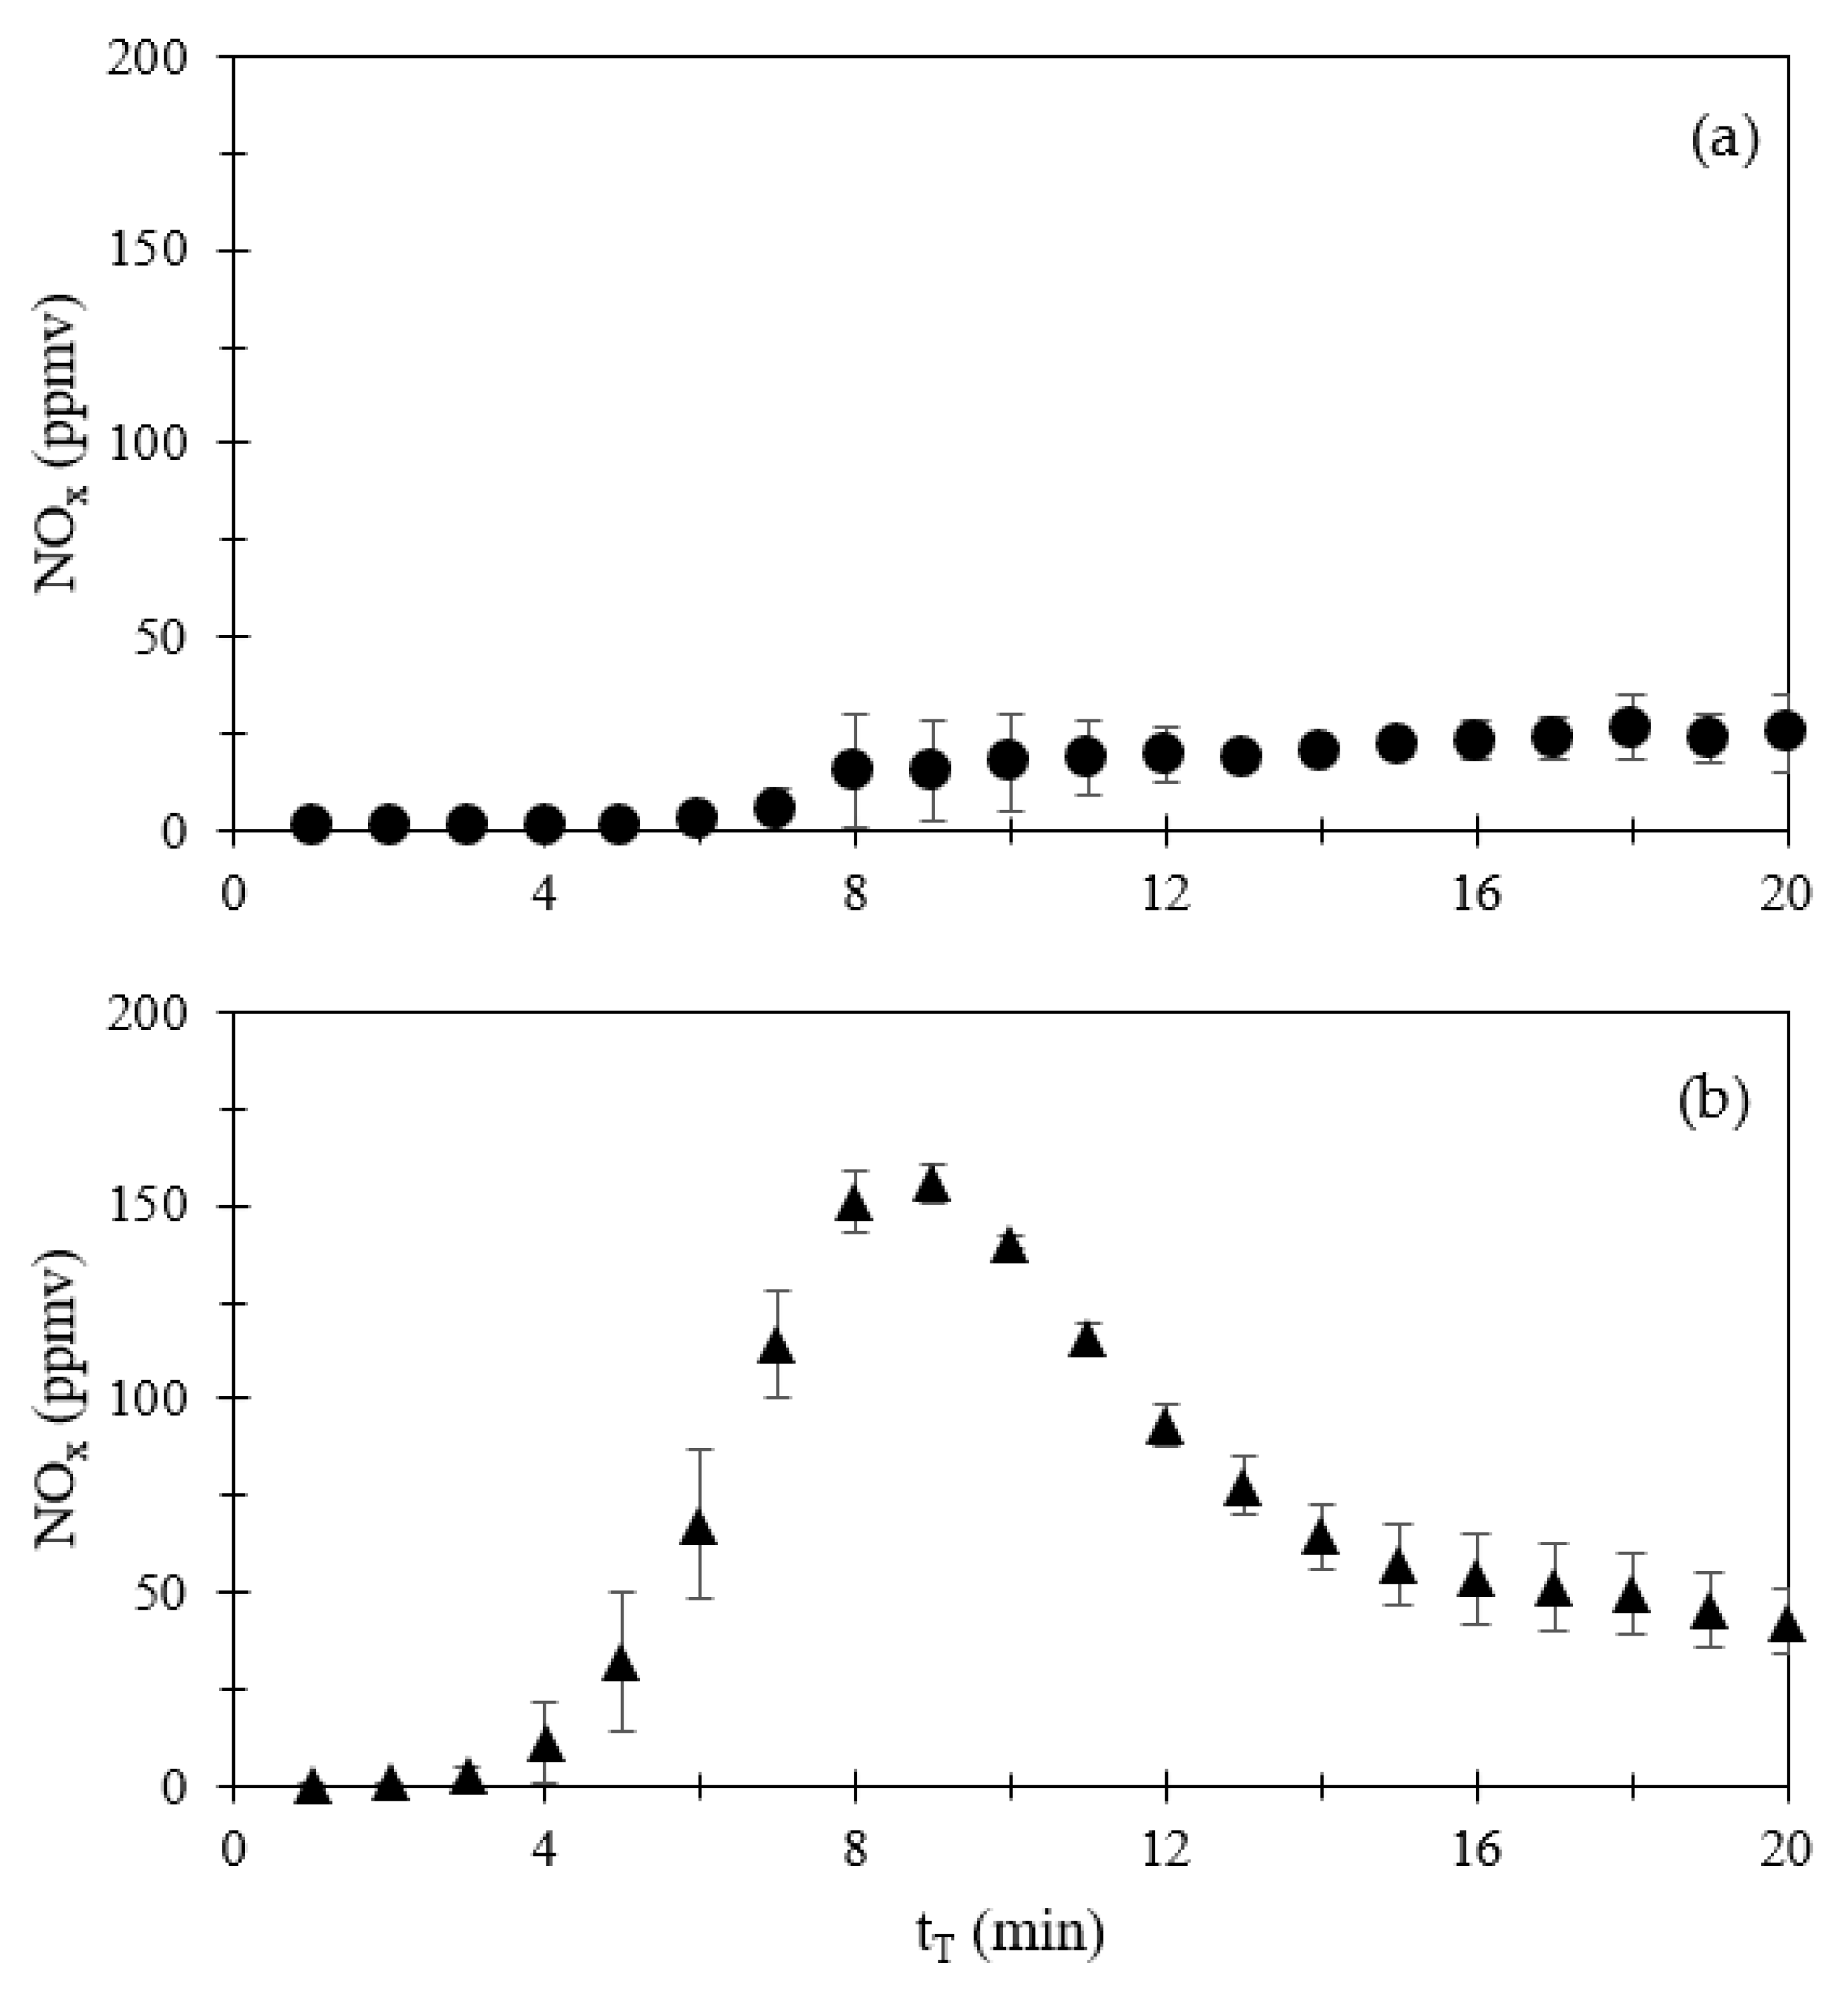
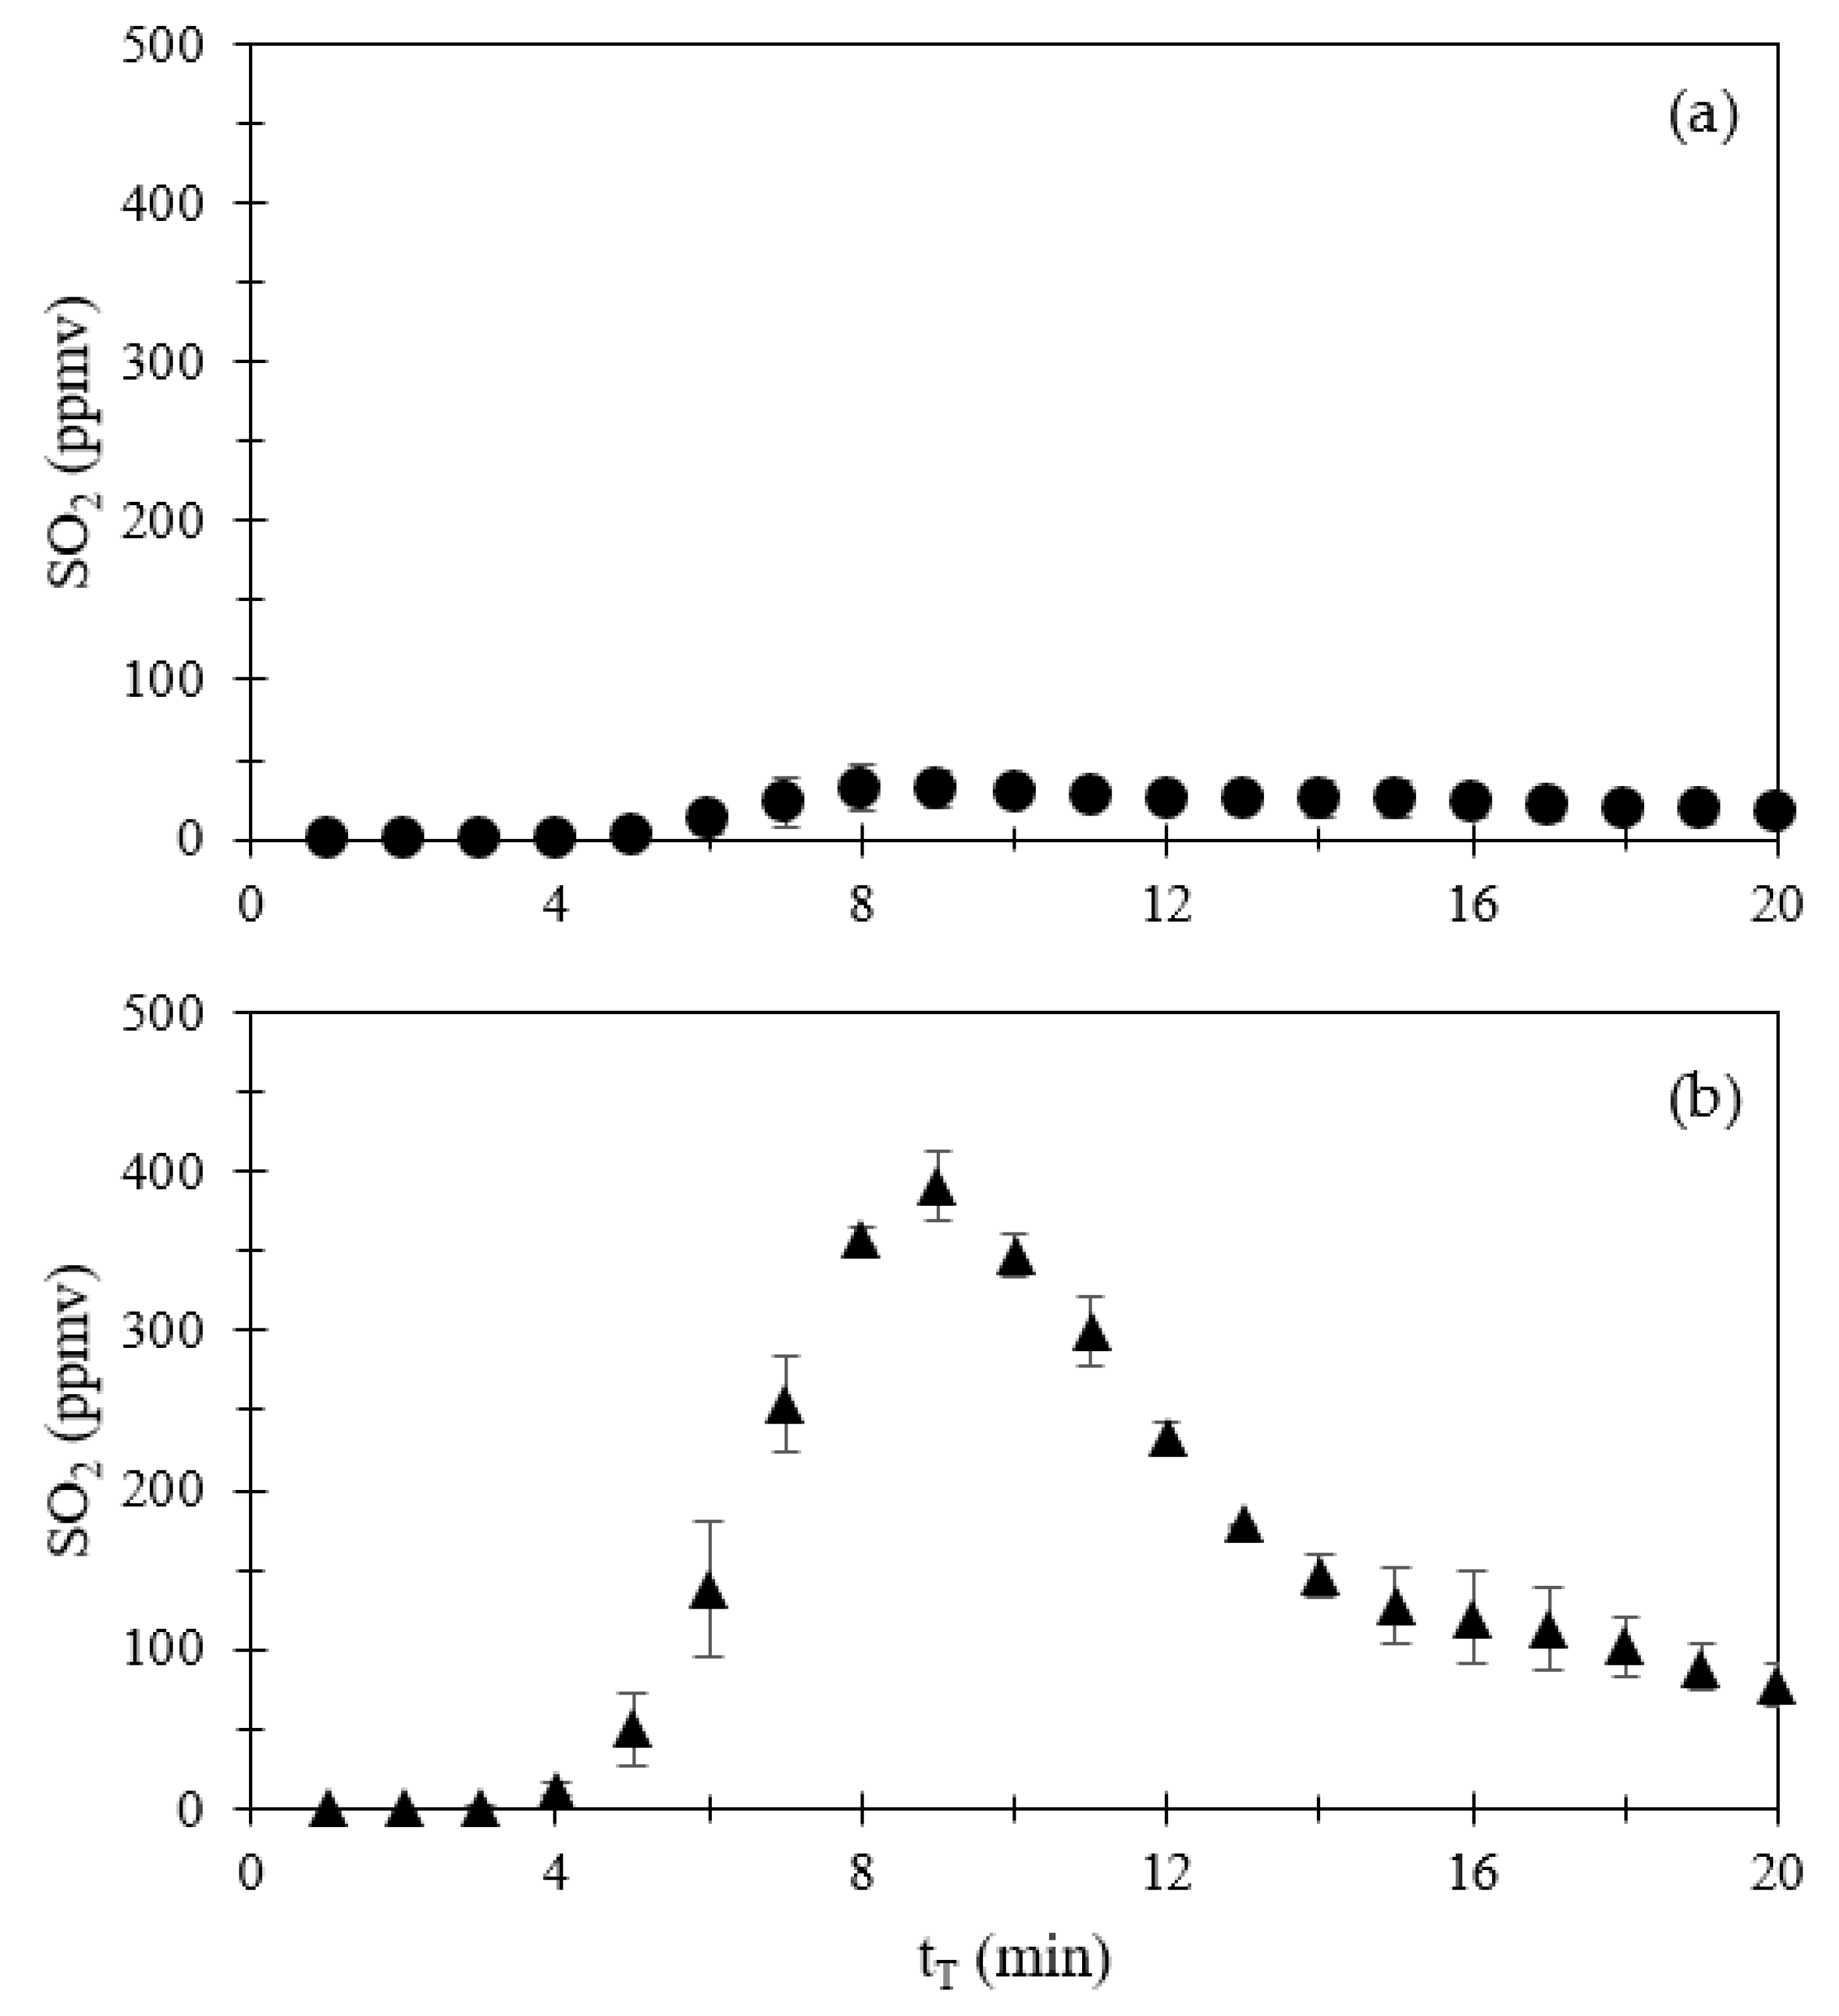
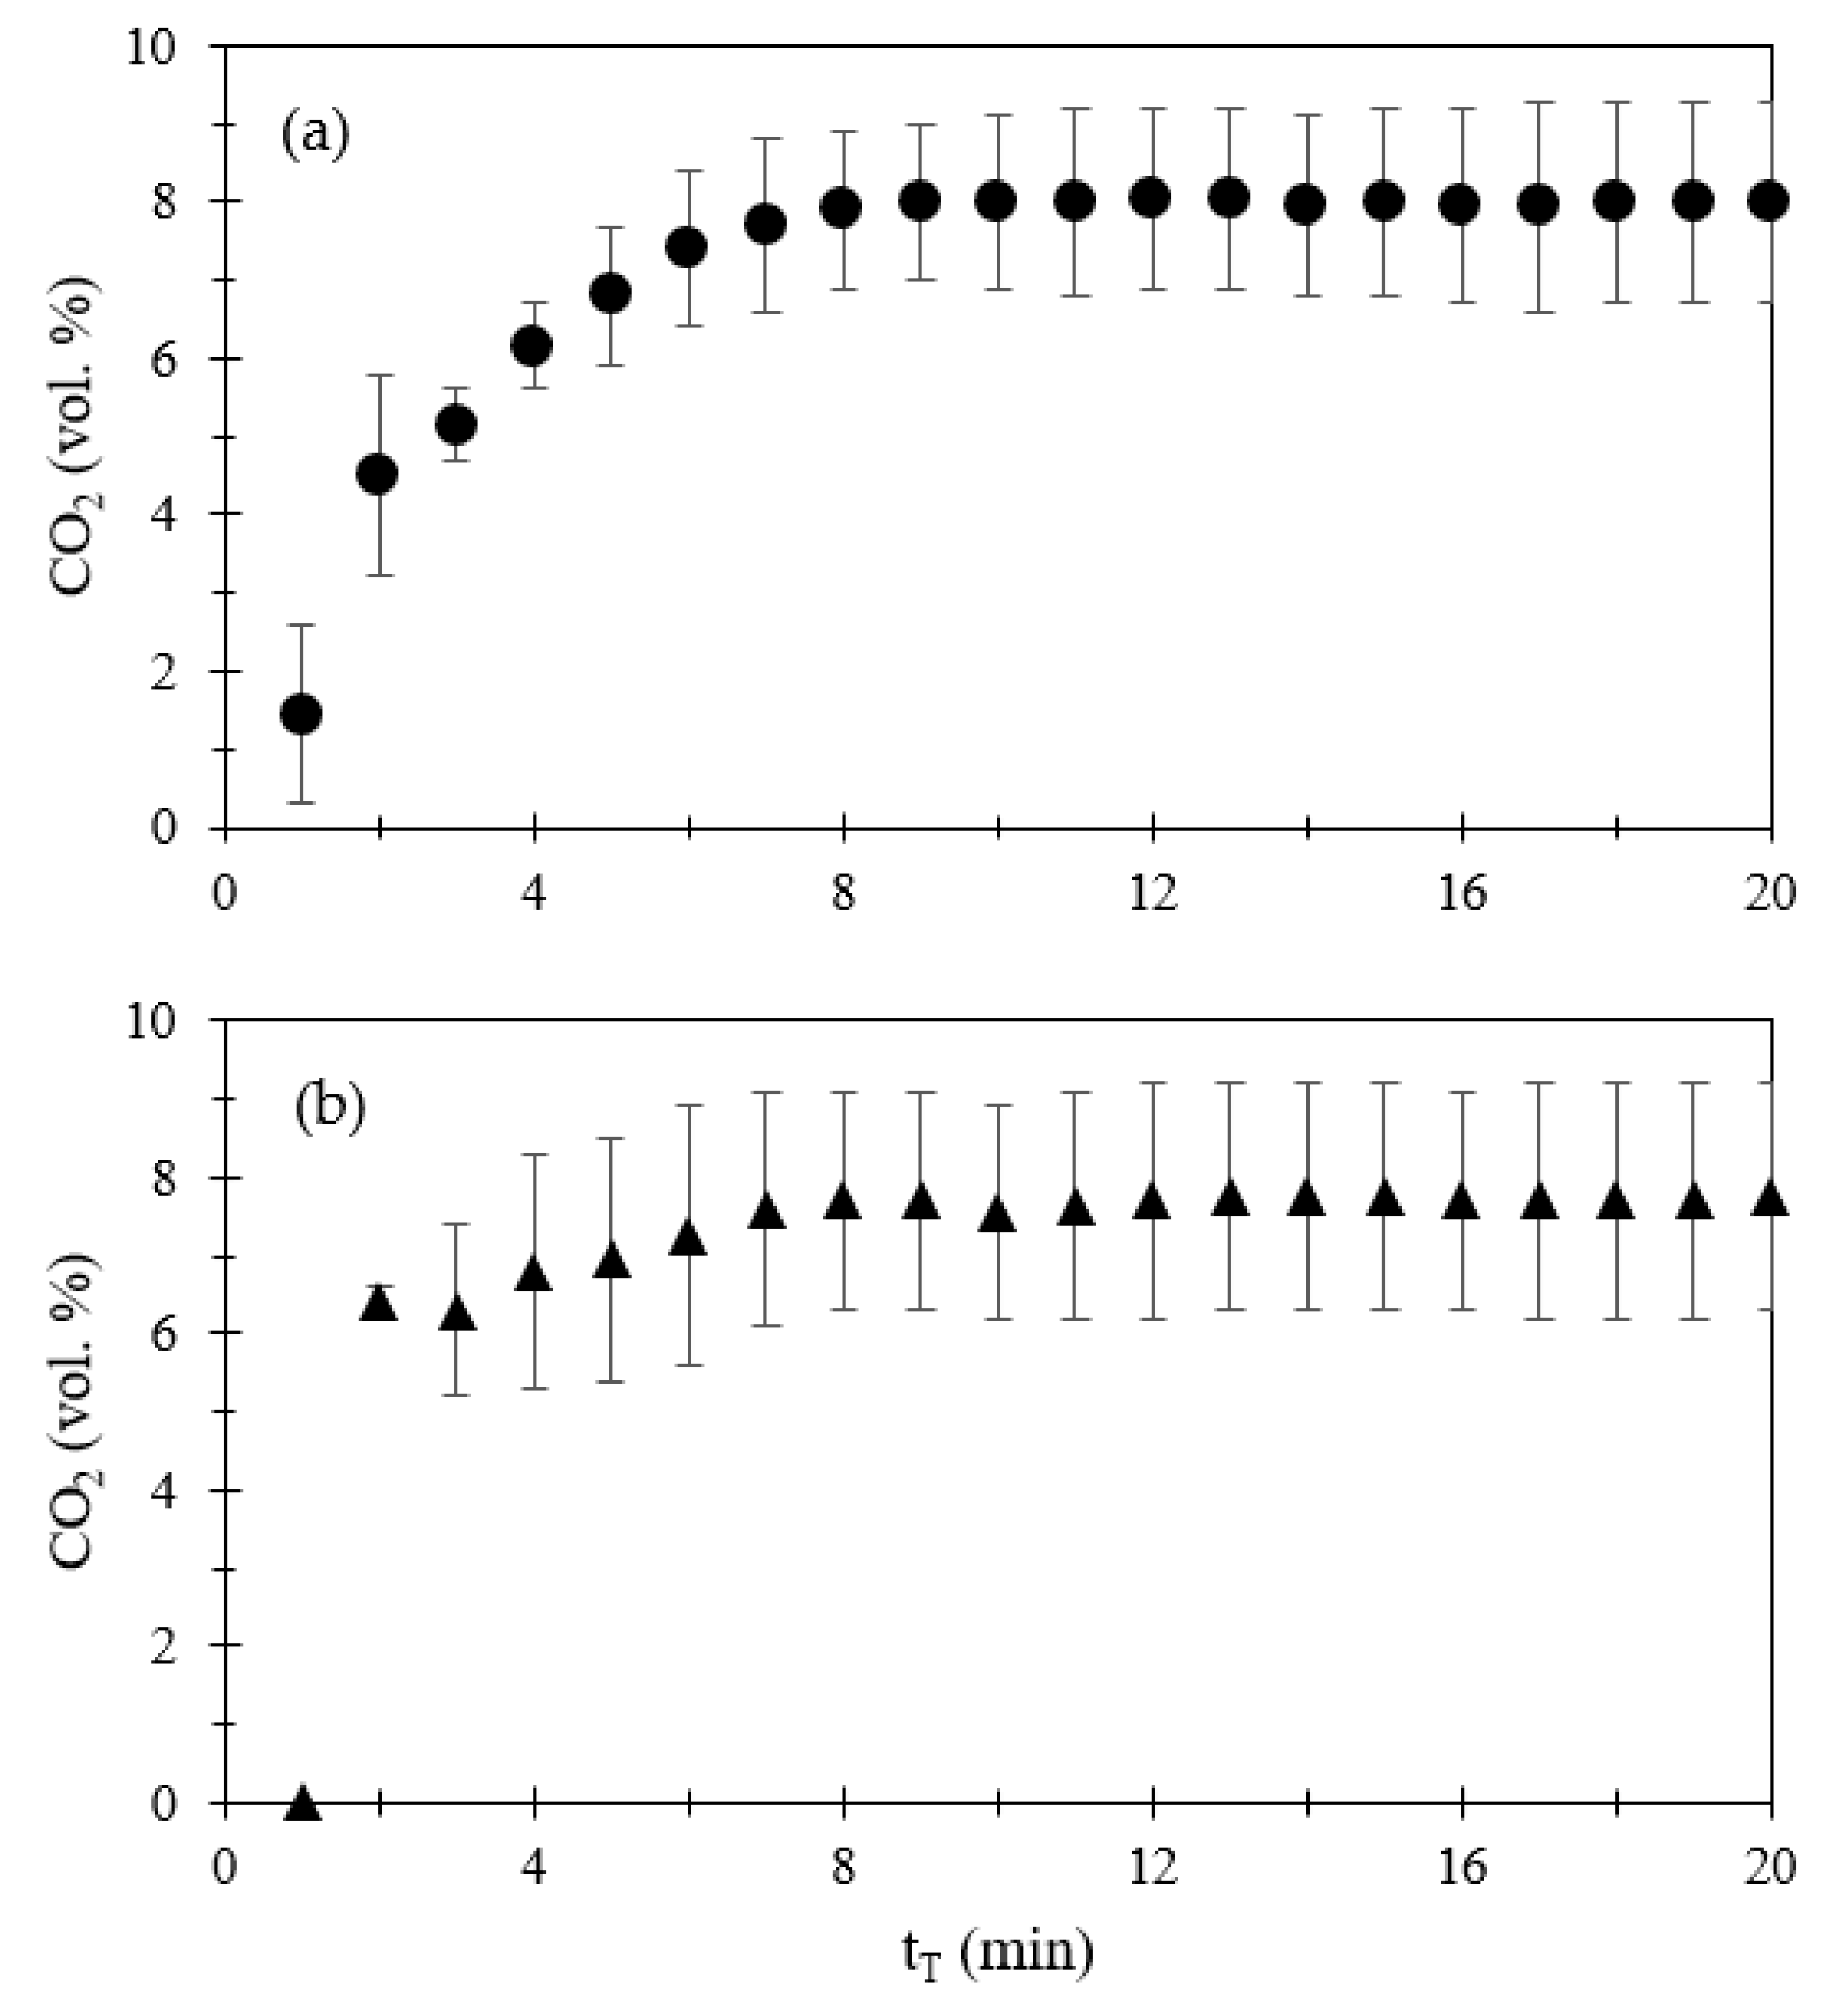
3.1.1. Emissions of CO, NOx, SO2, and CO2
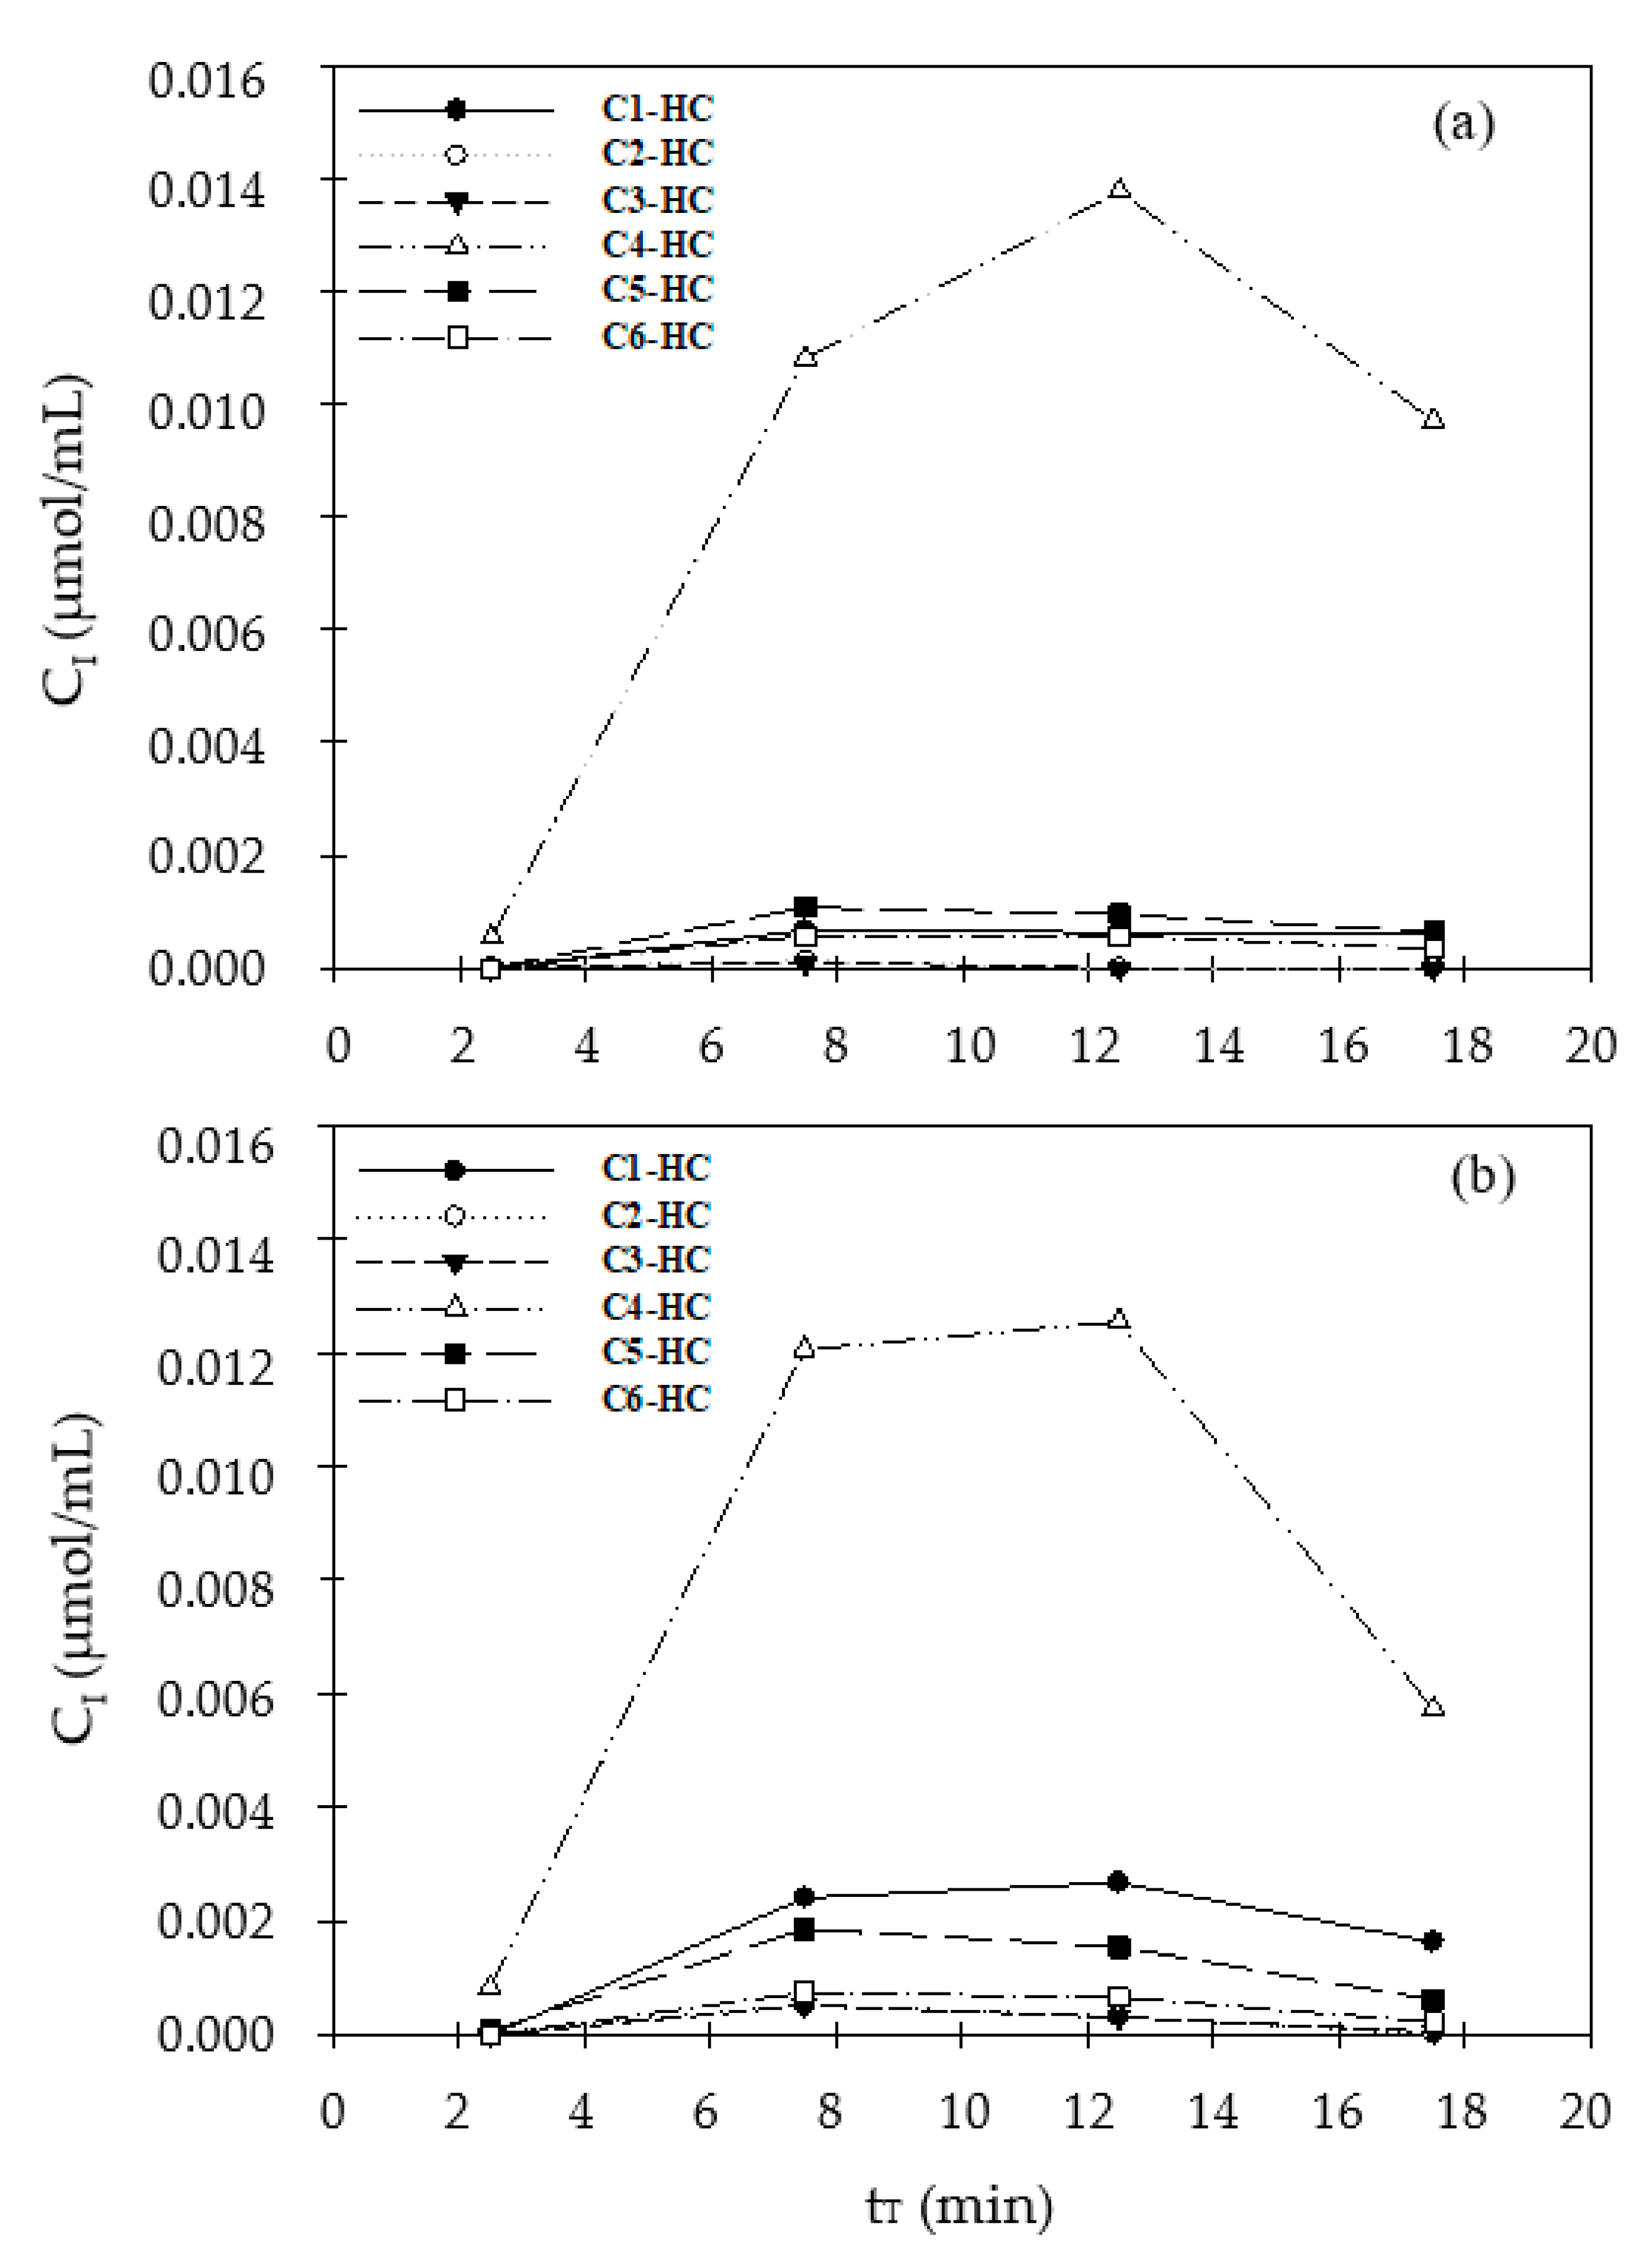
The instant concentrations of CO (CCOI) during the torrefaction process of WPST1-573-20 and WPST2-593-20 are illustrated in Figure 1. The concentration of CO shows a rapid increase during the early stages of torrefaction, reaching its peak at 1952.5 ppmv at 9 min for WPST1-573-20, and 3743.5 ppmv at 10 min for WPST2-593-20. Subsequently, after reaching the second peak at 1907 ppmv at 15 min for WPST1-573-20 and 1761.5 ppmv at 17 min for WPST2-593-20, the CCOI starts to decrease as the torrefaction progresses towards termination. The time at which the CCOI reaches 10% of its maximum value is similar for both cases, occurring at around 5 min (4.9 min for WPST1-573-20 and 5.1 min for WPST2-593-20). Similarly, the appearance times of the maximum CCOI values are also close, occurring at 9–10 min. The presence of the second peak indicates a two-stage decomposition process during the torrefaction of WPS, which can be attributed to the inherent constituents of wood waste and pulp sludge. Notably, the operation of WPST2-593-20 at a higher temperature of 593 K compared to WPST1-573-20 at 573 K results in a higher CO evolution.
Figure 2 illustrates the instantaneous concentrations of NOx (CNOxI) emitted during the torrefaction process for the selected samples. WPST2-593-20 exhibits higher CNOxI compared to WPST1-573-20, which can be attributed to its higher TT of 593 K compared to 573 K, as well as the higher nitrogen content (dry ash-free) of 2.44 wt.% in WPS2 compared to 1.06 wt.% in WPS1 [6]. The higher nitrogen content in WPS2 may be due to its mixture with secondary bio-sludge. Consequently, WPST1-573-20 reaches a maximum CNOxI of 26.5 ppmv at 18 min with no distinct peak, while WPST2-593-20 reaches a maximum CNOxI of 156 ppmv at 9 min with a sharp peak. The time at which 10% of the maximum CNOxI is reached occurs approximately 4.2 min earlier for WPST2-593-20 compared to 6.1 min for WPST1-573-20. The shorter time implies a faster torrefaction process.
As shown in Figure 3, the instant concentrations of SO2 (CSO2I) emitted by WPST2-593-20 are approximately one order of magnitude higher than those emitted by WPST1-573-20. This significant difference can be mainly attributed to the higher sulfur content in WPS2, which contains secondary bio-sludge, with a sulfur content of 1.84 wt.% compared to 0.18 wt.% in WPS1 [6]. Additionally, the higher TT of 593 K for WPST2-593-20 compared to 573 K for WPST1-573-20 also contributes to the higher emission concentration. Consequently, the peak value of CSO2I for WPST2-593-20 is much higher at 392 ppmv at 9 min, while WPST1-573-20 reaches a peak value of 31.5 ppmv at 8 min. The time required to reach 10% of the maximum CSO2I is approximately 4.7 min for WPST2-593-20, which is close to the 5.1 min for WPST1-573-20.
Figure 4 illustrates the instant concentrations of CO2 (CCO2I) emitted during the torrefaction process of the samples. It can be observed that both WPST1-573-20 and WPST2-593-20 show no distinct peaks in CO2 emission. Instead, they reach plateau values of 8.0 vol.% and 7.7 vol.% after 8 min, respectively. Compared to CO, NOx and SO2, the emission of CO2 is significantly higher. Notably, CCOI, CNOxI, and CSO2I decrease sharply from their peak values to lower level around 14–15 min for WPST2-593-20. The period of intensive torrefaction occurs between approximately 4.2 min and 15 min, lasting for about 10 min. This duration is similar to the period between 10 min and 20 min, which was reported by Chen et al. [36] in their study on emissions from torrefaction of waste bamboo chopsticks. Subsequently, the instant concentrations of emissions remain at considerable levels until the end of the 20 min torrefaction operation. If the torrefaction is extended beyond 20 min, the emissions would eventually stabilize.

3.1.2. Hydrocarbons

Figure 5 displays the instant concentrations of gaseous HCs ranging from C1-HC to C6-HC generated during the torrefaction process of WPST1-573-20 and WPST2-593-20. The primary HC component is C4-HC, with maximum concentrations of 1.38 × 10⁻² and 1.26 × 10⁻² μmol/mL as equivalent to butane for WPST1-573-20 and WPST2-593-20, respectively. The peak values occur between 10 and 15 min. The recovered C4-HC can serve as a fundamental compound for the production of derived chemicals. The total amounts of all C1-HC to C6-HC produced are calculated as 33.90 μmol for WPST1-573-20 and 37.48 μmol for WPST2-593-20, indicating that WPST2-593-20 generates more HCs than WPST1-573-20. This finding aligns with the results of Chen et al. [36], who studied the by-products and emissions of torrefied waste bamboo chopsticks at 563 K for 40 min (WBCT-563-20) and found that C4-HC was the predominant constituent among gaseous HCs. In terms of individual Cn-HC production, WPST1-573-20 yields approximately 1.56 μmol of C1-HC and 28.72 μmol of C4-HC, while WPST2-593-20 produces around 5.53 μmol of C1-HC and 25.71 μmol of C4-HC. The total amounts of other HCs, including C2-HC, C3-HC, C5-HC, and C6-HC, are 3.61 μmol for WPST1-573-20 and 6.24 μmol for WPST2-593-20, with WPST2-593-20 at a higher torrefaction temperature generating more of these HCs compared to WPST1-573-20.

3.1.3. Total Volume and Amount of Different Compounds in Emissions and Gas Products

Table 1 shows a comparison of the total volume and amount of different compounds in emissions and gas products obtained from the production of torrefied solid recovered fuels, specifically WPST1-573-20 and WPST2-593-20 in this study, with the results of WBCT-563-40 from Chen et al. [36]. It is worth noting that WBCT-563-40 had a tT twice as long as WPST1-573-20 and WPST2-593-20, resulting in higher emissions of CO, C1-HC and C2-C6 HCs. Additionally, the CO content in WBCT-563-40 is approximately 10 times higher than the combined content of C1-C6 HCs, whereas for WPST1-573-20 and WPST2-593-20, the CO content is about 5 times higher than the combined content of C1-C6 HCs. The identified gaseous compounds, such as CO, C1-HC, and C2-C6 HCs, can potentially be utilized as fuel sources. However, further research and optimization are required to enhance their concentrations and ensure their suitability for practical applications.

3.1.4. Comparison of Gas Emissions with Standards for Air Pollutant Emissions

Table 2 presents a comparison of the maximum emissions of SO2, NOx, and CO with the corresponding air pollutant emission standards. The emission of SO2 complies with the regulations due to the low sulfur content of WPS1 and WPS2. The moderate torrefaction temperatures of 573 K and 593 K result in low thermal NOx emissions, meeting the standard requirements. However, the emission of CO is highly influenced by the properties of the raw materials used for torrefaction. WPST2-593-20 emits a higher concentration of CO (3743.5 ppmv) compared to WPST1-573-20 (1952.5 ppmv) due to the higher atomic ratio of O/C in WPS2 (0.76) compared to WPS1 (0.67). Consequently, the CO emission from WPST2-593-20 exceeds the regulatory limits [39]. A similar study by Chen et al. [36] on WBCT-563-40, using WBC with an O/C ratio of 0.72, reported CO emissions of 4555.5 ppmv, which also exceeded the standard. Therefore, appropriate air pollution control measures for CO are necessary to ensure compliance with the regulations.

3.2. Characterizations of Liquid Products from the Torrefaction of WPS1 and WPS2

3.2.1. Yields of Liquid Products

Table 3 compares the yields of liquid (YML), solid (YMS), and gas (YMG) products for WPST1-573-20 and WPST2-593-20 with WBCT-563-40 from Chen et al. [36]. The YMG values for all three torrefied solid recovered fuels are similar, ranging from 0.16 to 0.17. WPST1-573-20 and WPST2-593-20 exhibit higher YML values of 0.28 and 0.24, respectively, compared to WBCT-563-40 with a YML value of 0.14. The higher YML is accompanied by a lower YMS, which generally leads to an increased energy densification ratio (ED). The ED values for WPST1-573-20, WPST2-593-20, and WBCT-563-40 are 1.50, 1.26, and 1.19, respectively.
The significant amount of condensed liquid product obtained highlights the importance of collecting condensable compounds from the exhaust gas, as they would otherwise be emitted as gaseous pollutants. Moreover, these condensed liquid products may have valuable applications, as discussed further in the results and discussion section.

3.2.2. Identification of Probable Constituents in Liquid Products

The liquid products obtained from manufacturing WPST1-573-20 and WPST2-593-20 were analyzed using GC-MS, and the identified compounds are listed in Table 4. The analysis revealed that the liquid products of WPST1-573-20 consist of alkanes, acids, esters, amides, and other compounds, with organic acids being the major constituents. Among these compounds, several have potential applications.
The results indicated that the liquid products for WPST1-573-20 consist of alkanes, acids, esters, amide and others, for which, organic acids are the major compounds. Among them, some useful constituents were obtained. For example, 2,3,6-Trichlorobenzaldehyde can be utilized as a precursor for the production of fungicides, e.g., pydiflumetofen [40]. The main utilizations of 2-chloro-2-nitro-propane are as pesticide [41]. 2-fluoro-acetamide can be used as rodenticide [42]. Mercaptamine (Cysteamine) has found its use as a medicine to treat nephropathic cystinosis [43]. 1,3-Dioxolane has been utilized as a co-monomer in polyacetals [44].
For the liquid products for WPST2-593-20, the constituents include alkanes with high carbon number (C11, C14, C16 and C20), sulfonic acid (C6H15NO5S), ester (Methyl formate), alcohols (2-Heptanol, 3-methyl-, and 1-Decanol) and ether (Eucalyptol). As noted by Chen et al. [36], long-chain alkanes are constituents of diesel fuel (C10-C40) and aviation fuel (C10-C20). N,N-Bis (2-hydroxyethyl)-2-aminoethanesulfonic acid (C6H15NO5S) is used as a buffer substance [45]. Methyl formate is used as a fumigant in agriculture and as a foaming agent in the production of polyurethane foams [46]. 1-Decanol is applied in the production of lubricants, plasticizers, solvents and surfactants [47]. Eucalyptol has found its uses in flavorings, fragrances and cosmetics [48].
It is important to note that the condensate liquid obtained in our study has high acidity and contains carbon-based organic compounds. However, it can still be utilized as pyroligneous liquor in agriculture due to its antimicrobial, antioxidant, pesticidal, and plant growth-enhancing properties [37], without the need for further refining. To obtain high-quality compounds suitable for specific applications, refining processes are necessary to extract various chemicals from the liquid byproducts. These chemicals can be used as (1) fungicides and pesticides, (2) solvents and surfactants, and (3) precursors or monomers in the synthesis of other chemicals. It should be noted that the constituents and properties of the products obtained from torrefaction in this study (WPST1 and WPST2) and in the study by Chen et al. [36] (WBCT) differ due to their inherent characteristics.

4. Conclusions

In this study, two batches of wood waste combined with pulp sludge, namely WPS1 and WPS2, were utilized to produce torrefied WPS products, WPST1 and WPST2. WPS1 exhibited higher fixed carbon and volatile matter contents, as well as lower ash, O/C, N, and S contents compared to WPS2. The torrefaction conditions for WPST1 were 573 K for 20 min (WPST1-573-20), while for WPST2, it was 593 K for 20 min (WPST2-593-20). During the torrefaction process, emissions and by-products in liquid and gas phases were examined and evaluated.
The results showed that the intensity and appearance of peak emissions were strongly influenced by the properties of the raw materials and the torrefaction temperature. WPST2-593-20 demonstrated more pronounced emissions compared to WPST1-573-20. The intensive torrefaction phase lasted approximately 10 min, occurring between 4.2 and 15 min. Instant emission concentrations remained significant until the end of the 20 min torrefaction process. Prolonging the torrefaction beyond 20 min would eventually lead to stabilized emissions. The concentration of CO in the flue gas exceeded the standard stationary emission regulation of 2000 ppbv, indicating the need for additional air pollution control measures. The non-condensable gases collected consisted of C1–C6 hydrocarbons with fuel values, with C4-HC being the major component. The condensate liquid obtained can be directly utilized as pyroligneous liquor in agriculture or further refined to obtain useful compounds for applications such as (1) fungicides and pesticides, (2) solvents and surfactants, and (3) precursors or monomers in the synthesis of other chemicals. These findings highlight the importance of understanding the composition and properties of emissions and by-products in order to advance sustainable biomass energy solutions and enhance waste management practices in the pulp industry.

Author Contributions

Conceptualization, M.H., C.-C.C. and C.-Y.C.; methodology, M.H., C.-C.C. and C.-Y.C.; formal analysis, M.H., W.-R.C., T.-Y.Y., Y.-H.C. (Yen-Hau Chen) and B.-L.L.; verification, M.H., Y.-H.C. (Yen-Hau Chen), C.-C.C. and M.-H.Y.; resources, J.-L.S., C.-H.W., Y.-H.C. (Yi-Hung Chen), F.-C.L., C.-F.L. and C.-P.Y.; writing—original draft preparation, M.H., C.-C.C., M.-H.Y. and C.-Y.C.; writing—review and editing, M.-H.Y. and C.-Y.C.; supervision, C.-Y.C.; funding acquisition, C.-Y.C. All authors have read and agreed to the published version of the manuscript.

Funding

This research was funded by National Science and Technology Council of Taiwan, grant number NSC 102-3113-P-002-038.

Data Availability Statement

The data presented in this study are available on request from the corresponding author.

Conflicts of Interest

The authors declare no conflict of interest.

Nomenclature and Abbreviation

Nomenclature
CCOIInstant emission concentration of CO (ppmv)
CCO2IInstant emission concentration of CO2 (vol. %)
CIInstant concentrations of gaseous products of HCs of Cn-HC (n = 1 to 6) (mmol/mL)
CmaxMaximum emission concentration during torrefaction (ppmv)
CNOxIInstant emission concentration of NOx (ppmv)
CnNumber of carbons (−)
Cn-HCHydrocarbons exhibiting similar chemical polarity of the alkane of CnH2n+2, n = 1 to 6 (−)
CSO2IInstant emission concentration of SO2 (ppmv)
EDEnergy densification ratio (−)
QNInlet flow rate of N2 to torrefaction reactor (mL/min)
TTemperature (K)
TTTorrefaction temperature (K)
tTime (min)
tTTorrefaction time (min)
WBCT-T-tWBCT sample with torrefied T (K) and t (min), e.g., WBCT-563-40 (−)
WPST-T-tWPST1 and WPST2 sample with torrefied T (K) and t (min), e.g., WPST1-573-20, WPST2-593-20 (−)
VG+NSum of volumes of inlet N2 and outlet gas products (mL)
VNVolume of inlet N2 (mL)
YMG Mass yield of gas product (−)
YML Mass yield of liquid product (−)
YM or YMSMass yield of solid (−)
Abbreviation
FIDFlame ionization detector
GCGas chromatography
GC-MSGas chromatography-mass spectrophotometer
HCsHydrocarbons
SBFSolid bio-fuel
SBFTTorrefied SBF
SRFSolid recovered fuel
SRFT Torrefied SRF
WBCs Waste bamboo chopsticks
WBCT Torrefied waste bamboo chopsticks
WPSWood waste with pulp sludge
WPSTTorrefied WPS

References

  1. TEPA (Taiwan Environmental Protection Administration). National Inventory Report. 2022. Available online: https://www.epa.gov.tw/eng/C822CC8F362AE1E2. (accessed on 22 April 2023).
  2. Promnuan, K.; O-Thong, S. Efficiency evaluation of biofilter for hydrogen sulfide removal from palm oil mill biogas. Energy Procedia 2017, 138, 564–568. [Google Scholar] [CrossRef]
  3. Schlegelmilch, M.; Streese, J.; Biedermann, W.; Herold, T.; Stegmann, R. Odour control at biowaste composting facilities. Waste Manag. 2005, 25, 917–927. [Google Scholar] [CrossRef]
  4. Papurello, D.; Gandiglio, M.; Kafashan, J.; Lanzini, A. Biogas purification: A comparison of adsorption performance in D4 siloxane removal between commercial activated carbons and waste wood-derived char using isotherm equations. Processes 2019, 7, 774. [Google Scholar] [CrossRef] [Green Version]
  5. Chen, Y.H.; Chang, C.C.; Chang, C.Y.; Yuan, M.H.; Ji, D.R.; Shie, J.L.; Chen, Y.H.; Chang, W.R.; Yang, T.Y.; Lee, C.H.; et al. Production of solid bio-fuel from waste bamboo chopsticks by torrefaction. J. Anal. Appl. Pyrol. 2017, 126, 315–322. [Google Scholar] [CrossRef]
  6. Huang, M.; Chang, C.C.; Yuan, M.H.; Chang, C.Y.; Wu, C.H.; Shie, J.L.; Chen, Y.H.; Chen, Y.H.; Ho, C.; Chang, W.R.; et al. Production of torrefied solid bio-fuel from pulp industry waste. Energies 2017, 10, 910. [Google Scholar] [CrossRef] [Green Version]
  7. Chen, W.H.; Ho, K.Y.; Lee, K.T.; Lu, D.; Lin, A.K.Y.; Rajendran, S.; Singh, Y.; Chang, J.S. Dual pretreatment of mixing H2O2 followed by torrefaction to upgrade spent coffee grounds for fuel production and upgrade level identification of H2O2 pretreatment. Environ. Res. 2022, 215, 114016. [Google Scholar] [CrossRef] [PubMed]
  8. Hsu, T.C.; Chang, C.C.; Yuan, M.H.; Chang, C.Y.; Chen, Y.H.; Lin, C.F.; Ji, D.R.; Shie, J.L.; Manh, D.V.; Wu, C.H.; et al. Upgrading of Jatropha-seed residue after mechanical extraction of oil via torrefaction. Energy 2018, 142, 773–781. [Google Scholar] [CrossRef]
  9. Liu, X.; Li, D.; Yang, J.; Yuan, L. Kinetic mechanisms and emissions investigation of torrefied pine sawdust utilized as solid fuel by isothermal and non-isothermal experiments. Materials 2022, 15, 8650. [Google Scholar] [CrossRef] [PubMed]
  10. Waheed, M.A.; Akogun, O.A.; Enweremadu, C.C. An overview of torrefied bioresource briquettes: Quality-influencing parameters, enhancement through torrefaction and applications. Bioresour. Bioproces. 2022, 9, 122. [Google Scholar] [CrossRef]
  11. Yuan, M.H.; Chang, C.C.; Hsu, T.C.; Shie, J.L.; Chen, Y.H.; Chang, C.Y.; Lin, C.F.; Yu, C.P.; Wu, C.H.; Do, M.V.; et al. A technical analysis of solid recovered fuel from torrefied jatropha seed residue via a two-stage mechanical screw press and solvent extraction process. Energies 2021, 14, 7876. [Google Scholar] [CrossRef]
  12. Ali, A.M.; Waheed, A.; Shahbaz, M.; Al-Zahrani, A.A.; Nawaz, A.M.; Mahpudz, A.B. Synergistic evaluation of co-torrefaction performance of rice husk and coffee bean ground blends for biosolid production for industrial fuel sustainability. Fuel 2023, 343, 127891. [Google Scholar] [CrossRef]
  13. Deng, J.; Wang, G.J.; Kuang, J.H.; Zhang, Y.L.; Luo, Y.H. Pretreatment of agricultural residues for co-gasification via torrefaction. J. Anal. Appl. Pyrolysis 2009, 86, 331–337. [Google Scholar] [CrossRef]
  14. Pimchuai, A.; Dutta, A.; Basu, P. Torrefaction of agriculture residue to enhance combustible properties. Energy Fuel 2010, 24, 4638–4645. [Google Scholar] [CrossRef]
  15. Seithtanabutara, V.; Kaewmahawong, S.; Polvongsri, S.; Wang, J.; Wongwuttanasatian, T. Impact of positive and negative pressure on rice straw torrefaction: Optimization using response surface methodology. Case Stud. Chem. Environ. Eng. 2023, 7, 100322. [Google Scholar] [CrossRef]
  16. Yang, T.Y. Torrefaction of Rice Straw and Biofiber. Master’s Thesis, Graduate Institute of Environment Engineering, National Taiwan University, Taipei, Taiwan, 2012. (In Chinese). [Google Scholar]
  17. Zhai, Y.; Yang, T.; Zhang, Y.; Zhu, Y. Co-pyrolysis characteristics of raw/torrefied corn stalk and oil shale. J. Anal. Appl. Pyrol. 2023, 171, 105967. [Google Scholar] [CrossRef]
  18. Arias, B.; Pevida, C.; Fermoso, J.; Plaza, M.G.; Rubiera, F.; Pis, J.J. Influence of torrefaction on the grindability and reactivity of woody biomass. Fuel Process. Technol. 2008, 89, 169–175. [Google Scholar] [CrossRef] [Green Version]
  19. Bourgois, J.; Guyonnet, R. Characterization and analysis of torrefied wood. Wood Sci. Technol. 1988, 22, 143–155. [Google Scholar] [CrossRef]
  20. Chen, W.H.; Hsu, H.C.; Lu, K.M.; Lee, W.J.; Lin, T.C. Thermal pretreatment of wood (Lauan) block by torrefaction and its influence on the properties of the biomass. Energy 2011, 36, 3012–3021. [Google Scholar] [CrossRef]
  21. Sensöz, S. Slow pyrolysis of wood barks from Pinus brutia Ten. and product compositions. Bioresour. Technol. 2003, 89, 307–311. [Google Scholar] [CrossRef]
  22. Bridgeman, T.; Jones, J.; Williams, A.; Waldron, D. An investigation of the grindability of two torrefied energy crops. Fuel 2010, 89, 3911–3918. [Google Scholar] [CrossRef] [Green Version]
  23. Phanphanich, M.; Mani, S. Impact of torrefaction on the grindability and fuel characteristics of forest biomass. Bioresour. Technol. 2011, 102, 1246–1253. [Google Scholar] [CrossRef]
  24. Balat, M.; Balat, M.; Kırtay, E.; Balat, H. Main routes for the thermo-conversion of biomass into fuels and chemicals. Part 1: Pyrolysis systems. Energy Convers. Manag. 2009, 50, 3147–3157. [Google Scholar] [CrossRef]
  25. Bergman, P.C.A.; Boersma, A.R.; Zwart, R.W.R.; Kiel, J.H.A. Torrefaction for Biomass Co-Firing in Existing Coal-Fired Power Stations. BIOCOAL; Energy Research Centre of the Netherlands: Utrecht, The Netherlands, 2005.
  26. Huang, Y.F.; Chiueh, P.T.; Lo, S.L. A review on microwave pyrolysis of lignocellulosic biomass. Sustain. Environ. Res. 2016, 26, 103–109. [Google Scholar]
  27. Mei, Y.; Chen, Y.; Zhang, S.; Zheng, Y.; Li, W.; Chai, H.; Liu, K. Effect of temperature oscillation on torrefaction and pyrolysis of elm branches. Energy 2023, 271, 127055. [Google Scholar] [CrossRef]
  28. Pentananunt, R.; Rahman, A.N.M.M.; Bhattacharya, S.C. Upgrading of biomass by means of torrefaction. Energy 1990, 15, 1175–1179. [Google Scholar] [CrossRef]
  29. Jiang, Y.; Li, C.; Zhang, L.; Lin, H.; Zhang, S.; Wang, Y.; Hu, S.; Xiang, J.; Hu, X. Influence of torrefaction with microwave and furnace heating on pyrolysis of poplar sawdust. Fuel Process. Technol. 2023, 245, 107696. [Google Scholar] [CrossRef]
  30. Sadaka, S.; Negi, S. Improvements of biomass physical and thermochemical characteristics via torrefaction process. Environ. Prog. Sustain. Energy 2009, 28, 427–434. [Google Scholar] [CrossRef]
  31. Sáiz-Jiménez, C.; De Leeuw, J.W. Lignin pyrolysis products: Their structures and their significance as biomarkers. Org. Geochem. 1986, 10, 869–876. [Google Scholar] [CrossRef] [Green Version]
  32. Tumuluru, J.S.; Sokhansanj, S.; Hess, J.R.; Wright, C.T.; Boardman, R.D. A review on biomass torrefaction process and product properties for energy applications. Ind. Biotechnol. 2011, 7, 384–401. [Google Scholar] [CrossRef] [Green Version]
  33. Van der Stelt, M.; Gerhauser, H.; Kiel, J.; Ptasinski, K. Biomass upgrading by torrefaction for the production of biofuels: A review. Biomass Bioenerg. 2011, 35, 3748–3762. [Google Scholar] [CrossRef]
  34. Lee, K.T.; Shih, Y.T.; Rajendran, S.; Park, Y.K.; Chen, W.H. Spent coffee ground torrefaction for waste remediation and valorization. Environ. Pollut. 2023, 324, 121330. [Google Scholar] [CrossRef] [PubMed]
  35. Zhang, C.; Wang, M.; Chen, W.H.H.; Zhang, Y.; Pétrissans, A.; Pétrissans, M.; Ho, S.H.H. Superhydrophobic and superlipophilic biochar produced from microalga torrefaction and modification for upgrading fuel properties. Biochar 2023, 5, 18. [Google Scholar] [CrossRef]
  36. Chen, Y.H.; Chang, C.C.; Chang, C.Y.; Yuan, M.H.; Ji, D.R.; Ho, C.; Chiou, C.S.; Shie, J.L.; Chen, Y.H.; Chang, W.R.; et al. The by-products and emissions from manufacturing torrefied solid fuel using waste bamboo chopsticks. Environments 2017, 4, 36. [Google Scholar] [CrossRef] [Green Version]
  37. Grewal, A.; Abbey, L.; Gunupuru, L.R. Production, prospects and potential application of pyroligneous acid in agriculture. J. Anal. Appl. Pyrol. 2018, 135, 152–159. [Google Scholar] [CrossRef]
  38. Park, C.; Jang, E.S.; Kim, Y.M. The temperature effect on the production of liquid and solid fuel via wood pellet torrefaction. Korean J. Chem. Eng. 2023, in press. [CrossRef]
  39. TEPA (Taiwan Environmental Protection Administration). Standards for Air Pollutant Emission from Stationary Pollution Sources. 2021. Available online: https://law.moj.gov.tw/ENG/LawClass/LawAll.aspx?pcode=O0020006 (accessed on 22 April 2023).
  40. Jeanmart, S.; Edmunds, A.J.F.; Lamberth, C.; Pouliot, M.; Morris, J.A. Synthetic approaches to the 2015–2018 new agrochemicals. Bioorg. Med. Chem. 2021, 39, 116162. [Google Scholar] [CrossRef]
  41. Propane, 2-Chloro-2-nitro-. Available online: https://www.chemicalbook.com/ProductMSDSDetailCB3738690.htm (accessed on 22 April 2023).
  42. Acetamide, 2-Fluoro-. Available online: https://en.wikipedia.org/wiki/Fluoroacetamide (accessed on 22 April 2023).
  43. Mercaptamine. Available online: https://en.wikipedia.org/wiki/Cysteamine (accessed on 22 April 2023).
  44. 1,3-Dioxolane. Available online: https://en.wikipedia.org/wiki/Dioxolane (accessed on 22 April 2023).
  45. N,N-Bis (2-Hydroxyethyl)-2-aminoethanesulfonic Acid. Available online: https://pubchem.ncbi.nlm.nih.gov/compound/N_N-Bis_2-hydroxyethyl_-2-aminoethanesulfonic-acid (accessed on 22 April 2023).
  46. Methyl Formate as Blowing Agent in the Manufacture of Polyurethane Foam Systems. 2021. Available online: https://www.undp.org/sites/g/files/zskgke326/files/publications/MethylalFormate_FINAL_WEB.pdf (accessed on 9 June 2023).
  47. Decanol. Available online: https://en.wikipedia.org/wiki/1-Decanol (accessed on 22 April 2023).
  48. Eucalyptol. Available online: https://en.wikipedia.org/wiki/Eucalyptol (accessed on 22 April 2023).
Figure 1. The instant concentrations of CO during the torrefaction process of (a) WPST1-573-20 and (b) WPST2-593-20.
Environments 10 00135 g001
Figure 2. The instant concentrations of NOx during the torrefaction process of (a) WPST1-573-20 and (b) WPST2-593-20.
Environments 10 00135 g002
Figure 3. The instant concentrations of SO2 during the torrefaction process of (a) WPST1-573-20 and (b) WPST2-593-20.
Environments 10 00135 g003
Figure 4. The instant concentrations of CO2 during the torrefaction process of (a) WPST1-573-20 and (b) WPST2-593-20.
Environments 10 00135 g004
Figure 5. Instant concentrations of gaseous hydrocarbons (HCs) of C1-HC to C6-HC produced during the torrefaction process of (a) WPST1-573-20 and (b) WPST2-593-20.
Environments 10 00135 g005
Table 1. Total volume and amount of different compounds in emissions and gas products collected from manufacturing torrefied solid recovered fuels of WPST1-573-20 and WPST2-593-20.
CompoundVolume a (mL)Volume (mL)Amount (μmol)Amount (mg)
CO *16.24.2 b,d; 5.43 b,e171.42 b,d; 221.63 b,e4.8 b,d; 6.21 b,e
NOx (NO2)small0.047; 0.2191.92; 8.940.088; 0.411
SO2small0.059; 0.5012.41; 20.450.154; 1.309
CO2 *41.4235.95; 233.319630.61; 9522.86423.747; 419.006
O2 *79.5273.90; 278.3611,179.59; 11,361.63357.747; 363.572
C1–C6 HCs *1.740.831 c,d; 0.918 c,e33.90 c,d; 37.48 c,e1.961 c,d; 1.995 c,d
C1–HC0.190.038; 0.1351.56; 5.530.025; 0.089
C4–HC-0.704; 0.63028.72; 25.711.666; 1.491
C2, C3, C5, C6- HCs1.550.088; 0.1533.61; 6.240.270; 0.415
C2-C6 HCs1.550.793; 0.78332.34; 31.951.936; 1.906
H2O *51.2NM fNMNM
Total of terms with *190514.88 d; 518.02 e21,015.52 d; 21,143.6 e788.26 d; 790.78 e
Total gases measured from flowmeter183NMNMNM
a Data of Chen et al. [36]; total gases measured from flowmeter: Estimated as difference of VG+N (sum of volumes of inlet N2 and outlet gas products) of 4183 mL and VN (volume of inlet N2) of 4000 mL; QN (inlet flow rate of N2) = 100 mL/min; TT = 563 K. tT = 40 min; biomass used were waste bamboo chopsticks (WBCs); initial mass of dried WBC = 3 g. b This study: With data obtained from continuous measurements at every minute in total tT of 20 min with inlet flow rate of N2 to torrefaction reactor (QN) at 165 mL/min; initial mass of dried WPS = 5 g. c This study: With data obtained from measurements for every 5 min in total tT of 20 min with QN at 165 mL/min. d WPST1-573-20. e WPST2-593-20. f Not measured. * Gaseous compounds of CO, CO2, O2, C1-C6 HCs and H2O.
Table 2. Comparison of emissions of SO2, NOx and CO with standards for air pollutant emissions.
ItemEmission Standards a
(ppmv)
Cmax b,c
(ppmv)
Cmax b,d
(ppmv)
SO265058.031.5 e; 392 f
NO225067.5 g26.5 e,g; 156 f,g
CO20004555.51952.5 e; 3743.5 f
a Emission standards of stationary sources in Taiwan [39]. Reference yearly average velocity of wind: 3.5 m/s; SO2 and NO2: Standards of processes excluding combustion. b Cmax: Maximum emission concentration during torrefaction. c Data of WBCT-563-40 from Chen et al. [36]. d This study. e WPST1-573-20. f WPST2-593-20. g Concentration of NOx.
Table 3. Solid, liquid and gas products from manufacturing torrefied wood waste with pulp sludge (WPST) of WPST1-573-20 and WPST2-593-20.
TT-tT (K-min)Mass (g) aMass Yield (-)
Solid bLiquidGas c Solid b
YMS
Liquid
YML
Gas c
YMG
563-40 WBCT2.07 d0.43 d0.51 d0.69 d0.14 d0.17 d
573-20 WPST12.82 e1.39 f0.788 g0.56 e0.28 f0.16 g
593-20 WPST23.03 e1.18 f0.791 g0.61 e0.24 f0.16 g
a Initial mass of dried WPS = 5 g. b Dry basis. c Excluding nitrogen gas. d Data for making torrefied waste bamboo chopsticks (WBCT) at 563 K and 40 min [36]; energy densification ratio ED = 1.19. e Data of Huang et al. [6]; ED = 1.50 and 1.26 for WPST1-573-20 and WPST2-593-20, respectively. f By balance of masses of input solid and those of output solid and gas. g This study.
Table 4. Structures of possible compounds of liquid products for producing WPST1-573-20 and WPST2-593-20.
WPST1-573-20 (5 Compounds)
Compound2,3,6-TrichlorobenzaldehydePropane, 2-Chloro-2-Nitro-Acetamide, 2-Fluoro-
FormulaCl3C6H2CHOC3H6ClNO2C2H4FNO
StructureEnvironments 10 00135 i001Environments 10 00135 i002Environments 10 00135 i003
CompoundMercaptamine1,3-Dioxolane
FormulaC2H7NSC3H6O2
StructureEnvironments 10 00135 i004Environments 10 00135 i005
WPST2-593-20 (9 Compounds)
CompoundHexadecaneN,N-Bis (2-hydroxyethyl)-
2-aminoethanesulfonic acid
Methyl formate
FormulaC16H34C6H15NO5SHCO2CH3
StructureEnvironments 10 00135 i006Environments 10 00135 i007Environments 10 00135 i008
CompoundEicosaneUndecane2-Heptanol, 3-methyl-
FormulaC20H42C11H24C8H18O
StructureEnvironments 10 00135 i009Environments 10 00135 i010Environments 10 00135 i011
Compound1-DecanolTetradecaneEucalyptol
FormulaC10H22OC14H30C10H18O
StructureEnvironments 10 00135 i012Environments 10 00135 i013Environments 10 00135 i014
Disclaimer/Publisher’s Note: The statements, opinions and data contained in all publications are solely those of the individual author(s) and contributor(s) and not of MDPI and/or the editor(s). MDPI and/or the editor(s) disclaim responsibility for any injury to people or property resulting from any ideas, methods, instructions or products referred to in the content.

