4.1. Exploratory Factor Analysis
Exploratory factor analysis was conducted on the 19 items in the exploratory subsample using SPSS 27.0. The KMO value was 0.881, and Bartlett’s test of sphericity was statistically significant (χ2 = 5422.278, df = 171, p < 0.001), indicating that the correlation structure among the items was suitable for factor analysis. Because the constructs could be correlated, common factors were extracted using principal axis factoring with oblique rotation and Kaiser normalization.
Six factors were extracted. The first six initial eigenvalues ranged from 1.039 to 6.065, and the cumulative variance explained after extraction was 54.513%. Extracted communalities ranged from 0.337 to 0.714. Factor extraction was completed after 18 iterations, and rotation converged after 10 iterations.
The pattern matrix showed that all 19 items had their largest absolute loadings on their hypothesized factors. Absolute primary loadings ranged from 0.521 to 0.860, all exceeding 0.50. The corresponding ranges for EPC, EPD, CDR, ECR, VJD, and VCS were 0.540–0.855, 0.594–0.750, 0.580–0.770, 0.709–0.801, 0.550–0.860, and 0.521–0.664, respectively. No absolute loading on a non-target factor exceeded 0.179, and the difference between the absolute primary loading and the largest absolute secondary loading was at least 0.348 for every item, indicating relatively clear item–factor assignments. The correlation coefficients among the six factors range from 0.040 to 0.577, and the factor correlation matrix is shown in
Table 2.
4.2. Descriptive Statistics and Correlation Analysis
Descriptive statistics and Pearson correlations were calculated using the 1335 valid cases, as reported in
Table 3. The mean scores for experienced polarization within online communities (EPC) and experienced polarization in open online discussions (EPD) were 3.46 (SD = 0.78) and 3.48 (SD = 0.79), respectively. The corresponding means for cognitive dissonance response (CDR) and emotional contagion response (ECR) were 2.93 (SD = 0.79) and 2.89 (SD = 0.98). Value judgment difficulty (VJD) and value choice susceptibility (VCS) had mean scores of 3.41 (SD = 0.85) and 3.06 (SD = 0.67), respectively.
Bivariate analyses revealed significant positive correlations among all six core constructs (r = 0.285–0.530, all p < 0.01). Both forms of experience of online group polarization were positively correlated with cognitive dissonance response and emotional contagion response (r = 0.285–0.420), as well as with value judgment difficulty and value choice susceptibility (r = 0.320–0.408). Cognitive dissonance response correlated with value judgment difficulty and value choice susceptibility at 0.430 and 0.495, respectively, while the corresponding correlations for emotional contagion response were 0.426 and 0.480. The correlation between the two forms of polarization experience was 0.368, that between the two psychological responses was 0.530, and that between value judgment difficulty and value choice susceptibility was 0.490.
Regarding internet use and online participation, average daily internet use (Q5) was significantly and positively correlated with all six core constructs (r = 0.127–0.183, all p < 0.01). Online community membership status (Q7), frequency of browsing discussions of trending topics (Q8), and mode of participation in discussions of trending topics (Q9) were also significantly and positively correlated with all six constructs. Their respective correlation ranges were 0.089–0.360, 0.170–0.325, and 0.101–0.360 (all p < 0.01). Given the coding of these variables, the results indicate that longer internet use, higher levels of community membership and activity, more frequent browsing of discussion spaces, and more active modes of discussion participation were associated with higher scores on both forms of polarization experience, both psychological responses, value judgment difficulty, and value choice susceptibility.
Among the demographic variables, gender (male = 0, female = 1) was significantly and positively correlated with EPC, ECR, and VJD, and significantly and negatively correlated with EPD. This indicates that female students had higher mean scores on the first three constructs and lower mean scores on EPD. Academic year codes were significantly and negatively correlated with EPD, CDR, and VJD, with coefficients of −0.056, −0.106, and −0.070, respectively (all p < 0.05). Field of study (science and engineering = 0, other fields = 1) was significantly and positively correlated with EPC, CDR, and ECR, with coefficients of 0.097, 0.065, and 0.071, respectively (all p < 0.05). The absolute correlations between these demographic variables and the core constructs did not exceed 0.168. All seven covariates were included simultaneously in the subsequent structural model to examine conditional associations among the core constructs.
4.5. Confirmatory Factor Analysis
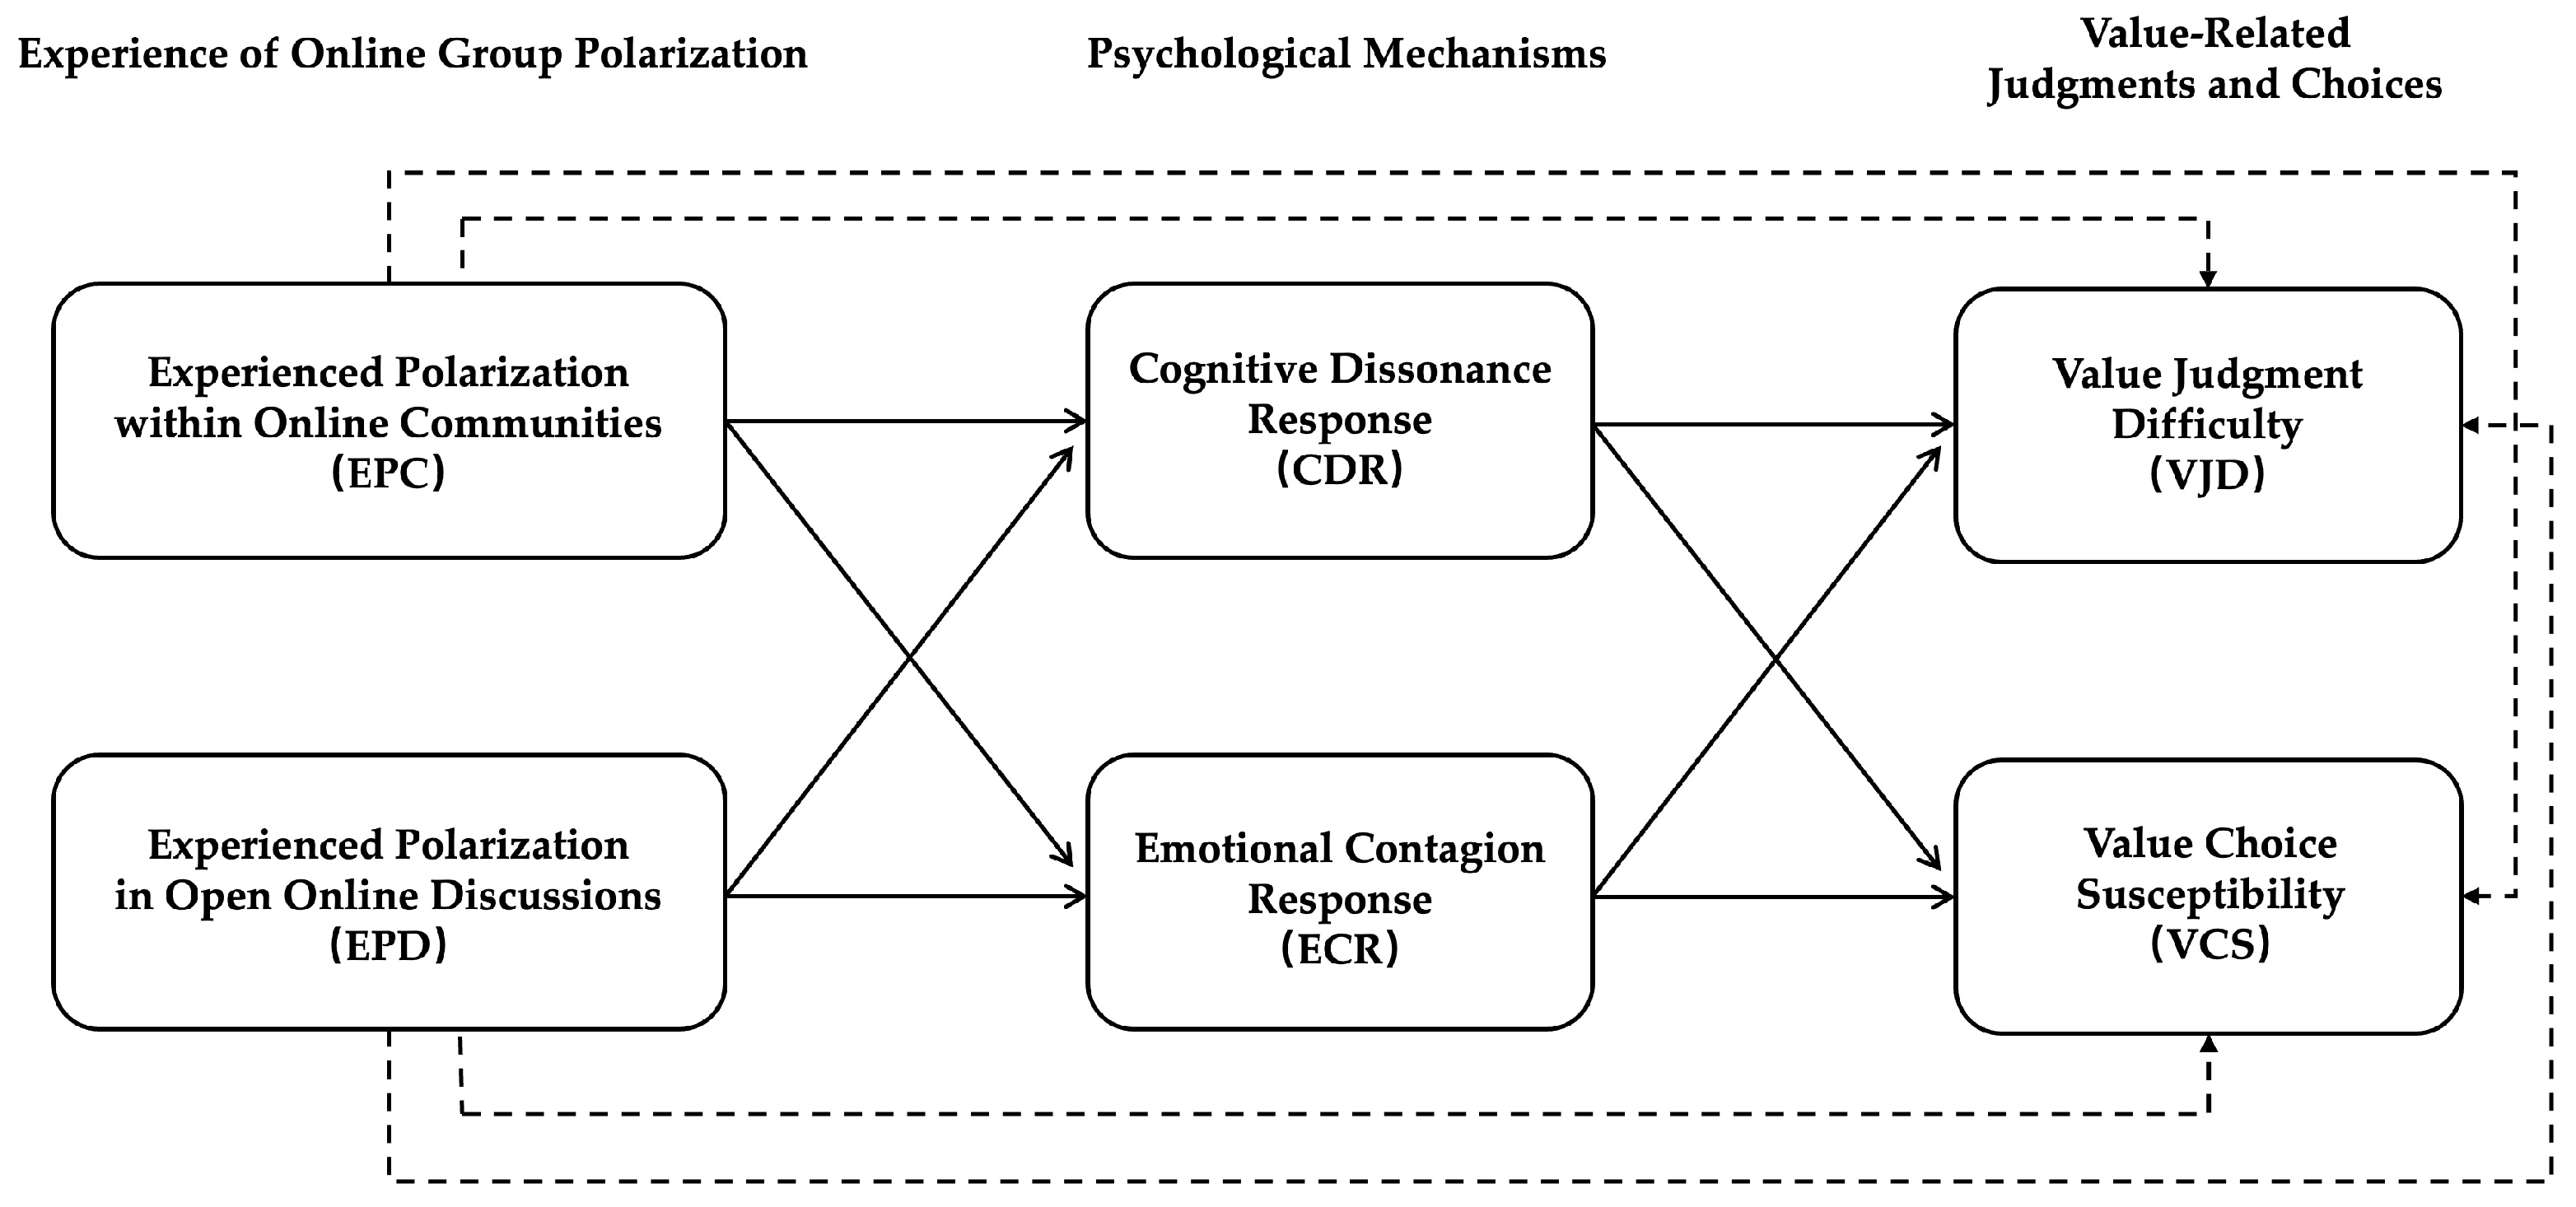
Confirmatory factor analysis (CFA) was conducted to further assess the structural validity of the measurement model. Consistent with the theoretical model, EPC, EPD, CDR, ECR, VJD, and VCS were specified as six first-order latent variables, and parameters were estimated using robust maximum likelihood (MLR).
The CFA results indicated that the six-factor measurement model fitted the data well: χ2 = 509.029, df = 137, χ2/df = 3.72, CFI = 0.951, TLI = 0.939, SRMR = 0.042, and RMSEA = 0.045, with a 90% confidence interval of [0.041, 0.049]. All indices met the recommended criteria for structural equation modeling. The good overall fit indicates that the theoretically specified six-factor measurement structure adequately represented the covariance relationships among the observed variables.
To further assess the superiority of the six-factor measurement structure, five alternative models were specified for comparison (
Table 5). Model 2 combined EPC and EPD into a single “experience of online group polarization” factor. Model 3 additionally combined the mediators, CDR and ECR, and Model 4 further combined the outcome variables, VJD and VCS. Model 5 combined EPC, EPD, CDR, and ECR into one factor and VJD and VCS into another. Model 6 loaded all items onto a single latent variable.
The six-factor model demonstrated the best fit among the competing models, with the highest CFI and TLI and the lowest RMSEA and SRMR, indicating clearly better fit than the alternatives. These findings support the six-factor structure in the present sample, while the AVE values below 0.50 for four constructs indicate that convergent validity remains relatively modest (
Table 4).
4.6. Structural Model and Hypothesis Testing
The structural model was estimated using maximum likelihood in Mplus 8.3 with the 1335 valid cases. It simultaneously included paths from EPC and EPD to CDR and ECR, paths from CDR and ECR to VJD and VCS, and four direct paths from EPC and EPD to VJD and VCS. Gender, academic year, field of study, average daily internet use, online community membership status, frequency of browsing discussions of trending topics, and mode of participation in discussions of trending topics were included as covariates in the regression equations for all six latent variables. Residuals were allowed to correlate between EPC and EPD, between CDR and ECR, and between VJD and VCS.
The structural model yielded the following fit indices: χ2 = 801.874, df = 228, χ2/df = 3.52, p < 0.001, CFI = 0.940, TLI = 0.920, RMSEA = 0.043, with a 90% confidence interval of [0.040, 0.047], and SRMR = 0.036. Taken together, these indices indicated acceptable overall fit, with RMSEA and SRMR indicating good fit. In addition, AIC was 62,491.033 and BIC was 63,083.455.
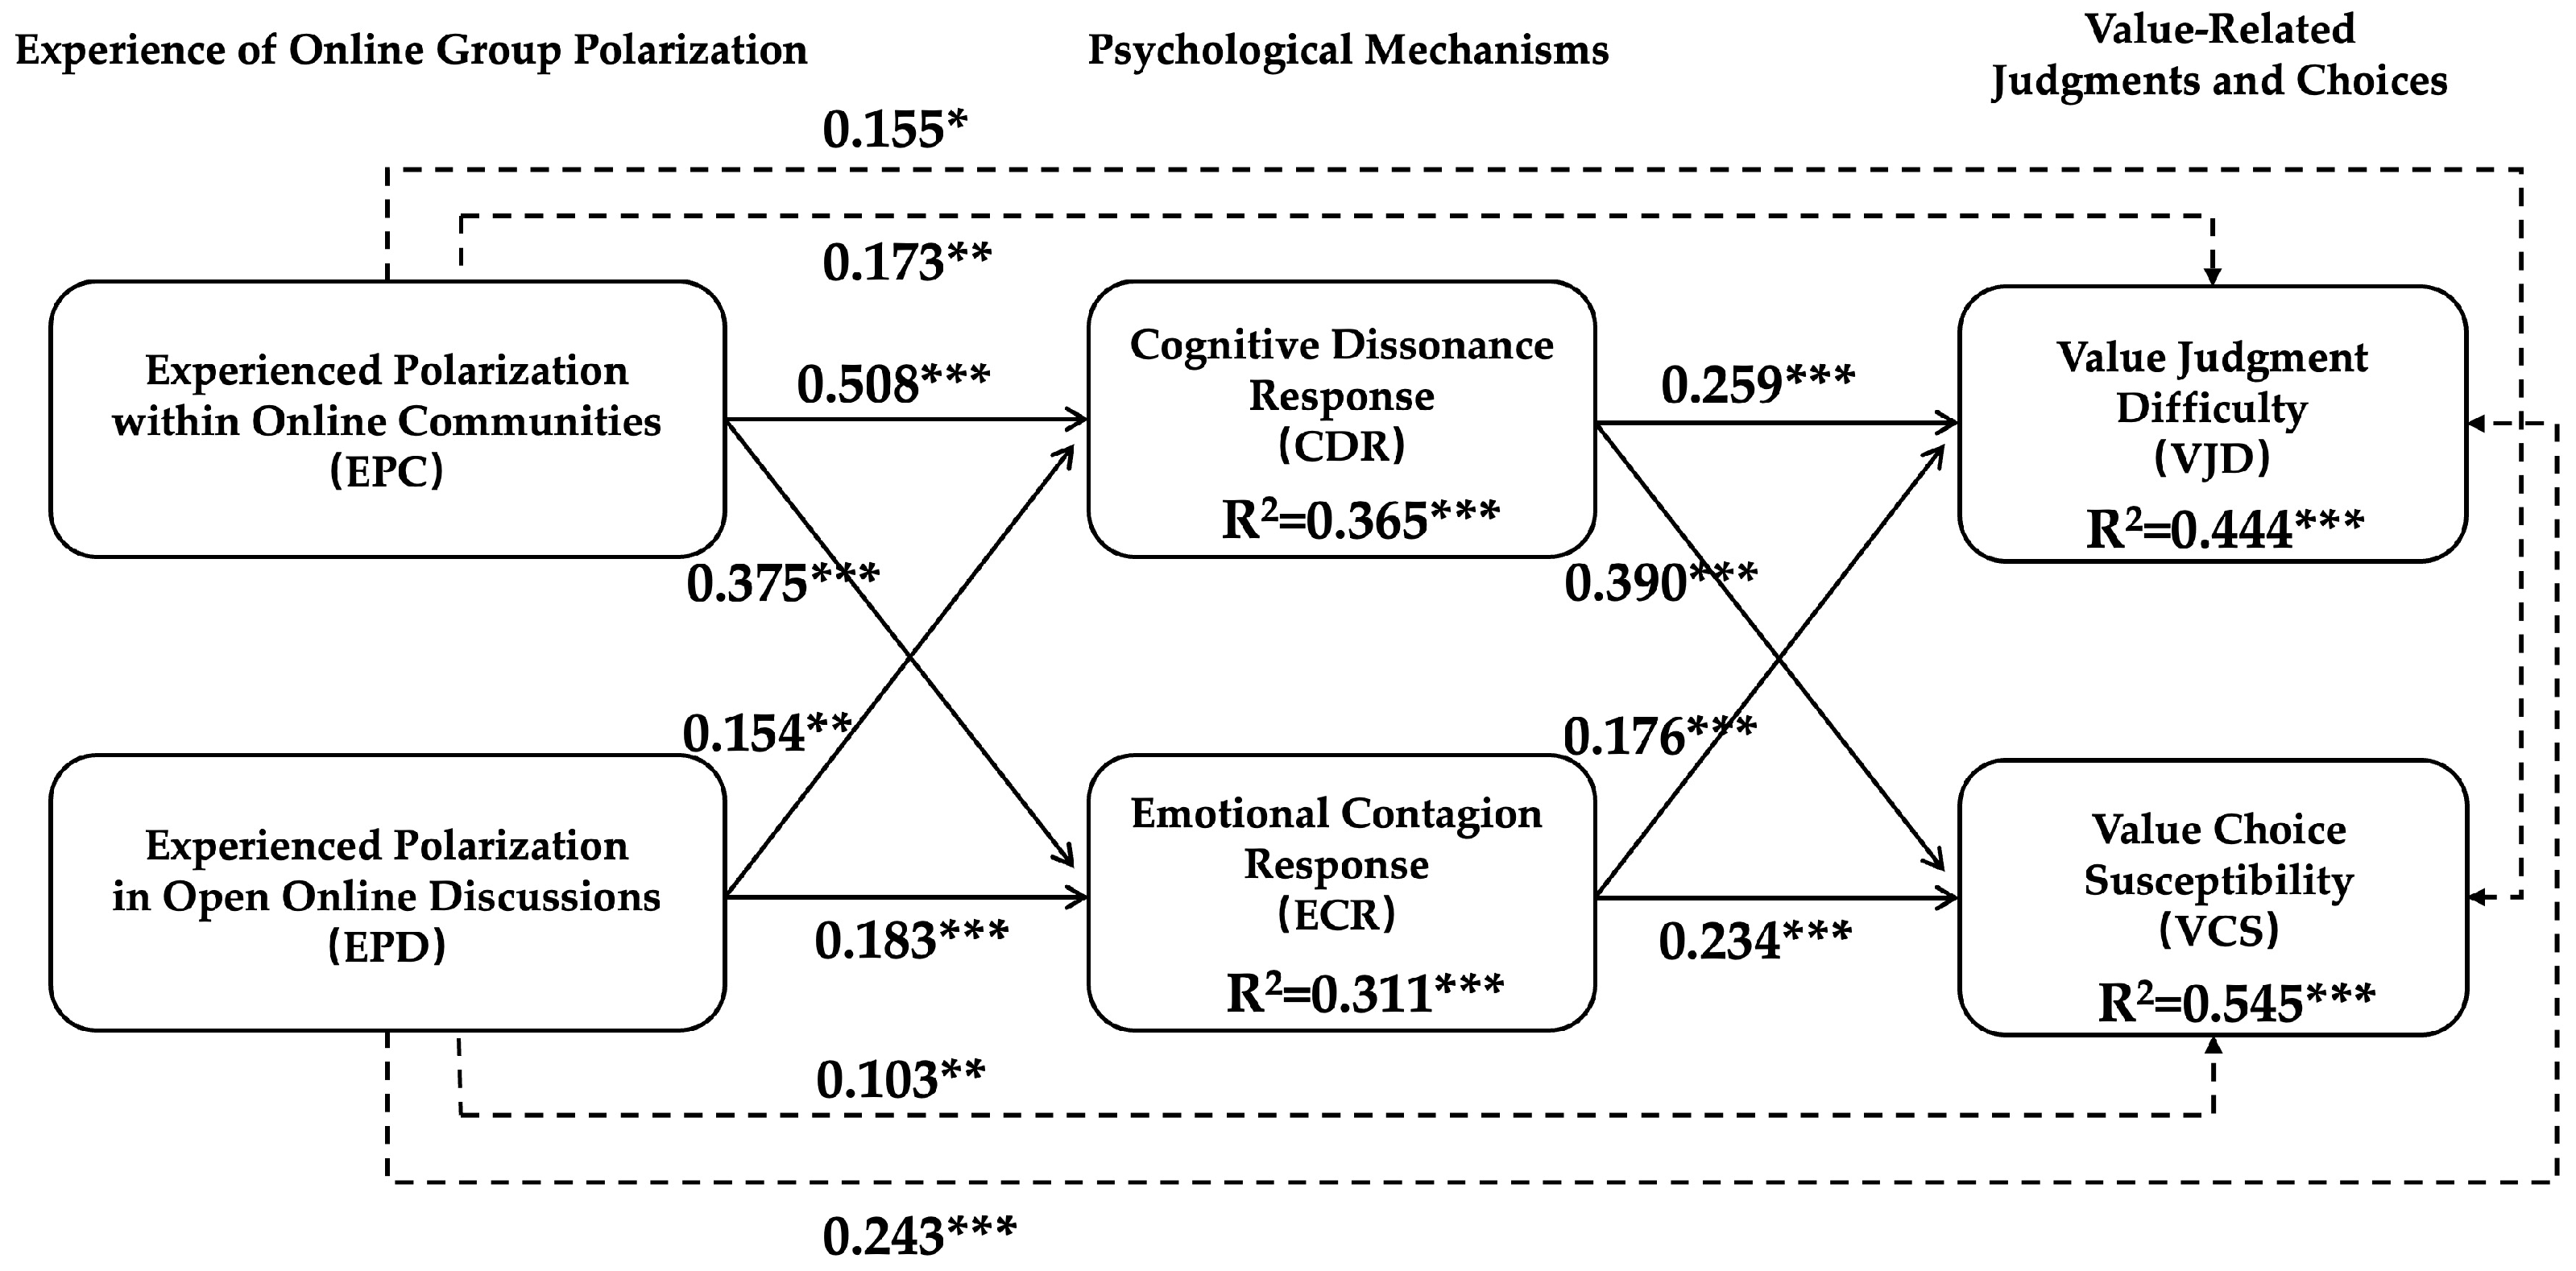
As shown in
Figure 2 and
Table 6, after adjustment for the seven covariates, EPC was significantly and positively associated with CDR (β = 0.508,
p < 0.001), as was EPD (β = 0.154,
p = 0.001), providing statistical support for H1 and H2. EPC and EPD were also significantly and positively associated with ECR, with standardized path coefficients of 0.375 and 0.183, respectively (both
p < 0.001), supporting H3 and H4.
Regarding the associations between the two psychological responses and value-related judgments and choices, CDR was significantly and positively associated with both VJD (β = 0.259, p < 0.001) and VCS (β = 0.390, p < 0.001), supporting H5a and H5b. ECR was also significantly and positively associated with VJD (β = 0.176, p = 0.001) and VCS (β = 0.234, p < 0.001), supporting H6a and H6b. Thus, when both forms of polarization experience and the covariates were considered simultaneously, cognitive dissonance response and emotional contagion response were positively associated with respondents’ reported value judgment difficulty and value choice susceptibility.
The regression coefficients for the seven covariates are presented in
Table 7. The model also retained direct paths from both forms of polarization experience to value-related judgments and choices. After accounting for CDR, ECR, and the covariates, EPC remained significantly and positively associated with VJD (β = 0.173,
p = 0.007) and VCS (β = 0.155,
p = 0.012). The direct associations of EPD with VJD (β = 0.243,
p < 0.001) and VCS (β = 0.103,
p = 0.010) were also statistically significant. The covariate results showed that average daily internet use, frequency of browsing discussions of trending topics, and mode of participation in discussions of trending topics were significantly and positively associated with both forms of polarization experience. Online community membership status was significantly and positively associated with EPC. Gender was positively associated with EPC and negatively associated with EPD, while academic year codes were negatively associated with EPD and CDR. In the VJD equation, after adjustment for the other predictors, average daily internet use was positively associated with VJD (β = 0.058,
p = 0.024), whereas online community membership status and mode of participation in discussions of trending topics were negatively associated with VJD (β = −0.082,
p = 0.007; β = −0.096,
p = 0.002). None of the conditional associations between field of study and the six latent variables was statistically significant. Likewise, none of the seven covariate coefficients in the ECR and VCS equations reached statistical significance.
The R2 values for CDR, ECR, VJD, and VCS were 0.365, 0.311, 0.444, and 0.545, respectively. Thus, all predictors in the respective regression equations jointly explained 36.5%, 31.1%, 44.4%, and 54.5% of the variance in these latent variables. The explained variance in CDR and ECR reflects the joint contributions of EPC, EPD, and the seven covariates, whereas the explained variance in VJD and VCS reflects the joint contributions of EPC, EPD, CDR, ECR, and the seven covariates. In addition, the seven covariates explained 35.0% and 9.1% of the variance in EPC and EPD, respectively.
After accounting for EPC, EPD, and the seven covariates, CDR and ECR still showed a significant positive residual correlation (r = 0.556, S.E. = 0.042, z = 13.347, p < 0.001). After accounting for EPC, EPD, CDR, ECR, and the seven covariates, the residual correlation between VJD and VCS was also positive and statistically significant (r = 0.359, S.E. = 0.054, z = 6.648, p < 0.001). These values were taken from the corresponding WITH parameters in the STDYX-standardized results for the final model and describe correlations between the portions left unexplained by the respective regression equations.
4.7. Mediation Effect Analysis
Specific indirect effects were tested using 5000 bootstrap resamples in the parallel mediation model, which simultaneously included CDR, ECR, the seven covariates, and the four direct paths. STDYX-standardized indirect effects and their bias-corrected 95% confidence intervals are reported in
Table 8. Whether the confidence interval excluded zero was the primary criterion for determining the statistical significance of an indirect effect.
For the paths through cognitive dissonance response, the standardized indirect effects of experienced polarization within online communities on value judgment difficulty and value choice susceptibility through CDR were 0.132 (95% CI [0.069, 0.211]) and 0.198 (95% CI [0.128, 0.291]), respectively. The corresponding standardized indirect effects of experienced polarization in open online discussions through CDR were 0.040 (95% CI [0.015, 0.076]) and 0.060 (95% CI [0.022, 0.109]). All four specific indirect effects were positive, and their confidence intervals excluded zero, providing statistical support for H7.
For the paths through emotional contagion response, the standardized indirect effects of experienced polarization within online communities on value judgment difficulty and value choice susceptibility through ECR were 0.066 (95% CI [0.026, 0.119]) and 0.088 (95% CI [0.043, 0.149]), respectively. The corresponding standardized indirect effects of experienced polarization in open online discussions through ECR were 0.032 (95% CI [0.013, 0.063]) and 0.043 (95% CI [0.019, 0.078]). All four specific indirect effects were also positive, and their confidence intervals excluded zero, providing statistical support for H8.
Taken together, the structural path and indirect-effect analyses showed that all four direct associations between the two forms of experience of online group polarization and value-related judgments and choices were significant. All eight specific indirect associations through cognitive dissonance response and emotional contagion response were also supported. This statistical pattern, in which direct and indirect associations coexist, provides empirical support for the mediating roles of the two psychological responses in the relationships of experience of online group polarization with value judgment difficulty and value choice susceptibility. Given the cross-sectional design, these mediation effects should be interpreted as statistical indirect associations under the current model specification. The temporal ordering and causal direction of the relationships require further examination.
In supplementary analyses, the two serial mediation models, CDR → ECR and ECR → CDR, both yielded the same overall fit as the parallel model. This result is consistent with covariance equivalence under the current specification. Model fit therefore cannot distinguish the temporal ordering of the two responses.