2.2. Experimental Procedure
All speech materials were drawn from semi-structured, elicited interactions between the participating teachers and the preschool-aged children in their own classrooms, conducted in familiar rooms within each kindergarten to ensure ecological validity and to minimize speaker discomfort. While the recordings took place in familiar classroom settings with familiar teacher–child pairs, the interactions followed a controlled elicitation protocol to ensure comparability of the target vowel sounds across participants and conditions. We therefore characterize the speech samples as semi-structured elicited speech rather than fully naturalistic spontaneous speech. This approach balances experimental control (ensuring cross-participant comparability of the target vowels /a/, /i/, and /u/) with ecological validity (using familiar settings and interaction partners).
All speech samples were captured with a digital recorder and monitored in Sound Forge 9.0 at 44.1 kHz and 16-bit resolution. Recordings took place in quiet rooms with ambient noise kept below 40 dB SPL. The microphone was placed 8 to 12 cm from the teacher’s mouth at an angle of approximately 45 degrees to reduce breathing noise. Teachers used child-familiar rooms, such as resource rooms (about 20 m2) or small reading rooms (about 9 m2), depending on availability.
To ensure recording quality, only the teacher, the child, and the experimenter were present in the room during each session. Noise-producing objects, such as musical instruments or electronic toys, were not allowed, and doors and windows remained closed. In most cases, CDS and ADS were recorded in the same room to control for room acoustics.
Each teacher participated in both CDS and ADS recording sessions. In the CDS condition, each teacher interacted with one child from her own classroom, with whom she had an established daily relationship. The child participated only in the CDS condition and was not present during the ADS session. The ADS condition involved a semi-structured conversation between the teacher and the adult experimenter, without any child listener present. This design allowed us to obtain a clear baseline of each teacher’s adult-directed speech under comparable phonetic content but without the influence of a child audience.
Role of child partners in the CDS condition. In the CDS condition, children were present exclusively as conversational partners to elicit naturalistic teacher speech. They were not instructed to perform any specific task or to respond in any particular way; rather, teachers were asked to interact with the child as they normally would in the classroom, using the toys as conversational prompts. The children’s primary function was to create a communicative context that would approximate real classroom interactions, thereby enhancing the ecological validity of the CDS recordings. Children were not present during the ADS condition, ensuring that any differences between CDS and ADS could be attributed to the presence of a child listener rather than to other task-related factors.
Prior to recording, the teacher was provided with a standardized instruction script explaining the purpose of the study:
“Hello, this study records your speech as a kindergarten teacher to examine how you talk to children and how you talk to adults. The data are for research use only and not for commercial purposes. Please speak as you normally do in daily interactions. You will use two toys, Peppa Pig and Xiong Da, to converse naturally with a child, for example: ‘Look, what is this?’ ‘This is Peppa Pig.’ ‘And what is this?’ ‘This is Xiong Da.’ After the interaction, the experimenter will ask a simple question, such as: ‘Which two toys did you use during your conversation with the child?’”
For CDS, teachers interacted with a child using two plush toys: Peppa Pig (小 (xiǎo)猪 (zhū) 佩 (pèi) 奇 (qí)) and Xiong Da (熊 (xióng) 大 (dà)). These items were chosen to elicit the corner vowels /a/, /i/, and /u/ in natural discourse through a controlled naming and conversation task. The use of two specific toys served to standardize the lexical content across teachers while still allowing for spontaneous conversational exchanges. For context,
Steen and Englund (
2022) instructed Norwegian kindergarten teachers to use six toys to elicit target vowels /a/, /i/, /u/, /a:/, /i:/, and /u:/ through natural dialogue: plush cake (ka:ke), plush kitten (kat:), plush tiger (ti:ger), Pippi Longstocking doll (pip:i), a touch-and-feel book (bu:k), and a Billy Goat doll (buk:) (
Steen & Englund, 2022).
For ADS, each teacher held a semi-structured conversation with the same experimenter who facilitated the CDS session. During this phase, the experimenter prompted the teacher to talk about their recent activities with children and encouraged them to mention the names of the same two toys. This ensured the phonetic comparability of CDS and ADS samples, particularly with regard to the targeted vowel sounds.
Each recording session lasted between 1 and 5 min; CDS sessions averaged 3 min and ADS sessions average 2 min. Teachers were instructed to speak at their normal conversational pace and volume.
Importantly, while the recordings were elicited under controlled task conditions to ensure cross-participant comparability, they took place in familiar school environments with familiar interaction partners, which we believe provides a reasonable balance between experimental control and ecological validity.
Speech Material Quantity
In total, approximately 105 min of CDS (mean = 3.0 min per teacher, range = 1–5 min) and 70 min of ADS (mean = 2.0 min per teacher, range = 1–5 min) were recorded and analyzed. The longer CDS sessions reflect the interactive nature of teacher–child conversations, which included turn-taking, questioning, and naming of toys, whereas ADS sessions were more direct and concise. Despite the difference in session duration, the number of analyzable vowel tokens per condition was balanced (see
Section 2.4, Selection and Exclusion of Vowel Tokens), as the ADS sessions yielded sufficient tokens due to the higher density of target vowels in the elicited naming responses.
2.3. Experimental Design
This study used a within-subjects (repeated-measures) design to compare the acoustic properties of the corner vowels /a/, /i/, and /u/ in Mandarin-speaking kindergarten teachers’ CDS and their ADS. Audio recordings were obtained from 35 female preschool teachers who were native speakers of Mandarin, yielding 70 speech samples across the two conditions (35 CDS + 35 ADS).
The independent variable was Speech Type (CDS vs. ADS), manipulated within each participant. The dependent variables were the acoustic parameters of the three target corner vowels (/a/, /i/, /u/), including: mean fundamental frequency, F0 range, vowel duration, first formant, second formant, and vowel space area. For each vowel and each acoustic parameter, separate analyses were conducted to evaluate the effect of Speech Type.
2.4. Data Processing
This study examined the corner vowels /a/, /i/, and /u/ in both CDS and ADS. Speech materials were captured with a digital recorder and then analyzed using the Dr. Speech Science for Windows software package (Version 4.0, Tiger Electronics, Seattle, WA, USA), running on a Dell Precision workstation with 16 GB RAM. For each vowel token, we measured the following acoustic parameters: F0, F0 range, vowel duration, F1, F2, and VSA.
F0, F0 range, vowel duration, and VSA were calculated based on F1 and F2 values. Vowel duration was measured from the onset to the offset of the vowel. The F0 range for each target vowel was calculated by subtracting the minimum F0 from the maximum F0, where both values were measured across the entire voiced duration of that vowel. This method captures the full extent of pitch modulation within each vowel and is sensitive to the dynamic prosodic exaggerations typical of child-directed speech. All acoustic parameters were measured in Hertz (Hz), except for vowel duration, which was measured in seconds (s).
2.4.1. Acoustic Analysis Settings and Pre-Processing
Prior to formant extraction, all speech samples were pre-processed using a high-pass filter with an 80 Hz cutoff frequency to remove low-frequency ambient noise and microphone rumble. A pre-emphasis factor of 0.95 was applied to enhance high-frequency spectral information and improve formant tracking reliability, consistent with standard acoustic analysis protocols (
Ladefoged & Johnson, 2015). All analyses were performed on the full-bandwidth signals (44.1 kHz sampling rate, 16-bit resolution).
For formant extraction, Linear Predictive Coding (LPC) was used with the following settings: LPC order of 14 for female voices (following the recommendations of the DRS system manual and prior studies, e.g.,
Liu et al., 2003), Hamming window with window length of 25 ms and frame shift of 10 ms. The maximum formant frequency was set to 6000 Hz for female speakers, and the number of formants extracted was set to 4, consistent with standard practice for adult female voices (
Vorperian & Kent, 2007). Pre-emphasis was applied prior to LPC analysis with a factor of 0.95, as specified above. These settings were chosen based on the DRS system manual recommendations and validated through pilot testing to ensure reliable formant tracking across all vowel categories.
2.4.2. Segmentation and Formant Extraction
Vowel onset and offset were manually marked with reference to LPC spectra, wideband spectrograms (300 Hz analysis bandwidth), and waveform displays, following standard procedures in phonetic analysis (
Ladefoged & Johnson, 2015). Vowel duration was defined as the interval from onset to offset. F
1 and F
2 were sampled at the temporal midpoint (50% of vowel duration) of each vowel token to minimize coarticulatory effects from adjacent consonants (
Steen & Englund, 2022). For each token, the LPC-generated formant trajectories were visually overlaid on the wideband spectrogram to confirm tracking accuracy before accepting the midpoint values.
No frequency normalization (e.g., z-score normalization, Lobanov normalization, or speaker-intrinsic normalization) was applied to formant values. This decision was made for three reasons. First, all comparisons in this study are within-subjects (each teacher’s CDS compared to her own ADS), which inherently controls for speaker-specific anatomical differences in vocal tract length and shape. Second, normalization procedures can inadvertently remove meaningful between-speaker variability that reflects genuine differences in speech production. Third, this approach aligns with prior CDS studies that have employed similar within-subjects designs and did not apply normalization (e.g.,
Steen & Englund, 2022;
Liu et al., 2003;
Sarvasy et al., 2022), facilitating direct cross-study comparability. We acknowledge that normalization may be beneficial in cross-speaker comparisons; however, given the within-subjects design of the present study, we consider it appropriate to report raw formant values.
2.4.3. Selection and Exclusion of Vowel Tokens
A total of 35 teachers participated in the study, and from each teacher we analyzed both CDS and ADS recordings. For each recording, we initially segmented all instances of the target corner vowels /a/, /i/, and /u/ that occurred in lexical items produced during the semi-structured interactions. Vowel tokens were included only if they satisfied the following criteria: (a) the vowel was produced with a clear, noise-free signal, with no overlapping speech from the child or experimenter; (b) the vowel was not produced with excessive background noise (ambient noise consistently < 40 dB SPL); (c) the vowel was not produced with vocal fry or creaky voice that prevented reliable formant tracking; and (d) F1 and F2 were clearly visible on the wideband spectrogram and could be reliably estimated by the LPC algorithm.
On average, approximately 13 tokens per vowel per condition per speaker were successfully segmented and retained for analysis, yielding a total of 2730 vowel tokens (1365 in CDS and 1365 in ADS). Across conditions and vowels, the number of retained tokens per speaker ranged from 10 to 16 per vowel per condition. Token counts did not differ substantially across vowels or between CDS and ADS; the average token counts per vowel were as follows: /a/ = 13.4 (SD = 1.1), /i/ = 12.8 (SD = 1.3), /u/ = 13.1 (SD = 1.2) for CDS, and /a/ = 13.2 (SD = 1.0), /i/ = 12.9 (SD = 1.2), /u/ = 12.8 (SD = 1.1) for ADS. A small proportion of initially segmented vowels (approximately 3.6%) were excluded due to poor signal quality, overlapping speech, or formant tracking errors that could not be reliably corrected. The final token counts per speaker for all vowels and conditions were sufficient for stable estimation of formant frequencies and VSA, based on prior CDS literature (e.g.,
Steen & Englund, 2022;
Sarvasy et al., 2022). Importantly, token counts were well balanced across CDS and ADS conditions for each vowel, with comparable means and standard deviations (see
Section 2.1.2 for child demographic information). This balance minimizes potential biases in the within-subjects comparisons (CDS vs. ADS) and supports the reliability of the statistical analyses.
2.4.4. Manual Formant Correction and Quality Control
Consistent with standard practice in acoustic phonetic research (e.g.,
Li et al., 2019;
Vorperian & Kent, 2007), LPC-generated formant estimates were visually inspected for each token. Visual inspection was performed by overlaying the LPC-derived formant tracks on wideband spectrograms (300 Hz bandwidth). Formants were considered spurious or missing and subject to manual correction if: (a) the LPC trace showed a sudden, physiologically implausible jump in F
1 or F
2 (e.g., a change >200 Hz between adjacent time points) that did not correspond to visible spectral energy on the wideband spectrogram; (b) the LPC algorithm failed to track a formant due to weak spectral energy, particularly in high vowels (e.g., /i/ or /u/) or in segments produced with reduced amplitude; or (c) the LPC trace tracked a harmonic or a nasal formant instead of the intended oral formant. In such cases, manual correction was performed by visually matching the LPC trace to the spectral peaks visible on the wideband spectrogram. All manual corrections were performed by a single trained analyst with extensive experience in acoustic phonetic analysis, following a standardized correction protocol.
2.4.5. Reliability of Manual Segmentation and Formant Extraction
Given that vowel onset and offset boundaries were manually identified and that formant values were extracted at the vowel midpoint, we assessed both inter-rater and intra-rater reliability for segmentation and formant measurements. All reliability analyses were conducted on a randomly selected subset of 10% of the total vowel tokens (n = 273), stratified by vowel category (/a/, /i/, /u/) and condition (CDS, ADS) to ensure balanced representation.
Inter-rater reliability. A second trained analyst, who was blind to the study hypotheses and condition labels, independently re-segmented all tokens in the subset and re-extracted F
1 and F
2 at the vowel midpoint following the identical protocol described above. For vowel duration (i.e., boundary placement accuracy), the intraclass correlation coefficient (ICC, two-way random effects, absolute agreement) between the two raters was 0.94 (95% CI: 0.92–0.96), indicating excellent agreement. The mean absolute difference in duration between raters was 12 ms (SD = 8 ms), which is comparable to values reported in similar CDS studies (e.g.,
Steen & Englund, 2022;
Lee et al., 1999).
For formant extraction, inter-rater reliability was also high. Pearson correlations between raters were r = 0.93 for F
1 and r = 0.91 for F
2. ICCs (two-way random, absolute agreement) were 0.94 (95% CI: 0.92–0.96) for F
1 and 0.92 (95% CI: 0.89–0.94) for F
2. The mean absolute differences between raters were 42 Hz (SD = 31 Hz) for F
1 and 58 Hz (SD = 44 Hz) for F
2. These differences are consistent with typical measurement error in formant analysis (approximately 5–10% of formant frequency values) and are well within the acceptable range reported in the phonetic literature (e.g.,
Lee et al., 1999;
Vorperian & Kent, 2007).
Intra-rater reliability. To assess intra-rater reliability, the primary analyst re-analyzed the same subset of tokens two weeks after the initial analysis, following the identical protocol and without reference to the original measurements. Intra-rater reliability was excellent: ICCs were 0.96 for vowel duration, 0.95 for F1, and 0.93 for F2. The mean absolute differences between the two sessions were 9 ms (SD = 6 ms) for duration, 38 Hz (SD = 28 Hz) for F1, and 51 Hz (SD = 39 Hz) for F2.
These reliability estimates confirm that manual segmentation and formant extraction were performed consistently and accurately. All discrepancies between raters were resolved through consensus discussion before finalizing the dataset used for statistical analyses. The high inter-rater and intra-rater reliability support the robustness of the acoustic measurements reported in this study.
2.4.6. Outlier Handling
Extreme outliers in acoustic measures (F
0, F
0 range, duration, F
1, F
2, and VSA) were identified using the boxplot method, with outliers defined as values greater than 1.5 × the interquartile range (IQR) above the 75th percentile or below the 25th percentile. Outliers were detected in a small number of tokens across all measures: for F
1, 11 outliers (0.4% of all tokens) were identified; for F
2, 14 outliers (0.5%); for F
0, 9 outliers (0.3%); for duration, 16 outliers (0.6%). Rather than excluding these tokens entirely, which could reduce statistical power and introduce bias, we used winsorization: outlier values were replaced with the nearest value within the non-outlier range (i.e., the 75th percentile + 1.5 × IQR for high outliers, or the 25th percentile − 1.5 × IQR for low outliers). This approach reduces the influence of extreme values while retaining all tokens in the analysis (
Hampel et al., 1986). Following winsorization, no extreme outliers remained in the dataset. All reported descriptive statistics and inferential analyses are based on the winsorized data.
2.4.7. Derived Measures
Fundamental frequency was extracted using the Dr. Speech software’s autocorrelation-based pitch tracking algorithm, with pitch range set to 75–500 Hz for female speakers, following the system manual recommendations. For each vowel token, F0 was sampled at the temporal midpoint (50% of vowel duration) to match the sampling point used for formant extraction, ensuring temporal alignment across acoustic measures. F0 range was calculated as the difference between the maximum and minimum F0 values within each vowel segment (i.e., between the vowel onset and offset boundaries). This within-segment F0 range reflects local pitch variability during vowel production, as opposed to utterance-level pitch range.
Vowel duration was measured directly from the waveform and wideband spectrogram as the time interval (in seconds) between manually marked vowel onset and offset, based on visual inspection of the waveform amplitude envelope and spectrographic cues (e.g., formant onset/offset, changes in spectral energy). Duration was not derived from F1, F2, or F0 values.
F0, F0 range, F1, and F2 were measured in hertz (Hz). All values reported are raw, non-normalized formant frequencies and fundamental frequency values.
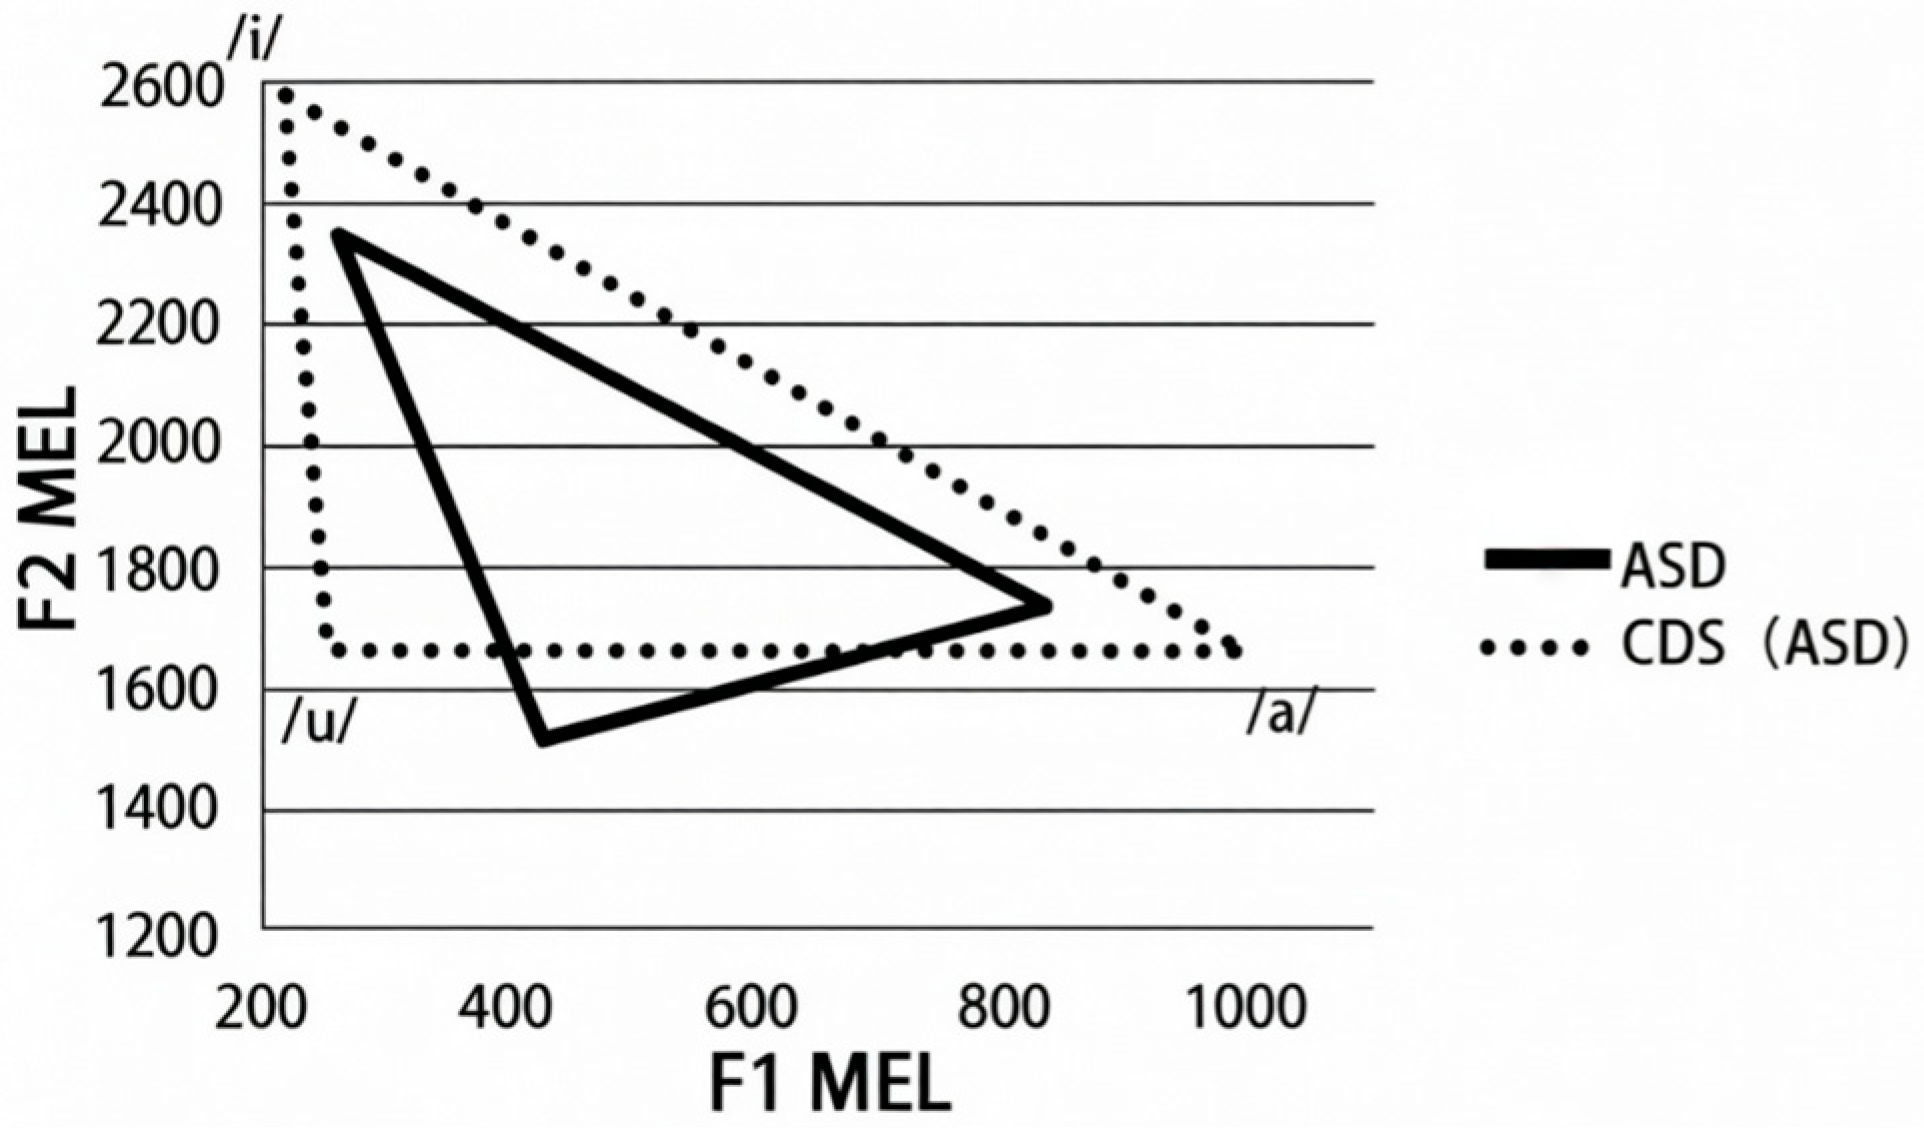
Vowel space area (VSA) was computed from the mean F
1 and F
2 values of the three corner vowels using the triangular area formula (
Liu et al., 2003):
This formula calculates the area of the triangle formed by the mean F1/F2 coordinates of /a/, /i/, and /u/ in the F1 × F2 plane. A single VSA value was computed per speaker per condition (CDS vs. ADS) based on the mean F1 and F2 values for each vowel across all tokens within that condition.
To summarize the derivation of each acoustic measure:
F0 (mean): Autocorrelation-based pitch tracking at vowel midpoint;
F0 range: Max F0–Min F0 within vowel segment;
Vowel duration: Direct measurement from waveform/spectrogram (onset to offset);
F1, F2: LPC extraction at vowel midpoint;
VSA: Calculated from mean F1/F2 using triangular formula.
After extraction, all acoustic parameters were imported into Microsoft Excel for initial organization and outlier detection. Statistical analyses were then conducted in SPSS 27.0 (IBM Corp., Armonk, NY, USA). Results were tabulated and archived for reporting.