Disparities in Pediatric Concussion Outcomes and Family Burden by Neighborhood Opportunity

 , , and
Abstract
1. Introduction
2. Materials and Methods
2.1. Outcome Measures
2.2. Statistical Analysis
3. Results
4. Discussion
5. Conclusions
Supplementary Materials
Author Contributions
Funding
Institutional Review Board Statement
Informed Consent Statement
Data Availability Statement
Conflicts of Interest
Abbreviations
| mTBI | Mild Traumatic Brain Injury |
| PCSS | Post-Concussion Symptom Scale |
| COI | Child Opportunity Index |
| CAM | Complementary and Alternative Medicine |
| PT | Physical Therapy |
References
- Acevedo-Garcia, D., Noelke, C., McArdle, N., Sofer, N., Hardy, E. F., Weiner, M., Baek, M., Huntington, N., Huber, R., & Reece, J. (2020). Racial and ethnic inequities in children’s neighborhoods: Evidence from the new child opportunity index 2.0. Health Affairs, 39, 1693–1701. [Google Scholar] [CrossRef] [PubMed]
- Coffman, C. J., Edelman, D., & Woolson, R. F. (2016). To condition or not condition? Analysing ‘change’ in longitudinal randomised controlled trials. BMJ Open, 6(12), e013096. [Google Scholar] [CrossRef] [PubMed]
- Cook, N. E., Kissinger-Knox, A., Iverson, I. A., Stephenson, K., Norman, M. A., Hunter, A. A., Saadi, A., & Iverson, G. L. (2024). Social determinants of health and health equity in the treatment and rehabilitation of sport-related concussion: A content analysis of intervention research and call-to-action. Journal of Neurotrauma, 41(19–20), 2201–2218. [Google Scholar] [CrossRef] [PubMed]
- Corwin, D. J., Fedonni, D., McDonald, C. C., Peterson, A., Haarbauer-Krupa, J., Godfrey, M., Camacho, P., Bryant-Stephens, T., Master, C. L., & Arbogast, K. B. (2024). Community and patient features and health care point of entry for pediatric concussion. JAMA Network Open, 7(10), e2442332. [Google Scholar] [CrossRef] [PubMed]
- Corwin, D. J., Li, W., Fung, S. G., Yu, C., Backman, C., Lamoureux, M., Hawken, S., Johnston, S., & Zemek, R. (2026). Socioeconomic disparities in concussion presentation. JAMA Network Open, 9(4), e267416. [Google Scholar] [CrossRef] [PubMed]
- Ganesalingam, K., Yeates, K. O., Ginn, M. S., Taylor, H. G., Dietrich, A., Nuss, K., & Wright, M. (2008). Family burden and parental distress following mild traumatic brain injury in children and its relationship to post-concussive symptoms. Journal of Pediatric Psychology, 33(6), 621–629. [Google Scholar] [CrossRef] [PubMed]
- Graves, J. M., Mackelprang, J. L., Moore, M., Abshire, D. A., Rivara, F. P., Jimenez, N., Fuentes, M., & Vavilala, M. S. (2019). Rural-urban disparities in health care costs and health service utilization following pediatric mild traumatic brain injury. Health Services Research, 54(2), 337–345. [Google Scholar] [CrossRef] [PubMed]
- Graves, J. M., Rivara, F. P., & Vavilala, M. S. (2015). Health care costs 1 year after pediatric traumatic brain injury. American Journal of Public Health, 105(10), e35–e41. [Google Scholar] [CrossRef] [PubMed]
- Healthy people 2030: Social determinants of health. (n.d.). Office of disease prevention and health promotion. Available online: https://odphp.health.gov/healthypeople/priority-areas/social-determinants-health (accessed on 19 May 2026).
- Karr, J. E., Zuccato, B. G., Ingram, E. O., McAuley, T. L., Merker, B., & Abeare, C. A. (2023). The post-concussion symptom scale: Normative data for adolescent student-athletes stratified by gender and preexisting conditions. The American Journal of Sports Medicine, 51(1), 225–236. [Google Scholar] [CrossRef] [PubMed]
- Kersten, E. E., Adler, N. E., Gottlieb, L., Jutte, D. P., Robinson, S., Roundfield, K., & LeWinn, K. Z. (2018). Neighborhood child opportunity and individual-level pediatric acute care use and diagnoses. Pediatrics, 141(5), e20172309. [Google Scholar] [CrossRef] [PubMed]
- Krager, M. K., Puls, H. T., Bettenhausen, J. L., Hall, M., Thurm, C., Plencner, L. M., Markham, J. L., Noelke, C., & Beck, A. F. (2021). The child opportunity index 2.0 and hospitalizations for ambulatory care sensitive conditions. Pediatrics, 148(2), e2020032755. [Google Scholar] [CrossRef] [PubMed]
- Loftin, M. C., Zynda, A. J., Pollard-McGrandy, A., Eke, R., Covassin, T., & Wallace, J. (2023). Racial differences in concussion diagnosis and mechanism of injury among adults presenting to emergency departments across the United States. Brain Injury, 37(12–14), 1326–1333. [Google Scholar] [CrossRef] [PubMed]
- MacEachern, T., John-Baptiste, A., & Christie, A. (2024). The prevalence of Black/African American individuals in concussion literature: A systematic review and meta-analysis. Frontiers in Public Health, 12, 1430428. [Google Scholar] [CrossRef] [PubMed]
- Mayo Clinic. (2025). Concussion in children: What are the symptoms. Available online: https://www.mayoclinic.org/diseases-conditions/concussion/expert-answers/concussion-in-children/faq-20058282 (accessed on 8 May 2026).
- Nelson, R. E., Ma, J., Cheng, Y., Ewing-Cobbs, L., Clark, A., & Keenan, H. (2019). Healthcare utilization and missed workdays for parents of children with traumatic brain injury. Journal of Head Trauma Rehabilitation, 34(4), 257–267. [Google Scholar] [CrossRef] [PubMed]
- Noelke, C., McArdle, N., Baek, M., Huntington, N., Huber, R., Hardy, E., & Acevedo-Garcia, D. (2020). Child opportunity index 2.0 technical documentation. Available online: https://www.diversitydatakids.org/sites/default/files/2020-02/ddk_coi2.0_technical_documentation_20200212.pdf (accessed on 12 May 2026).
- Powers, R., Trevino, R., Erpenbach, H., & Thomas, D. (2024). Is access to optimal concussion care for pediatric athletes limited by geography? Clinical Journal of Sport Medicine, 34(5), 425–429. [Google Scholar] [CrossRef] [PubMed]
- Shen, J., Shi, J., Cooper, J., Chen, C., Taylor, H. G., & Xiang, H. (2021). A population-based study of the incidence, medical care, and medical expenditures for pediatric traumatic brain injury. Journal of Surgical Research, 268, 87–96. [Google Scholar] [CrossRef] [PubMed]
- Thomas, D. G., Erpenbach, H., Smith, C. N., Hickey, R. W., Waltzman, D., Haarbauer-Krupa, J., Nelson, L. D., Patterson, C. G., McCrea, M., Collins, M. W., & Kontos, A. P. (2025). Impact of early activity and behavioral management on acute concussion recovery: A randomized controlled trial. The Journal of Pediatrics, 283, 114596. [Google Scholar] [CrossRef] [PubMed]
- Tillmann, B. W., & Haas, B. (2026). Socioeconomic disparities and concussion care-the role of the emergency department. JAMA Network Open, 9(4), e267340. [Google Scholar] [CrossRef] [PubMed]
- Waltzman, D., Black, L. I., Daugherty, J., Peterson, A. B., & Zablotsky, B. (2025). Prevalence of traumatic brain injury among adults and children. Annals of Epidemiology, 103, 40–47. [Google Scholar] [CrossRef] [PubMed]
- Wing, S., Caiquo, J., Butler, C., Giza, C., & Babikian, T. (2024). Framing racial disparities within sports related concussion (SRC): An ecological framework for understanding biases and disparities in concussion care for black athletes. International Review of Psychiatry, 36(3), 254–271. [Google Scholar] [CrossRef] [PubMed]
- Yeates, K. O., Barlow, K. M., Wright, B., Tang, K., Barrett, O., Berdusco, E., Black, A. M., Clark, B., Conradi, A., Godfrey, H., Kolstad, A. T., Ly, A., Mikrogianakis, A., Purser, R., Schneider, K., Stang, A. S., Zemek, R., Zwicker, J. D., & Johnson, D. W. (2023). Health care impact of implementing a clinical pathway for acute care of pediatric concussion: A stepped wedge, cluster randomised trial. Canadian Journal of Emergency Medicine, 25(7), 627–636. [Google Scholar] [CrossRef] [PubMed]



| Characteristic | Overall (N = 234) | Low COI (n = 66) | Middle COI (n = 39) | High COI (n = 129) | Statistic | p-Value | Statistically Significant Between COI Levels # | ||||
|---|---|---|---|---|---|---|---|---|---|---|---|
| N | Mean/% | N | Mean/% | N | Mean/% | N | Mean/% | ||||
| Age (years) | 0.18 | 0.83 | |||||||||
| Mean (SD) | 234 | 14.46 (2.23) | 66 | 14.38 (1.98) | 39 | 14.65 (2.69) | 129 | 14.45 (2.22) | |||
| Sex; n (%) | 1.37 | 0.50 | |||||||||
| Male | 121 | 51.71 | 34 | 51.52 | 17 | 43.59 | 70 | 54.26 | |||
| Female | 113 | 48.29 | 32 | 48.48 | 22 | 56.41 | 59 | 45.74 | |||
| Race; n (%) | 69.80 | <0.0001 † | |||||||||
| White | 175 | 74.79 | 25 | 37.88 | 33 | 84.62 | 117 | 90.70 | a,b | ||
| Black | 52 | 22.22 | 37 | 56.06 | 6 | 15.38 | 9 | 6.98 | a,b | ||
| Other ^ | 6 | 2.56 | 3 | 4.55 | 0 | 0.00 | 3 | 2.33 | |||
| Not reported | 1 | 0.43 | 1 | 1.52 | 0 | 0.00 | 0 | 0.00 | |||
| Ethnicity; n (%) | 7.83 | 0.0979 † | |||||||||
| Hispanic | 22 | 9.65 | 11 | 17.19 | 2 | 5.26 | 9 | 7.14 | a,b | ||
| Non-Hispanic | 200 | 87.72 | 50 | 78.13 | 35 | 92.11 | 115 | 91.27 | |||
| Unknown/Not reported | 6 | 2.63 | 3 | 4.69 | 1 | 2.63 | 2 | 1.59 | |||
| Primary language; n (%) | 4.97 | 0.08 | |||||||||
| English | 233 | 99.57 | 65 | 100.00 | 38 | 97.44 | 128 | 100.00 | |||
| Other | 1 | 0.43 | 0 | 0.00 | 1 | 2.56 | 0 | 0.00 | |||
| Insurance type; n (%) public | 52.45 | <0.0001 † | |||||||||
| Commercial | 195 | 83.33 | 38 | 57.58 | 34 | 87.18 | 123 | 95.35 | a,b | ||
| Medicaid | 2 | 0.85 | 2 | 3.03 | 0 | 0.00 | 0 | 0.00 | b | ||
| Medicaid HMO | 31 | 13.25 | 24 | 36.36 | 4 | 10.26 | 3 | 2.33 | a,b | ||
| Medicare/Other Government | 1 | 0.43 | 0 | 0.00 | 0 | 0.00 | 1 | 0.78 | |||
| None (self-pay) | 5 | 2.14 | 2 | 3.03 | 1 | 2.56 | 1 | 0.78 | |||
| Caregiver education; n (%) | 29.00 | <0.0001 † | |||||||||
| High school or less | 41 | 17.83 | 20 | 30.77 | 8 | 21.05 | 13 | 10.24 | b | ||
| Some college | 74 | 32.17 | 28 | 43.08 | 14 | 36.84 | 32 | 25.20 | b | ||
| Bachelor’s degree or higher | 100 | 43.48 | 14 | 21.54 | 15 | 39.47 | 71 | 55.91 | b | ||
| Unknown | 15 | 6.52 | 3 | 4.62 | 1 | 2.63 | 11 | 8.66 | |||
| Child Opportunity Index; n (%) | - | - | |||||||||
| Low | 66 | 28.21 | - | - | - | - | - | - | |||
| Middle | 39 | 16.67 | - | - | - | - | - | - | |||
| High | 129 | 55.13 | - | - | - | - | - | - | |||
| Care site; n (%) | 10.75 | 0.0046 † | |||||||||
| ED | 136 | 80.00 | 40 | 93.02 | 26 | 89.66 | 70 | 71.43 | b,c | ||
| Concussion clinic | 34 | 20.00 | 3 | 6.98 | 3 | 10.34 | 28 | 28.57 | b,c | ||
| Mechanism of injury; n (%) | 16.49 | 0.0866 † | |||||||||
| Sports | 84 | 36.21 | 15 | 23.08 | 14 | 35.90 | 55 | 42.97 | b | ||
| Fall | 69 | 29.74 | 21 | 32.31 | 17 | 43.59 | 31 | 24.22 | c | ||
| Motor vehicle collision | 12 | 5.17 | 6 | 9.23 | 1 | 2.56 | 5 | 3.91 | |||
| Pedestrian vs. motor vehicle | 2 | 0.86 | 1 | 1.54 | 0 | 0.00 | 1 | 0.78 | |||
| Assault | 17 | 7.33 | 7 | 10.77 | 3 | 7.69 | 7 | 5.47 | |||
| Other | 48 | 20.69 | 15 | 23.08 | 4 | 10.26 | 29 | 22.66 | |||
| Prior concussion; n (%) | 4.23 | 0.12 | |||||||||
| Yes | 60 | 25.75 | 13 | 20.00 | 7 | 17.95 | 40 | 31.01 | |||
| No | 173 | 74.25 | 52 | 80.00 | 32 | 82.05 | 89 | 68.99 | |||
| Baseline PCSS | 1.01 | 0.37 | |||||||||
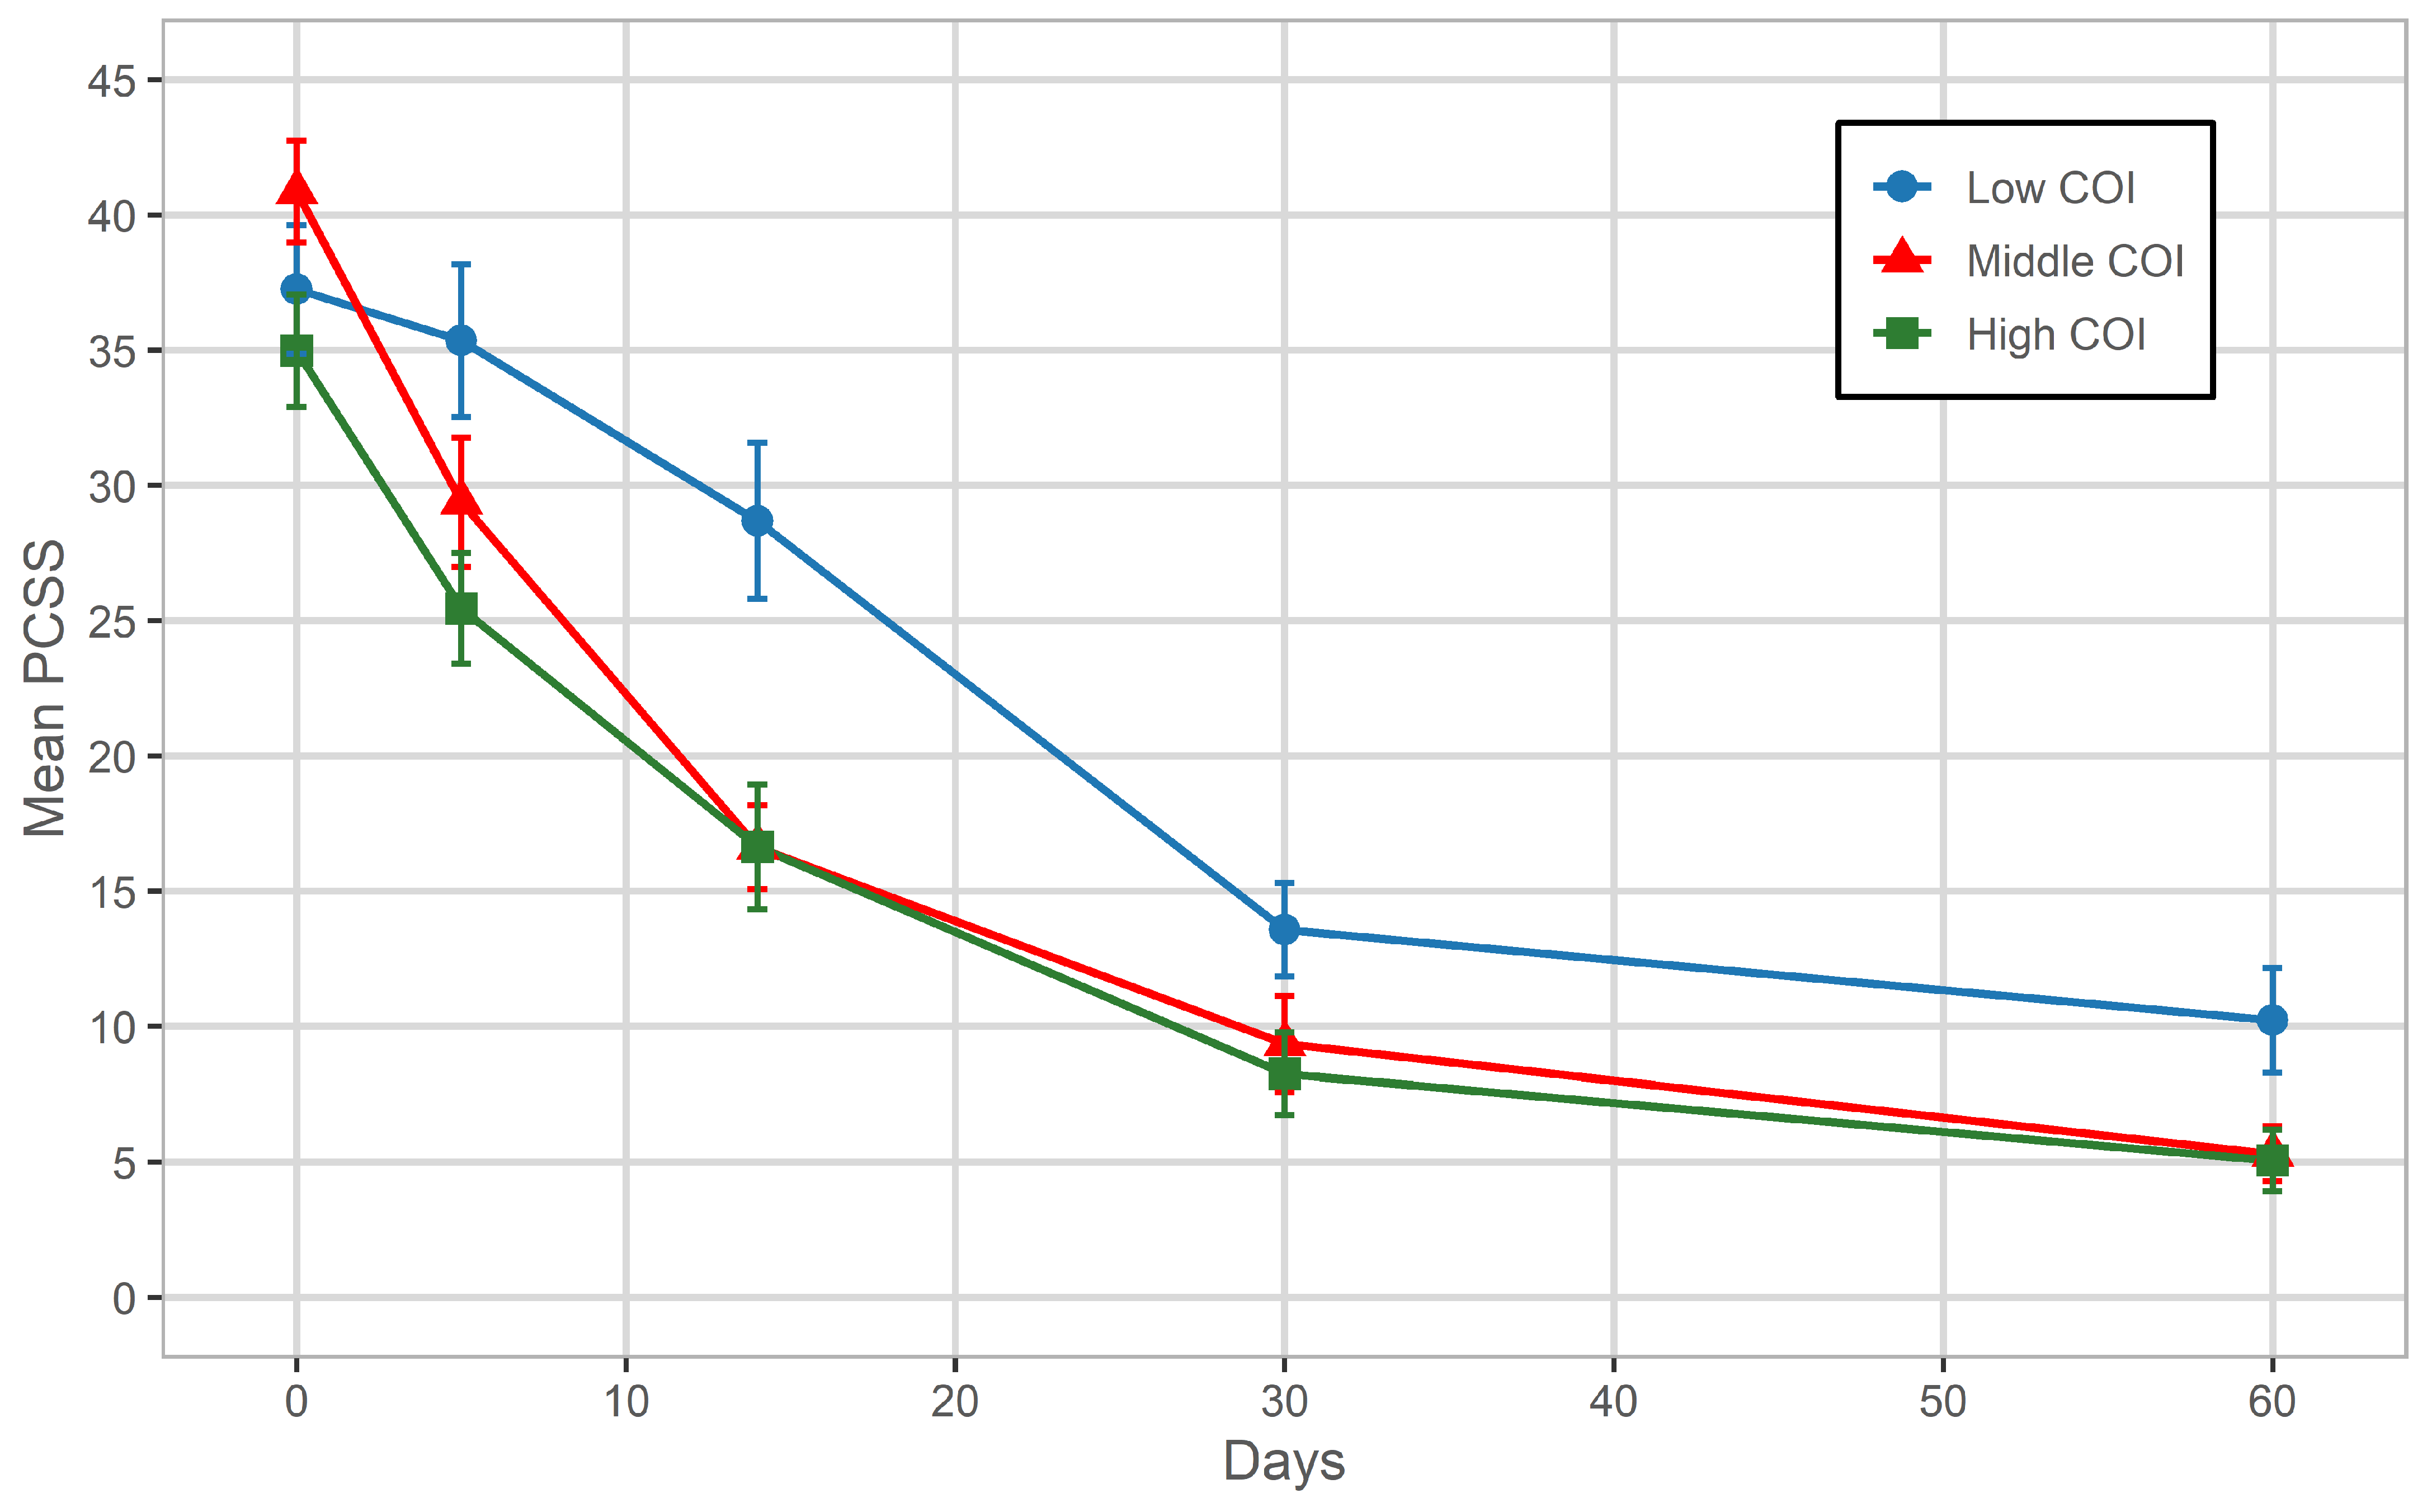
| Mean (SD) | 232 | 36.60 | 64 | 37.25 (25.68) | 39 | 40.87 (20.19) | 129 | 34.99 (22.43) | |||
| Time from injury to enrollment (days) | 3.42 | 0.03 | b | ||||||||
| Mean (SD) | 234 | 0.74 (0.91) | 66 | 0.52 (0.85) | 39 | 0.69 (0.80) | 129 | 0.87 (0.96) | |||
| Outcome | Time Point | Overall | Low COI | Middle COI | High COI | Statistic | p-Value | Statistically Significant Between COI Levels | ||||
|---|---|---|---|---|---|---|---|---|---|---|---|---|
| N | Mean/% | N | Mean/% | N | Mean/% | N | Mean/% | |||||
| PCSS score; mean (SD) | 5 days | 208 | 28.72 (23.86) | 53 | 35.36 (28.94) | 36 | 29.39 (24.13) | 118 | 25.46 (20.71) | 2.61 ψ | 0.08 | |
| 14 days | 155 | 19.37 (24.40) | 36 | 28.69 (28.86) | 24 | 16.63 (15.85) | 94 | 16.64 (23.78) | 3.46 | 0.03 | b | |
| 1 month | 191 | 9.80 (15.76) | 49 | 13.57 (17.20) | 33 | 9.36 (17.01) | 108 | 8.26 (14.58) | 1.94 | 0.15 | ||
| 2 months | 181 | 6.43 (13.12) | 47 | 10.23 (18.56) | 32 | 5.31 (9.50) | 101 | 5.07 (10.68) | 2.67 | 0.07 | ||
| Symptom resolution; n (%) yes | 1 month | 135 | 73.77 | 30 | 63.83 | 25 | 80.65 | 80 | 76.92 | ‡ | 0.35 | |
| 2 months ^ | 30 | 65.22 | 7 | 58.33 | 7 | 87.50 | 15 | 60.00 | ‡ | 0.64 | ||
| Return to school; n (%) full in person | 14 days | 132 | 90.41 | 26 | 81.25 | 23 | 95.83 | 82 | 92.13 | ‡ | 0.17 | |
| Return to sports; n (%) fully returned | 1 month | 92 | 49.73 | 17 | 36.17 | 13 | 39.39 | 62 | 59.62 | 10.94 | 0.03 | b,c |
| 2 months ^ | 28 | 56.00 | 5 | 41.67 | 6 | 75.00 | 16 | 55.17 | ‡ | 0.69 | ||
| Utilization | Window | Overall | Low COI | Middle COI | High COI | Statistic | p-Value | Statistically Significant Between COI Levels # | ||||
|---|---|---|---|---|---|---|---|---|---|---|---|---|
| N | Mean/% | N | Mean/% | N | Mean/% | N | Mean/% | |||||
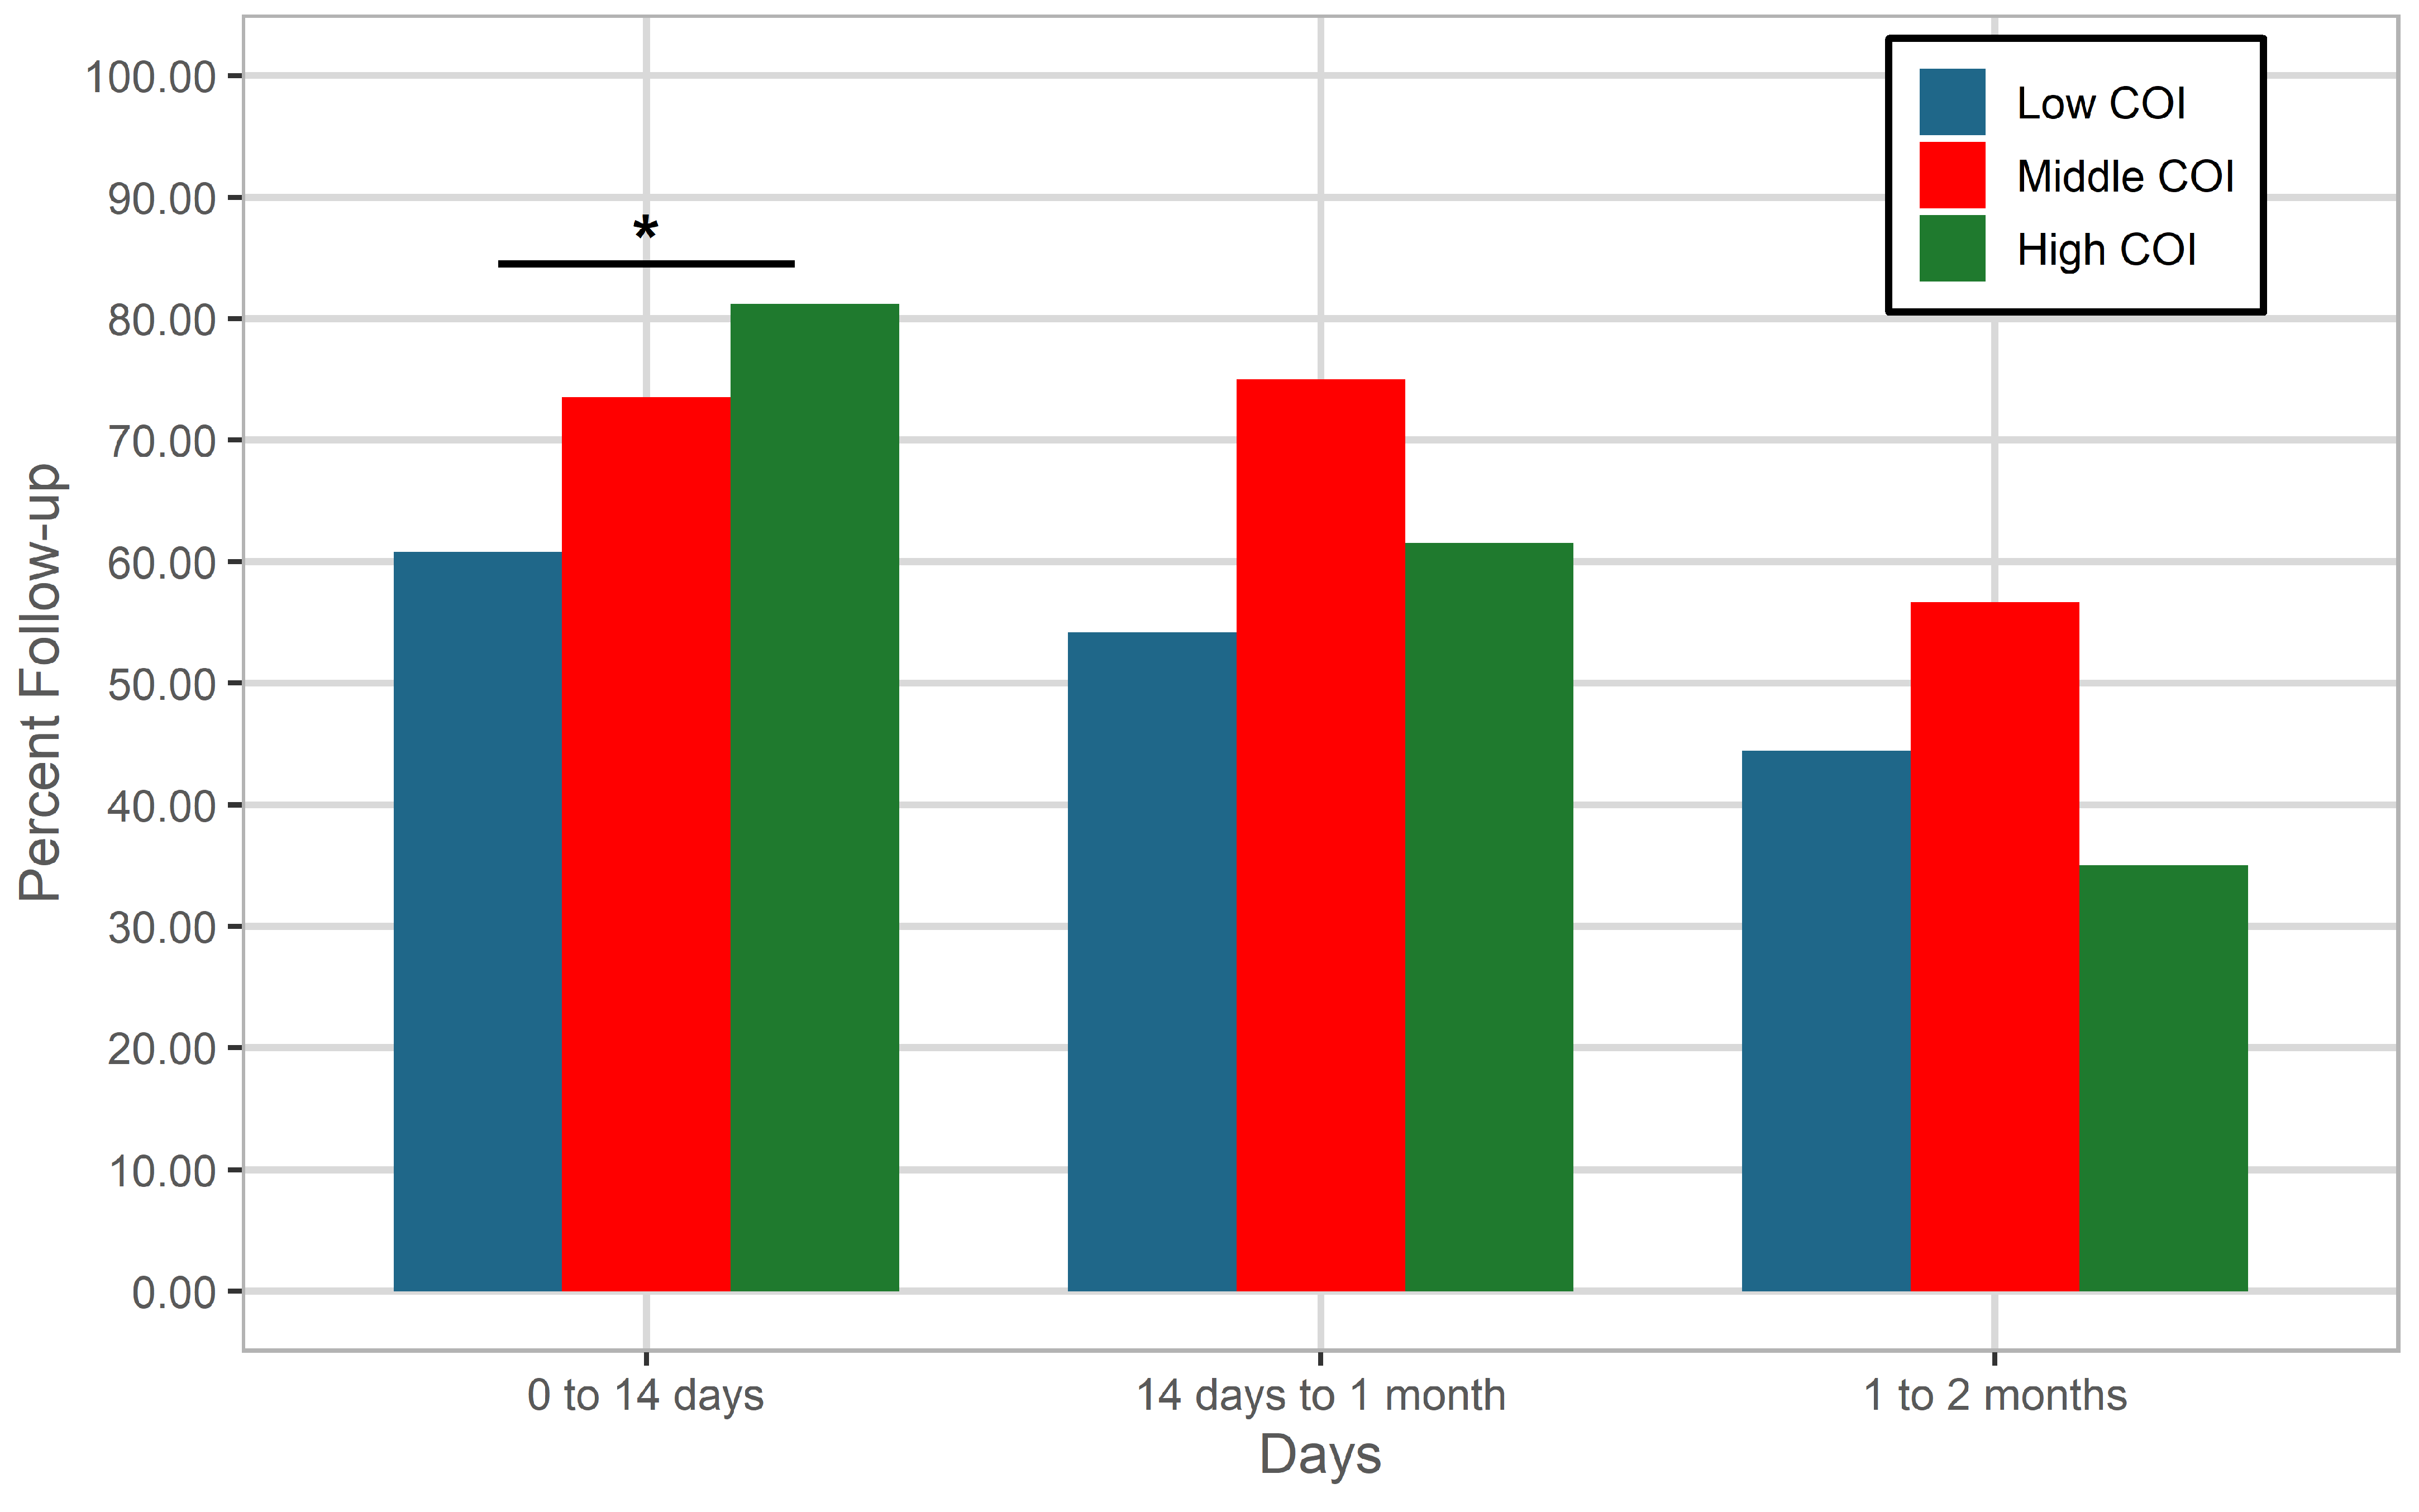
| Any follow-up visit 1; n (%) | 0 to 14 days | 152 | 74.88 | 31 | 60.78 | 25 | 73.53 | 95 | 81.20 | 7.87 | 0.0195 † | b |
| 14 days to 1 month | 115 | 62.16 | 26 | 54.17 | 24 | 75.00 | 64 | 61.54 | 3.55 | 0.17 | ||
| 1 to 2 months | 73 | 41.48 | 20 | 44.44 | 17 | 56.67 | 35 | 35.00 | 4.75 | 0.09 | ||
| Time to first follow-up; mean (SD) | 0 to 14 days | 144 | 6.76 (5.00) | 33 | 8.15 (4.18) | 24 | 6.71 (3.75) | 87 | 6.25 (5.51) | 1.74 | 0.18 | |
| Number of physician visits 2; mean (SD) | 0 to 14 days | 131 | 1.83 (1.29) | 28 | 1.57 (0.92) | 21 | 1.90 (1.45) | 82 | 1.90 (1.36) | 0.72 | 0.49 | |
| Number of allied health visits 3; mean (SD) | 0 to 14 days | 45 | 2.07 (2.51) | 7 | 1.00 (0.58) | 8 | 1.38 (0.52) | 29 | 2.45 (2.32) | 2.11 | 0.13 | |
| Number of CAM visits 4; mean (SD) | 0 to 14 days | 6 | 1.50 (1.22) | 2 | 0.50 (0.71) | 1 | 3.00 | 3 | 1.67 (1.15) | 2.05 | 0.27 | |
| Specialty seen; n (%) sports med | 0 to 14 days | 74 | 37.19 | 10 | 20.00 | 10 | 30.30 | 54 | 46.96 | 11.66 | 0.0029 † | b |
| 14 days to 1 month | 60 | 33.33 | 11 | 23.91 | 12 | 37.50 | 37 | 36.63 | 2.57 | 0.28 | ||
| 1 to 2 months | 30 | 17.44 | 6 | 13.95 | 7 | 23.33 | 17 | 17.35 | 1.08 | 0.58 | ||
| Specialty seen; n (%) PT | 0 to 14 days | 16 | 8.25 | 1 | 2.04 | 1 | 3.13 | 14 | 12.50 | ‡ | 0.04 | b |
| 14 days to 1 month | 21 | 11.93 | 5 | 10.87 | 2 | 6.67 | 13 | 13.13 | ‡ | 0.68 | ||
| 1 to 2 months | 22 | 12.79 | 5 | 11.36 | 3 | 10.34 | 14 | 14.29 | ‡ | 0.86 | ||
| Specialty seen; n (%) psychology | 0 to 14 days | 13 | 6.74 | 3 | 6.25 | 4 | 12.50 | 6 | 5.36 | ‡ | 0.40 | |
| 14 days to 1 month | 12 | 6.86 | 2 | 4.55 | 3 | 10.00 | 7 | 7.00 | ‡ | 0.59 | ||
| 1 to 2 months | 8 | 4.73 | 1 | 2.38 | 2 | 6.90 | 5 | 5.15 | ‡ | 0.61 | ||
| Cost and Burden | Window | Overall | Low COI | Middle COI | High COI | Statistic | p-Value | Statistically Significant Between COI Levels # | ||||
|---|---|---|---|---|---|---|---|---|---|---|---|---|
| N | Mean/% | N | Mean/% | N | Mean/% | N | Mean/% | |||||
| Total indirect costs; mean (SD) | 0 to 14 days | 190 | 283.98 (800.08) | 48 | 202.04 (521.57) | 34 | 235.97 (848.32) | 107 | 338.65 (888.33) | 0.56 | 0.57 | |
| Workdays missed mean (SD) | 0 to 14 days | 202 | 2.17 (3.65) | 50 | 3.38 (6.31) | 34 | 2.09 (2.21) | 117 | 1.70 (2.00) | 3.81 | 0.02 | b |
| Childcare days needed; mean (SD) | 0 to 14 days | 201 | 0.75 (2.00) | 50 | 1.56 (2.70) | 34 | 1.03 (2.83) | 116 | 0.32 (1.04) | 5.72 ψ | 0.01 | b |
| School days missed; mean (SD) | 1 month | 181 | 2.77 (3.76) | 45 | 3.11 (4.92) | 32 | 2.63 (3.14) | 103 | 2.67 (3.39) | 0.24 | 0.79 | |
| 2 months | 163 | 2.81 (6.56) | 40 | 4.23 (11.03) | 29 | 3.10 (3.85) | 93 | 2.10 (4.26) | 1.51 | 0.22 | ||
| Any “other burden”; n (%) yes | 0 to 14 days | 15 | 7.35 | 3 | 5.88 | 2 | 5.88 | 10 | 8.47 | ‡ | 0.93 | |
| Perception Item | Response Coding | Overall (N = 204) | Low COI | Middle COI | High COI | Statistic | p-Value | ||||
|---|---|---|---|---|---|---|---|---|---|---|---|
| N | % | N | % | N | % | N | % | ||||
| “My child quickly recovered” | Agree or strongly agree; n (%) | 122 | 59.80 | 25 | 49.02 | 23 | 69.70 | 73 | 61.34 | 3.92 | 0.14 |
| “Symptoms worse with activity” | Agree or strongly agree; n (%) | 80 | 39.22 | 20 | 39.22 | 13 | 38.24 | 46 | 38.98 | 0.01 | 0.996 |
| “My child has significant problems” | Agree or strongly agree; n (%) | 20 | 9.80 | 5 | 9.80 | 4 | 11.76 | 10 | 8.47 | ‡ | 0.80 |
| “Symptoms are constant” | Agree or strongly agree; n (%) | 45 | 22.39 | 13 | 26.00 | 9 | 26.47 | 23 | 19.83 | 1.13 | 0.57 |
| “Symptoms improved with time” | Agree or strongly agree; n (%) | 183 | 89.71 | 42 | 82.35 | 31 | 91.18 | 109 | 92.37 | 3.96 | 0.14 |
| “My child is exaggerating symptoms” | Agree or strongly agree; n (%) | 7 | 3.45 | 3 | 5.88 | 1 | 2.94 | 3 | 2.56 | ‡ | 0.50 |
| Outcome | Model Type | COI Contrast | Effect Estimate | 95% CI | p-Value | Covariates |
|---|---|---|---|---|---|---|
| PCSS trajectory | Mixed effects | Low vs. High | F = 2.53 | - | 0.11 | age, sex, baseline PCSS, insurance, site, prior concussion |
| Symptom resolution by 1 month | Logistic | Low vs. High | Odds ratio = 0.887 | 0.32, 0.24 | 0.80 | age, sex, insurance, site, prior concussion |
| Total indirect costs by 14 days | Two-part (logistic) | Low vs. High | Odds ratio = 0.687 | 0.35, 1.37 | 0.21 | age, sex, insurance, site, prior concussion |
| Middle vs. High | Odds ratio = 1.133 | 0.53, 2.43 | 0.41 | age, sex, insurance, site, prior concussion | ||
| Two-part (gamma regression with log link) | Low vs. High | Cost ratio = 0.9212 | 0.49, 1.73 | 0.80 | age, sex, insurance, site, prior concussion | |
| Middle vs. High | Cost ratio = 0.5820 | 0.32, 1.07 | 0.08 | age, sex, insurance, site, prior concussion | ||
| Overall adjusted incremental cost | Low vs. High | Predicted mean difference = $19.91 | −$12.20, $54.17 | 0.21 | age, sex, insurance, site, prior concussion | |
| Middle vs. High | Predicted mean difference = −$69.47 | −$104.75, −$35.17 | <0.001 | age, sex, insurance, site, prior concussion | ||
| Number of follow-up visits by 14 days | Poisson regression | Low vs. High | IRR = 0.7535 | 0.52, 1.11 | 0.13 | age, sex, insurance, site, prior concussion |
| Follow-up visits by 14 days | Logistic | Low vs. High | Odds ratio = 0.362 | 0.16, 0.82 | 0.02 | age, sex, insurance, site, prior concussion |
| Number of workdays missed by 14 days | Negative binomial | Low vs. High | IRR = 2.0109 | 1.28, 3.17 | 0.003 | age, sex, insurance, site, prior concussion |
| Number of childcare days needed by 14 days | Negative binomial | Low vs. High | IRR = 4.1685 | 1.65, 10.51 | 0.003 | age, sex, insurance, site, prior concussion |
Disclaimer/Publisher’s Note: The statements, opinions and data contained in all publications are solely those of the individual author(s) and contributor(s) and not of MDPI and/or the editor(s). MDPI and/or the editor(s) disclaim responsibility for any injury to people or property resulting from any ideas, methods, instructions or products referred to in the content. |
© 2026 by the authors. Licensee MDPI, Basel, Switzerland. This article is an open access article distributed under the terms and conditions of the Creative Commons Attribution (CC BY) license.
Share and Cite
Nakhla, K.; Waltzman, D.; Nelson, L.D.; Kontos, A.P.; Thomas, D.G. Disparities in Pediatric Concussion Outcomes and Family Burden by Neighborhood Opportunity. Behav. Sci. 2026, 16, 1287. https://doi.org/10.3390/bs16081287
Nakhla K, Waltzman D, Nelson LD, Kontos AP, Thomas DG. Disparities in Pediatric Concussion Outcomes and Family Burden by Neighborhood Opportunity. Behavioral Sciences. 2026; 16(8):1287. https://doi.org/10.3390/bs16081287
Chicago/Turabian StyleNakhla, Karen, Dana Waltzman, Lindsay D. Nelson, Anthony P. Kontos, and Danny G. Thomas. 2026. "Disparities in Pediatric Concussion Outcomes and Family Burden by Neighborhood Opportunity" Behavioral Sciences 16, no. 8: 1287. https://doi.org/10.3390/bs16081287
APA StyleNakhla, K., Waltzman, D., Nelson, L. D., Kontos, A. P., & Thomas, D. G. (2026). Disparities in Pediatric Concussion Outcomes and Family Burden by Neighborhood Opportunity. Behavioral Sciences, 16(8), 1287. https://doi.org/10.3390/bs16081287