Social Trust Profile Transitions and Health-Seeking Behavior: A Latent Transition Analysis of Three-Wave Panel Data from China
Abstract
1. Introduction
2. Materials and Methods
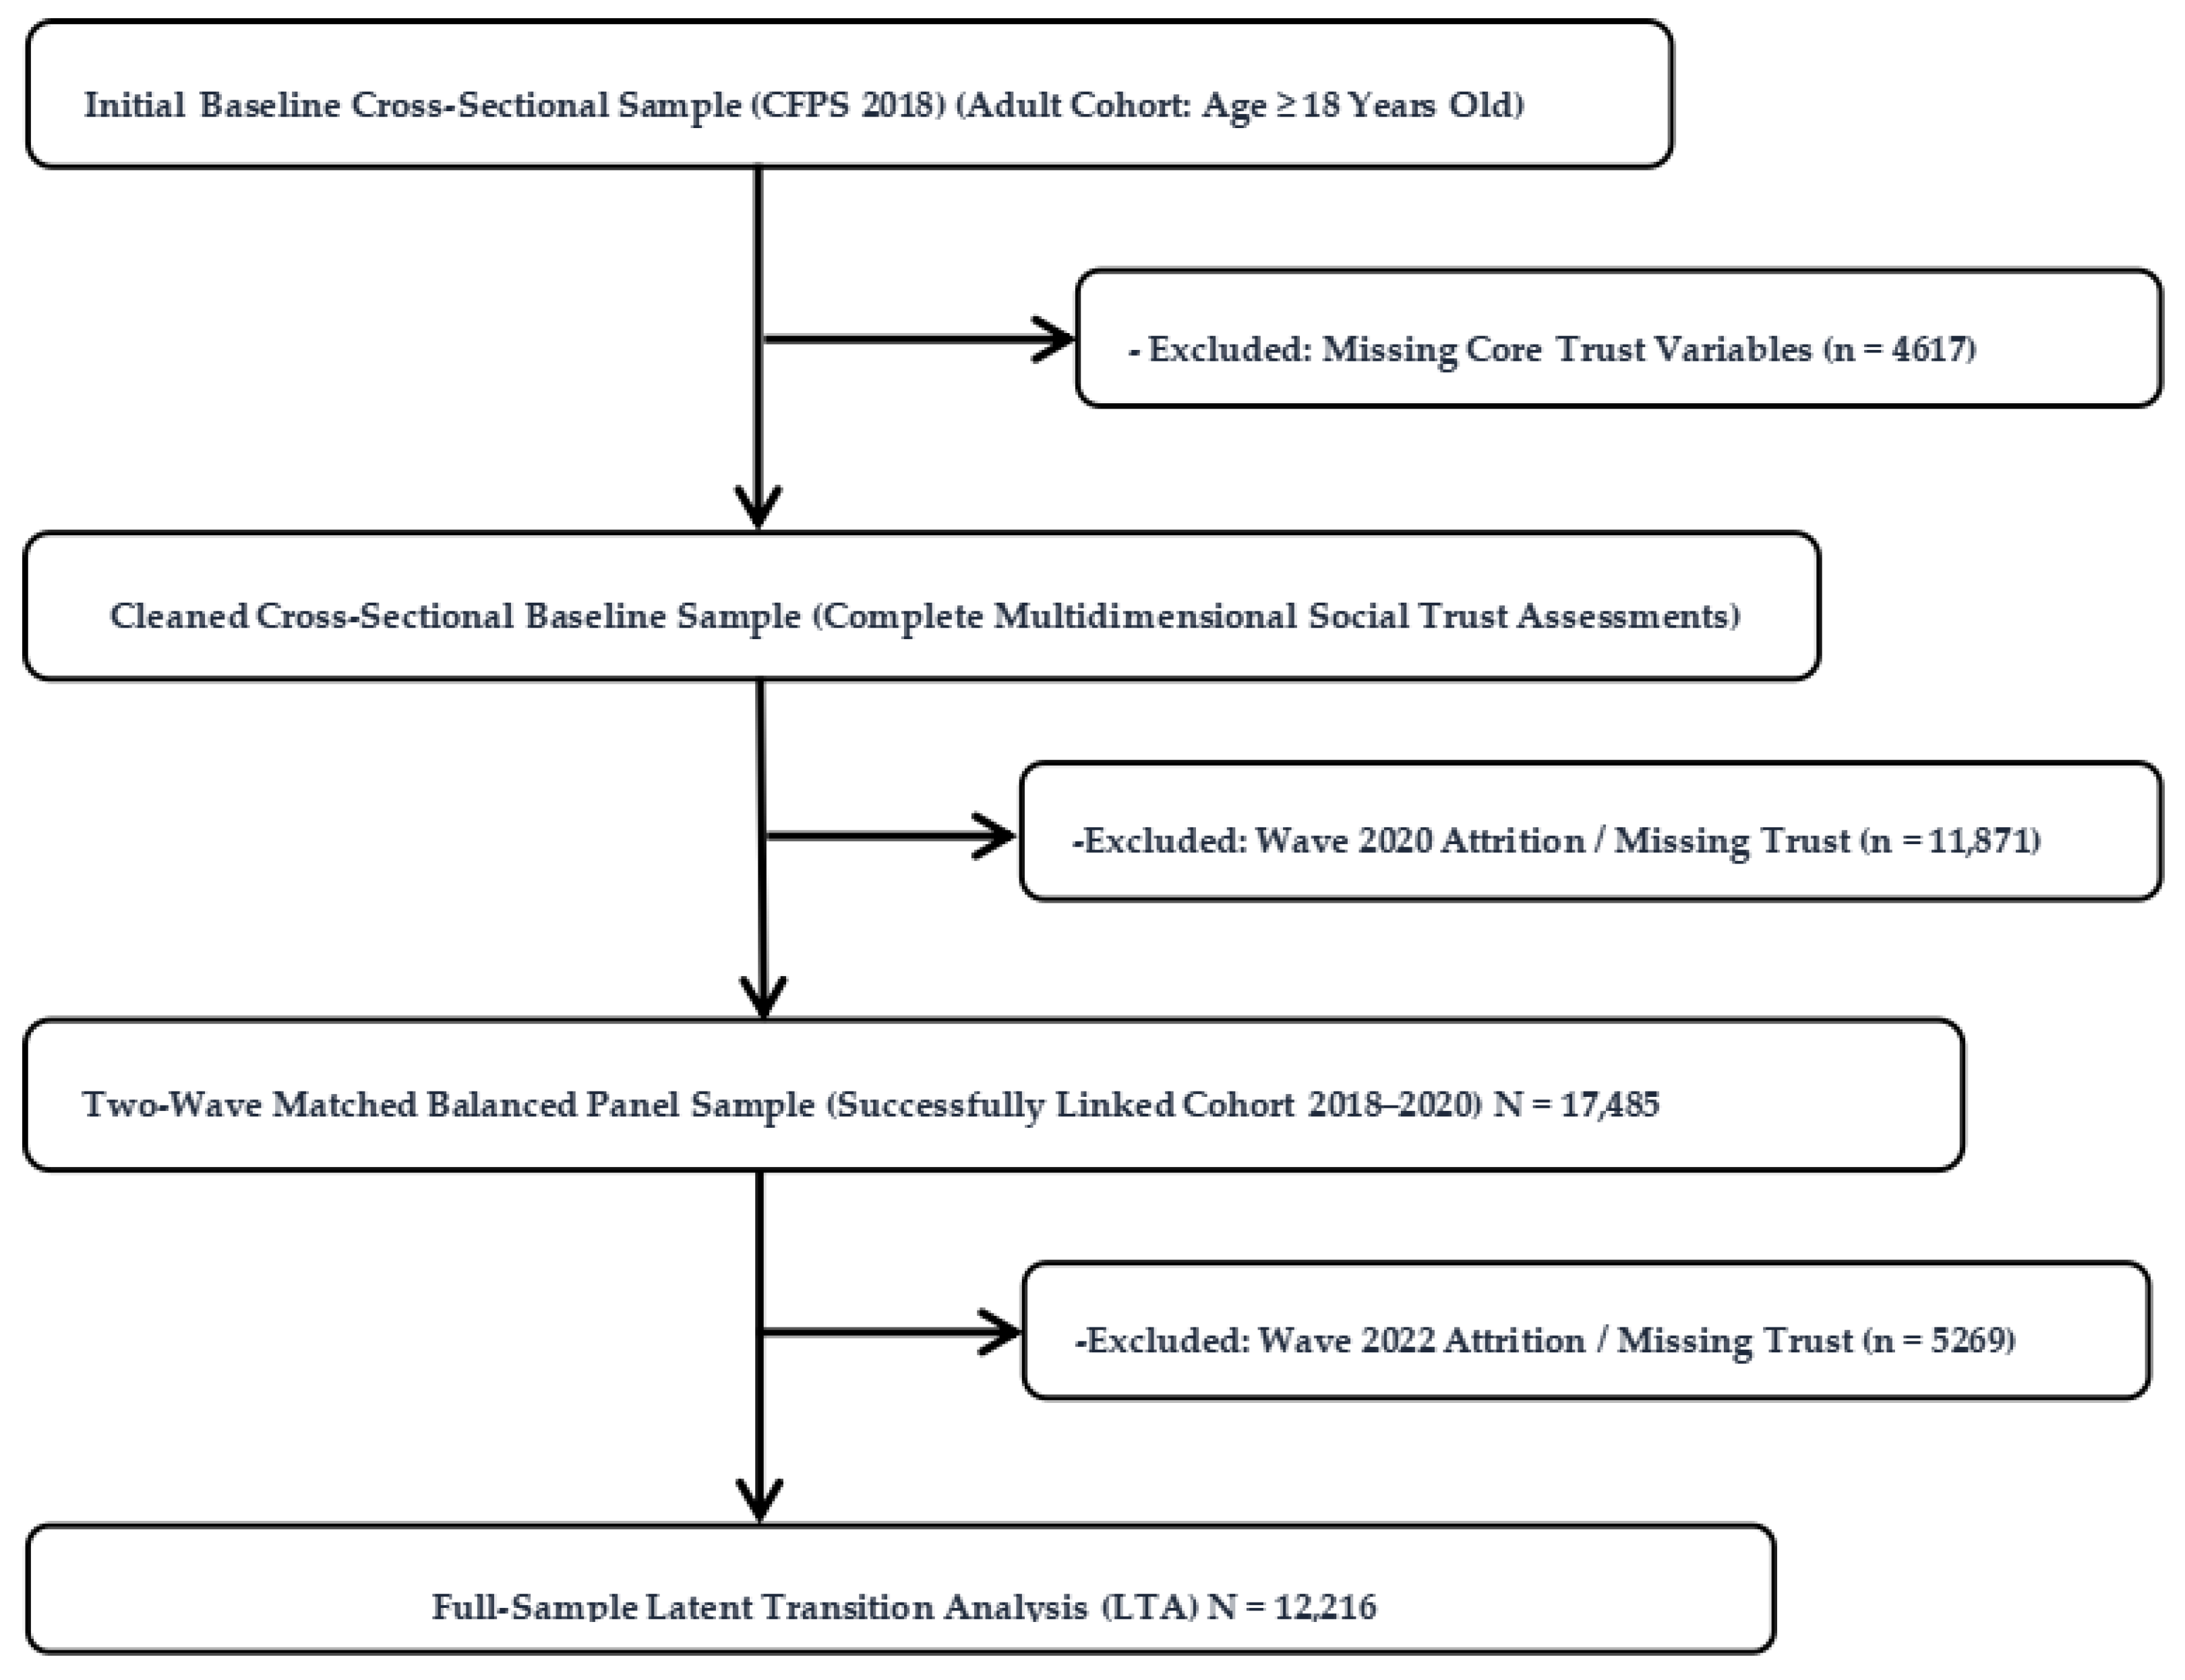
2.1. Data and Sample
2.2. Measures
2.2.1. Trust Indicators
2.2.2. Health-Seeking Outcomes
2.2.3. Covariates
2.3. Statistical Analysis
2.3.1. Latent Profile Analysis
2.3.2. Latent Transition Analysis and Measurement Invariance
2.3.3. Profile–Outcome Associations
3. Results
3.1. Sample Characteristics
3.2. Profile Enumeration and Model Selection
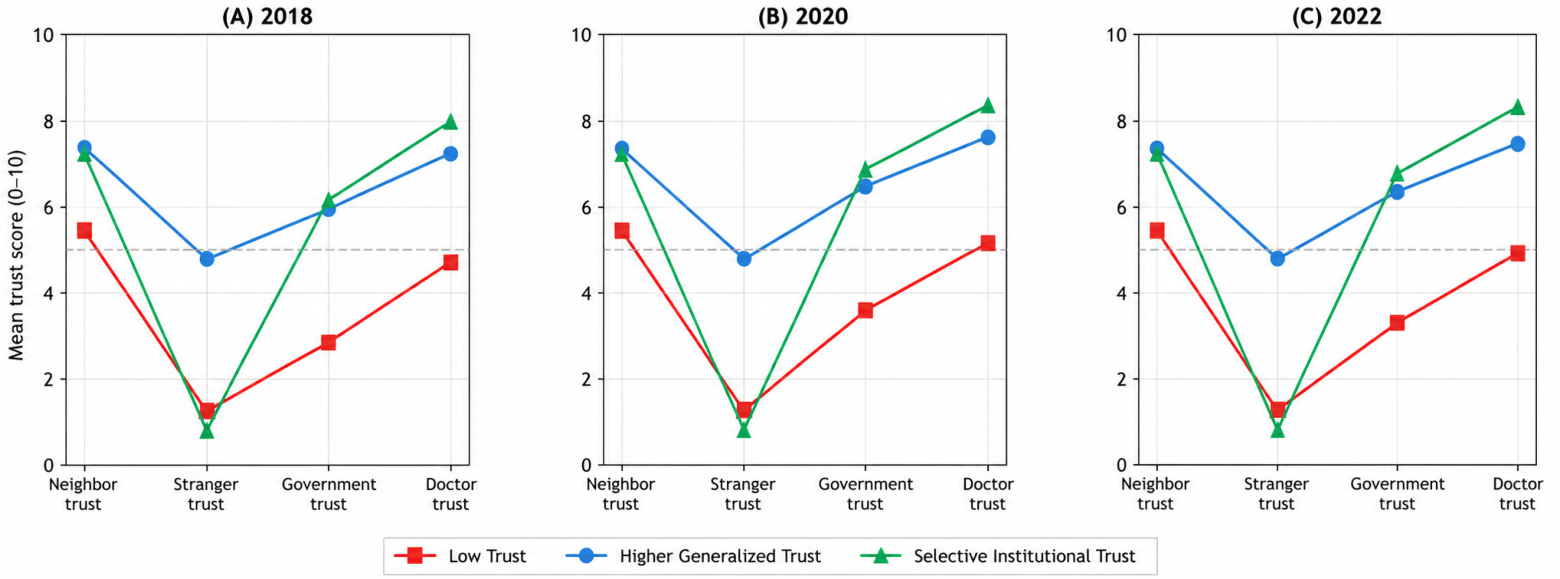
3.3. Profile Characteristics and Composition
3.4. Profile Transitions
3.5. Trust Profiles, Transition Pathways, and Health-Seeking Behavior
3.6. Sensitivity Analyses
4. Discussion
4.1. Main Findings
4.2. Trust Dynamics and Service Experience
4.3. Implications for Health Service Use
4.4. Strengths, Limitations, and Future Directions
5. Conclusions
Author Contributions
Funding
Institutional Review Board Statement
Informed Consent Statement
Data Availability Statement
Conflicts of Interest
Appendix A
Appendix A.1

| Indicator | Wave | Low Trust (Profile 1) | Higher Generalized Trust (Profile 2) | Selective Institutional Trust (Profile 3) |
|---|---|---|---|---|
| Neighbor trust | 2018 | 5.43 | 7.34 | 7.21 |
| 2020 | 5.43 | 7.34 | 7.21 | |
| 2022 | 5.43 | 7.34 | 7.21 | |
| Stranger trust | 2018 | 1.26 | 4.75 | 0.80 |
| 2020 | 1.26 | 4.75 | 0.80 | |
| 2022 | 1.26 | 4.75 | 0.80 | |
| Government trust | 2018 | 2.82 | 5.90 | 6.10 |
| 2020 | 3.61 | 6.47 | 6.85 | |
| 2022 | 3.29 | 6.33 | 6.74 | |
| Doctor trust | 2018 | 4.67 | 7.23 | 7.96 |
| 2020 | 5.15 | 7.64 | 8.35 | |
| 2022 | 4.89 | 7.46 | 8.28 |
Appendix A.2. Hierarchical Logistic Regression Results Under the Freely Estimated Measurement Model
| (1) | |||
|---|---|---|---|
| 2018 Profile → 2020 Saw Doctor | Model 1 OR [95% CI] | Model 2 OR [95% CI] | Model 3 OR [95% CI] |
| Reference: Low Trust | |||
| Selective Institutional | 1.39 [1.16, 1.67] | 1.35 [1.12, 1.62] | 1.34 [1.11, 1.61] |
| Higher Generalized | 1.06 [0.89, 1.26] | 1.08 [0.91, 1.30] | 1.13 [0.94, 1.36] |
| 2020 Profile → 2022 Saw Doctor | |||
| Reference: Low Trust | |||
| Selective Institutional | 1.46 [1.21, 1.75] | 1.38 [1.15, 1.67] | 1.37 [1.14, 1.66] |
| Higher Generalized | 1.08 [0.91, 1.28] | 1.07 [0.90, 1.28] | 1.09 [0.91, 1.30] |
| (2) | |||
| 2018 Profile → 2020 Primary Care | Model 1 OR [95% CI] | Model 2 OR [95% CI] | Model 3 OR [95% CI] |
| Reference: Low Trust | |||
| Selective Institutional | 1.01 [0.82, 1.25] | 0.95 [0.77, 1.18] | 0.95 [0.77, 1.18] |
| Higher Generalized | 0.91 [0.73, 1.13] | 0.91 [0.73, 1.14] | 0.97 [0.77, 1.21] |
| 2020 Profile → 2022 Primary Care | |||
| Reference: Low Trust | |||
| Selective Institutional | 1.12 [0.91, 1.38] | 1.03 [0.83, 1.28] | 1.03 [0.83, 1.28] |
| Higher Generalized | 0.86 [0.69, 1.06] | 0.85 [0.68, 1.06] | 0.85 [0.68, 1.07] |
Appendix A.3. Sensitivity Analysis: LTA Results Excluding Doctor-Trust Indicator
| (1) | |||||
|---|---|---|---|---|---|
| Model | Parameters | LL | AIC | BIC | Entropy |
| Main (4 indicators) | 50 | −313,709.365 | 627,518.730 | 627,889.255 | 0.792 |
| No doctor (3 indicators) | 50 | −235,269.558 | 470,639.115 | 471,009.640 | 0.799 |
| (2) | |||||
| Profile | 2018 | 2020 | 2022 | ||
| Low Trust (C1) | 35.8% | 34.4% | 33.3% | ||
| Higher Generalized (C2) | 37.2% | 39.0% | 43.2% | ||
| Selective Institutional (C3) | 26.9% | 26.6% | 23.5% | ||
| (3) | |||||
| Interval | From\To | Low Trust | Higher Generalized Trust | Selective Institutional Trust | |
| 2018 → 2020 | Low Trust | 0.82 | 0.139 | 0.041 | |
| Higher Generalized | 0.117 | 0.743 | 0.139 | ||
| Selective Institutional | 0.023 | 0.235 | 0.742 | ||
| 2020 → 2022 | Low Trust | 0.821 | 0.157 | 0.021 | |
| Higher Generalized | 0.106 | 0.795 | 0.099 | ||
| Selective Institutional | 0.035 | 0.256 | 0.709 | ||
| (4) | |||||
| Indicator | Wave | Low Trust | Higher Generalized Trust | Selective Institutional Trust | |
| Neighbor trust | 2018 | 5.40 | 7.40 | 7.59 | |
| 2020 | 5.36 | 7.29 | 7.68 | ||
| 2022 | 5.19 | 7.26 | 7.60 | ||
| Stranger trust | 2018 | 1.04 | 4.70 | 0.78 | |
| 2020 | 1.13 | 4.64 | 0.73 | ||
| 2022 | 1.18 | 4.84 | 0.71 | ||
| Government trust | 2018 | 3.20 | 5.80 | 6.31 | |
| 2020 | 3.92 | 6.37 | 6.98 | ||
| 2022 | 3.61 | 6.25 | 6.89 | ||
Appendix B. Additional Analyses Addressing Attrition, Classification Uncertainty, and Contextual Confounding
| Variable | Retained (n = 12,216) | Lost (n = 17,140) | SMD | p |
|---|---|---|---|---|
| Female, % | 50.5 | 50.4 | 0.00 | 0.764 |
| Age, years | 44.9 | 49.1 | −0.26 | <0.001 |
| Neighbor trust (0–10) | 6.74 | 6.73 | 0.00 | 0.988 |
| Stranger trust (0–10) | 2.33 | 2.25 | 0.04 | 0.002 |
| Government trust (0–10) | 5.01 | 5.16 | −0.06 | <0.001 |
| Doctor trust (0–10) | 6.67 | 6.75 | −0.03 | 0.007 |
| Two-week illness, % | 30.1 | 32.7 | −0.06 | <0.001 |
| Sought care if ill, % | 75.0 | 77.5 | −0.06 | 0.006 |
| Primary care if sought, % | 59.1 | 58.1 | 0.02 | 0.089 |
| Hospitalized past year, % | 11.3 | 14.5 | −0.10 | <0.001 |
| Total medical cost, yuan | 2690 | 4074 | −0.10 | <0.001 |
| Out-of-pocket cost, yuan | 2581 | 3595 | −0.10 | <0.001 |
| Satisfaction with access (1–5) | 3.62 | 3.64 | −0.02 | 0.086 |
| Satisfaction with quality (1–5) | 3.48 | 3.52 | −0.04 | <0.001 |
| Interval | Model | Selective OR [95% CI] | p | Higher Generalized OR [95% CI] | p |
|---|---|---|---|---|---|
| 2018 → 2020 | Unweighted | 1.30 [1.08, 1.56] | 0.006 | 1.11 [0.92, 1.33] | 0.275 |
| 2018 → 2020 | IPW | 1.29 [1.07, 1.55] | 0.007 | 1.10 [0.92, 1.33] | 0.294 |
| 2020 → 2022 | Unweighted | 1.35 [1.12, 1.63] | 0.002 | 1.08 [0.91, 1.29] | 0.383 |
| 2020 → 2022 | IPW | 1.33 [1.10, 1.60] | 0.003 | 1.09 [0.91, 1.30] | 0.365 |
| Wave | Low Trust | Selective Institutional | Higher Generalized |
|---|---|---|---|
| 2018 | 0.878 | 0.866 | 0.928 |
| 2020 | 0.895 | 0.890 | 0.919 |
| 2022 | 0.883 | 0.865 | 0.929 |
| Interval | Profile | Predicted Probability [95% CI] | Difference vs. Low |
|---|---|---|---|
| 2018 → 2020 | Low Trust | 62.0% [59.3, 64.7] | - |
| 2018 → 2020 | Selective Institutional | 67.6% [64.8, 70.4] | +5.6 pp |
| 2018 → 2020 | Higher Generalized | 64.2% [61.1, 66.9] | +2.2 pp |
| 2020 → 2022 | Low Trust | 61.6% [58.8, 64.2] | - |
| 2020 → 2022 | Selective Institutional | 68.0% [64.8, 70.8] | +6.5 pp |
| 2020 → 2022 | Higher Generalized | 63.3% [60.4, 66.0] | +1.7 pp |
| Method | Interval | Selective OR [95% CI] | p | Higher Generalized OR [95% CI] | p |
|---|---|---|---|---|---|
| Posterior-probability weighting | 2018 → 2020 | 1.31 [1.16, 1.47] | <0.001 | 1.16 [1.03, 1.30] | 0.018 |
| Posterior-probability weighting | 2020 → 2022 | 1.37 [1.21, 1.55] | <0.001 | 1.10 [0.98, 1.25] | 0.104 |
| Pseudo-class MI (200 draws) | 2018 → 2020 | 1.31 [1.06, 1.62] | 0.014 | 1.15 [0.94, 1.41] | 0.161 |
| Pseudo-class MI (200 draws) | 2020 → 2022 | 1.37 [1.11, 1.69] | 0.003 | 1.10 [0.91, 1.34] | 0.314 |
| Interval | Specification | Selective OR [95% CI] | p | Higher Generalized OR [95% CI] | p |
|---|---|---|---|---|---|
| 2018 → 2020 | M3 | 1.30 [1.08, 1.56] | 0.006 | 1.11 [0.92, 1.33] | 0.275 |
| 2018 → 2020 | M3 + province FE | 1.25 [1.04, 1.51] | 0.020 | 1.07 [0.89, 1.29] | 0.473 |
| 2020 → 2022 | M3 | 1.35 [1.12, 1.63] | 0.002 | 1.08 [0.91, 1.29] | 0.383 |
| 2020 → 2022 | M3 + province FE | 1.34 [1.11, 1.62] | 0.003 | 1.05 [0.88, 1.26] | 0.564 |
References
- Akafu, W., Daba, T., Tesfaye, E., Teshome, F., & Akafu, T. (2023). Determinants of trust in healthcare facilities among community-based health insurance members in the Manna district of Ethiopia. BMC Public Health, 23(1), 171. [Google Scholar] [CrossRef] [Scilit] [PubMed]
- Akaike, H. (1974). A new look at the statistical model identification. IEEE Transactions on Automatic Control, 19(6), 716–723. [Google Scholar] [CrossRef] [Scilit]
- Algan, Y., Cohen, D., Davoine, E., Foucault, M., & Stantcheva, S. (2021). Trust in scientists in times of pandemic: Panel evidence from 12 countries. Proceedings of the National Academy of Sciences of the United States of America, 118(40), e2108576118. [Google Scholar] [CrossRef] [Scilit] [PubMed]
- Andersen, R. M. (1995). Revisiting the behavioral model and access to medical care: Does it matter? Journal of Health and Social Behavior, 36(1), 1–10. [Google Scholar] [CrossRef] [Scilit]
- Arakelyan, S., Jailobaeva, K., Dakessian, A., Diaconu, K., Caperon, L., Strang, A., Bou-Orm, I. R., Witter, S., & Ager, A. (2021). The role of trust in health-seeking for non-communicable disease services in fragile contexts: A cross-country comparative study. Social Science & Medicine, 291, 114473. [Google Scholar] [CrossRef] [Scilit] [PubMed]
- Asparouhov, T., & Muthén, B. (2014). Auxiliary variables in mixture modeling: Three-step approaches using Mplus. Structural Equation Modeling, 21(3), 329–341. [Google Scholar] [CrossRef] [Scilit]
- Atherton, O. E., Willroth, E. C., Weston, S. J., Mroczek, D. K., & Graham, E. K. (2024). Longitudinal associations among the big five personality traits and healthcare utilization in the U.S. Social Science & Medicine, 340, 116494. [Google Scholar] [CrossRef] [Scilit] [PubMed]
- Bandeen-Roche, K., Miglioretti, D. L., Zeger, S. L., & Rathouz, P. J. (1997). Latent variable regression for multiple discrete outcomes. Journal of the American Statistical Association, 92(440), 1375–1386. [Google Scholar] [CrossRef]
- Calnan, M. W., & Sanford, E. (2004). Public trust in health care: The system or the doctor? BMJ Quality & Safety, 13(2), 92–97. [Google Scholar] [CrossRef] [PubMed]
- Connolly, R., Sanchez, O., Compeau, D., & Tacco, F. (2023). Understanding engagement in online health communities: A trust-based perspective. Journal of the Association for Information Systems, 24(2), 345–378. [Google Scholar] [CrossRef] [Scilit]
- Gao, Q., Mak, H. W., & Fancourt, D. (2024). Longitudinal associations between loneliness, social isolation, and healthcare utilisation trajectories: A latent growth curve analysis. Social Psychiatry and Psychiatric Epidemiology, 59(10), 1839–1848. [Google Scholar] [CrossRef] [Scilit] [PubMed]
- Gilson, L. (2003). Trust and the development of health care as a social institution. Social Science & Medicine, 56(7), 1453–1468. [Google Scholar] [CrossRef] [Scilit] [PubMed]
- Gopichandran, V., & Sakthivel, K. (2021). Doctor-patient communication and trust in doctors during COVID 19 times—A cross sectional study in Chennai, India. PLoS ONE, 16(6), e0253497. [Google Scholar] [CrossRef] [Scilit] [PubMed]
- Gustavson, K., von Soest, T., Karevold, E., & Røysamb, E. (2012). Attrition and generalizability in longitudinal studies: Findings from a 15-year population-based study and a Monte Carlo simulation study. BMC Public Health, 12(1), 918. [Google Scholar] [CrossRef] [Scilit] [PubMed]
- HaGani, N., Surkalim, D. L., Clare, P. J., Merom, D., Smith, B. J., & Ding, D. (2023). Health care utilization following interventions to improve social well-being: A systematic review and meta-analysis. JAMA Network Open, 6(6), e2321019. [Google Scholar] [CrossRef] [Scilit] [PubMed]
- Hall, M. A., Dugan, E., Zheng, B., & Mishra, A. K. (2001). Trust in physicians and medical institutions: What is it, can it be measured, and does it matter? The Milbank Quarterly, 79(4), 613–639. [Google Scholar] [CrossRef] [Scilit] [PubMed]
- Harpham, T., Grant, E., & Thomas, E. (2002). Measuring social capital within health surveys: Key issues. Health Policy and Planning, 17(1), 106–111. [Google Scholar] [CrossRef] [Scilit] [PubMed]
- Krastev, S., Krajden, O., Vang, Z. M., Juárez, F. P.-G., Solomonova, E., Goldenberg, M. J., Weinstock, D., Smith, M. J., Dervis, E., Pilat, D., & Gold, I. (2023). Institutional trust is a distinct construct related to vaccine hesitancy and refusal. BMC Public Health, 23(1), 2481. [Google Scholar] [CrossRef] [Scilit] [PubMed]
- Kruk, M. E., Gage, A. D., Arsenault, C., Jordan, K., Leslie, H. H., Roder-DeWan, S., Adeyi, O., Barker, P., Daelmans, B., Doubova, S. V., English, M., García-Elorrio, E., Guanais, F., Gureje, O., Hirschhorn, L. R., Jiang, L., Kelley, E., Lemango, E. T., Liljestrand, J., … Pate, M. (2018). High-quality health systems in the sustainable development goals era: Time for a revolution. The Lancet Global Health, 6(11), e1196–e1252. [Google Scholar] [CrossRef] [Scilit] [PubMed]
- Lau, L. L., Hung, N., Dodd, W., Lim, K., Ferma, J. D., & Cole, D. C. (2020). Social trust and health seeking behaviours: A longitudinal study of a community-based active tuberculosis case finding program in the Philippines. SSM-Population Health, 12, 100664. [Google Scholar] [CrossRef] [Scilit] [PubMed]
- Meyer, S. B., Brown, P., Calnan, M., Ward, P. R., Little, J., Betini, G. S., Perlman, C. M., Burns, K. E., & Filice, E. (2024). Development and validation of the trust in multidimensional healthcare systems scale (TIMHSS). International Journal for Equity in Health, 23(1), 94. [Google Scholar] [CrossRef] [Scilit] [PubMed]
- Muthén, B., & Muthén, L. K. (2000). Integrating person-centered and variable-centered analyses: Growth mixture modeling with latent trajectory classes. Alcoholism: Clinical and Experimental Research, 24(6), 882–891. [Google Scholar] [CrossRef]
- Nylund-Gibson, K., Garber, A. C., Carter, D. B., Chan, M., Arch, D. A., Simon, O., Whaling, K., Tartt, E., & Lawrie, S. I. (2023). Ten frequently asked questions about latent transition analysis. Psychological Methods, 28(2), 284. [Google Scholar] [CrossRef] [Scilit] [PubMed]
- Ozawa, S., & Sripad, P. (2013). How do you measure trust in the health system? A systematic review of the literature. Social Science & Medicine, 91, 10–14. [Google Scholar] [CrossRef] [Scilit] [PubMed]
- Paquin, V., Miconi, D., Aversa, S., Johnson-Lafleur, J., Cóté, S., Geoffroy, M., & Gülöksüz, S. (2025). Social and mental health pathways to institutional trust: A cohort study. Social Science & Medicine, 379, 118199. [Google Scholar] [CrossRef] [Scilit] [PubMed]
- Petersen, K. J., Humphrey, N., & Qualter, P. (2022). Dual-factor mental health from childhood to early adolescence and associated factors: A latent transition analysis. Journal of Youth and Adolescence, 51(6), 1118–1133. [Google Scholar] [CrossRef] [Scilit] [PubMed]
- Putnam, R. D. (2000). Bowling alone: The collapse and revival of American community. Simon and Schuster. [Google Scholar] [CrossRef] [Scilit]
- Seaman, S. R., & White, I. R. (2013). Review of inverse probability weighting for dealing with missing data. Statistical Methods in Medical Research, 22(3), 278–295. [Google Scholar] [CrossRef] [Scilit] [PubMed]
- Shen, S., & Zhang, B. (2016). Hierarchical medical system, primary diagnosis in grassroots, and construction of primary health care institutions. Academia Bimestrial, (02), 48–57. [Google Scholar] [CrossRef]
- Skirbekk, H., Magelssen, M., & Conradsen, S. (2023). Trust in healthcare before and during the COVID-19 pandemic. BMC Public Health, 23(1), 863. [Google Scholar] [CrossRef] [Scilit] [PubMed]
- Sønderskov, K. M., & Dinesen, P. T. (2016). Trusting the state, trusting each other? The effect of institutional trust on social trust. Political Behavior, 38(1), 179–202. [Google Scholar] [CrossRef] [Scilit]
- Szreter, S., & Woolcock, M. (2004). Health by association? Social capital, social theory, and the political economy of public health. International Journal of Epidemiology, 33(4), 650–667. [Google Scholar] [CrossRef] [Scilit] [PubMed]
- Vermunt, J. K. (2010). Latent class modeling with covariates: Two improved three-step approaches. Political Analysis, 18(4), 450–469. [Google Scholar] [CrossRef] [Scilit]
- Wang, C.-P., Brown, C. H., & Bandeen-Roche, K. (2005). Residual diagnostics for growth mixture models. Journal of the American Statistical Association, 100(471), 1054–1076. [Google Scholar] [CrossRef] [Scilit]
- Wells, K. E., McKay, M. T., Morgan, G. B., & Worrell, F. C. (2018). Time attitudes predict changes in adolescent self-efficacy: A 24-month latent transition mover-stayer analysis. Journal of Adolescence, 62, 27–37. [Google Scholar] [CrossRef] [Scilit] [PubMed]
- Xie, Y., Hu, J., & Zhang, C. (2014). The China family panel studies: Design and practice. Chinese Journal of Sociology, 34(2), 1–32. [Google Scholar] [CrossRef]
- Ye, T., Xiao, W., Li, Y., Xiao, Y., Fang, H., Chen, W., & Lu, S. (2024). Trust in family doctor-patient relations: An embeddedness theory perspective. BMC Public Health, 24(1), 3278. [Google Scholar] [CrossRef] [Scilit] [PubMed]
- Yip, W., Fu, H., Chen, A. T., Zhai, T., Jian, W., Xu, R., Pan, J., Hu, M., Zhou, Z., Chen, Q., Mao, W., Sun, Q., & Chen, W. (2019). 10 Years of health-care reform in China: Progress and gaps in universal health coverage. Lancet, 394(10204), 1192–1204. [Google Scholar] [CrossRef] [Scilit] [PubMed]
- You, Y., Ma, D., & Chen, C. (2024). Public trust during a public health crisis: Evaluating the immediate effects of the pandemic on institutional trust. Journal of Chinese Political Science, 29(1), 1–29. [Google Scholar] [CrossRef] [Scilit]
- Zhou, Z., Zhao, Y., Shen, C., Lai, S., Nawaz, R., & Gao, J. (2021). Evaluating the effect of hierarchical medical system on health seeking behavior: A difference-in-differences analysis in China. Social Science & Medicine, 268, 113372. [Google Scholar] [CrossRef] [Scilit] [PubMed]


| Variable | N (%) or M (SD) |
|---|---|
| Demographics | |
| Female | 6174 (50.5%) |
| Male | 6042 (49.5%) |
| Age (years) | 44.9 (14.9) |
| Residence and health | |
| Urban residence | 6329 (52.3%) |
| Self-rated health (1–5) | 3.03 (1.18) |
| Chronic disease | 1896 (15.5%) |
| Socioeconomic and enabling | |
| Education (years) | 8.55 (4.76) |
| Married | 10,081 (82.5%) |
| Health insurance | 11,263 (92.2%) |
| Health service experience | |
| Satisfaction with access (1–5) | 3.62 (0.81) |
| Satisfaction with quality (1–5) | 3.48 (0.89) |
| Hospitalized past year | 1375 (11.3%) |
| Illness and care-seeking | |
| Two-week illness 2018 | 3675 (30.1%) |
| Two-week illness 2020 | 3215 (26.4%) |
| Sought care 2020 (among ill) | 2064 (64.2%) |
| Two-week illness 2022 | 3316 (27.2%) |
| Sought care 2022 (among ill) | 2121 (64.0%) |
| Indicator | 2018 M (SD) | 2020 M (SD) | 2022 M (SD) |
|---|---|---|---|
| Neighbor trust | 6.74 (2.03) | 6.73 (2.05) | 6.65 (2.11) |
| Stranger trust | 2.33 (2.19) | 2.39 (2.22) | 2.65 (2.30) |
| Government trust | 5.01 (2.61) | 5.69 (2.51) | 5.52 (2.57) |
| Doctor trust | 6.67 (2.35) | 7.08 (2.25) | 6.91 (2.31) |
| (A) | |||||||||
|---|---|---|---|---|---|---|---|---|---|
| Time | Profile | LL | AIC | BIC | aBIC | Entropy | LMR | BLRT | Class Ratio (%) |
| T1 | 2 | −107,245 | 214,516 | 214,613 | 214,571 | 0.627 | <0.001 | <0.001 | 36.0/64.0 |
| 3 | −105,992 | 212,020 | 212,154 | 212,097 | 0.719 | <0.001 | <0.001 | 30.8/33.0/36.2 | |
| 4 | −105,399 | 210,843 | 211,014 | 210,941 | 0.714 | <0.001 | <0.001 | 26.2/28.6/13.3/31.9 | |
| 5 | −103,796 | 207,648 | 207,855 | 207,766 | 0.894 | <0.001 | <0.001 | 19.2/24.7/26.5/2.6/27.1 | |
| T2 | 2 | −106,483 | 212,993 | 213,089 | 213,048 | 0.649 | <0.001 | <0.001 | 33.9/66.1 |
| 3 | −105,384 | 210,804 | 210,937 | 210,880 | 0.772 | <0.001 | <0.001 | 30.0/29.5/40.5 | |
| 4 | −104,766 | 209,578 | 209,749 | 209,676 | 0.743 | <0.001 | <0.001 | 39.0/8.2/16.9/35.9 | |
| 5 | −102,930 | 205,916 | 206,123 | 206,034 | 0.904 | <0.001 | <0.001 | 24.3/18.1/27.8/2.8/27.1 | |
| T3 | 2 | −107,760 | 215,547 | 215,643 | 215,602 | 0.658 | <0.001 | <0.001 | 31.7/68.3 |
| 3 | −106,673 | 213,382 | 213,515 | 213,458 | 0.740 | <0.001 | <0.001 | 29.2/27.7/43.2 | |
| 4 | −106,009 | 212,064 | 212,234 | 212,161 | 0.813 | <0.001 | <0.001 | 26.6/44.5/26.4/2.4 | |
| 5 | −104,092 | 208,239 | 208,447 | 208,358 | 0.915 | <0.001 | <0.001 | 16.0/32.6/26.1/21.8/3.5 | |
| (B) | |||||||||
| Model | Parameters | AIC | BIC | aBIC | Entropy | ||||
| 2-profile LTA | 41 | 636,687 | 636,990 | 636,860 | 0.763 | ||||
| 3-profile LTA | 62 | 627,418 | 627,878 | 627,681 | 0.793 | ||||
| (C) | |||||||||
| Specification | Parameters | AIC | BIC | DBIC | Entropy | ||||
| Free estimation | 62 | 627,418 | 627,878 | (ref) | 0.793 | ||||
| Partial invariance | 50 | 627,519 | 627,889 | +11 | 0.792 | ||||
| Full invariance | 38 | 628,099 | 628,380 | +502 | 0.790 | ||||
| (D) | |||||||||
| Profile | T1 N (%) | T2 N (%) | T3 N (%) | ||||||
| Low Trust | 3788 (31.0%) | 3837 (31.4%) | 3700 (30.3%) | ||||||
| Higher Generalized Trust | 4343 (35.6%) | 4596 (37.6%) | 5179 (42.4%) | ||||||
| Selective Institutional Trust | 4085 (33.4%) | 3783 (31.0%) | 3337 (27.3%) | ||||||
| T1 → T2 | Low Trust | Higher Generalized Trust | Selective Institutional Trust |
|---|---|---|---|
| Low Trust | 0.777 | 0.126 | 0.097 |
| Higher Generalized | 0.119 | 0.733 | 0.148 |
| Selective Institutional | 0.093 | 0.207 | 0.701 |
| T2 → T3 | |||
| Low Trust | 0.769 | 0.165 | 0.066 |
| Higher Generalized | 0.087 | 0.807 | 0.106 |
| Selective Institutional | 0.091 | 0.231 | 0.677 |
| (A) | |||||||
|---|---|---|---|---|---|---|---|
| Interval | Model | Selective Institutional OR [95% CI] | p | Higher Generalized OR [95% CI] | p | ||
| T1–T2 | M1 | 1.35 [1.13, 1.62] | 0.001 | 1.04 [0.87, 1.25] | 0.648 | ||
| M2 | 1.30 [1.08, 1.57] | 0.005 | 1.06 [0.89, 1.27] | 0.516 | |||
| M3 | 1.30 [1.08, 1.56] | 0.006 | 1.11 [0.92, 1.33] | 0.275 | |||
| T2–T3 | M1 | 1.43 [1.19, 1.71] | <0.001 | 1.07 [0.90, 1.27] | 0.443 | ||
| M2 | 1.36 [1.13, 1.63] | 0.001 | 1.07 [0.89, 1.27] | 0.483 | |||
| M3 | 1.35 [1.12, 1.63] | 0.002 | 1.08 [0.91, 1.29] | 0.383 | |||
| (B) | |||||||
| Interval | Model | Selective Institutional OR [95% CI] | p | Higher Generalized OR [95% CI] | p | ||
| T1–T2 | M3 | 0.97 [0.78, 1.20] | 0.782 | 0.98 [0.78, 1.22] | 0.829 | ||
| T2–T3 | M3 | 1.00 [0.80, 1.24] | 0.971 | 0.85 [0.68, 1.06] | 0.144 | ||
| (C) | |||||||
| Pathway | T1–T2 N | OR [95% CI] | p | T2–T3 N | OR [95% CI] | p | |
| Stable Low Trust (ref) | 967 | - | - | 949 | - | - | |
| Stable Selective Institutional | 790 | 1.47 [1.19, 1.80] | <0.001 | 731 | 1.48 [1.19, 1.83] | <0.001 | |
| Stable Higher Generalized | 709 | 1.03 [0.84, 1.26] | 0.754 | 871 | 1.07 [0.89, 1.30] | 0.469 | |
| Selective Institutional to Low | 85 | 1.86 [1.10, 3.14] | 0.020 | 117 | 0.98 [0.66, 1.47] | 0.924 | |
| Low to Selective Institutional | 94 | 0.96 [0.62, 1.49] | 0.856 | 69 | 1.26 [0.74, 2.16] | 0.397 | |
| (D) | |||||||
| Transition | Predictor | OR [95% CI] | p | ||||
| Low to Selective Institutional (N = 3788; 8.4%) | |||||||
| Satisfaction with access | 1.41 [1.19, 1.68] | <0.001 | |||||
| Hospitalized past year | 0.60 [0.39, 0.92] | 0.020 | |||||
| Age | 1.01 [1.00, 1.02] | 0.006 | |||||
| Female (vs. male) | 0.75 [0.59, 0.95] | 0.017 | |||||
| Higher Generalized to Low (N = 4343; 12.0%) | |||||||
| Satisfaction with access | 0.81 [0.71, 0.94] | 0.004 | |||||
| Age | 1.01 [1.00, 1.02] | <0.001 | |||||
| Female (vs. male) | 0.83 [0.69, 1.00] | 0.049 | |||||
| Selective Institutional to Low (N = 4085; 7.5%) | |||||||
| No predictor significant | - | - | |||||
Disclaimer/Publisher’s Note: The statements, opinions and data contained in all publications are solely those of the individual author(s) and contributor(s) and not of MDPI and/or the editor(s). MDPI and/or the editor(s) disclaim responsibility for any injury to people or property resulting from any ideas, methods, instructions or products referred to in the content. |
© 2026 by the authors. Licensee MDPI, Basel, Switzerland. This article is an open access article distributed under the terms and conditions of the Creative Commons Attribution (CC BY) license.
Share and Cite
Wu, Y.; Xu, S.; Li, L. Social Trust Profile Transitions and Health-Seeking Behavior: A Latent Transition Analysis of Three-Wave Panel Data from China. Behav. Sci. 2026, 16, 1189. https://doi.org/10.3390/bs16071189
Wu Y, Xu S, Li L. Social Trust Profile Transitions and Health-Seeking Behavior: A Latent Transition Analysis of Three-Wave Panel Data from China. Behavioral Sciences. 2026; 16(7):1189. https://doi.org/10.3390/bs16071189
Chicago/Turabian StyleWu, Yuhan, Shihan Xu, and Lu Li. 2026. "Social Trust Profile Transitions and Health-Seeking Behavior: A Latent Transition Analysis of Three-Wave Panel Data from China" Behavioral Sciences 16, no. 7: 1189. https://doi.org/10.3390/bs16071189
APA StyleWu, Y., Xu, S., & Li, L. (2026). Social Trust Profile Transitions and Health-Seeking Behavior: A Latent Transition Analysis of Three-Wave Panel Data from China. Behavioral Sciences, 16(7), 1189. https://doi.org/10.3390/bs16071189